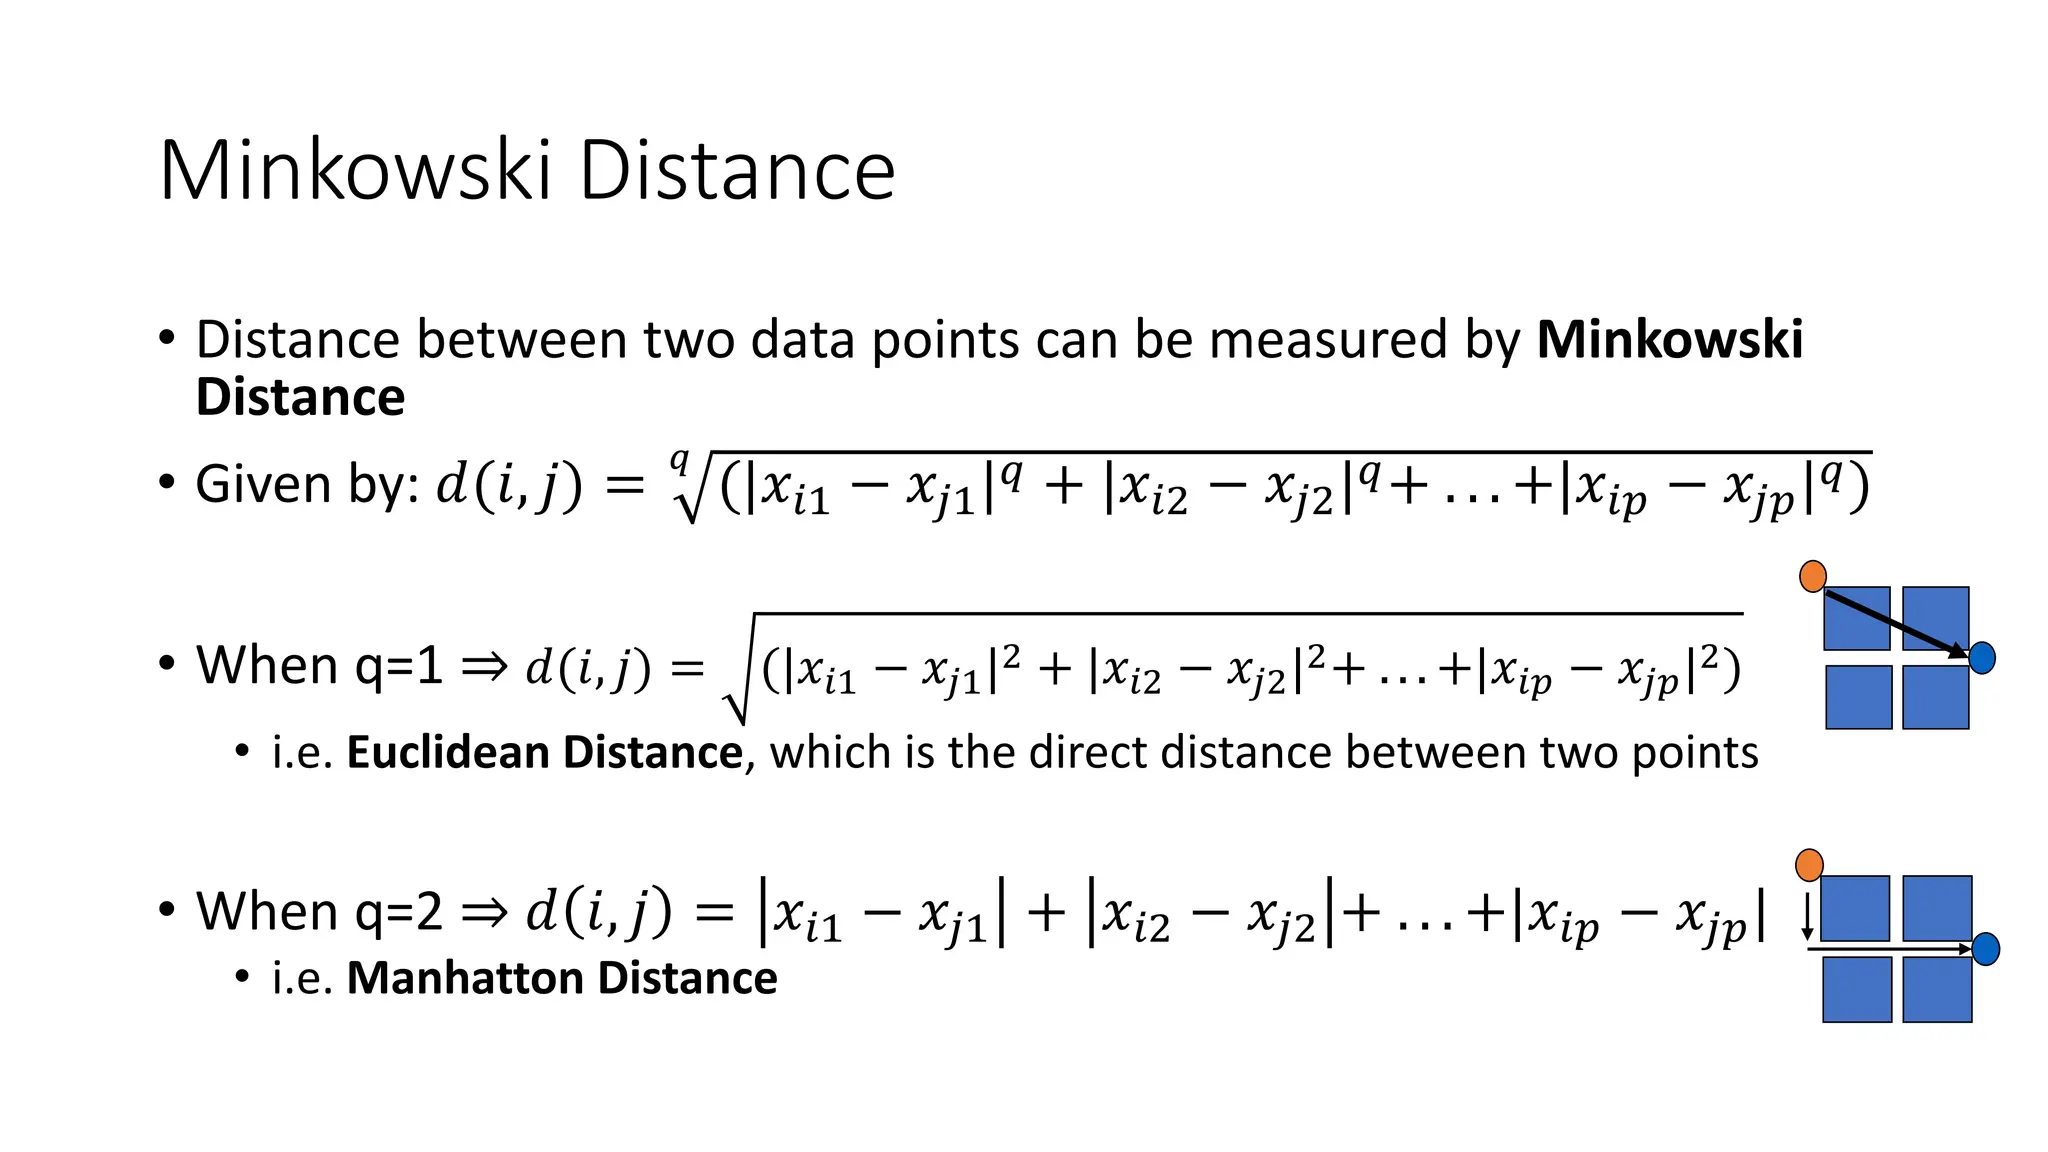
DA 5230 – Statistical & Machine Learning Lecture 11 – KNN and Clustering Maninda Edirisooriya manindaw@uom.lk
Minkowski Distance • Distance between two data points can be measured by Minkowski Distance • Given by: 𝑑(𝑖, 𝑗) = 𝑞 (|𝑥𝑖1 − 𝑥𝑗1|𝑞 + |𝑥𝑖2 − 𝑥𝑗2|𝑞+ . . . +|𝑥𝑖𝑝 − 𝑥𝑗𝑝|𝑞) • When q=1 ⇒ 𝑑(𝑖, 𝑗) = (|𝑥𝑖1 − 𝑥𝑗1|2 + |𝑥𝑖2 − 𝑥𝑗2|2+ . . . +|𝑥𝑖𝑝 − 𝑥𝑗𝑝|2) • i.e. Euclidean Distance, which is the direct distance between two points • When q=2 ⇒ 𝑑 𝑖, 𝑗 = 𝑥𝑖1 − 𝑥𝑗1 + 𝑥𝑖2 − 𝑥𝑗2 + . . . +|𝑥𝑖𝑝 − 𝑥𝑗𝑝| • i.e. Manhatton Distance
K-Nearest Neighbors (KNN) Algorithm • KNN is a very simple Instance-based Learning algorithm used for both Regression and Classification • This is a lazy (most calculations are done on prediction time) algorithm compared to model-based algorithms discussed before • This algorithm assumes nearby (with less distance) data points belong to the same class and far away data points belong to different classes • In KNN all the data points are kept in memory • Hyperparameter K has to be defined at the beginning • When a prediction is to be done for a given data point, distances from all the data points from the given data point are calculated
K - Nearest Neighbors (KNN) Algorithm • Then the closest (with least distance) K data points are selected • E.g. Euclidian Distance can be used • For Classification problems, Y class is found by voting to find the Y classes of the majority of the selected K data points • For Regression problems, Y value is found by averaging (or weighted averaging in Weighted KNN) distances on all the selected K data points • For lower K values model will have higher variance due to overfitting • For higher K values model will have higher bias due to underfitting • Optimum value for K can be found with Cross-validation
Characteristics of KNN • Each feature is given equal weight. Therefore, scale the features • Increased number of features create Curse of Dimensionality • Higer the K, it becomes less sensitive to the noise datapoints • When KNN voting gets tied (when get equal votes for the majority class), a randomly selection or weighted distances can be used for selecting the class • As there is no model to be trained, KNN can be used for Online Learning where the predictions have to be updated with continuously added new data points
KNN Example Source: https://medium.com/analytics-vidhya/k-nearest-neighbor-the-maths-behind-it-how-it-works-and-an-example-f1de1208546c
Unsupervised Learning • Labeled data is expensive – i.e. need to collect previous data accurately with Y values • Accuracy of Supervised Machine Learning models are dependent on the accuracy of the dataset given • But, there are many unlabeled data available in most of the cases • So, extracting information/patterns out of unlabeled data is valuable whenever possible • Extracting insights from unlabeled data is known as Unsupervised Learning
Clustering • Clustering is one of the widely used Unsupervised Learning technique • In Clustering we assume that the data points are naturally organized into categories/classes known as Clusters • In Clustering the main assumption is that similar datapoints belong to the same cluster and different data points belong to different clusters
Why Clustering? • Clustering is used to identify the high level concepts associated with the data • For example, when you need to identify the customer segments who are visiting your online shopping website, clustering will be helpful • As the human genome is large, it is impossible to visually analyze the common gene partitions by a human but clustering algorithms can • When you want to identify urbanized areas in a country using the satellite images, clustering can help to identify these areas using the light level density in night time images
Clustering - Example Source: From text book PPTs by Prof. Jiawei Han
Clustering Algorithm Types There are several approaches of extracting clusters out of data 1. Distance-based Methods 2. Density-based Methods 3. Model-based Methods Let’s understand each of the approach
Distance-based Methods • In the multidimensional feature space (e.g. in the area in a 2D graph between X1 and X2) nearby data points are grouped into a one cluster and distant points are grouped to other clusters • Here we assume that the similar data points in a cluster are near to each other and different clusters are distant from other clusters • Measuring distance (difference) or the closeness (similarity) is one of the important decision in Distance-based Methods • K-Means Clustering is an example for the Single Level Distance-based Clustering Method (Multi Level Methods are discussed later)
Measure of Distance • Measuring the distance (or closeness) is a key factor in designing Distance-based (Partitioning) clustering • In general, distances of each feature is assumed to be equally weighted while clustering • Therefore, all the features used for clustering should be scaled • Standardization is usually used for scaling • One of the popular distance measure is known as Minkowski Distance • Minkowski Distance formula can be used to derive popular distance measures like Euclidean Distance and Manhatton (City-Block) Distance as explained before
K-Means Clustering • Feature Space will get partitioned into K distinct partitions for each of the cluster • Each cluster has its own Centroid, a point representing the cluster which has the least total distance from each data point in the cluster • We have to provide the hyperparameter K, the number of clusters • K-Means Clustering Algorithm is generally used for K-Means Clustering
K-Means Clustering Algorithm • Initialize with random K centroids in the space (K random data points from the dataset are taken in general) • Until, either centroids or data points stop getting changed: • Assign each datapoint in the dataset to the nearest (e.g. with least Euclidean Distance) centroid • Calculate the new centroid of each cluster (e.g. with Mean Squares of Euclidean Distances) • This algorithm always converges to an optimum point • However, this may not be the Global Optimum point and can be a Local Optimum. Therefore, we have to run the algorithm several times with different initialization points and select the best model
Find best K for K-Means Clustering • Finding the optimum class count, K is important • One way is to get K = 𝒏 𝟐 where n is the number of data points in the dataset • Another well-known technique is known as Elbow Method which is not practical in many cases (hence, not explained here) • Best way to find K is using K-fold Cross Validation by using Total Squared distances from data points to their centroids in each cluster as the cost
K-Means Clustering Algorithm Source: https://www.reddit.com/r/learnmachinelearning/comments/qiid2e/kmeans_clustering_algorithm/?onetap_auto=true
Problems with K-Means Clustering • Although the K-Means Clustering Algorithm is fast (efficient at computation) they have some limitations • For example, K-Means Clustering works well when the clusters are, • Well-separated • Circular and • Having the same size • When each of the assumption is violated, the K-Means may not cluster as we expect
When Classes are Not Well Separated True class separation K-Means Clustering class separation Source: https://www.youtube.com/watch?v=BaZWcSq3IuI Source: https://www.youtube.com/watch?v=BaZWcSq3IuI
When Classes are Not Circular K-Means Clustering class separation Source: https://www.youtube.com/watch?v=BaZWcSq3IuI
When Classes are Not Same Sized K-Means Clustering when class radiuses are different K-Means Clustering when class data counts are different Source: https://www.youtube.com/watch?v=BaZWcSq3IuI Source: https://www.youtube.com/watch?v=BaZWcSq3IuI
Distance-based Hierarchical Methods • Methods like K-Means and K-Medoid are Single Level clustering methods. i.e. There are no clusters inside the clusters • There are other types of Clustering Method known as Hierarchical Clustering where clusters are defined inside other clusters as a hierarchy of clusters • There are two approaches of creating hierarchical clusters 1. Agglomerative Clustering where the algorithm starts assuming each datapoint as cluster and combining each of them until the whole dataset is considered as a single cluster. E.g.: AGNES algorithm 2. Divisive Clustering where the algorithm starts assuming the whole dataset is considered as the single cluster and dividing the clusters until each datapoint is considered as a cluster. E.g.: DIANA algorithm
Distance-based Hierarchical Methods Step 0 Step 1 Step 2 Step 3 Step 4 b d c e a a b d e c d e a b c d e Step 4 Step 3 Step 2 Step 1 Step 0 agglomerative (AGNES) divisive (DIANA) Source: From text book PPTs by Prof. Jiawei Han
Density-based Methods • Distance-based Methods have drawbacks • Noise/outlier datapoints are affecting the clustering as all the data points are considered in clustering • It gets impossible to clusters highly non-circular clusters like population densities in a country • Number of clusters, K, has to be provided as a hyperparameter • Instead of using distance to the centroids to represent the clusters, in Density-based Methods they use local density to decide the cluster • Depending on the density distribution throughout the space, clusters can have highly complex boundaries and arbitrary number of clusters • DBSCAN and OPTICS are examples to the Density-based methods
Model-based Methods • In Model-based methods, each data point is assumed to be generated by a mixture of probability distributions • A Model-based method tries to predict the parameters related to these probability distributions using these generated data points • Expectation-Maximization (EM) Algorithm is a popular approach • In Expectation (E) step the algorithm estimates the probability that each data point belongs to each cluster based on the current model parameters • In Maximization (M) step the algorithm updates the model parameters to maximize the likelihood of the data given these probabilities • Iterate the above 2 steps until the convergence. (This is analogous to the K- Means Clustering algorithm)
Gaussian Mixture Model (GMM) • GMM is a popular Model-based Method assuming the distributions are Gaussian. Parameters to be predicted for each distribution: • Mean Vector • Covariance Matrix • Proportion for the distribution (or weight) • Often the parameters are randomly initialized • E step: finds the proportions of each datapoint should be assigned to each of the distribution • M step: re-estimate the parameters and update Gaussian distributions with parameters
Gaussian Mixture Model (GMM) • GMM is converging but may converge to a Local Optimum • Once converged, datapoints are to be assigned to each cluster represented by each of the Gaussian distribution • In some cases each datapoint is assigned to the cluster with the highest probability (known as Maximum Probability Rule) • In some other cases each datapoint may be assigned to multiple clusters based on the probabilities related to each of the distribution (known as Soft Assignment) • A heatmap can be used to visualize the datapoints with the soft assignments
Gaussian Mixture Model (GMM) Source: https://prateekvjoshi.com/2013/06/29/gaussian-mixture-models Gaussian models Gaussian mixture model
Evaluating Clustering • If there are no labeled data to test the performance measures of the model, it is not possible to accurately evaluate the clustered model • However, there are other evaluations we can do related to clustering • First, the dataset should be having a non-random distribution (non- uniform distribution in the hyperspace) • In other words, the data should be non-uniformly distributed in the space, forming clusters • This measure is known as Spatial Randomness which can be measured by Hopkins Statistic
Measure Clustering Quality • When a clustering is done its quality has to be measured • Extrinsic Methods: possible when data with real cluster labels (Ground Truth) are available • E.g.: Bcubed Precision and Recall • Intrinsic Methods: possible when data with real cluster labels (Ground Truth) are not available • Good clusters should have lower intra-cluster distances (distance inside the cluster) and higher inter-cluster distances (distances between the clusters) • These measures are considered in Intrinsic Methods • E.g.: Silhouette coefficient
One Hour Homework • Officially we have one more hour to do after the end of the lecture • Therefore, for this week’s extra hour you have a homework • Learn about the applications of clustering • Research what type of clustering has to be used in each of the clustering application • Find the modified versions of the given clustering algorithms and their usages • Good Luck!
Questions?

Lecture 11 - KNN and Clustering, a lecture in subject module Statistical & Machine Learning

  • 1.
    DA 5230 –Statistical & Machine Learning Lecture 11 – KNN and Clustering Maninda Edirisooriya manindaw@uom.lk
  • 2.
    Minkowski Distance • Distancebetween two data points can be measured by Minkowski Distance • Given by: 𝑑(𝑖, 𝑗) = 𝑞 (|𝑥𝑖1 − 𝑥𝑗1|𝑞 + |𝑥𝑖2 − 𝑥𝑗2|𝑞+ . . . +|𝑥𝑖𝑝 − 𝑥𝑗𝑝|𝑞) • When q=1 ⇒ 𝑑(𝑖, 𝑗) = (|𝑥𝑖1 − 𝑥𝑗1|2 + |𝑥𝑖2 − 𝑥𝑗2|2+ . . . +|𝑥𝑖𝑝 − 𝑥𝑗𝑝|2) • i.e. Euclidean Distance, which is the direct distance between two points • When q=2 ⇒ 𝑑 𝑖, 𝑗 = 𝑥𝑖1 − 𝑥𝑗1 + 𝑥𝑖2 − 𝑥𝑗2 + . . . +|𝑥𝑖𝑝 − 𝑥𝑗𝑝| • i.e. Manhatton Distance
  • 3.
    K-Nearest Neighbors (KNN)Algorithm • KNN is a very simple Instance-based Learning algorithm used for both Regression and Classification • This is a lazy (most calculations are done on prediction time) algorithm compared to model-based algorithms discussed before • This algorithm assumes nearby (with less distance) data points belong to the same class and far away data points belong to different classes • In KNN all the data points are kept in memory • Hyperparameter K has to be defined at the beginning • When a prediction is to be done for a given data point, distances from all the data points from the given data point are calculated
  • 4.
    K - NearestNeighbors (KNN) Algorithm • Then the closest (with least distance) K data points are selected • E.g. Euclidian Distance can be used • For Classification problems, Y class is found by voting to find the Y classes of the majority of the selected K data points • For Regression problems, Y value is found by averaging (or weighted averaging in Weighted KNN) distances on all the selected K data points • For lower K values model will have higher variance due to overfitting • For higher K values model will have higher bias due to underfitting • Optimum value for K can be found with Cross-validation
  • 5.
    Characteristics of KNN •Each feature is given equal weight. Therefore, scale the features • Increased number of features create Curse of Dimensionality • Higer the K, it becomes less sensitive to the noise datapoints • When KNN voting gets tied (when get equal votes for the majority class), a randomly selection or weighted distances can be used for selecting the class • As there is no model to be trained, KNN can be used for Online Learning where the predictions have to be updated with continuously added new data points
  • 6.
  • 7.
    Unsupervised Learning • Labeleddata is expensive – i.e. need to collect previous data accurately with Y values • Accuracy of Supervised Machine Learning models are dependent on the accuracy of the dataset given • But, there are many unlabeled data available in most of the cases • So, extracting information/patterns out of unlabeled data is valuable whenever possible • Extracting insights from unlabeled data is known as Unsupervised Learning
  • 8.
    Clustering • Clustering isone of the widely used Unsupervised Learning technique • In Clustering we assume that the data points are naturally organized into categories/classes known as Clusters • In Clustering the main assumption is that similar datapoints belong to the same cluster and different data points belong to different clusters
  • 9.
    Why Clustering? • Clusteringis used to identify the high level concepts associated with the data • For example, when you need to identify the customer segments who are visiting your online shopping website, clustering will be helpful • As the human genome is large, it is impossible to visually analyze the common gene partitions by a human but clustering algorithms can • When you want to identify urbanized areas in a country using the satellite images, clustering can help to identify these areas using the light level density in night time images
  • 10.
    Clustering - Example Source:From text book PPTs by Prof. Jiawei Han
  • 11.
    Clustering Algorithm Types Thereare several approaches of extracting clusters out of data 1. Distance-based Methods 2. Density-based Methods 3. Model-based Methods Let’s understand each of the approach
  • 12.
    Distance-based Methods • Inthe multidimensional feature space (e.g. in the area in a 2D graph between X1 and X2) nearby data points are grouped into a one cluster and distant points are grouped to other clusters • Here we assume that the similar data points in a cluster are near to each other and different clusters are distant from other clusters • Measuring distance (difference) or the closeness (similarity) is one of the important decision in Distance-based Methods • K-Means Clustering is an example for the Single Level Distance-based Clustering Method (Multi Level Methods are discussed later)
  • 13.
    Measure of Distance •Measuring the distance (or closeness) is a key factor in designing Distance-based (Partitioning) clustering • In general, distances of each feature is assumed to be equally weighted while clustering • Therefore, all the features used for clustering should be scaled • Standardization is usually used for scaling • One of the popular distance measure is known as Minkowski Distance • Minkowski Distance formula can be used to derive popular distance measures like Euclidean Distance and Manhatton (City-Block) Distance as explained before
  • 14.
    K-Means Clustering • FeatureSpace will get partitioned into K distinct partitions for each of the cluster • Each cluster has its own Centroid, a point representing the cluster which has the least total distance from each data point in the cluster • We have to provide the hyperparameter K, the number of clusters • K-Means Clustering Algorithm is generally used for K-Means Clustering
  • 15.
    K-Means Clustering Algorithm •Initialize with random K centroids in the space (K random data points from the dataset are taken in general) • Until, either centroids or data points stop getting changed: • Assign each datapoint in the dataset to the nearest (e.g. with least Euclidean Distance) centroid • Calculate the new centroid of each cluster (e.g. with Mean Squares of Euclidean Distances) • This algorithm always converges to an optimum point • However, this may not be the Global Optimum point and can be a Local Optimum. Therefore, we have to run the algorithm several times with different initialization points and select the best model
  • 16.
    Find best Kfor K-Means Clustering • Finding the optimum class count, K is important • One way is to get K = 𝒏 𝟐 where n is the number of data points in the dataset • Another well-known technique is known as Elbow Method which is not practical in many cases (hence, not explained here) • Best way to find K is using K-fold Cross Validation by using Total Squared distances from data points to their centroids in each cluster as the cost
  • 17.
    K-Means Clustering Algorithm Source:https://www.reddit.com/r/learnmachinelearning/comments/qiid2e/kmeans_clustering_algorithm/?onetap_auto=true
  • 18.
    Problems with K-MeansClustering • Although the K-Means Clustering Algorithm is fast (efficient at computation) they have some limitations • For example, K-Means Clustering works well when the clusters are, • Well-separated • Circular and • Having the same size • When each of the assumption is violated, the K-Means may not cluster as we expect
  • 19.
    When Classes areNot Well Separated True class separation K-Means Clustering class separation Source: https://www.youtube.com/watch?v=BaZWcSq3IuI Source: https://www.youtube.com/watch?v=BaZWcSq3IuI
  • 20.
    When Classes areNot Circular K-Means Clustering class separation Source: https://www.youtube.com/watch?v=BaZWcSq3IuI
  • 21.
    When Classes areNot Same Sized K-Means Clustering when class radiuses are different K-Means Clustering when class data counts are different Source: https://www.youtube.com/watch?v=BaZWcSq3IuI Source: https://www.youtube.com/watch?v=BaZWcSq3IuI
  • 22.
    Distance-based Hierarchical Methods •Methods like K-Means and K-Medoid are Single Level clustering methods. i.e. There are no clusters inside the clusters • There are other types of Clustering Method known as Hierarchical Clustering where clusters are defined inside other clusters as a hierarchy of clusters • There are two approaches of creating hierarchical clusters 1. Agglomerative Clustering where the algorithm starts assuming each datapoint as cluster and combining each of them until the whole dataset is considered as a single cluster. E.g.: AGNES algorithm 2. Divisive Clustering where the algorithm starts assuming the whole dataset is considered as the single cluster and dividing the clusters until each datapoint is considered as a cluster. E.g.: DIANA algorithm
  • 23.
    Distance-based Hierarchical Methods Step0 Step 1 Step 2 Step 3 Step 4 b d c e a a b d e c d e a b c d e Step 4 Step 3 Step 2 Step 1 Step 0 agglomerative (AGNES) divisive (DIANA) Source: From text book PPTs by Prof. Jiawei Han
  • 24.
    Density-based Methods • Distance-basedMethods have drawbacks • Noise/outlier datapoints are affecting the clustering as all the data points are considered in clustering • It gets impossible to clusters highly non-circular clusters like population densities in a country • Number of clusters, K, has to be provided as a hyperparameter • Instead of using distance to the centroids to represent the clusters, in Density-based Methods they use local density to decide the cluster • Depending on the density distribution throughout the space, clusters can have highly complex boundaries and arbitrary number of clusters • DBSCAN and OPTICS are examples to the Density-based methods
  • 25.
    Model-based Methods • InModel-based methods, each data point is assumed to be generated by a mixture of probability distributions • A Model-based method tries to predict the parameters related to these probability distributions using these generated data points • Expectation-Maximization (EM) Algorithm is a popular approach • In Expectation (E) step the algorithm estimates the probability that each data point belongs to each cluster based on the current model parameters • In Maximization (M) step the algorithm updates the model parameters to maximize the likelihood of the data given these probabilities • Iterate the above 2 steps until the convergence. (This is analogous to the K- Means Clustering algorithm)
  • 26.
    Gaussian Mixture Model(GMM) • GMM is a popular Model-based Method assuming the distributions are Gaussian. Parameters to be predicted for each distribution: • Mean Vector • Covariance Matrix • Proportion for the distribution (or weight) • Often the parameters are randomly initialized • E step: finds the proportions of each datapoint should be assigned to each of the distribution • M step: re-estimate the parameters and update Gaussian distributions with parameters
  • 27.
    Gaussian Mixture Model(GMM) • GMM is converging but may converge to a Local Optimum • Once converged, datapoints are to be assigned to each cluster represented by each of the Gaussian distribution • In some cases each datapoint is assigned to the cluster with the highest probability (known as Maximum Probability Rule) • In some other cases each datapoint may be assigned to multiple clusters based on the probabilities related to each of the distribution (known as Soft Assignment) • A heatmap can be used to visualize the datapoints with the soft assignments
  • 28.
    Gaussian Mixture Model(GMM) Source: https://prateekvjoshi.com/2013/06/29/gaussian-mixture-models Gaussian models Gaussian mixture model
  • 29.
    Evaluating Clustering • Ifthere are no labeled data to test the performance measures of the model, it is not possible to accurately evaluate the clustered model • However, there are other evaluations we can do related to clustering • First, the dataset should be having a non-random distribution (non- uniform distribution in the hyperspace) • In other words, the data should be non-uniformly distributed in the space, forming clusters • This measure is known as Spatial Randomness which can be measured by Hopkins Statistic
  • 30.
    Measure Clustering Quality •When a clustering is done its quality has to be measured • Extrinsic Methods: possible when data with real cluster labels (Ground Truth) are available • E.g.: Bcubed Precision and Recall • Intrinsic Methods: possible when data with real cluster labels (Ground Truth) are not available • Good clusters should have lower intra-cluster distances (distance inside the cluster) and higher inter-cluster distances (distances between the clusters) • These measures are considered in Intrinsic Methods • E.g.: Silhouette coefficient
  • 31.
    One Hour Homework •Officially we have one more hour to do after the end of the lecture • Therefore, for this week’s extra hour you have a homework • Learn about the applications of clustering • Research what type of clustering has to be used in each of the clustering application • Find the modified versions of the given clustering algorithms and their usages • Good Luck!
  • 32.