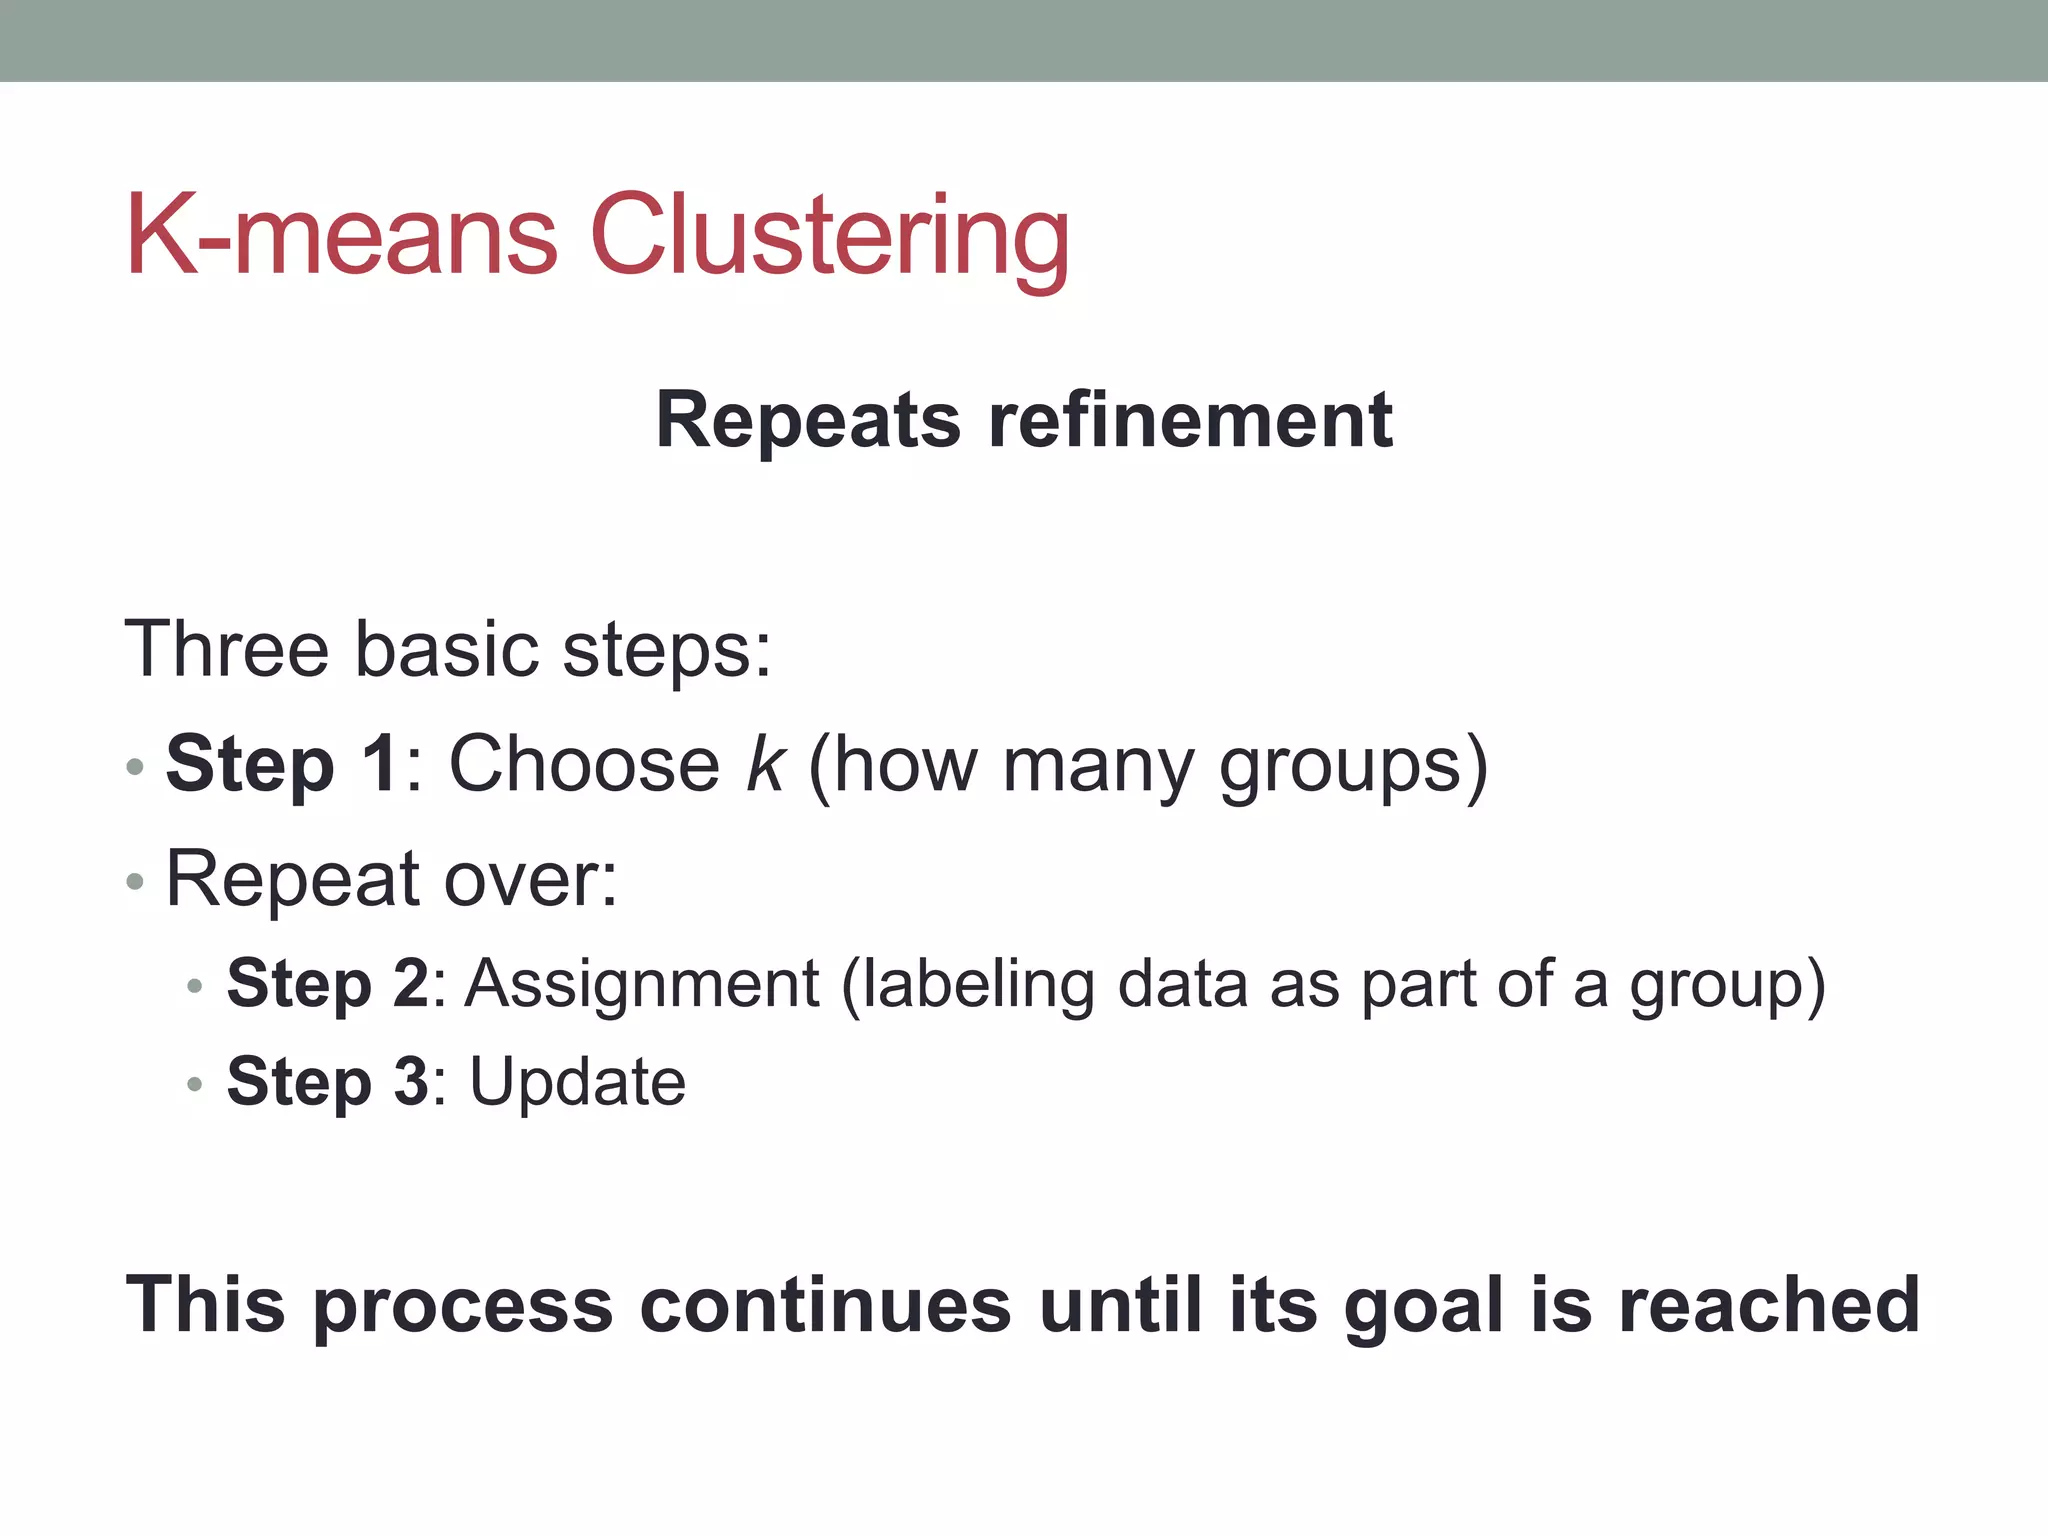
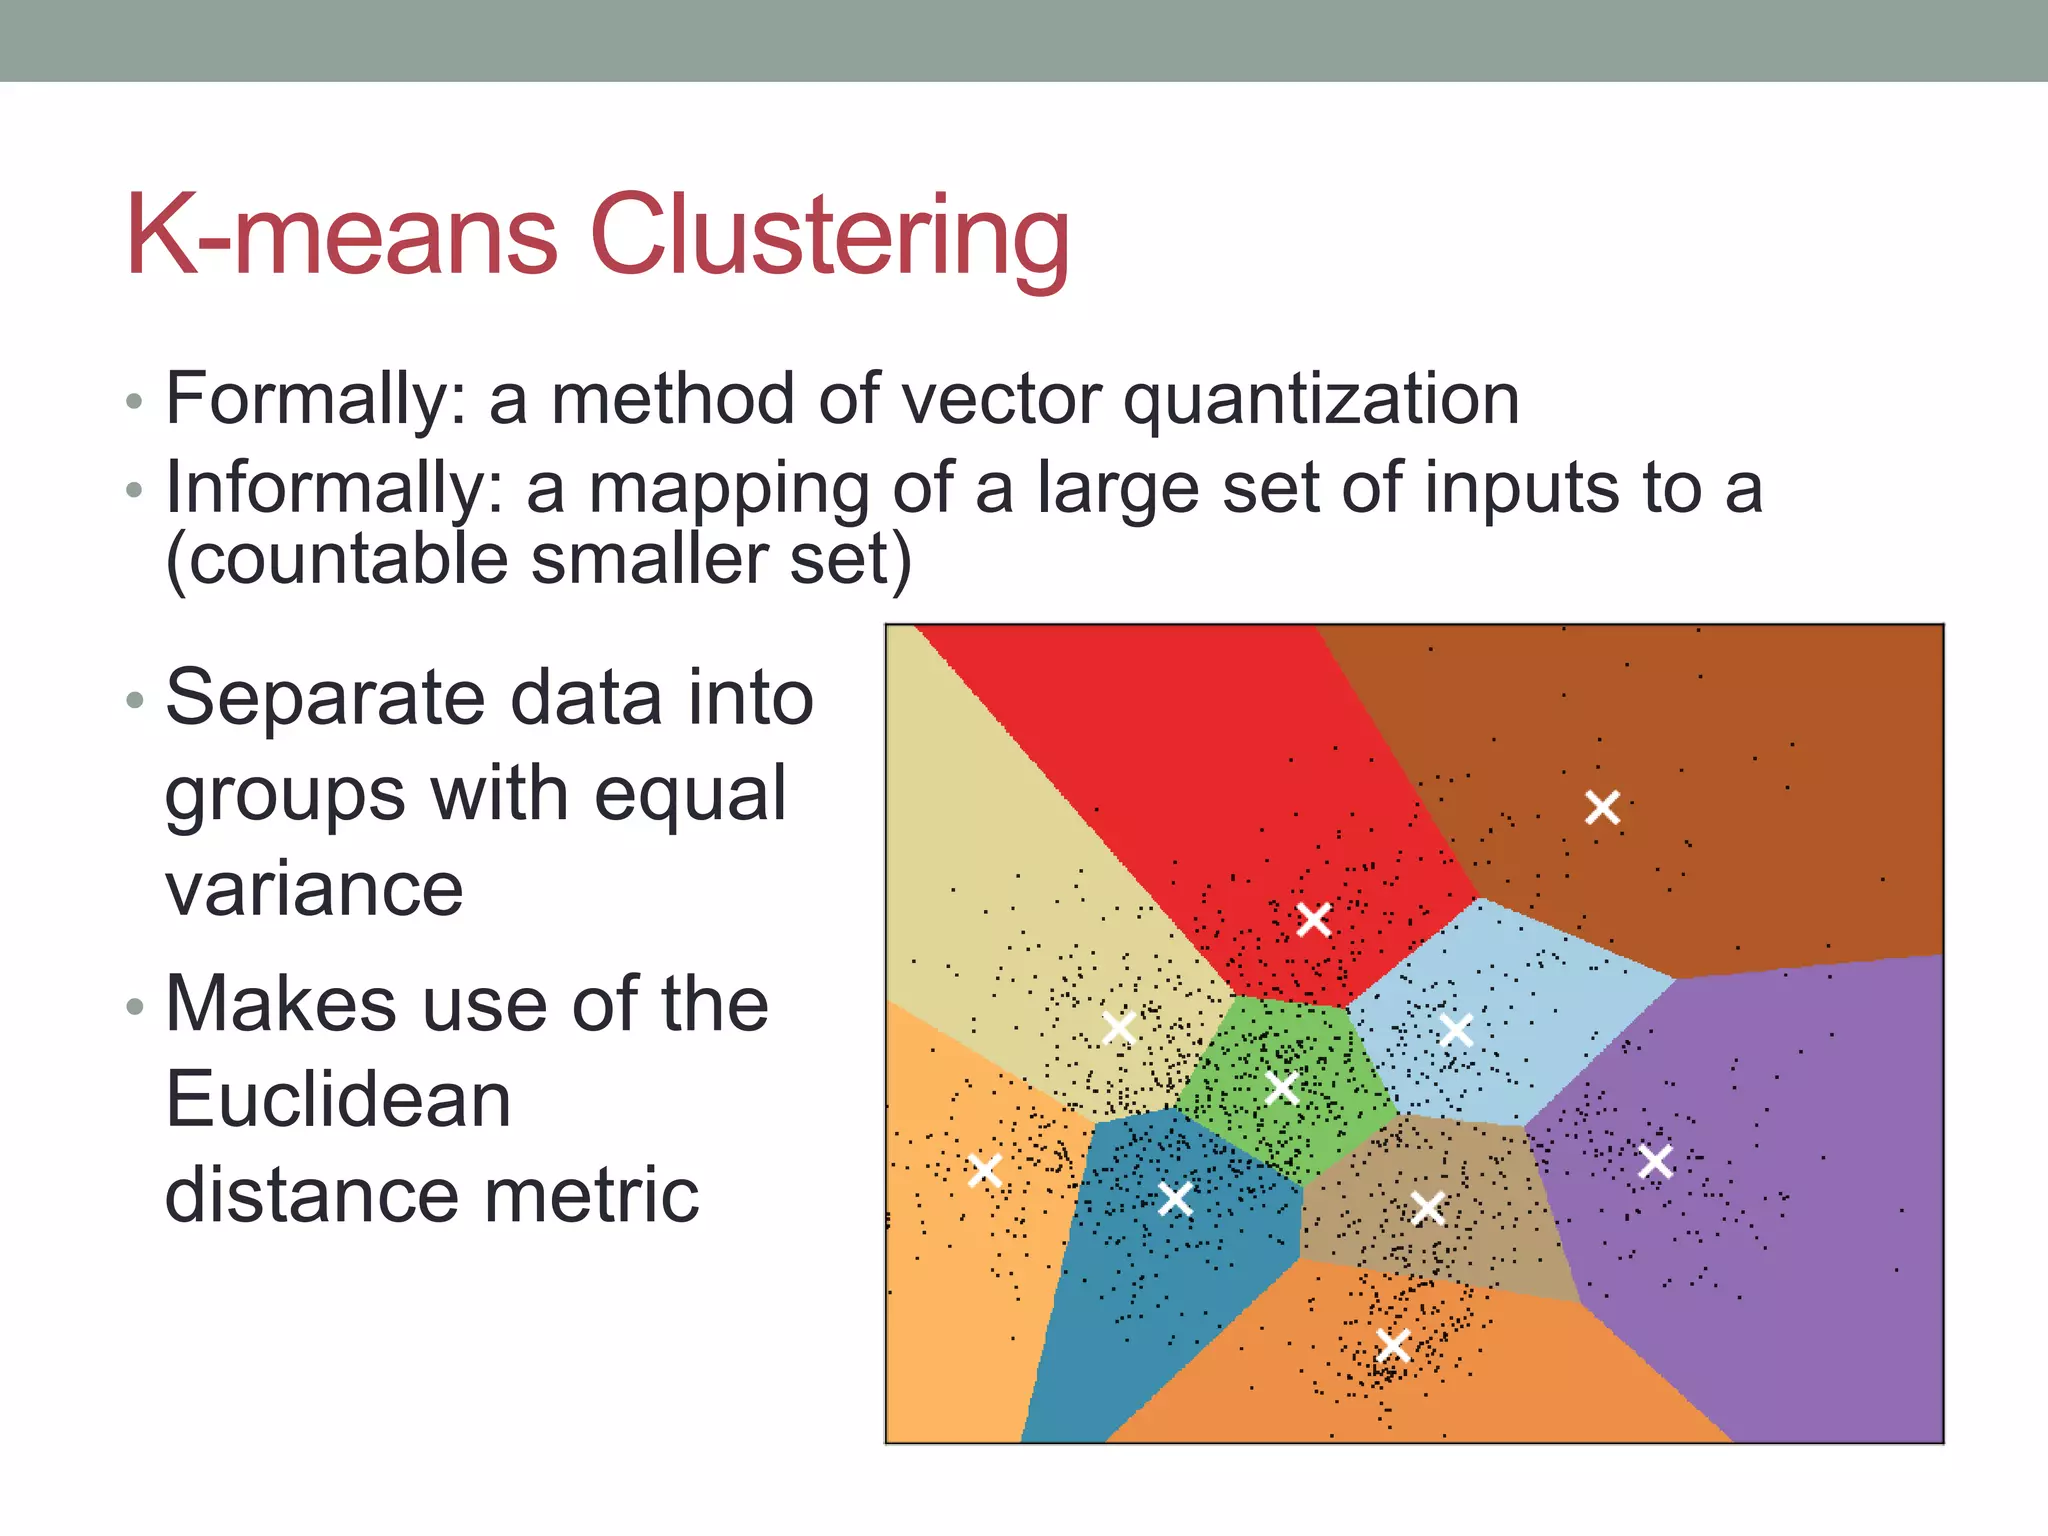
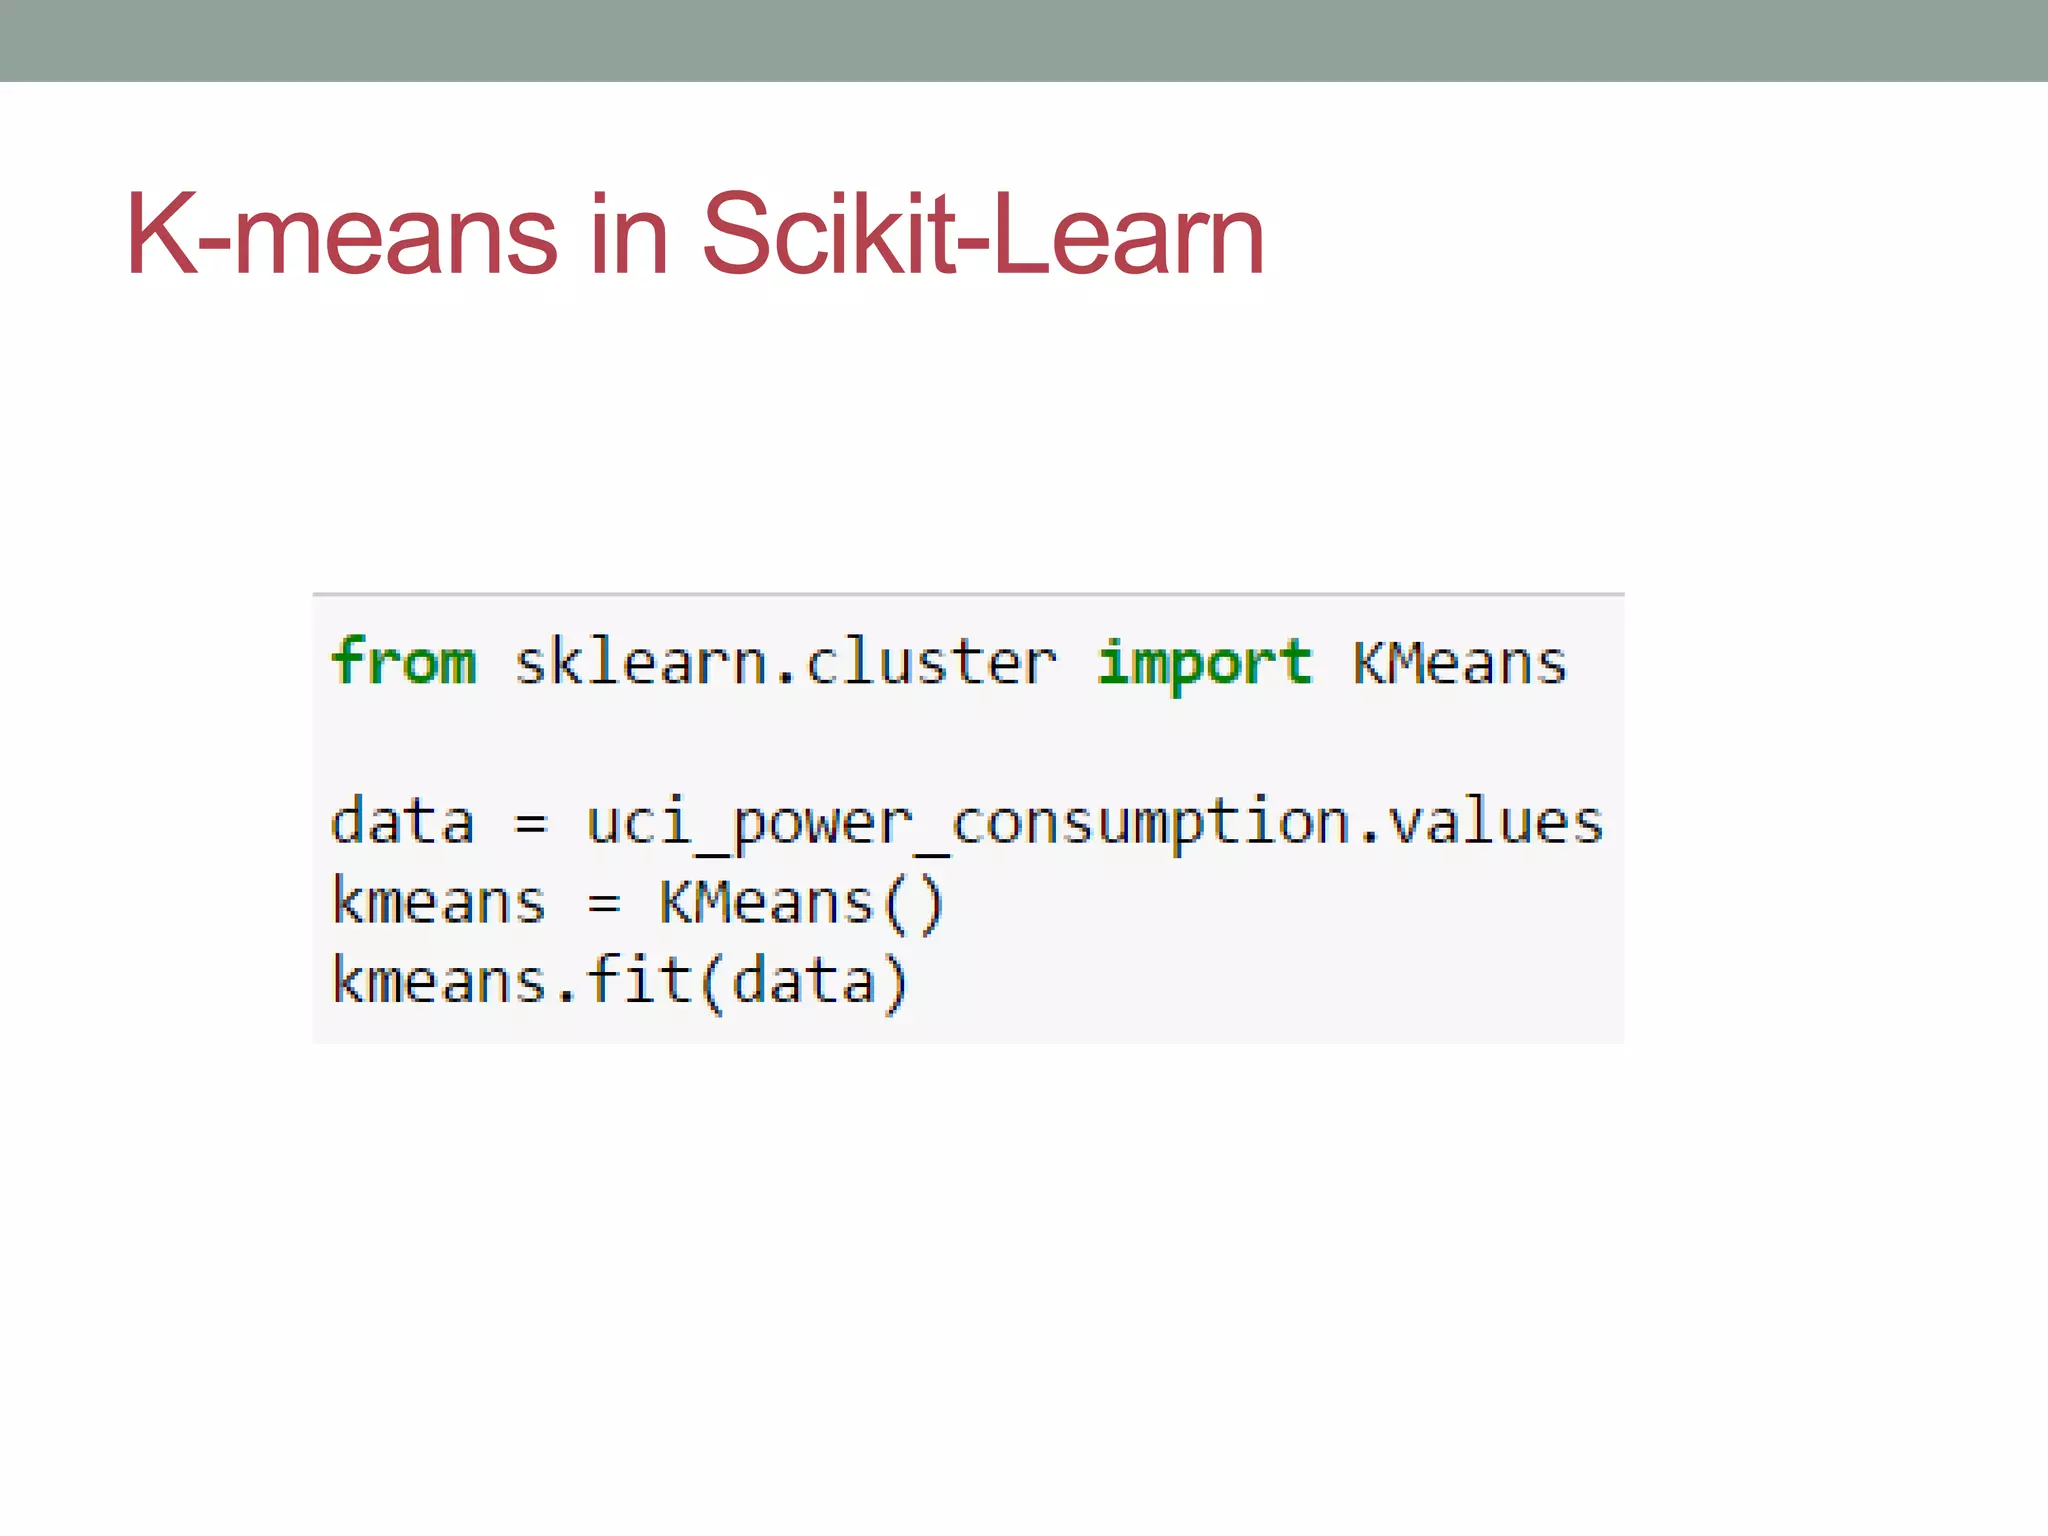
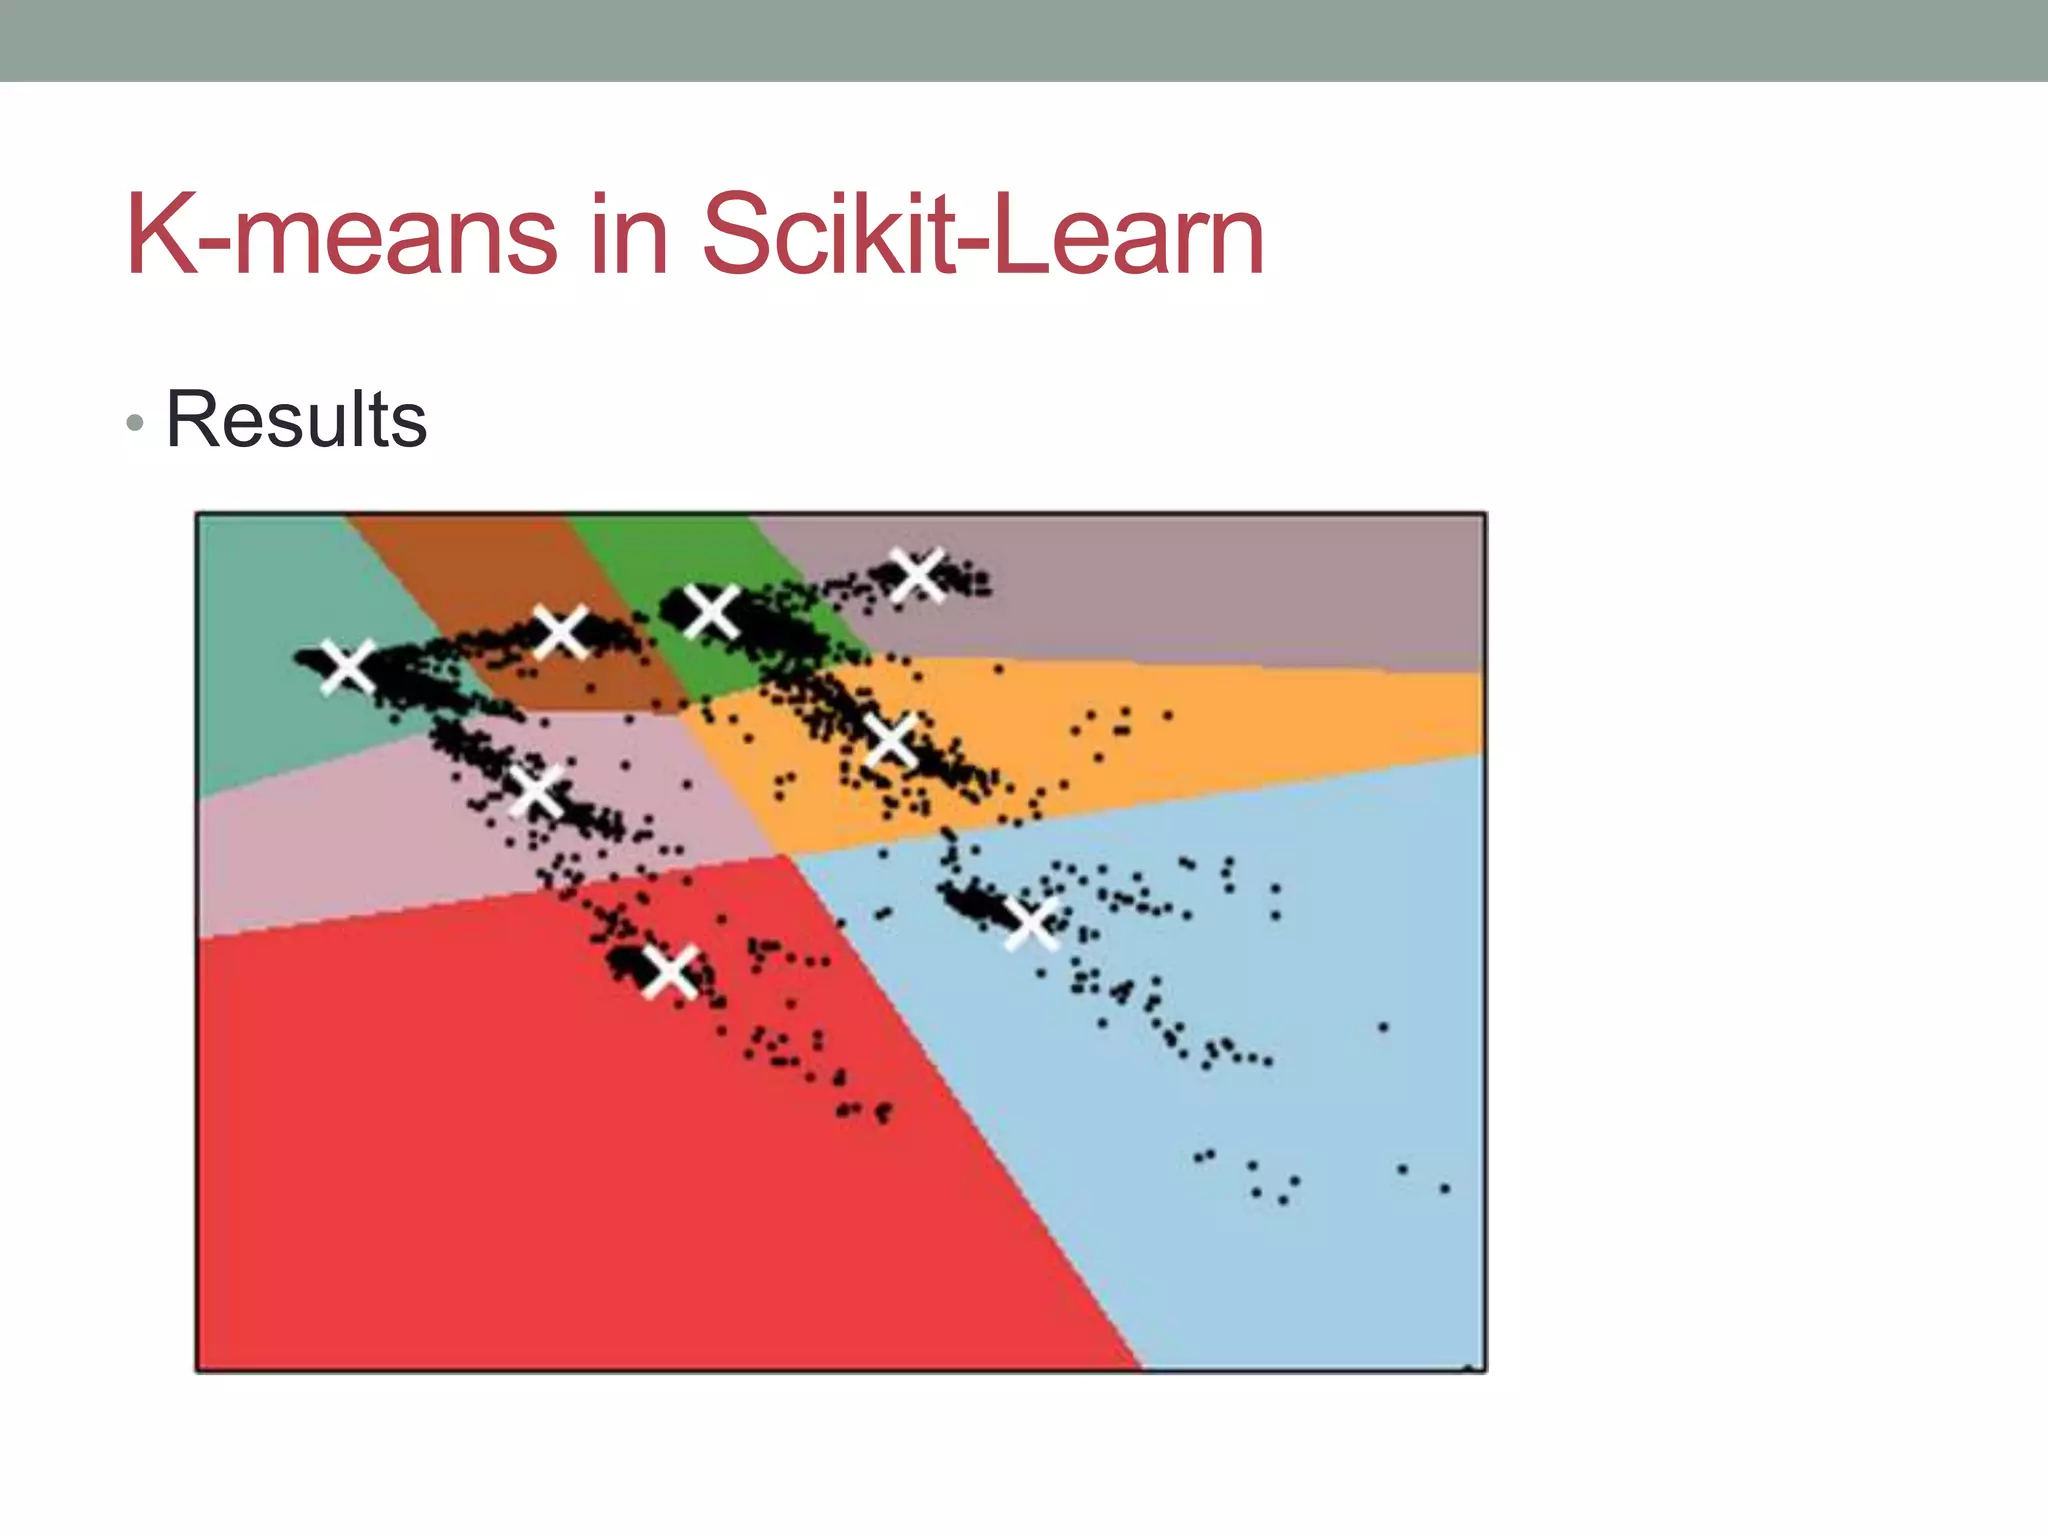
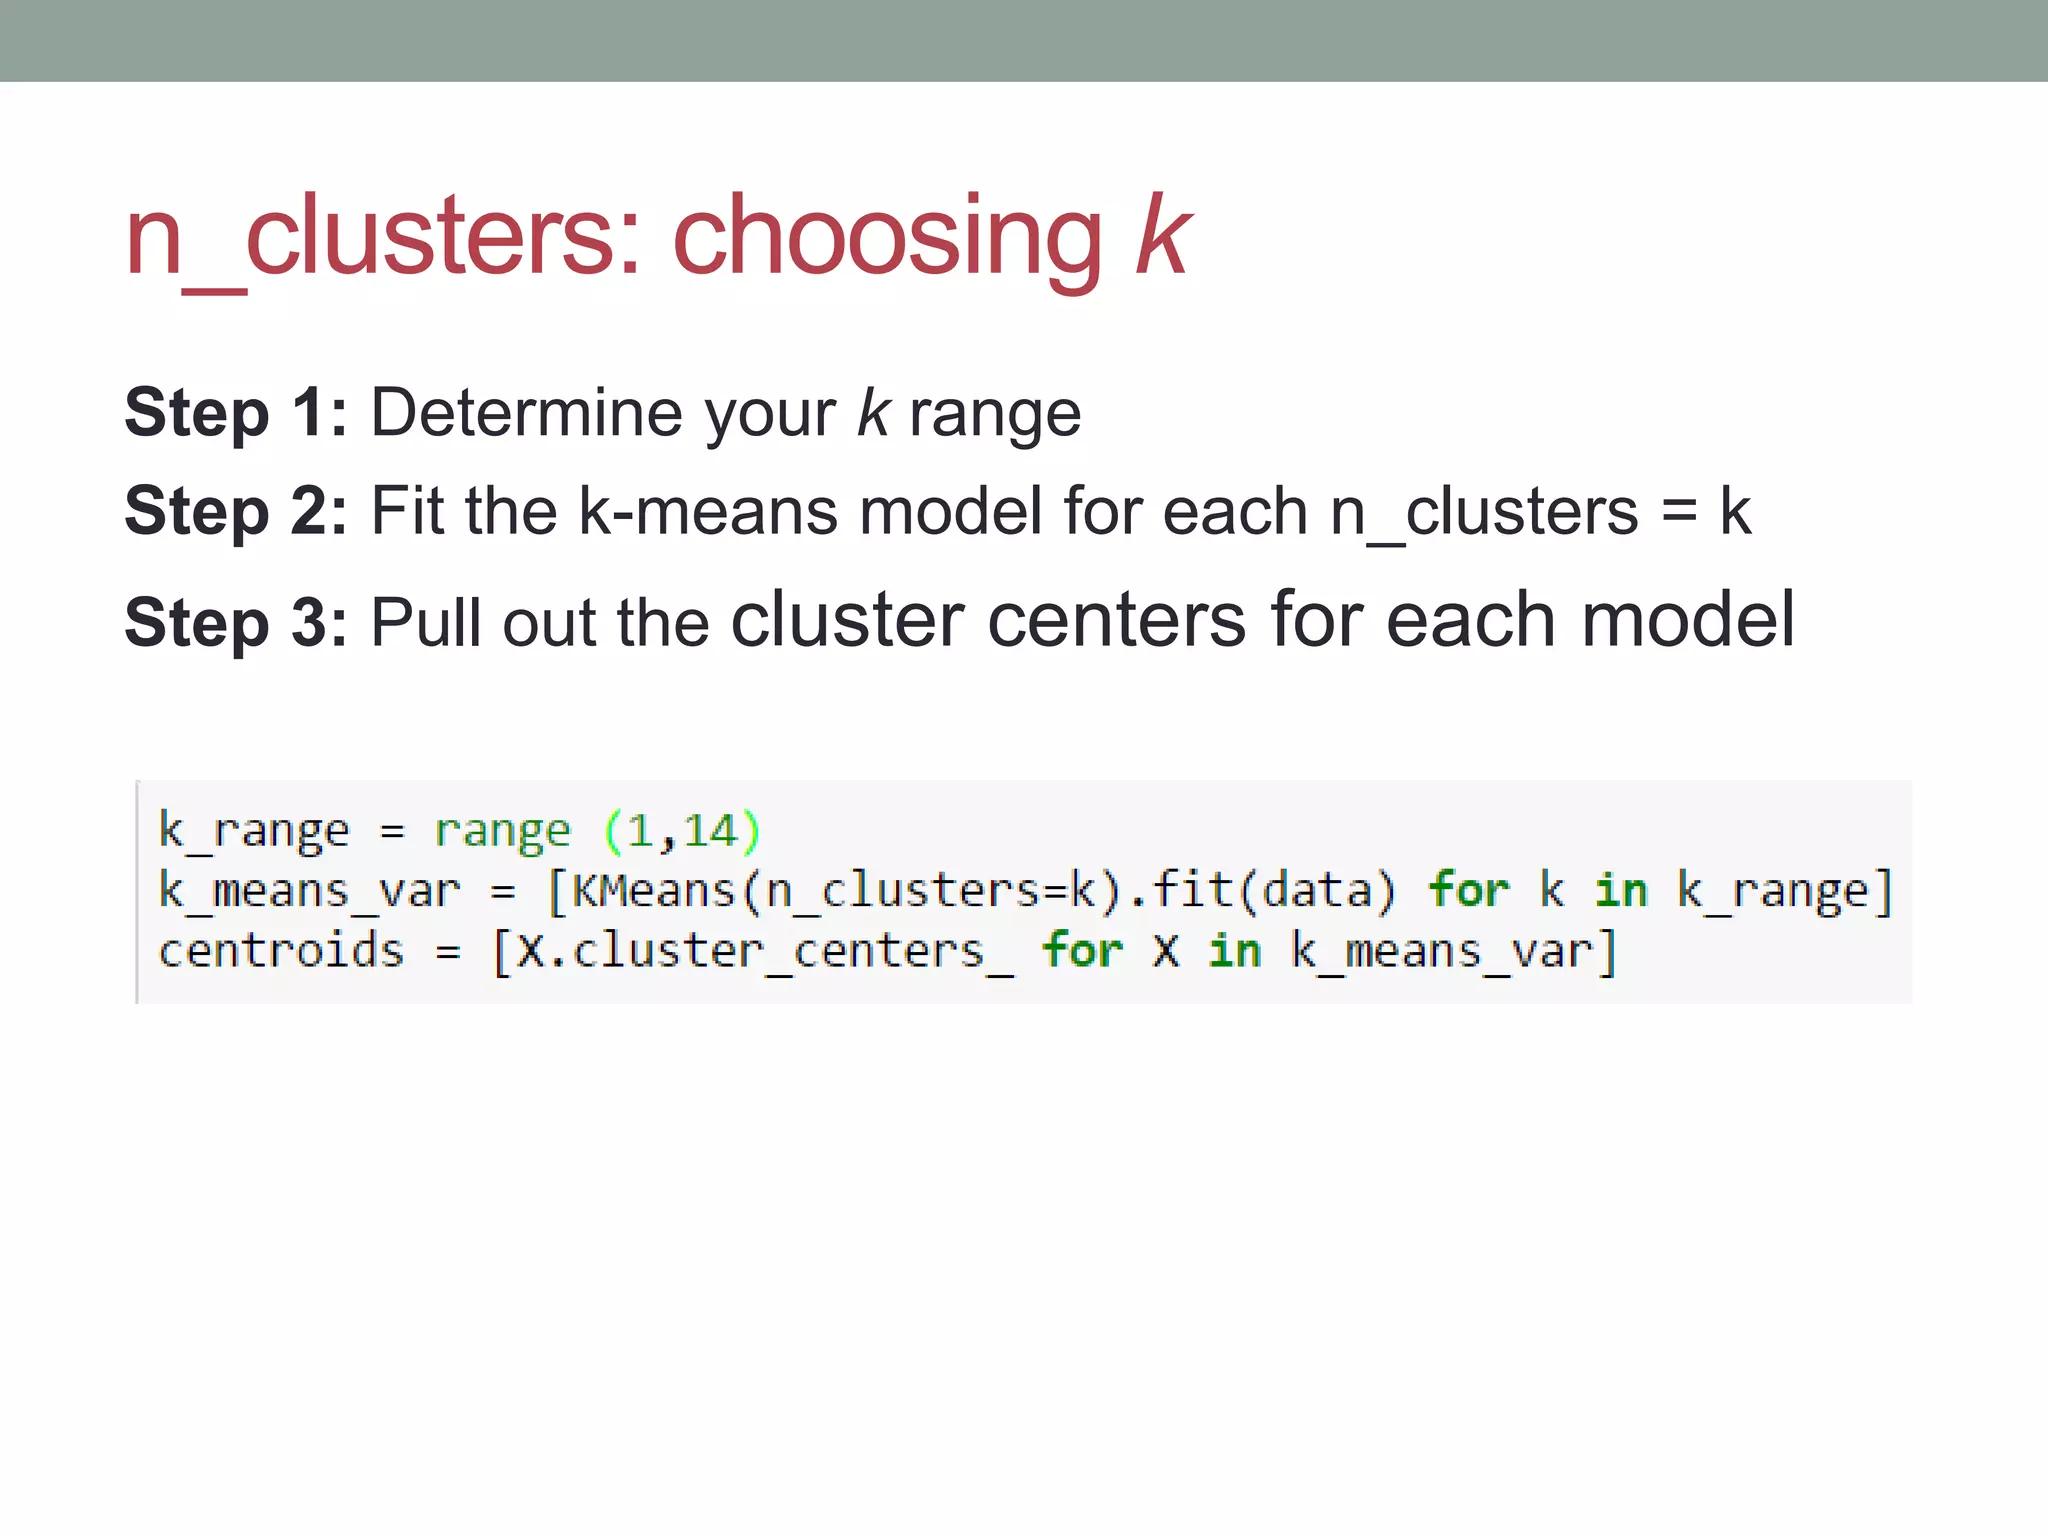
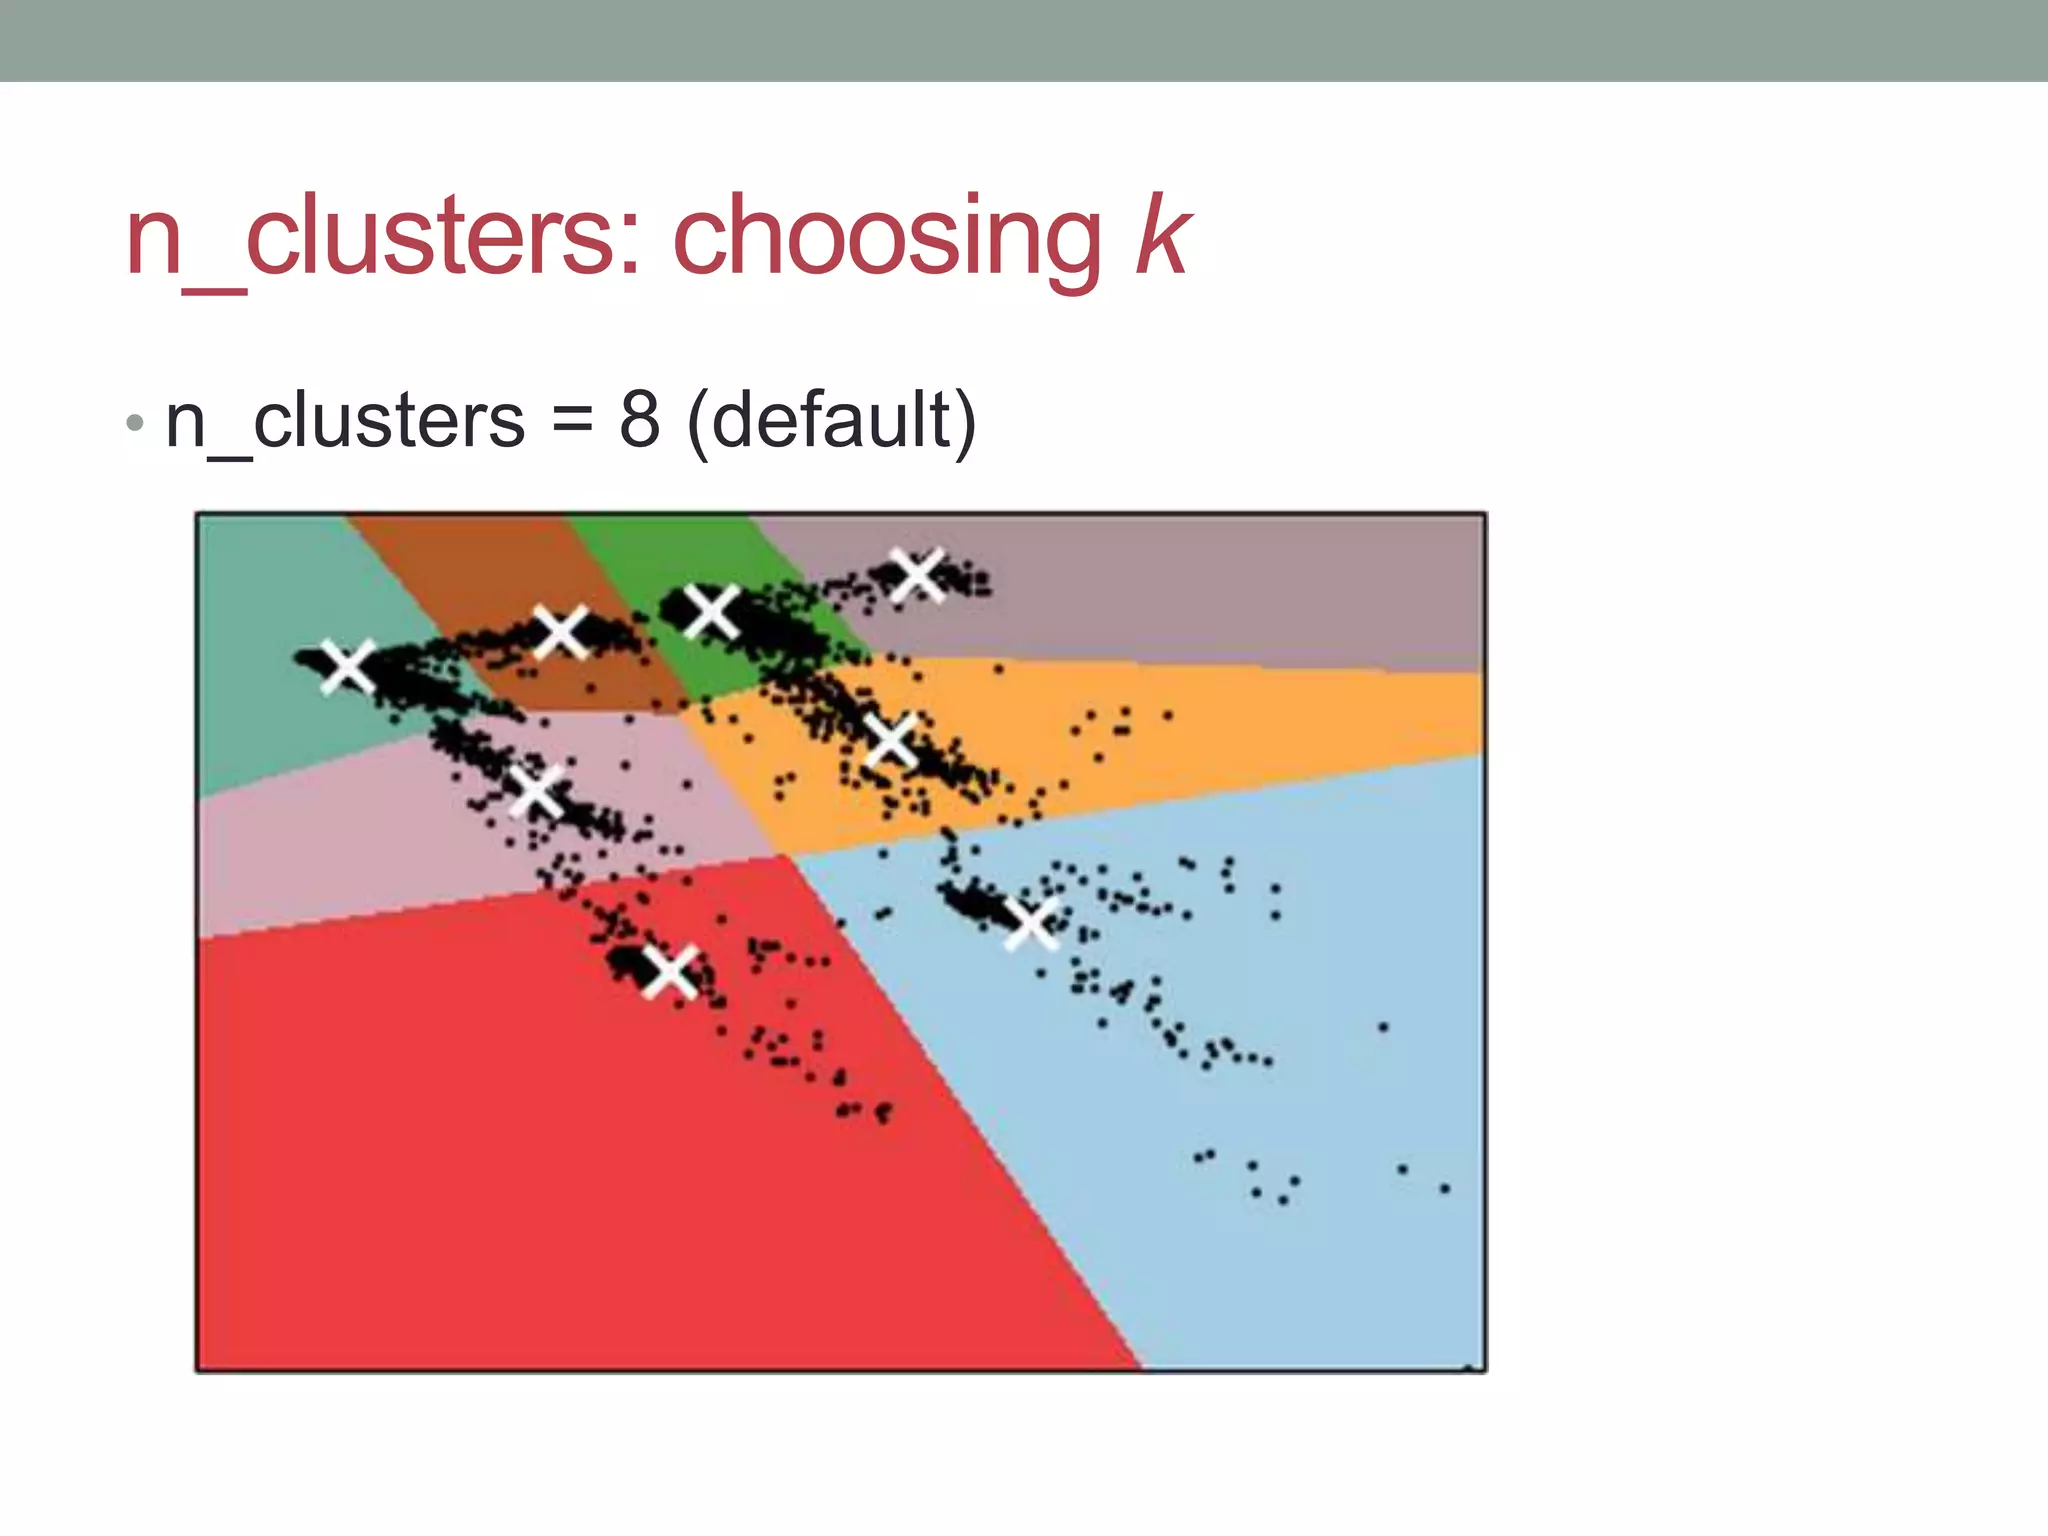
Clustering: A Scikit-Learn Tutorial Damian Mingle
About Me • Chief Data Scientist, WPC Healthcare • Speaker • Researcher • Writer
Outline • What is k-means clustering? • How does it work? • When is it appropriate to use it? • K-means clustering in scikit-learn • Basic • Basic with adjustments
Clustering • It is unsupervised learning (inferring a function to describe not so obvious structures from unlabeled data) • Groups data objects • Measures distance between data points • Helps in examining the data
K-means Clustering • Formally: a method of vector quantization • Informally: a mapping of a large set of inputs to a (countable smaller set) • Separate data into groups with equal variance • Makes use of the Euclidean distance metric
K-means Clustering Repeats refinement Three basic steps: • Step 1: Choose k (how many groups) • Repeat over: • Step 2: Assignment (labeling data as part of a group) • Step 3: Update This process continues until its goal is reached
K-means Clustering • Assignment • Update
K-means Clustering • Advantages • Large data accepted • Fast • Will always find a solution • Disadvantages • Choosing the wrong number of groups • You reach a local optima not a global
K-means Clustering • When to use • Normally distributed data • Large number of samples • Not too many clusters • Distance can be measured in a linear fashion
Scikit-Learn • Python • Open-source machine learning library • Very well documented
Scikit-Learn • Model = EstimatorObject() • Unsupervised: • Model.fit(dataset.data) • dataset.data = dataset
K-means in Scikit-Learn • Very fast • Data Scientist: picks number of clusters, • Scikit kmeans: finds the initial centroids of groups
Dataset Name: Household Power Consumption by Individuals Number of attributes: 9 Number of instances: 2,075,259 Missing values: Yes
K-means in Scikit-Learn
K-means in Scikit-Learn • Results
K-means Parameters • n_clusters • Number of clusters to form • max_iter • Maximum number of repeats for algo in a single run • n_init • Number of times k-means algo will run with different initialization points • init • Method you want to initialize with • precompute_distances • Selection of Yes, No, or let the machine decide • Tol • How tolerable should the algo be when it converges • n_jobs • How many CPUs do you want to engage when running the algo • random_state • What instance should be the starting point for the algo
n_clusters: choosing k • View the variance • cdist is the distance between sets of observations • pdist is the pairwise distances between observations in the same set
n_clusters: choosing k Step 1: Determine your k range Step 2: Fit the k-means model for each n_clusters = k Step 3: Pull out the cluster centers for each model
n_clusters: choosing k Step 4: Calculate Euclidean distance from each point to each cluster center Step 5: Total within-cluster sum of squares Step 6: Total sum of squares Step 7: Difference between-cluster sum of squares
n_clusters: choosing k • Graphing the variance
n_clusters: choosing k n_clusters = 4 n_clusters = 7
n_clusters: choosing k • n_clusters = 8 (default)
init Methods and their meaning: • k-means++ • Selects initial clusters in a way that speeds up convergence • random • Choose k rows at random for initial centroids • Ndarray that gives initial centers • (n_clusters, n_features)
K-means (8) n_clusters = 8, init = kmeans++ n_clusters = 8, init = random
K-means (7) n_clusters = 7, init = kmeans++ n_clusters = 7, init = random
Comparing Results: Silhouette Score • Silhouette coefficient • Not black and white, lots of gray • Average distance between data observations and other data in cluster • Average distance between data observations and all other points in the NEXT nearest cluster • Silhouette score in scikit-learn • Average silhouette coefficient for all data observations • The closer to 1, the better the fit • Computation time increases with larger datasets
Result Comparison: Silhouette Score
What Do the Results Say? • Data patterns may in fact exist • Similar observations can be grouped • We need additional discovery
A Few Hacks • Clustering is a great way to explore your data and develop intution • Too many features create a problem for understanding • Use dimensionality reduction • Use clustering with other methods
Let’s Connect • Twitter: @DamianMingle • LinkedIn: DamianRMingle • Sign-up for Data Science Hacks

Clustering: A Scikit Learn Tutorial

  • 1.
  • 2.
    About Me • ChiefData Scientist, WPC Healthcare • Speaker • Researcher • Writer
  • 3.
    Outline • What isk-means clustering? • How does it work? • When is it appropriate to use it? • K-means clustering in scikit-learn • Basic • Basic with adjustments
  • 4.
    Clustering • It isunsupervised learning (inferring a function to describe not so obvious structures from unlabeled data) • Groups data objects • Measures distance between data points • Helps in examining the data
  • 5.
    K-means Clustering • Formally:a method of vector quantization • Informally: a mapping of a large set of inputs to a (countable smaller set) • Separate data into groups with equal variance • Makes use of the Euclidean distance metric
  • 6.
    K-means Clustering Repeats refinement Threebasic steps: • Step 1: Choose k (how many groups) • Repeat over: • Step 2: Assignment (labeling data as part of a group) • Step 3: Update This process continues until its goal is reached
  • 7.
  • 8.
    K-means Clustering • Advantages •Large data accepted • Fast • Will always find a solution • Disadvantages • Choosing the wrong number of groups • You reach a local optima not a global
  • 9.
    K-means Clustering • Whento use • Normally distributed data • Large number of samples • Not too many clusters • Distance can be measured in a linear fashion
  • 10.
    Scikit-Learn • Python • Open-sourcemachine learning library • Very well documented
  • 11.
    Scikit-Learn • Model =EstimatorObject() • Unsupervised: • Model.fit(dataset.data) • dataset.data = dataset
  • 12.
    K-means in Scikit-Learn •Very fast • Data Scientist: picks number of clusters, • Scikit kmeans: finds the initial centroids of groups
  • 13.
    Dataset Name: Household PowerConsumption by Individuals Number of attributes: 9 Number of instances: 2,075,259 Missing values: Yes
  • 14.
  • 15.
  • 16.
    K-means Parameters • n_clusters •Number of clusters to form • max_iter • Maximum number of repeats for algo in a single run • n_init • Number of times k-means algo will run with different initialization points • init • Method you want to initialize with • precompute_distances • Selection of Yes, No, or let the machine decide • Tol • How tolerable should the algo be when it converges • n_jobs • How many CPUs do you want to engage when running the algo • random_state • What instance should be the starting point for the algo
  • 17.
    n_clusters: choosing k •View the variance • cdist is the distance between sets of observations • pdist is the pairwise distances between observations in the same set
  • 18.
    n_clusters: choosing k Step1: Determine your k range Step 2: Fit the k-means model for each n_clusters = k Step 3: Pull out the cluster centers for each model
  • 19.
    n_clusters: choosing k Step4: Calculate Euclidean distance from each point to each cluster center Step 5: Total within-cluster sum of squares Step 6: Total sum of squares Step 7: Difference between-cluster sum of squares
  • 20.
    n_clusters: choosing k •Graphing the variance
  • 21.
  • 22.
    n_clusters: choosing k •n_clusters = 8 (default)
  • 23.
    init Methods and theirmeaning: • k-means++ • Selects initial clusters in a way that speeds up convergence • random • Choose k rows at random for initial centroids • Ndarray that gives initial centers • (n_clusters, n_features)
  • 24.
    K-means (8) n_clusters =8, init = kmeans++ n_clusters = 8, init = random
  • 25.
    K-means (7) n_clusters =7, init = kmeans++ n_clusters = 7, init = random
  • 26.
    Comparing Results: SilhouetteScore • Silhouette coefficient • Not black and white, lots of gray • Average distance between data observations and other data in cluster • Average distance between data observations and all other points in the NEXT nearest cluster • Silhouette score in scikit-learn • Average silhouette coefficient for all data observations • The closer to 1, the better the fit • Computation time increases with larger datasets
  • 27.
  • 28.
    What Do theResults Say? • Data patterns may in fact exist • Similar observations can be grouped • We need additional discovery
  • 29.
    A Few Hacks •Clustering is a great way to explore your data and develop intution • Too many features create a problem for understanding • Use dimensionality reduction • Use clustering with other methods
  • 30.
    Let’s Connect • Twitter:@DamianMingle • LinkedIn: DamianRMingle • Sign-up for Data Science Hacks