Download to read offline
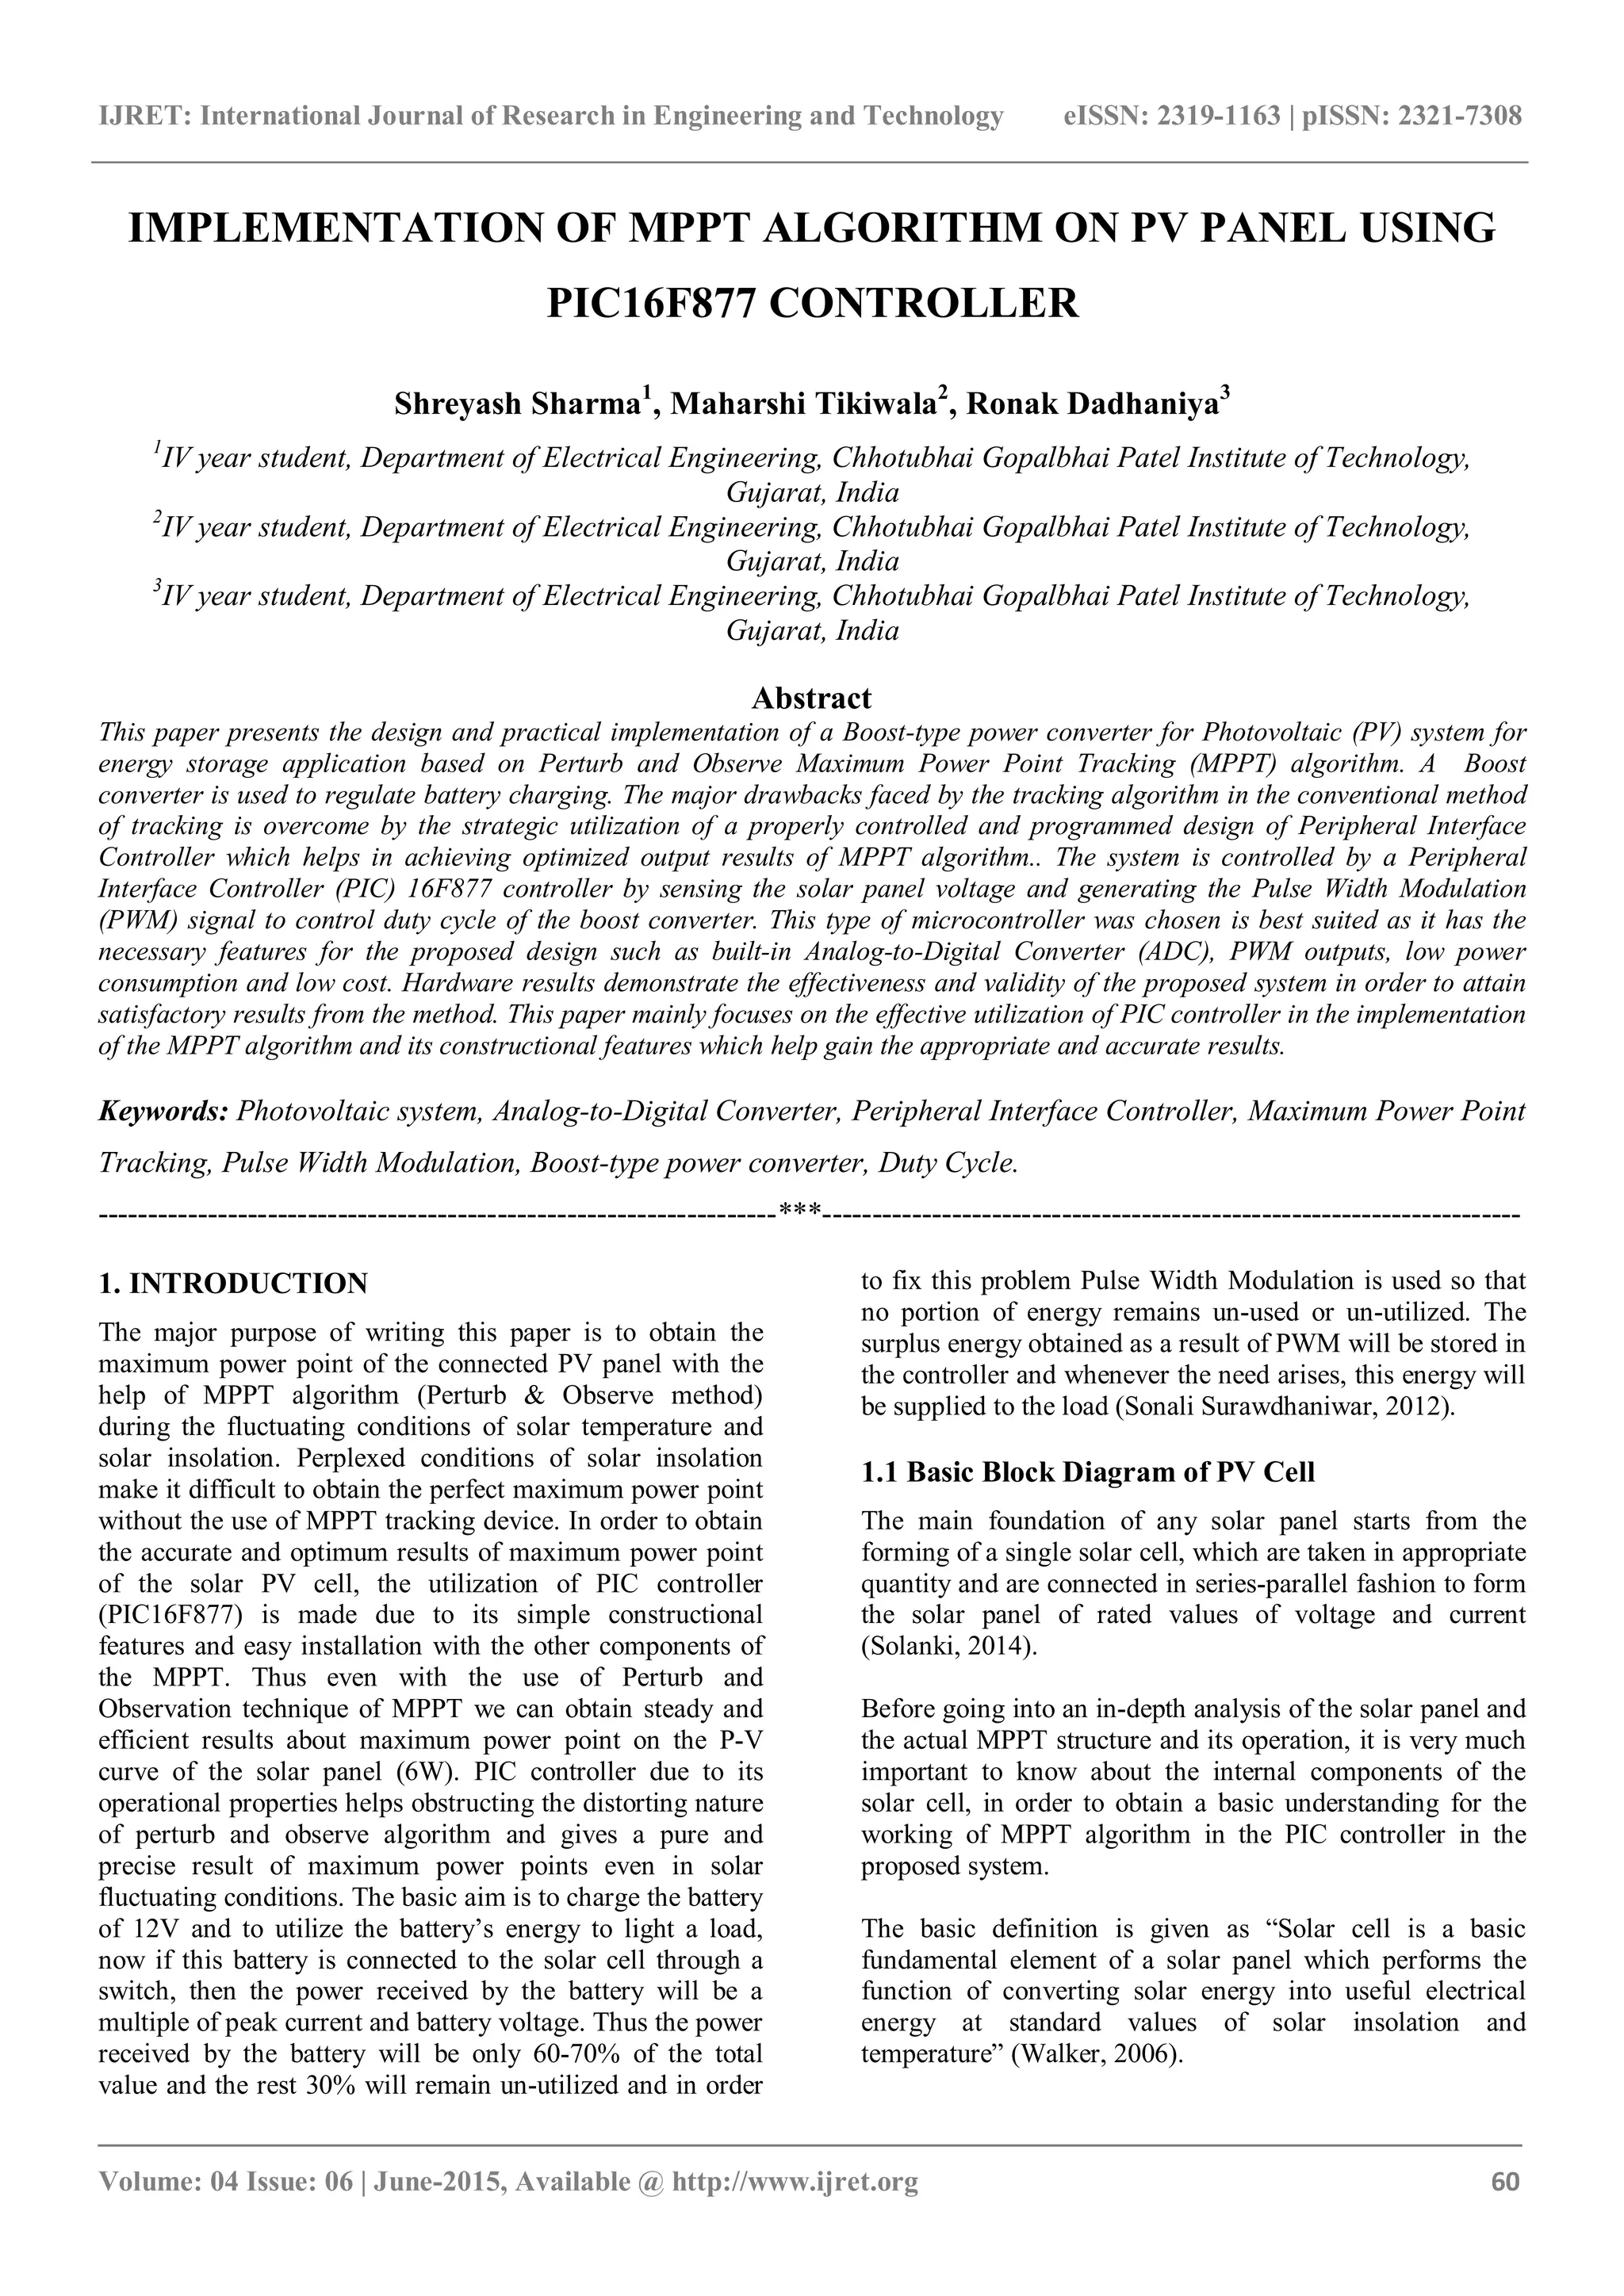
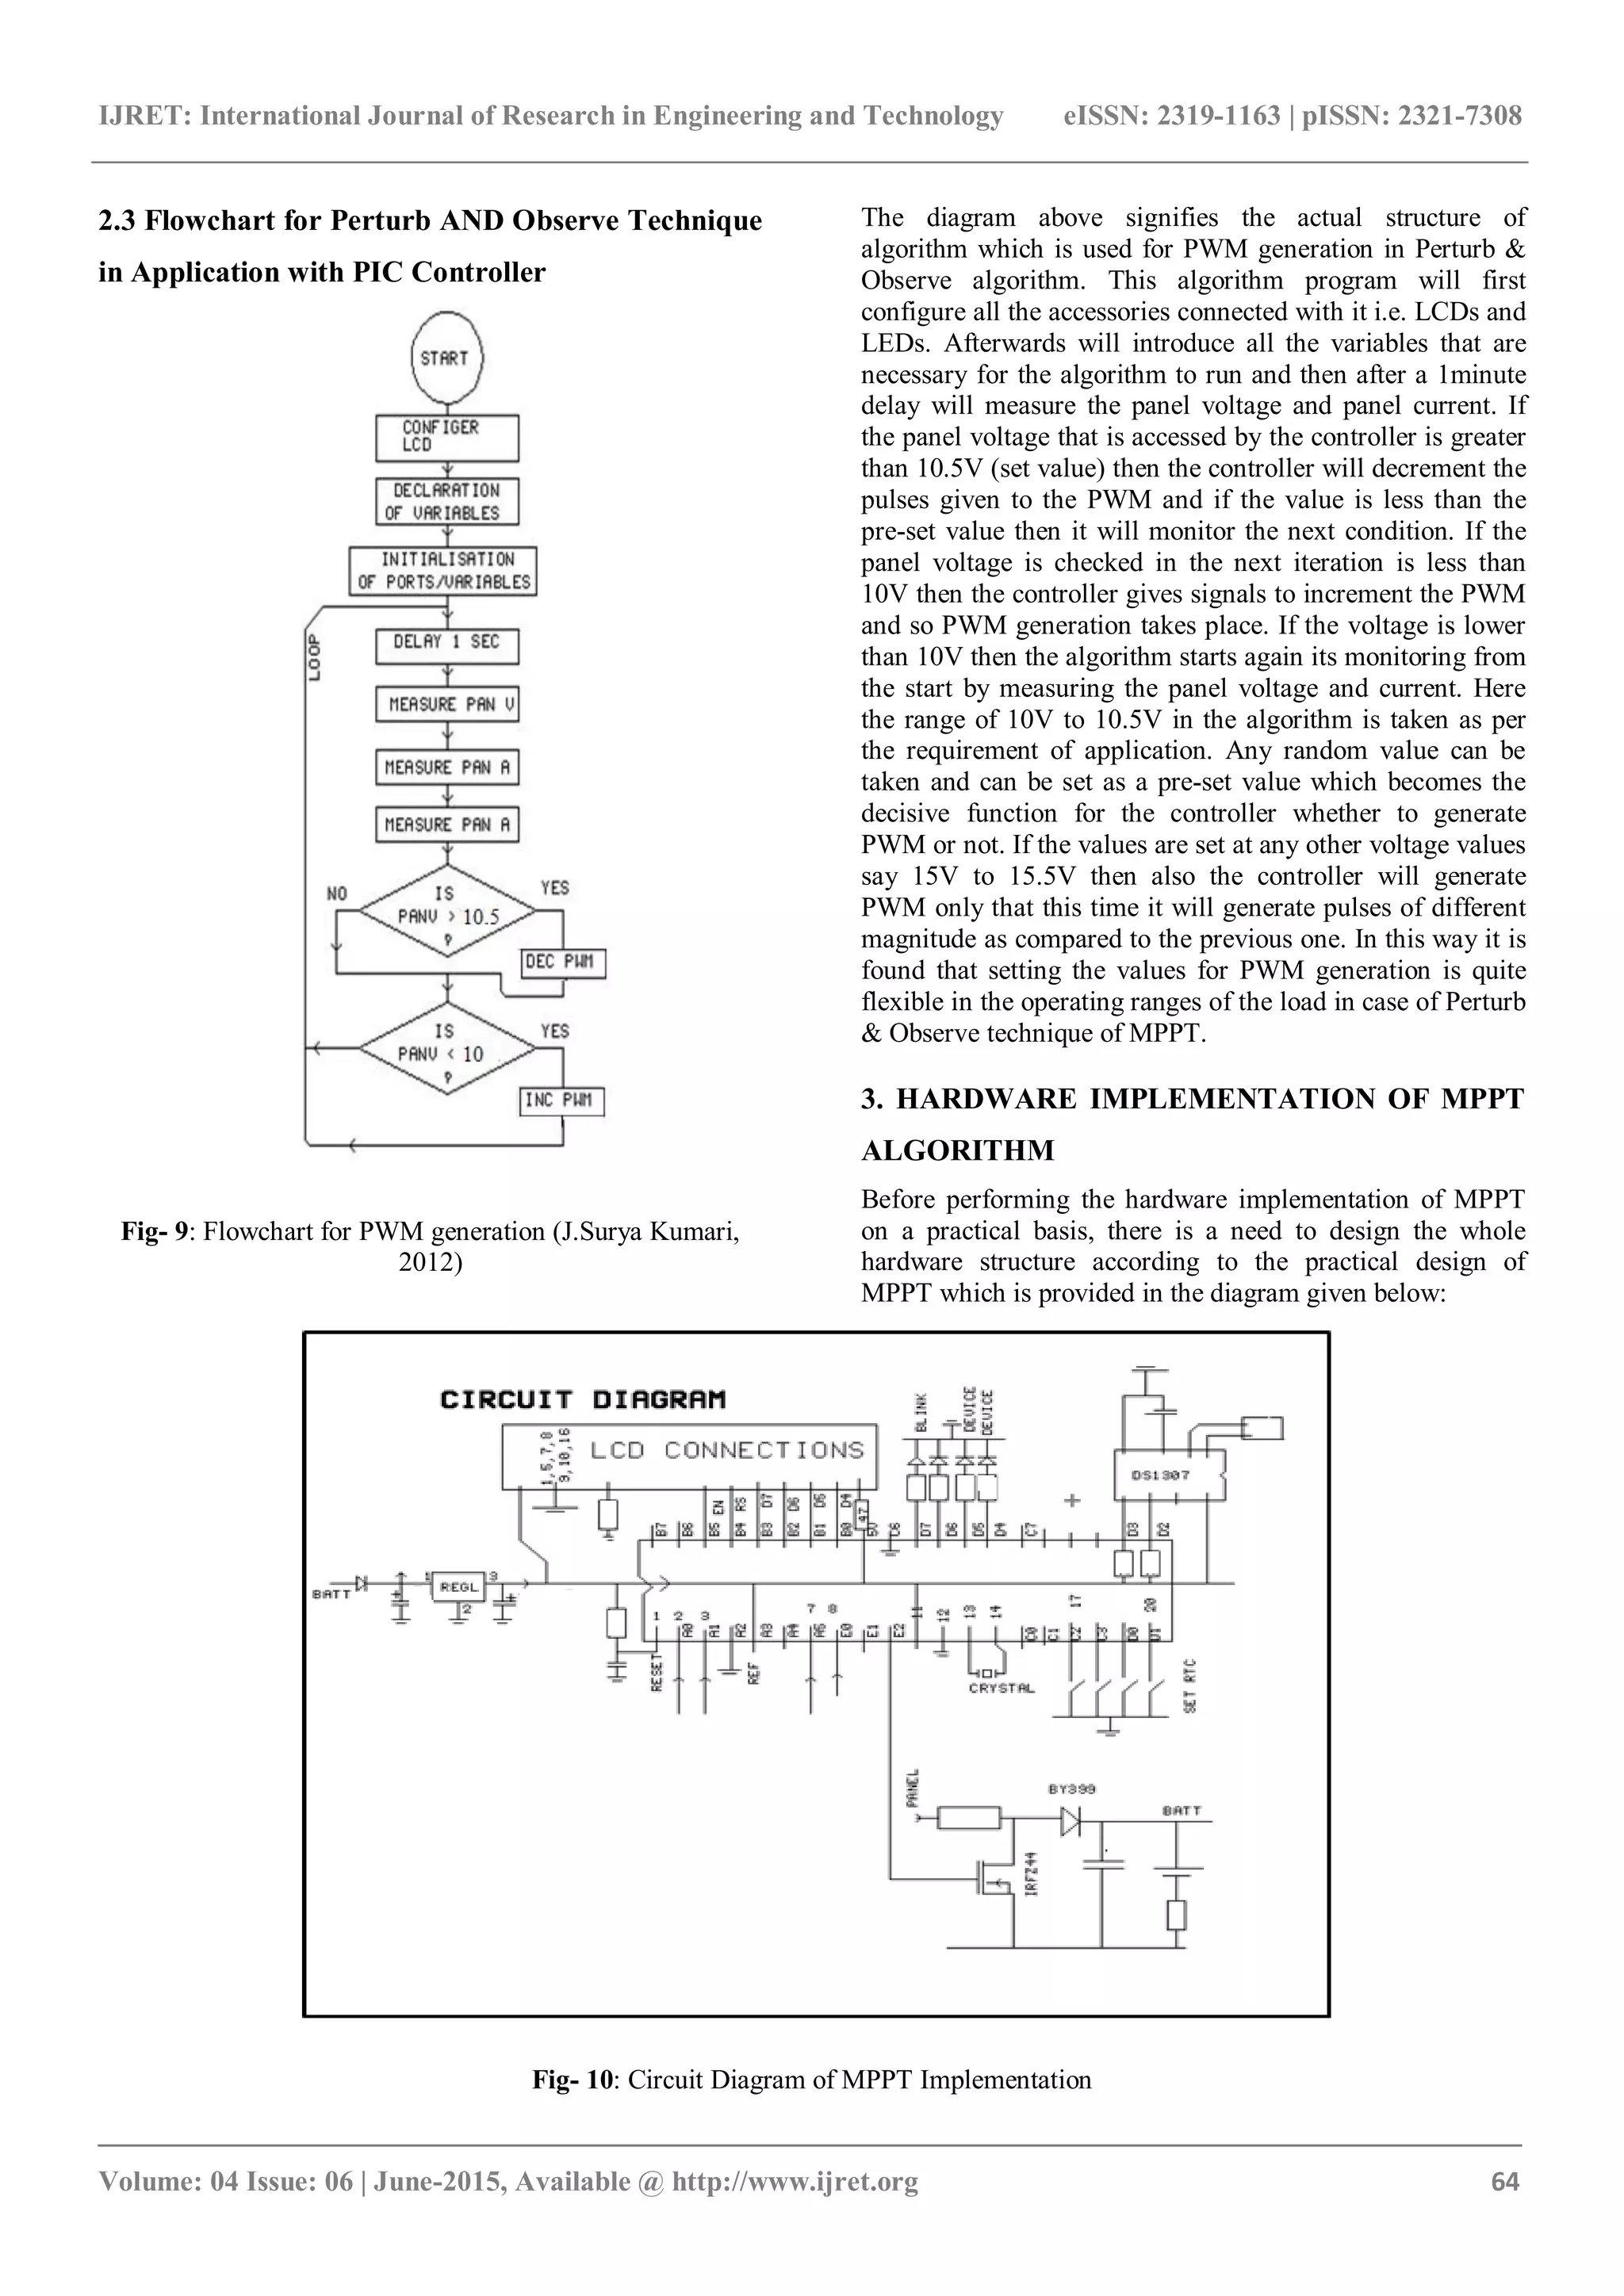
![IJRET: International Journal of Research in Engineering and Technology eISSN: 2319-1163 | pISSN: 2321-7308 _______________________________________________________________________________________ Volume: 04 Issue: 06 | June-2015, Available @ http://www.ijret.org 66 Fig- 13: Different values of voltage and current while tracking the maximum power. Fig- 14: Value of maximum power achieved after the oscillations performed by the controller The diagram shown above signifies that the maximum power point tracking conditions that are required for our conditions are fully satisfied and thus it is verified that with the help of perturb and observe technique we can obtain the required value of maximum power of the panel. 4. CONCLUSION From the above performance of Perturb and Observe algorithm it is clear that the MPPT power obtained after the boost converter varies the voltage level, will result in the power nearly as same as the power which is obtained from the PV panel. This means that by controlling the PWM of the boost converter, we have obtained the maximum power. By using the PIC controller, the maximum power is delivered by the panel and 12V battery is charged respectively and results are obtained smoothly and accurately. REFERENCES [1]. Geoff Walker, “Evaluating MPPT Converter Topologies Using A MATLAB PV Model” , University of Queensland, Australia, 2002. [2]. ArjavHarjai, AbhishekBiswajit, and MryutunjaySandhibirgha, “Evaluation of Maximum Power Point Tracking Methods In Solar Photovoltaic Array,” Project Report, National Institute of Rourkela, Orissa, 2008. [3]. A. Dolara, R. Faranda, S. Leva. “Energy Comparison of Seven MPPT Techniques for PV Systems”. Electromagnetic Analysis & Applications, 2009, 3: pp-152-162. [4]. BiswajitSethy, “Application Of Sliding Mode Technology In PV Maximum Power Point Tracking Systems “PhD Thesis Report, National Institute of Rourkela, Orissa, 2010. [5]. SonaliSurawdhaniwar, RiteshDiwan. An Improved Approach of Perturb and Observe Method Over Other Maximum Power Point Tracking Methods. International Journal of Recent Technology and Engineering (IJRTE)](https://image.slidesharecdn.com/implementationofmpptalgorithmonpvpanelusingpic16f877controller-160906092451/75/Implementation-of-mppt-algorithm-on-pv-panel-using-pic16-f877-controller-7-2048.jpg)
![IJRET: International Journal of Research in Engineering and Technology eISSN: 2319-1163 | pISSN: 2321-7308 _______________________________________________________________________________________ Volume: 04 Issue: 06 | June-2015, Available @ http://www.ijret.org 67 ISSN: 2277-3878, Volume-1, Issue-3, August 2012.pp- 137- 144. [6]. S.ZahraMirbagheri, SaadMekhilef, S. Mohsen Mirhassani. MPPT with Inc. Cond method using conventional interleaved boost converter. Mediterranean Green Energy Forum 2013 (MGEF-13).Energy Procedia 42 ( 2013 ) pp 24 – 32. [7]. Shridhar Sholapur, R.Mohan, T. R. Narsimhegowda. Boost Converter Topology for PV System with Perturb And Observe MPPT Algorithm. IOSR Journal of Electrical and Electronics Engineering (IOSR-JEEE) e-ISSN: 2278- 1676,p-ISSN: 2320-3331, Volume 9, Issue 4 Ver. II (Jul – Aug. 2014), pp- 50-56. [8]. Chetan Sinh Solanki, “Introduction to Photovoltaic Array”, Eastern Economy Edition, Chapter 4-8, 2014. BIOGRAPHIES Shreyash Sharma, IV year, Department of Electrical Engineering, Chhotubhai Gopalbhai Patel Institute of Technology, Bardoli (Gujarat) Email- shrey4sk@gmail.com Maharshi Tikiwala, IV year, Department of Electrical Engineering, Chhotubhai Gopalbhai Patel Institute of Technology, Bardoli (Gujarat) Email-maharshi.tkwala@gmail.com Ronak Dadhaniya, IV year, Department of Electrical Engineering, Chhotubhai Gopalbhai Patel Institute of Technology, Bardoli (Gujarat) Email- ronak.cd.ec@gmail.com](https://image.slidesharecdn.com/implementationofmpptalgorithmonpvpanelusingpic16f877controller-160906092451/75/Implementation-of-mppt-algorithm-on-pv-panel-using-pic16-f877-controller-8-2048.jpg)

This paper discusses the design and practical implementation of a boost-type power converter for photovoltaic systems using a perturb and observe maximum power point tracking (MPPT) algorithm with the PIC16F877 controller. It addresses challenges in traditional tracking methods and demonstrates the effective output of the MPPT system through hardware results. The study highlights the controller's features that enhance the solar power conversion process and presents the circuit design used for implementation.