Download to read offline


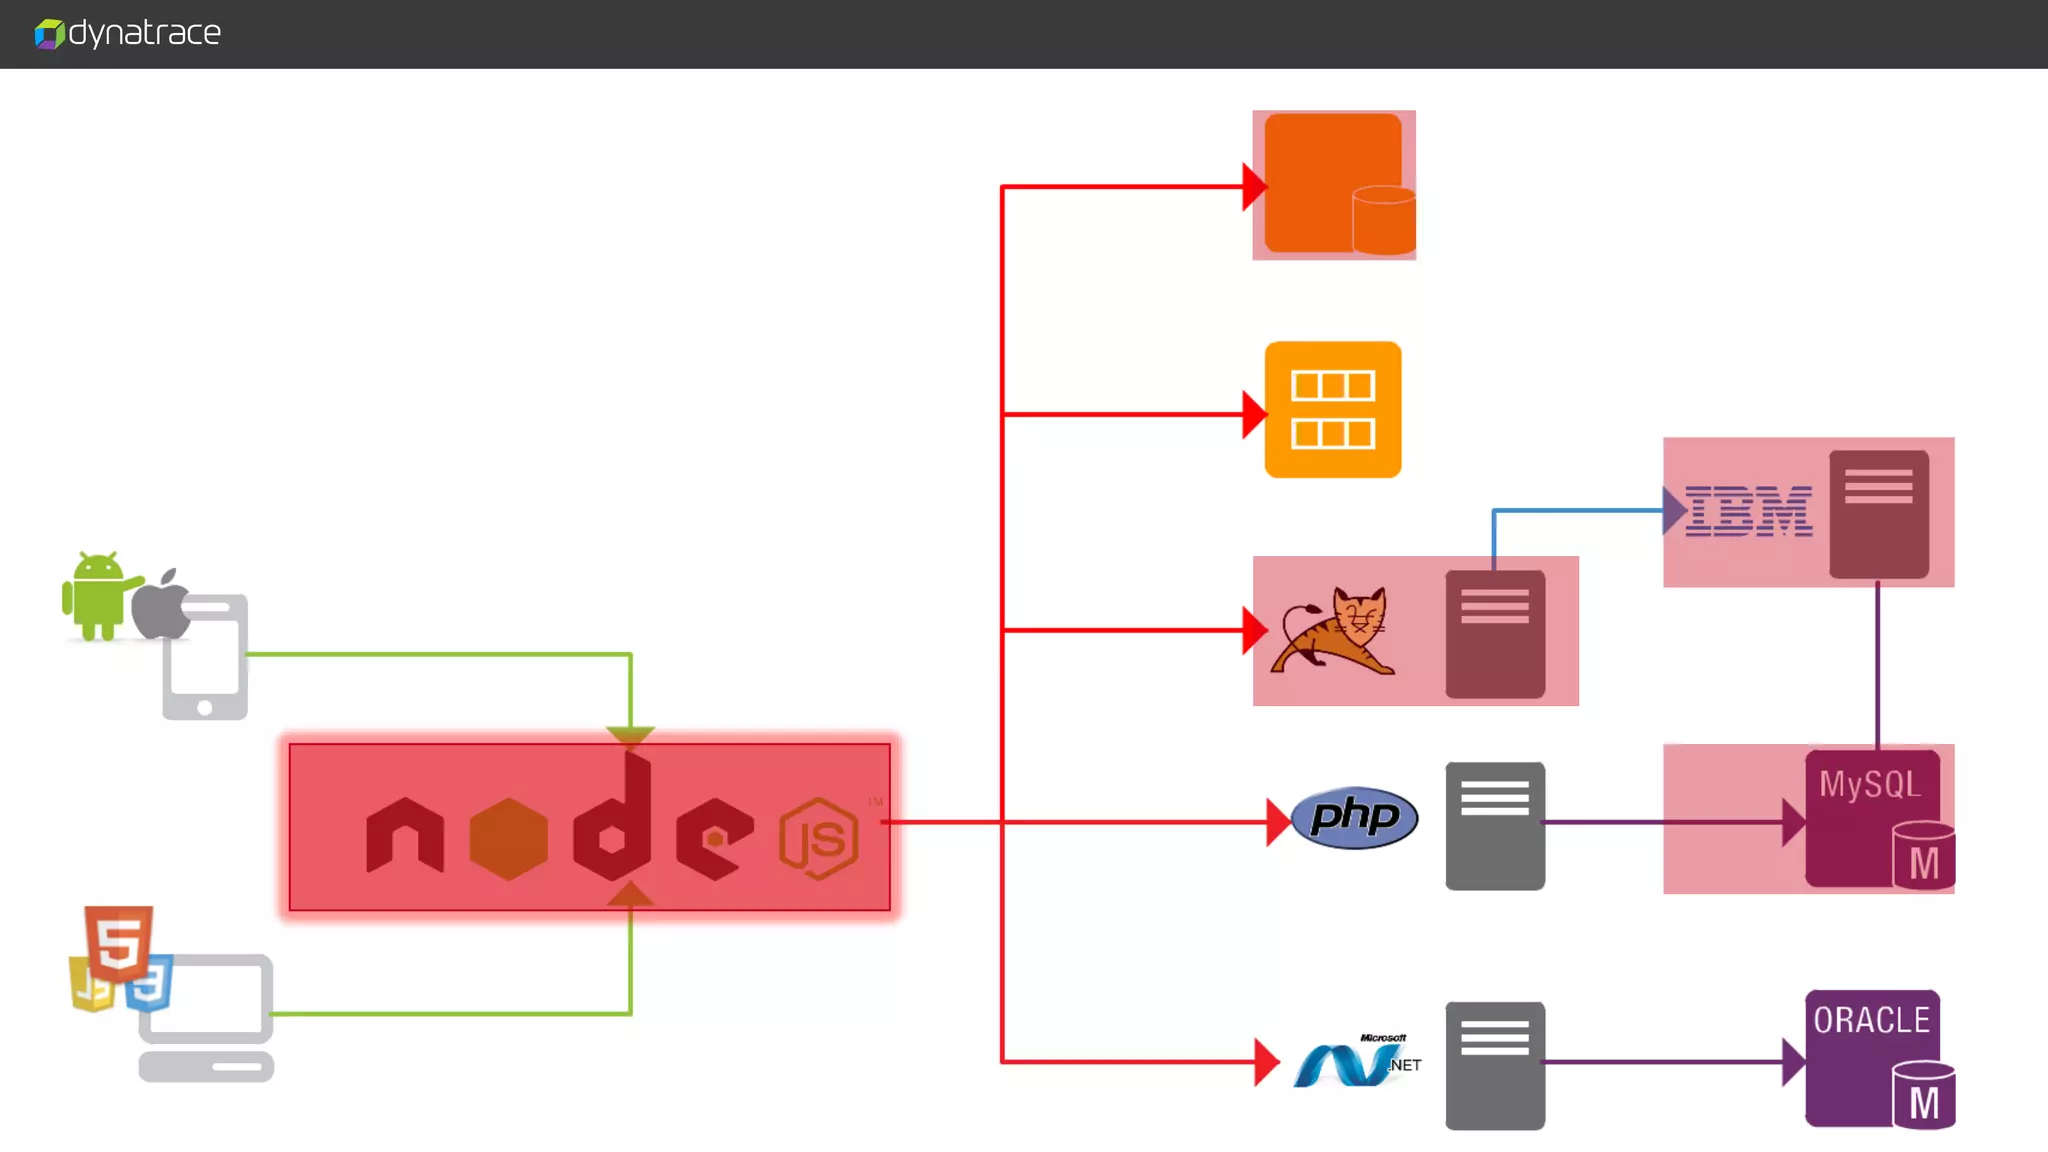


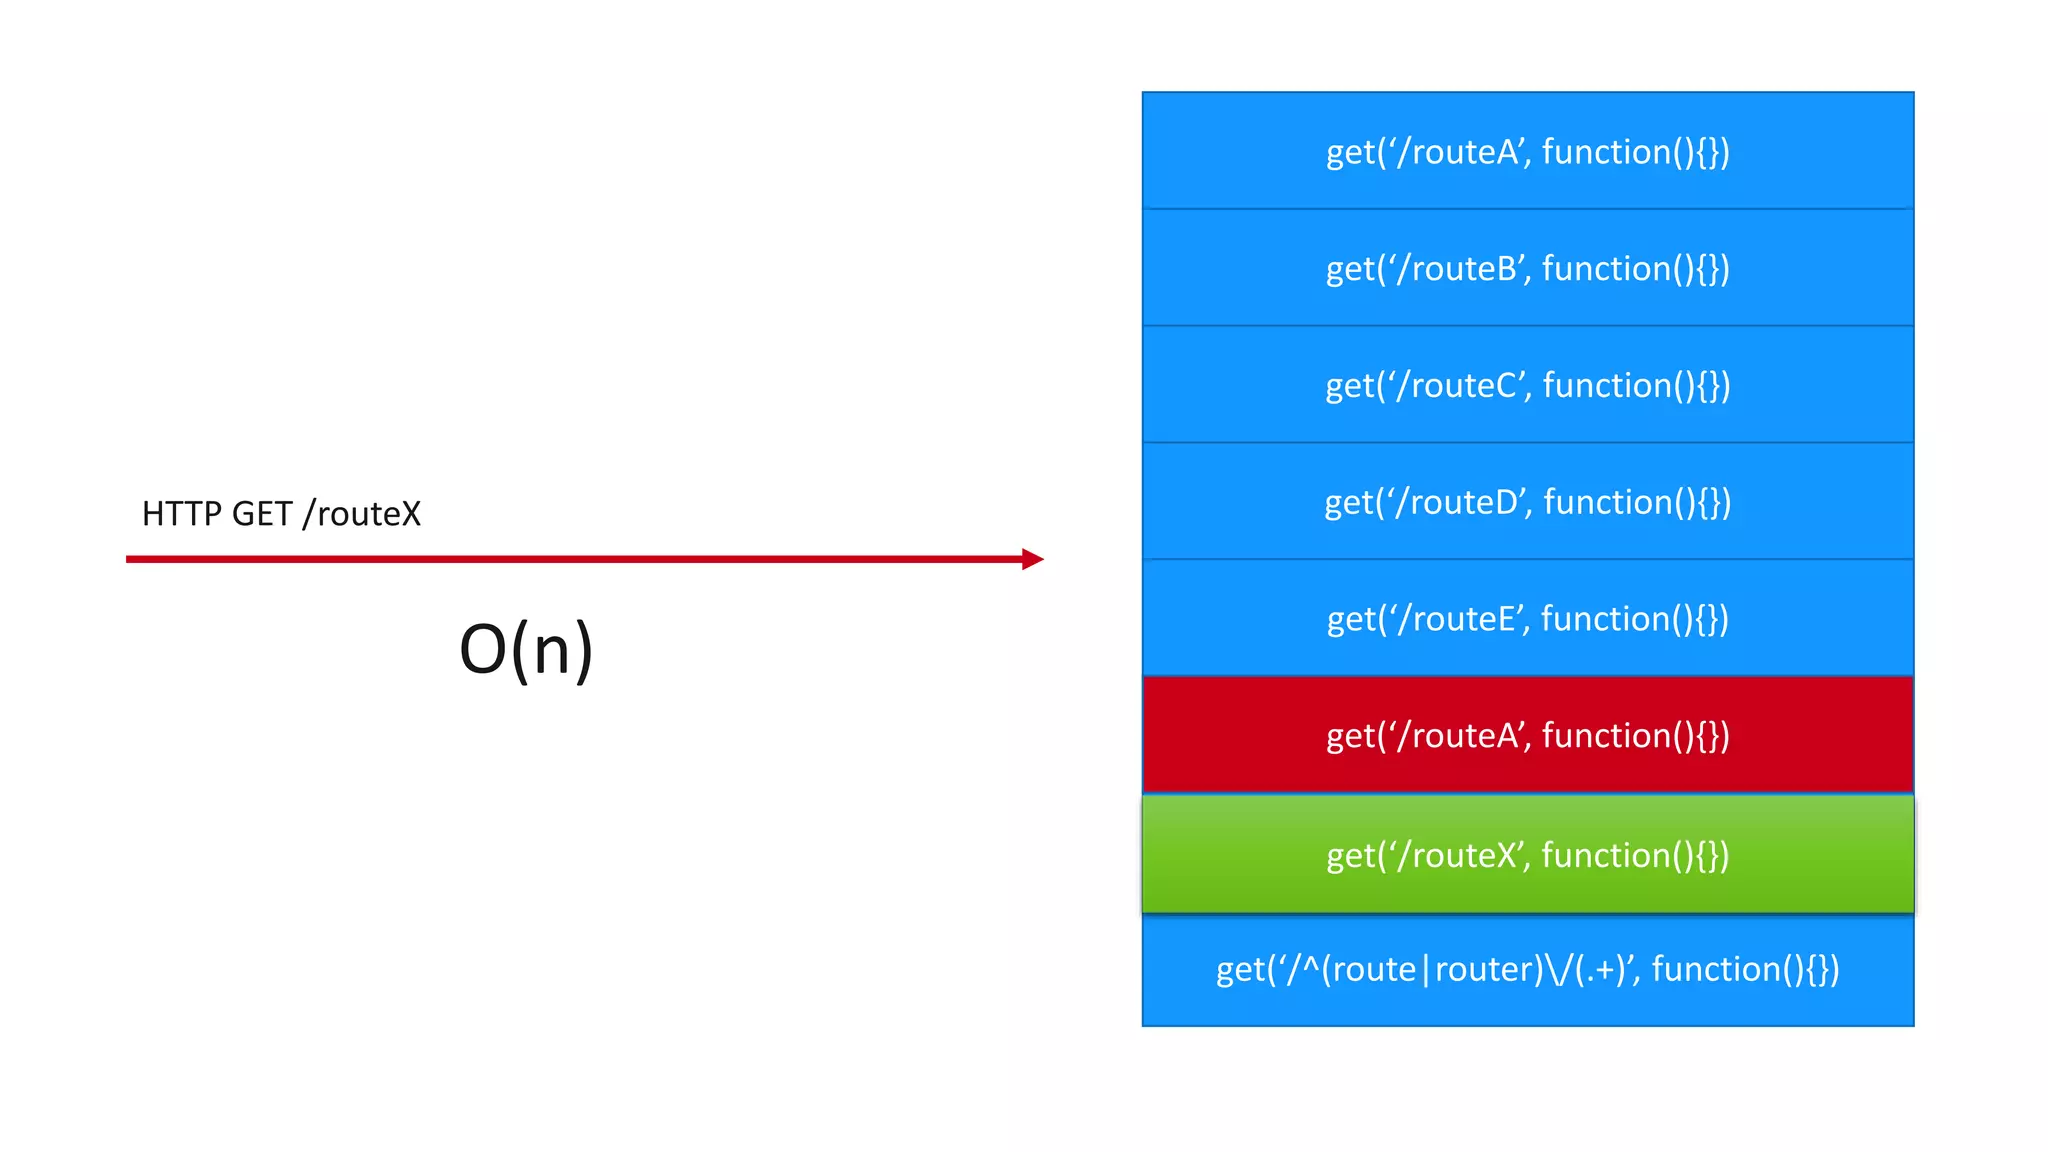


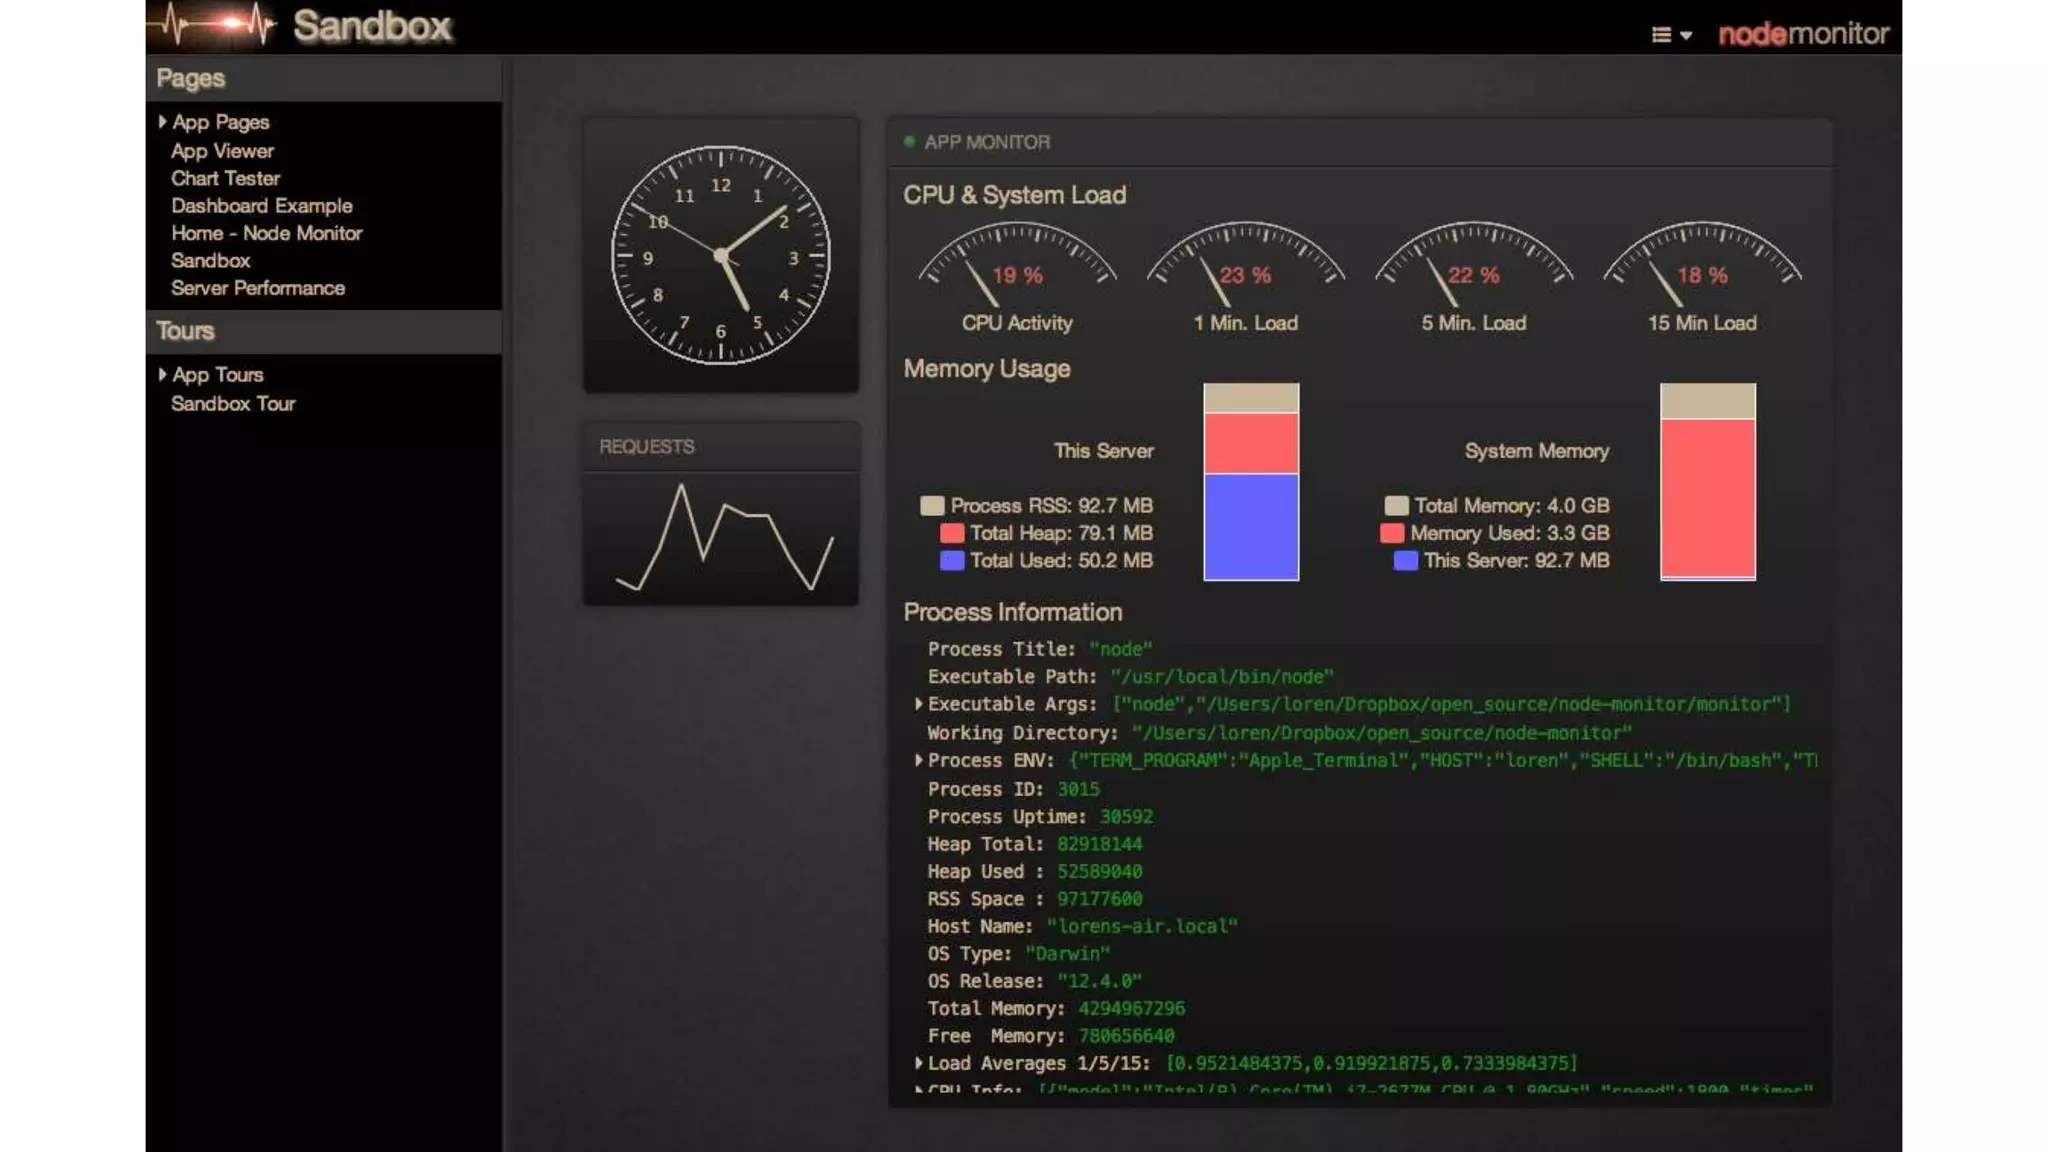
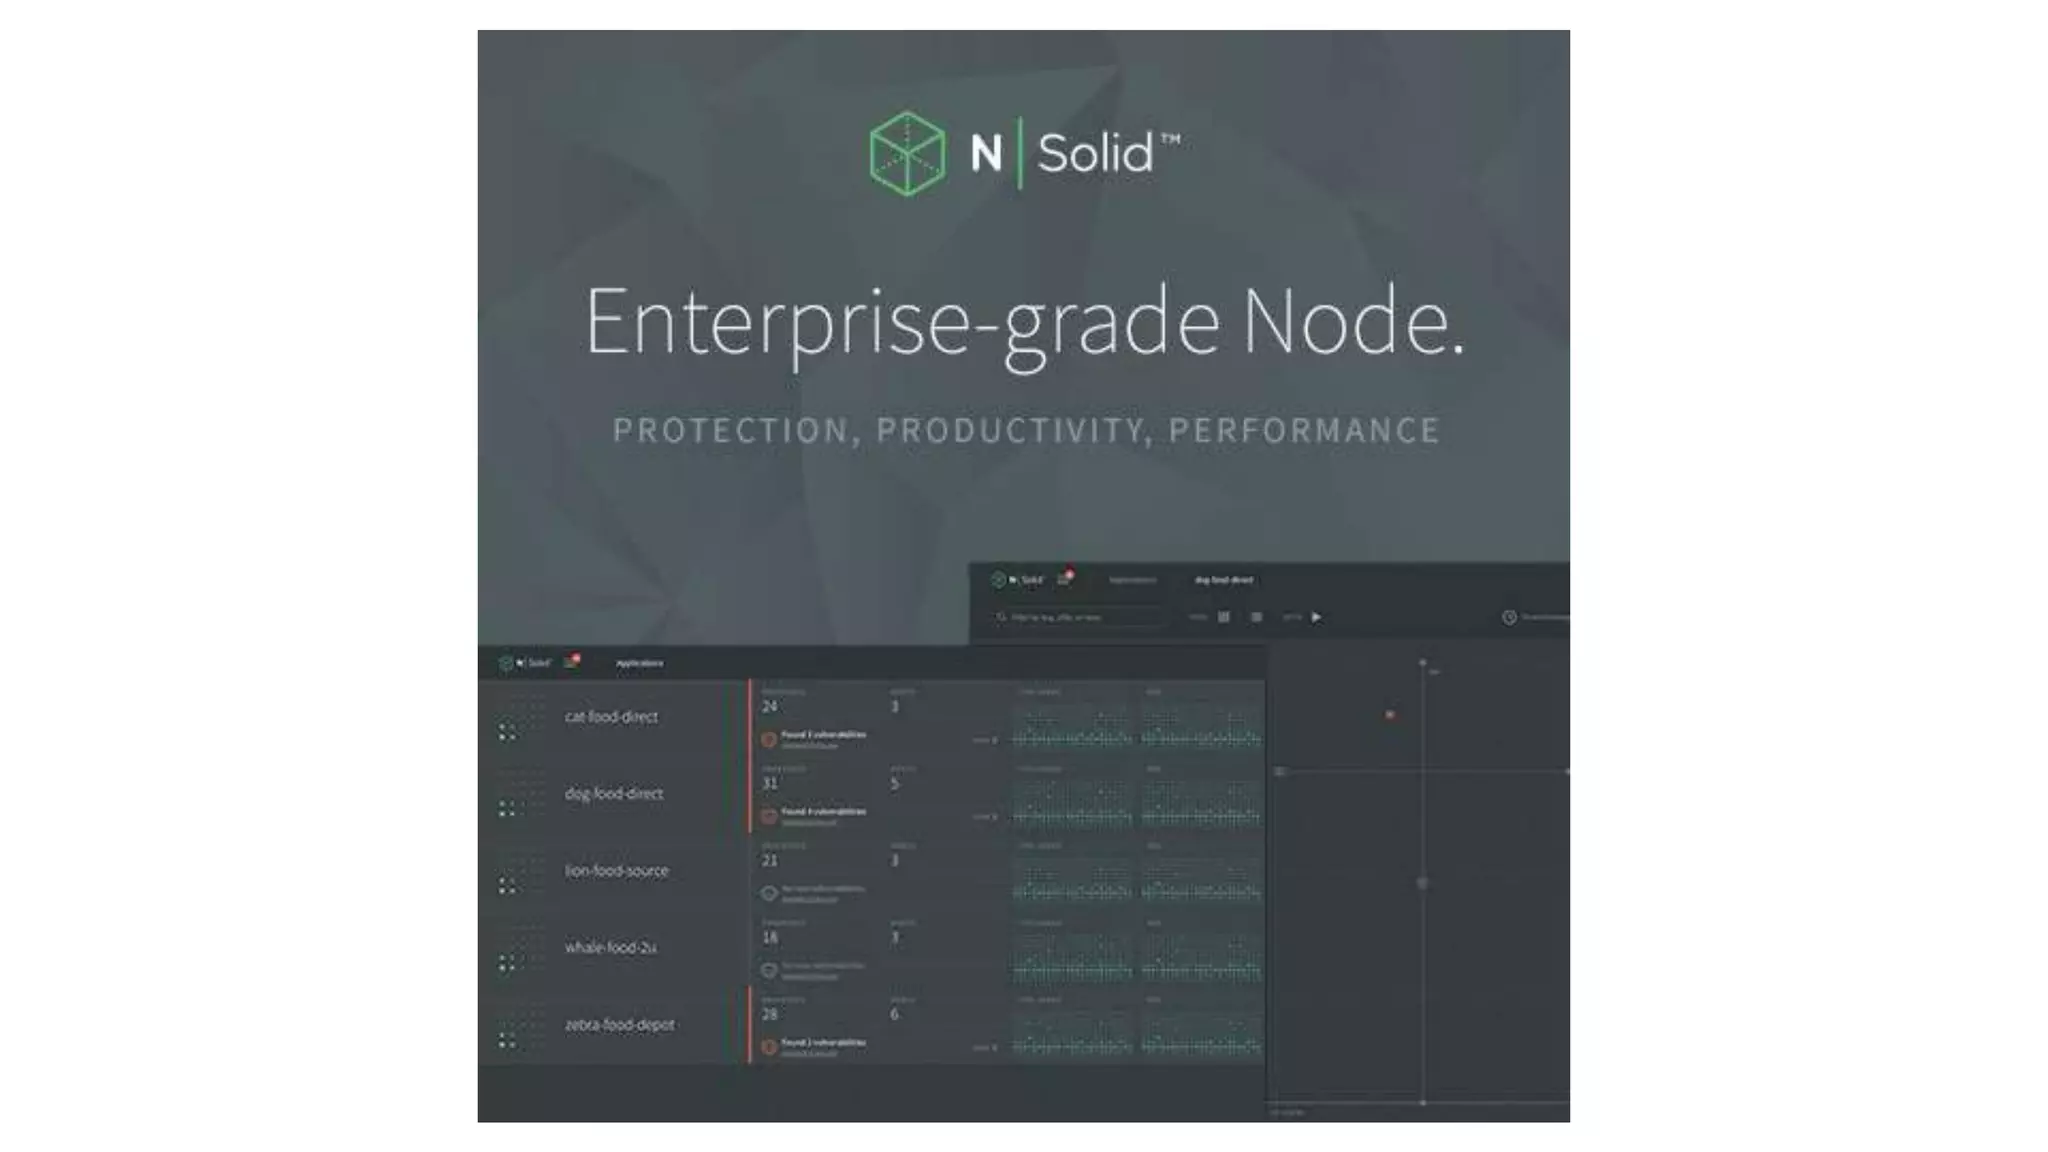
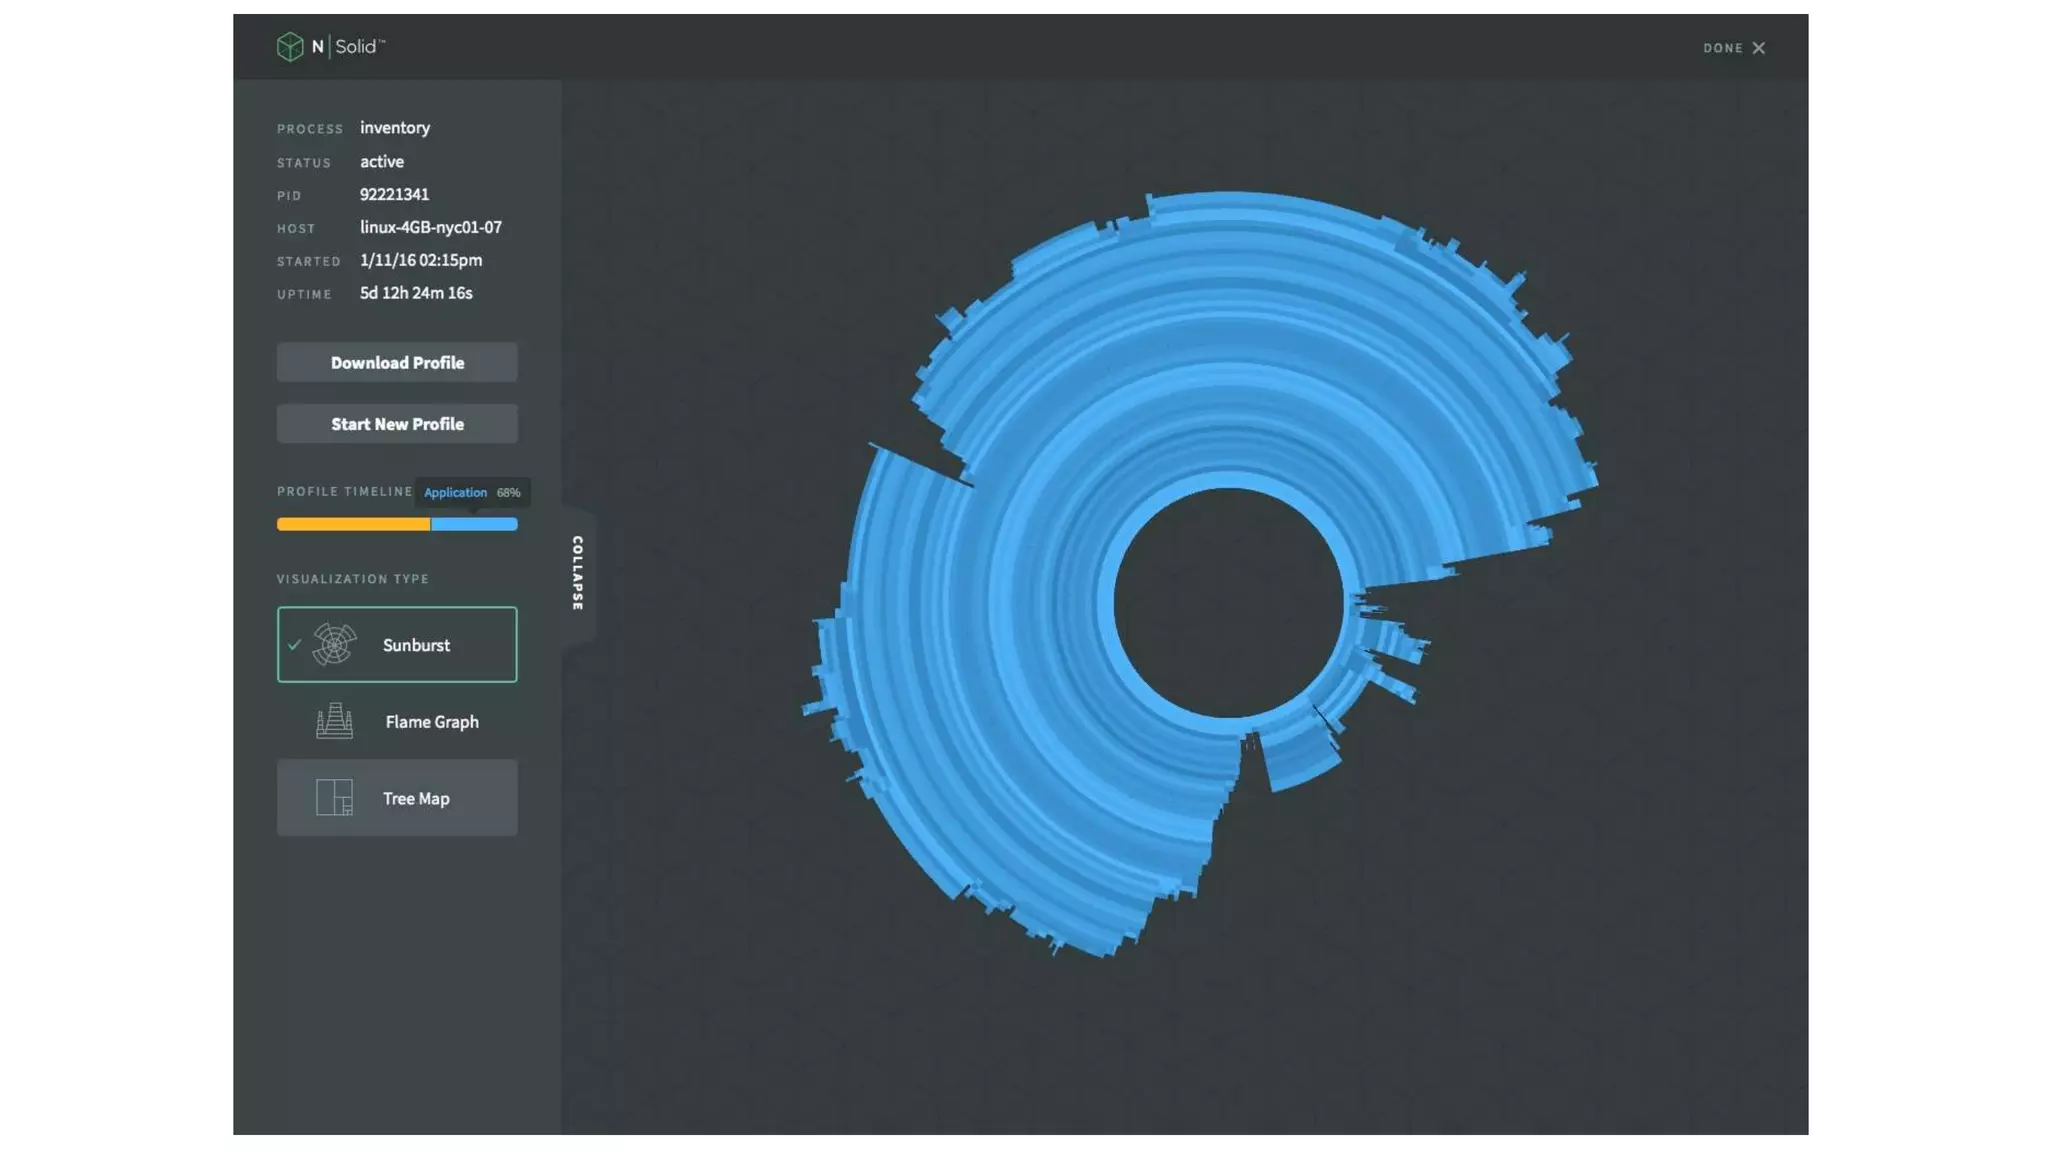
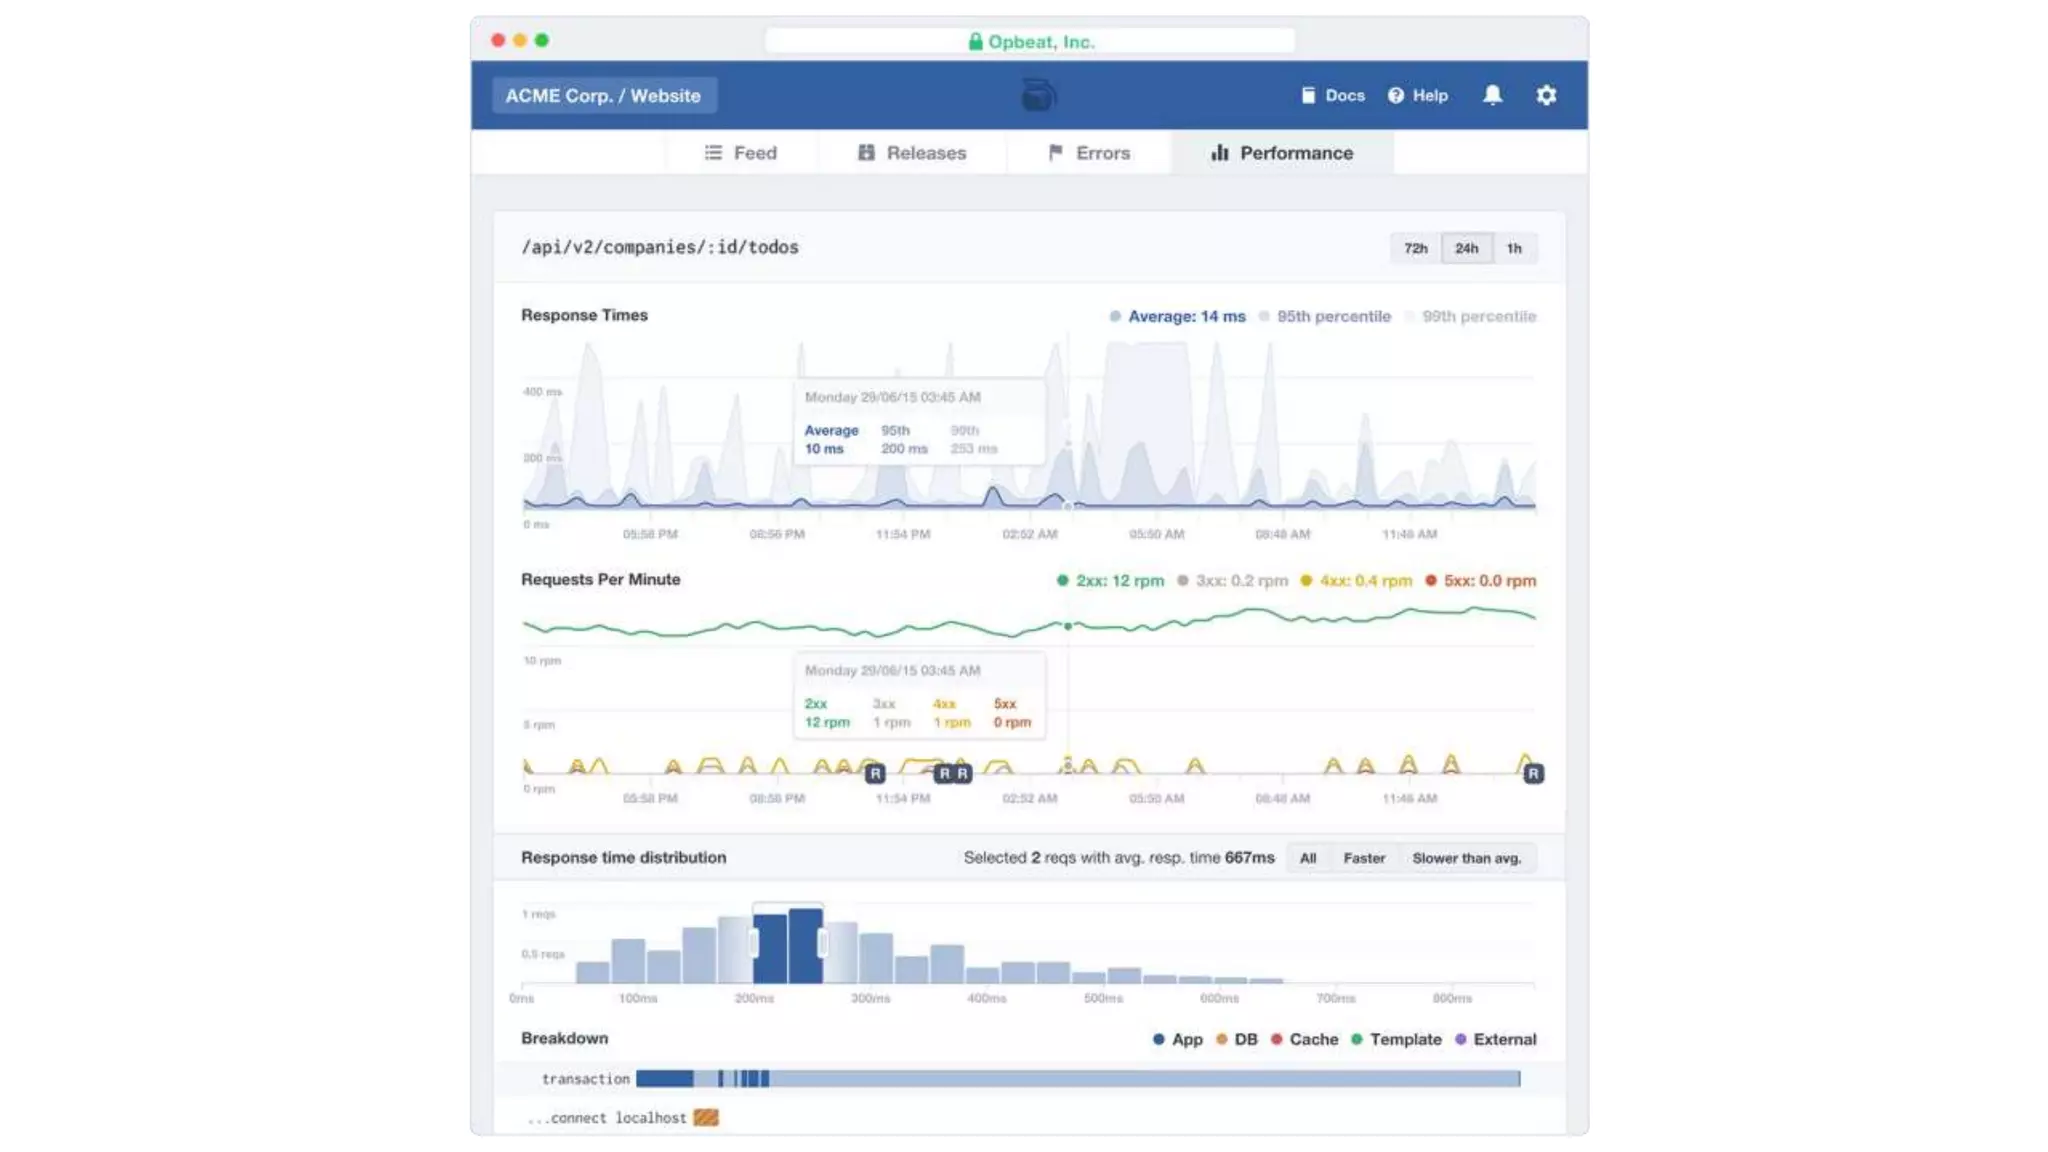
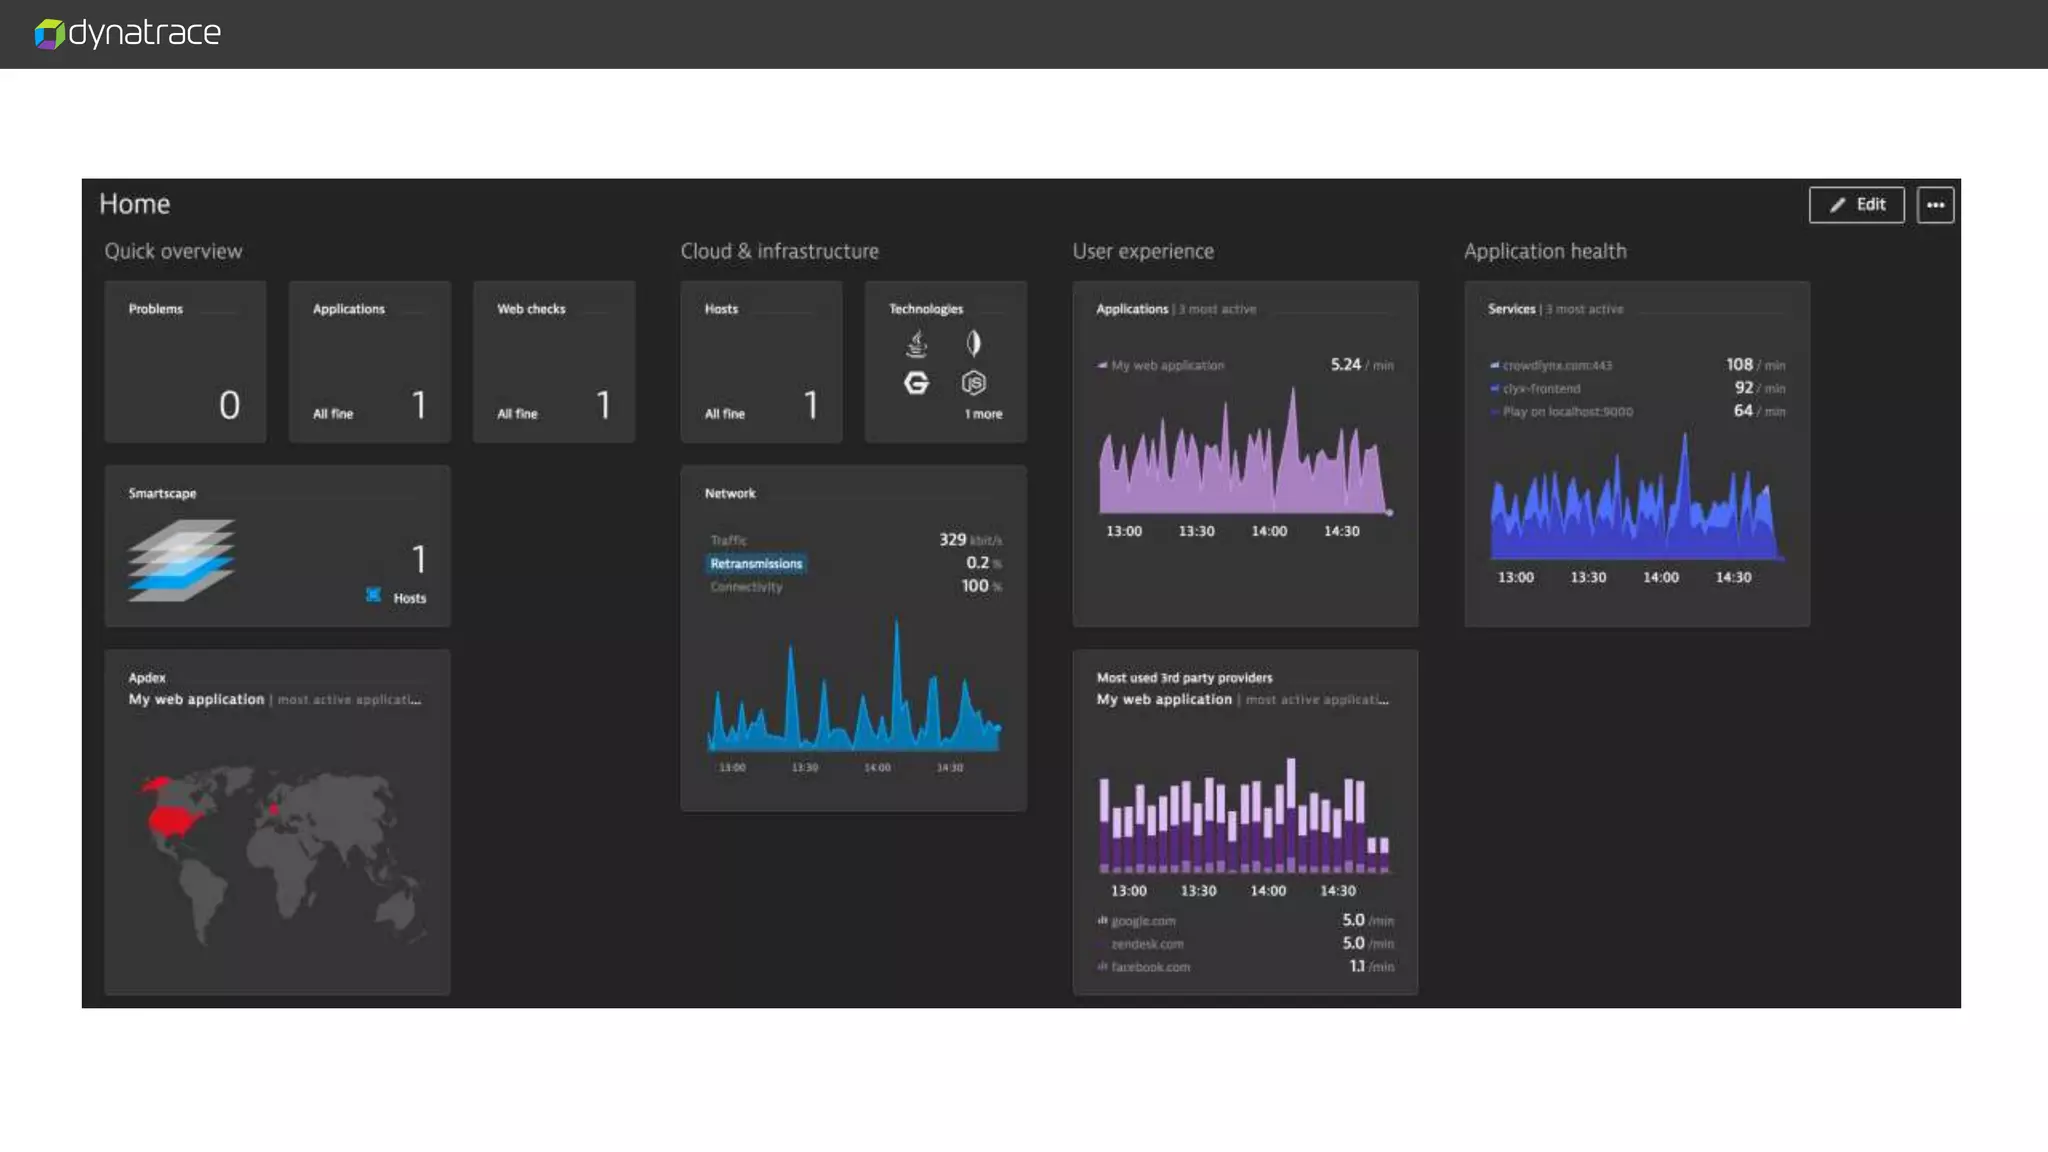
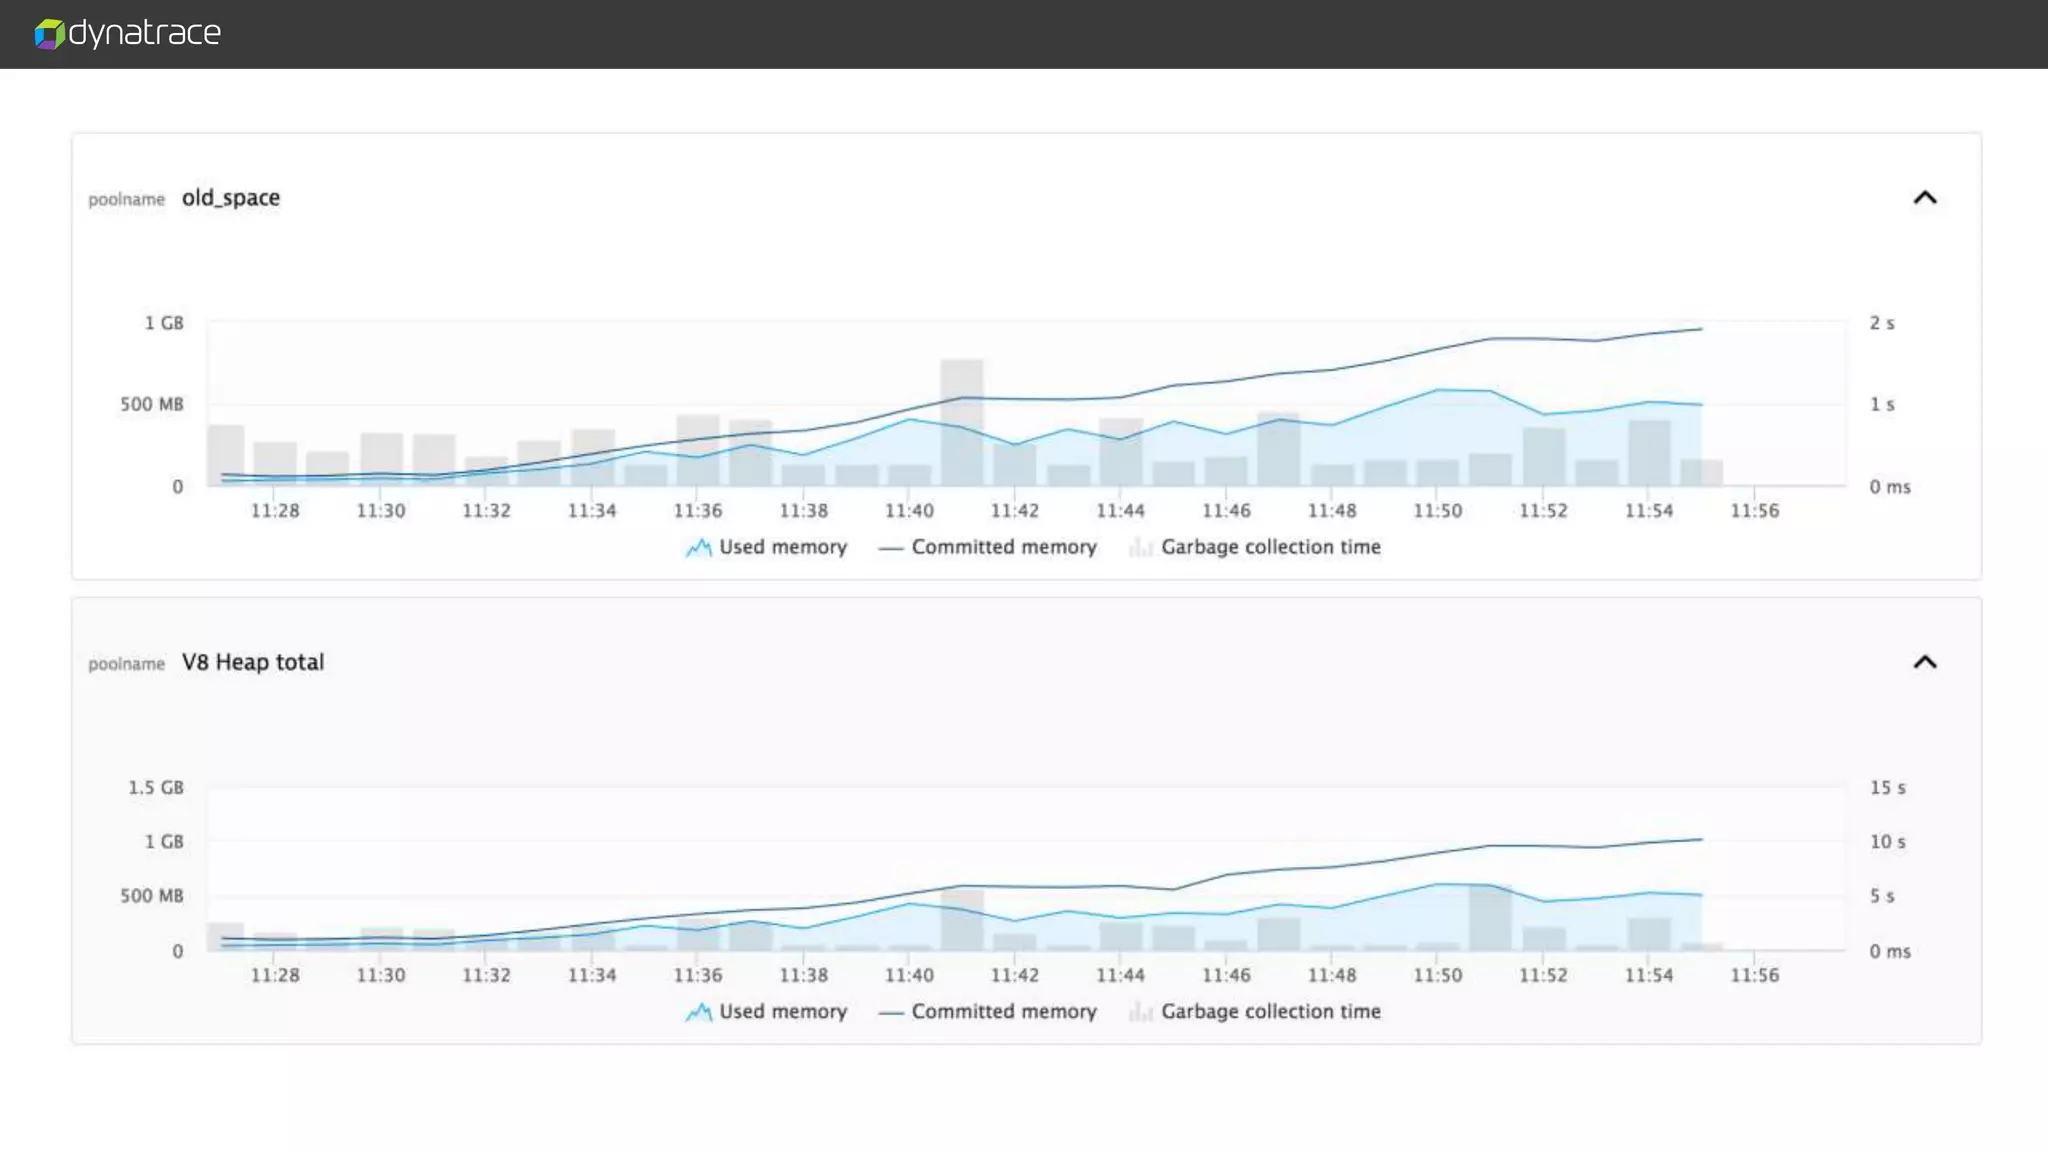

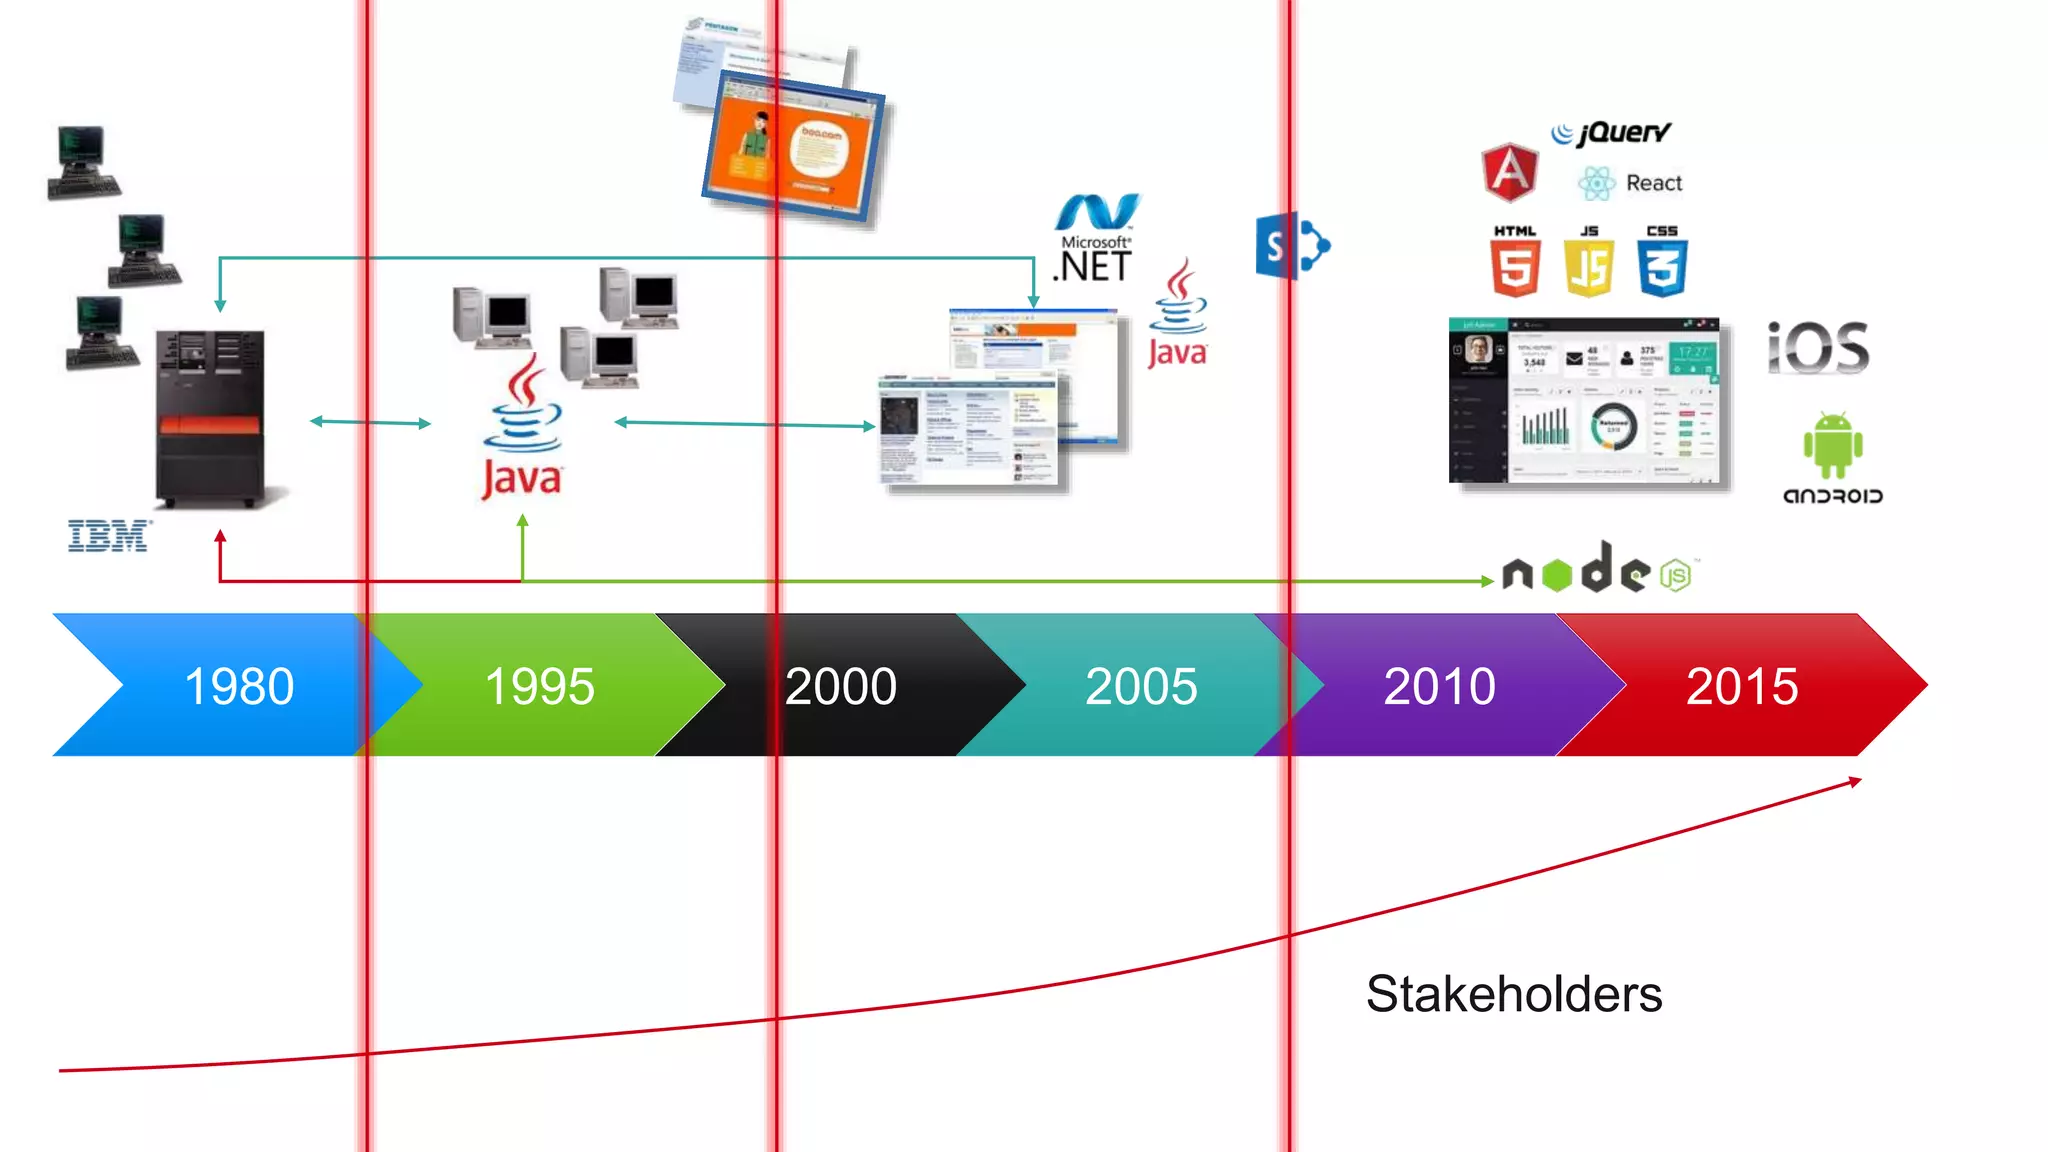

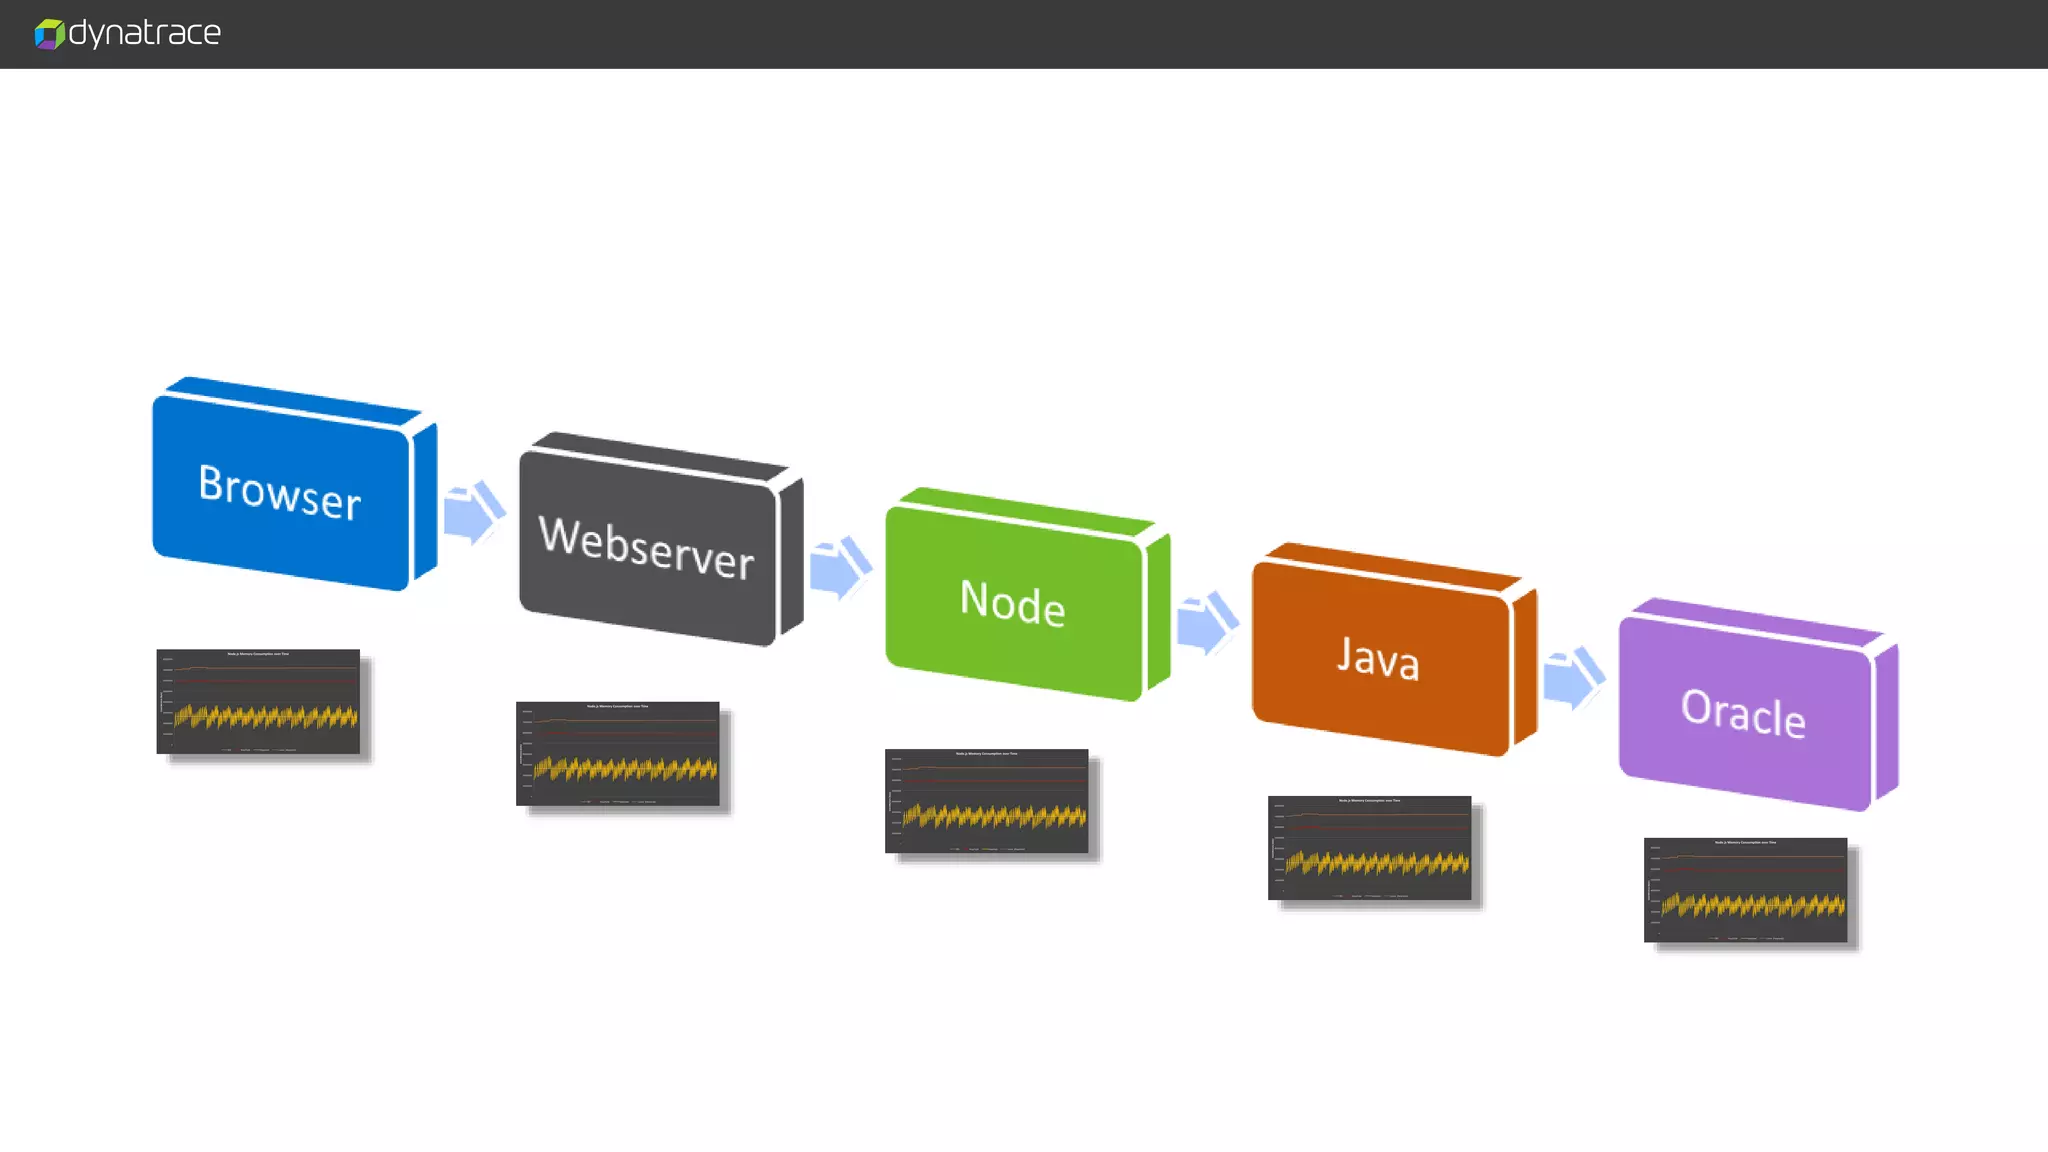


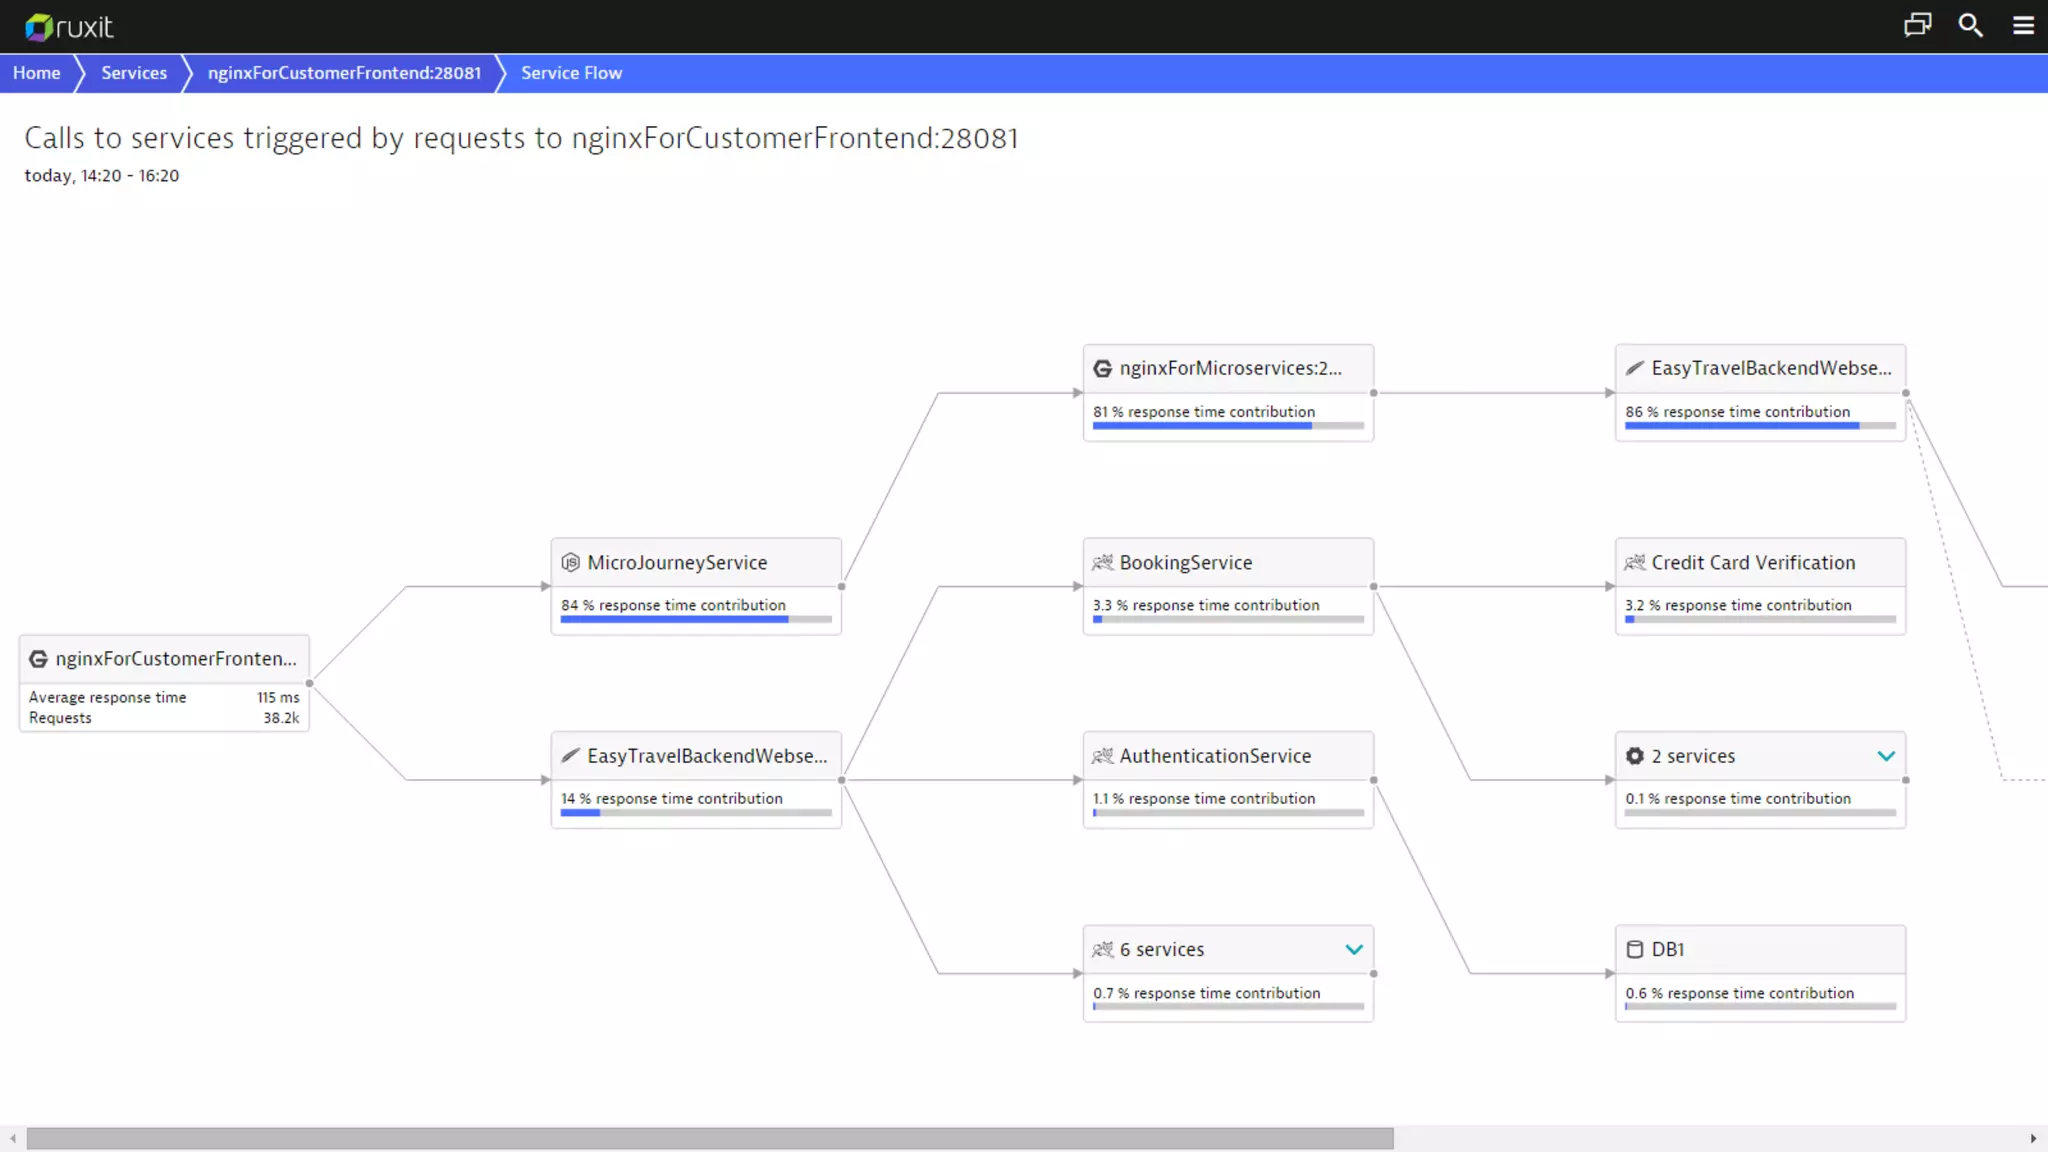
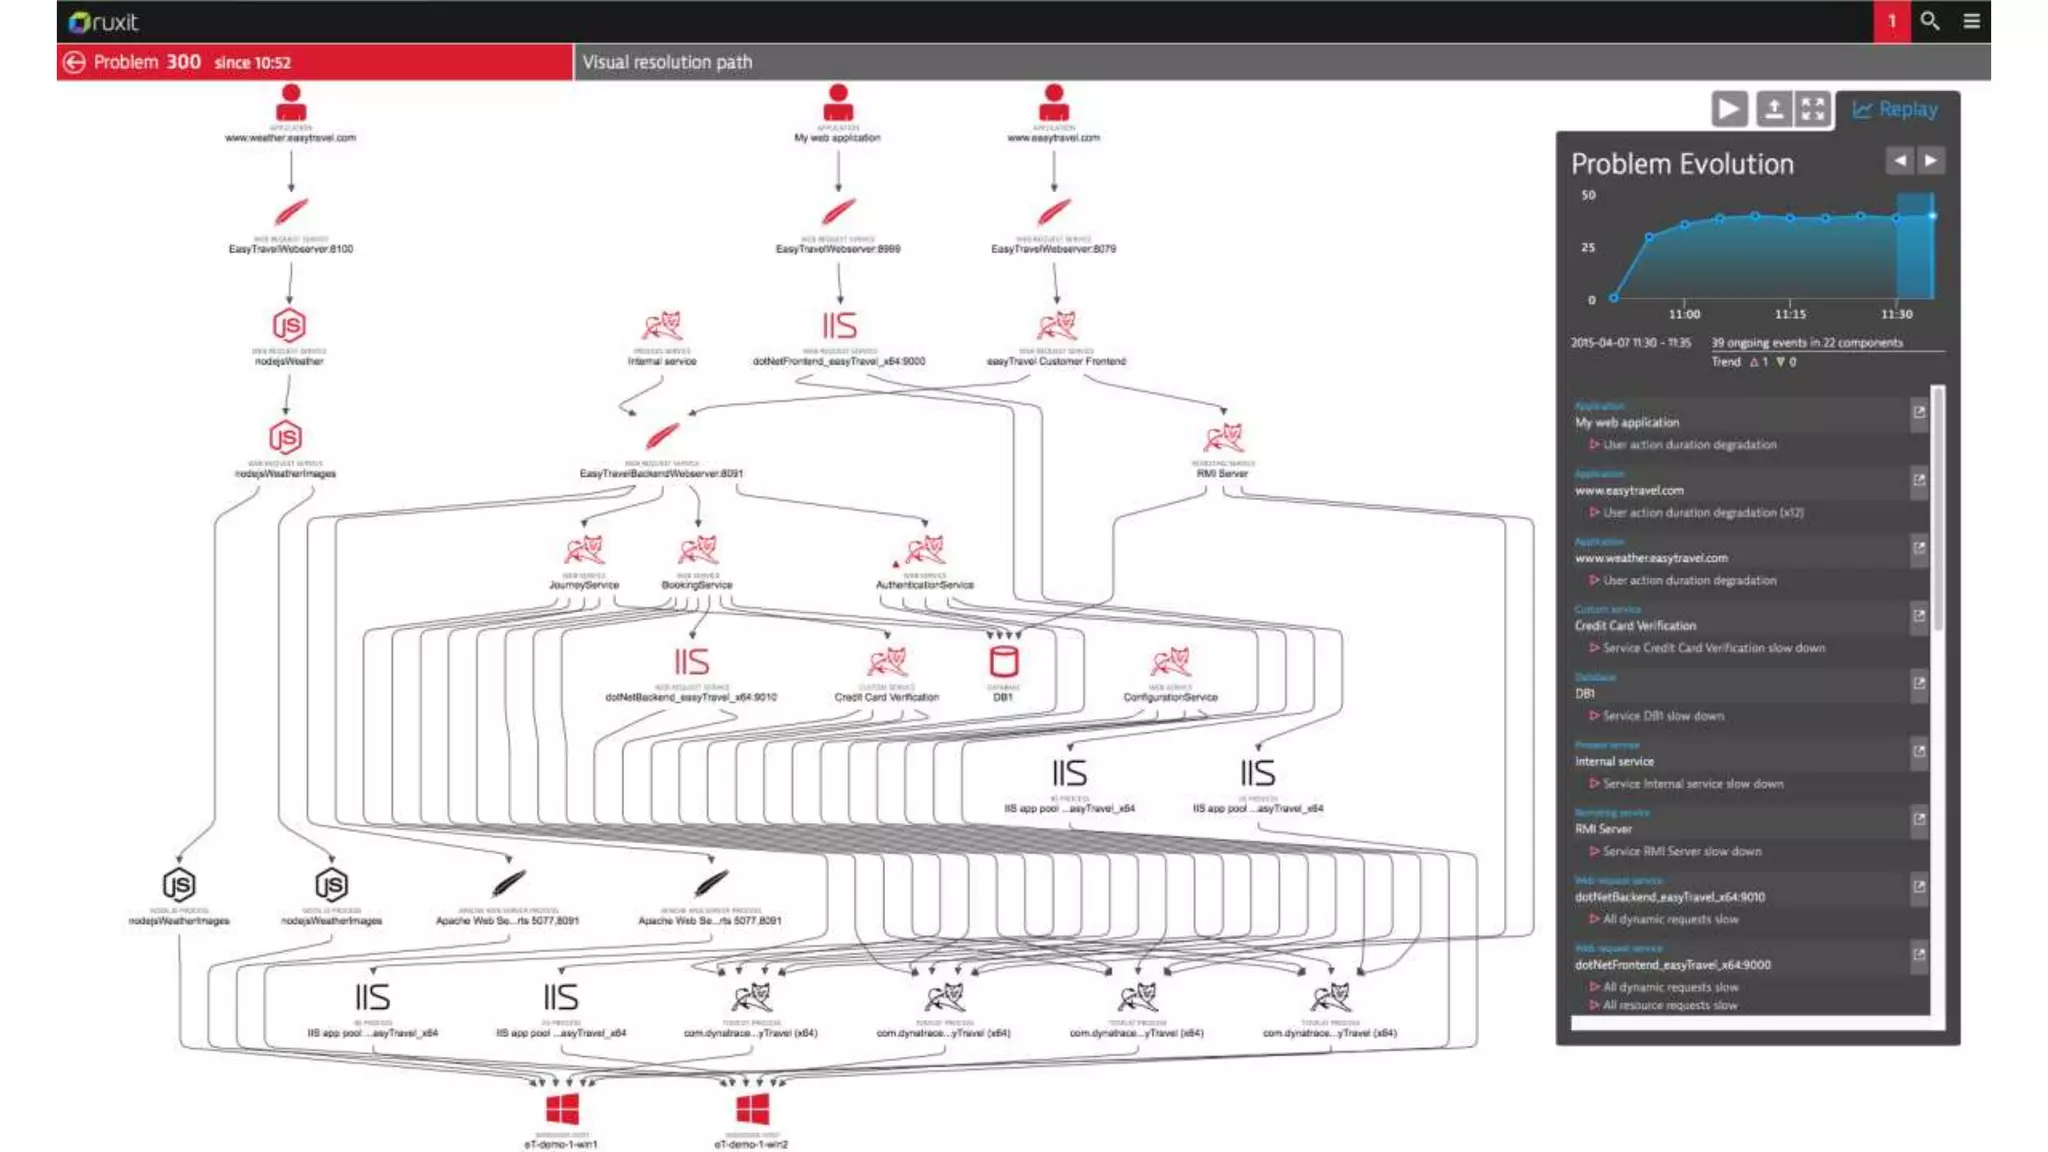
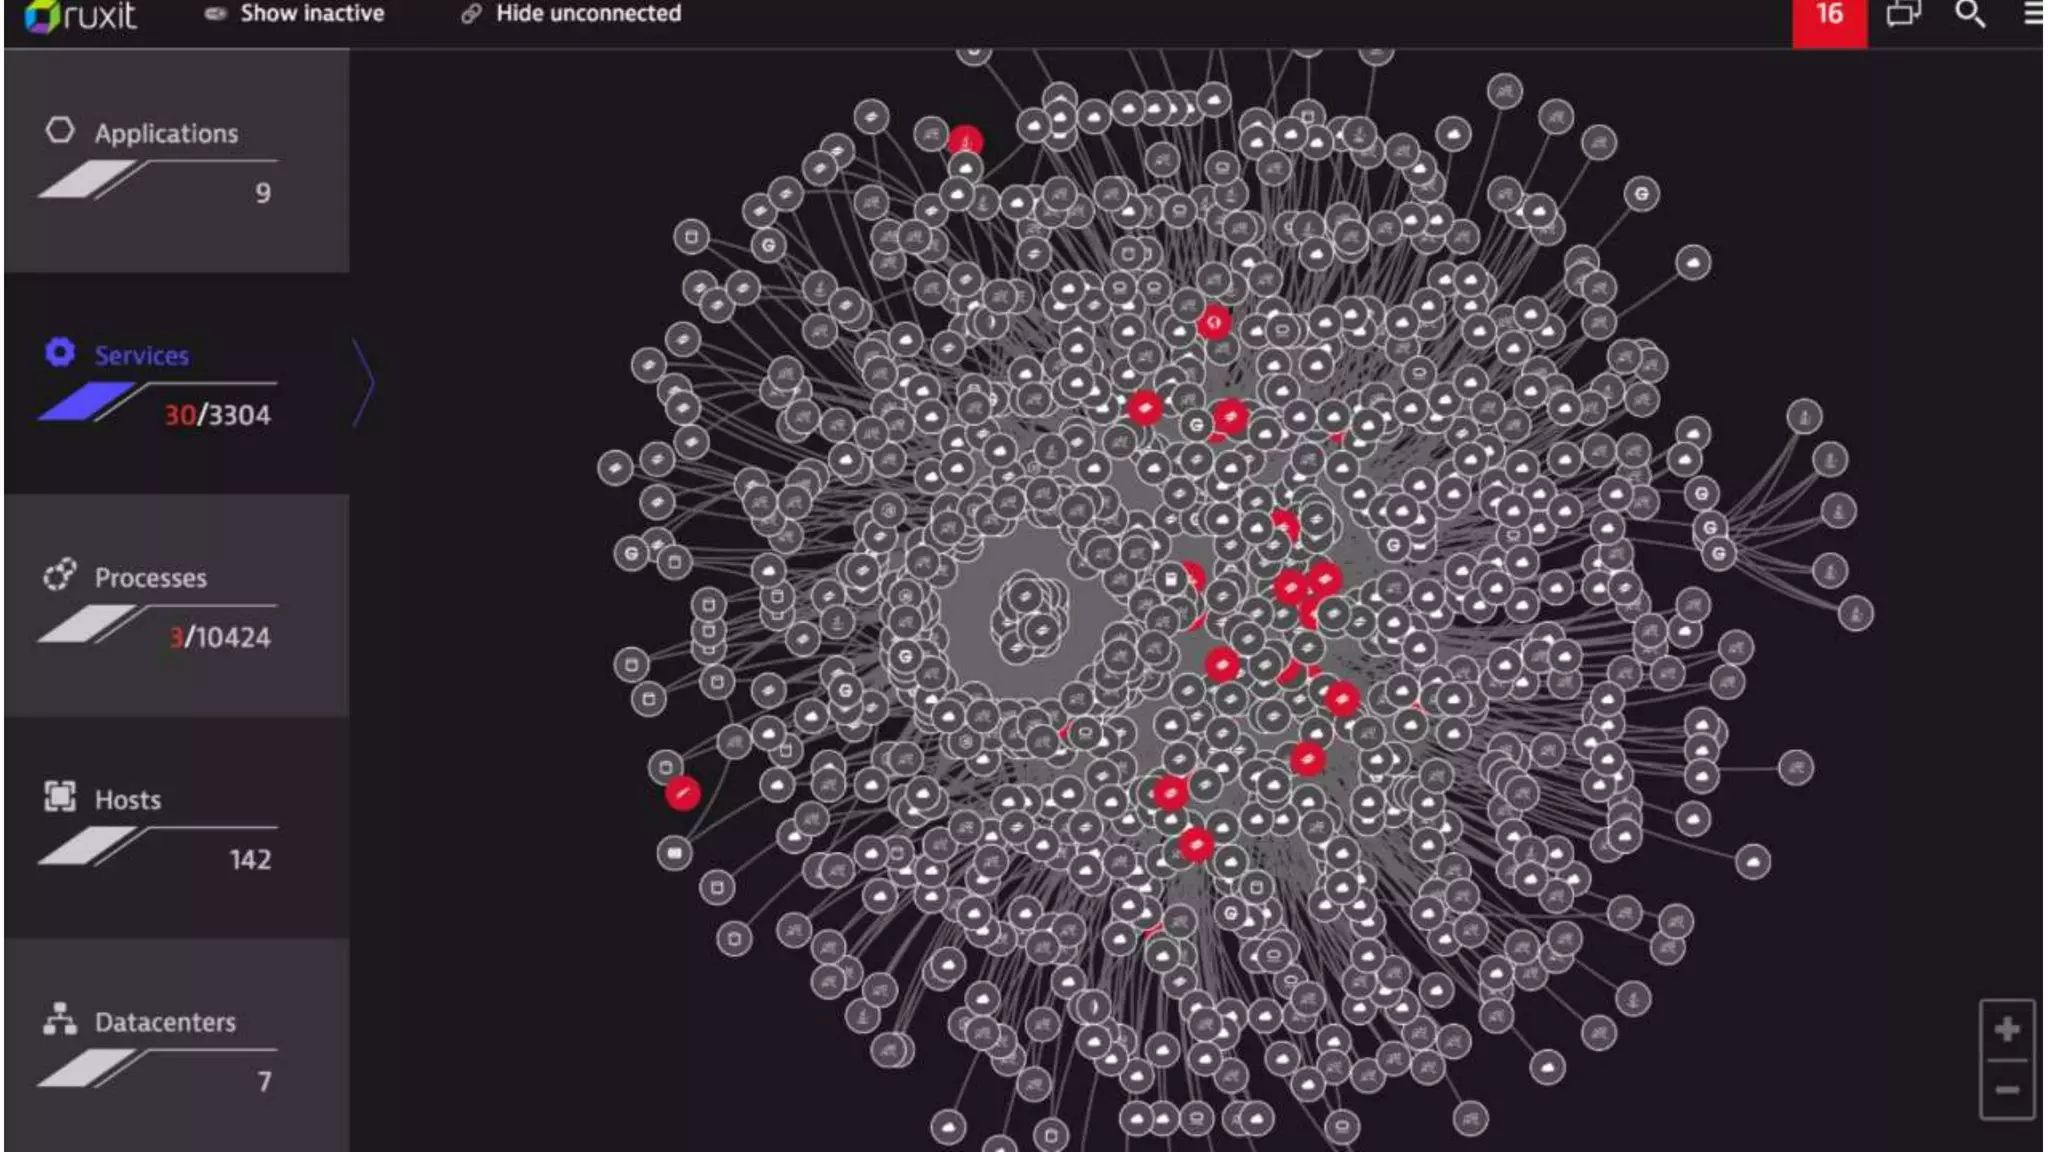
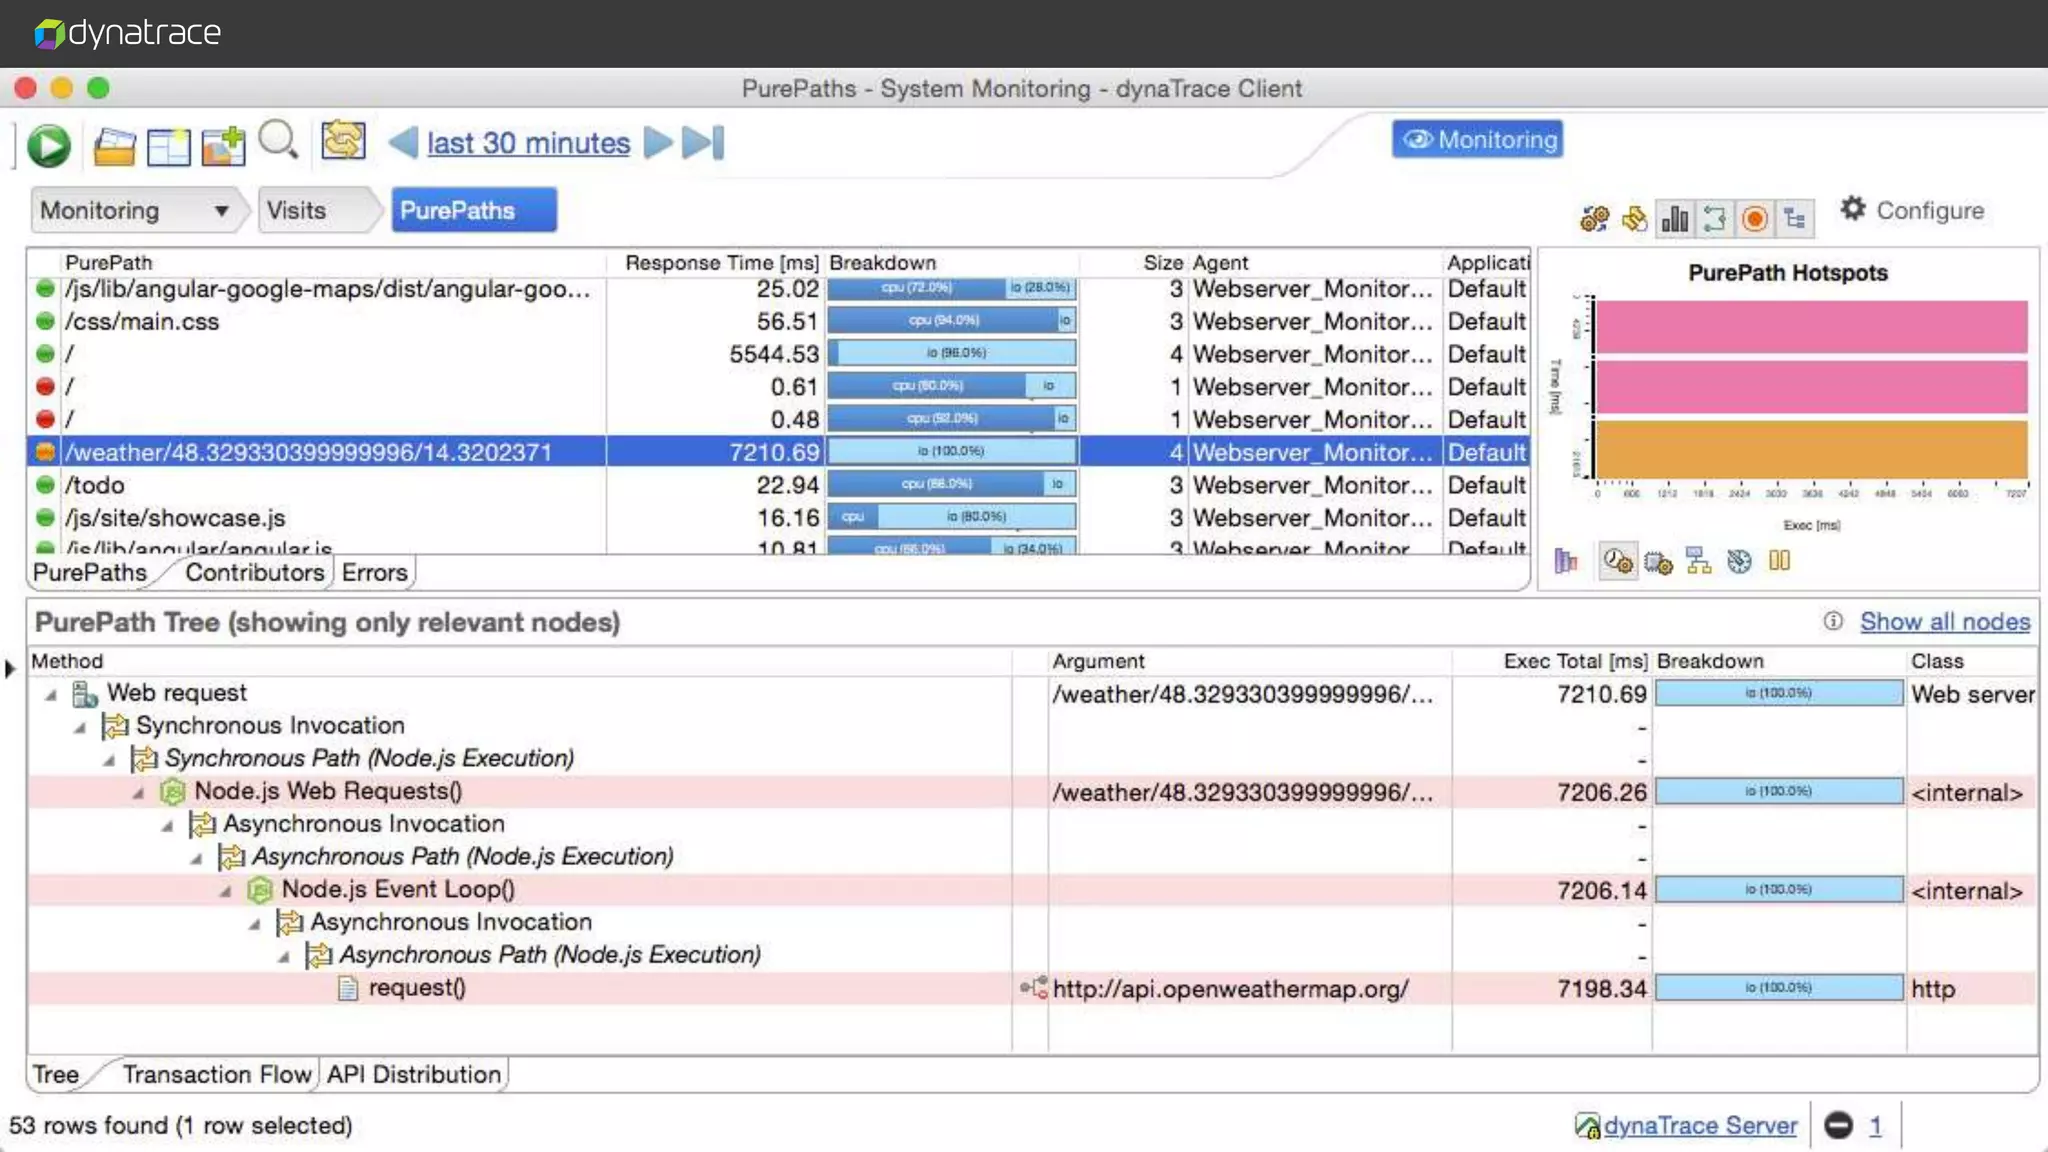

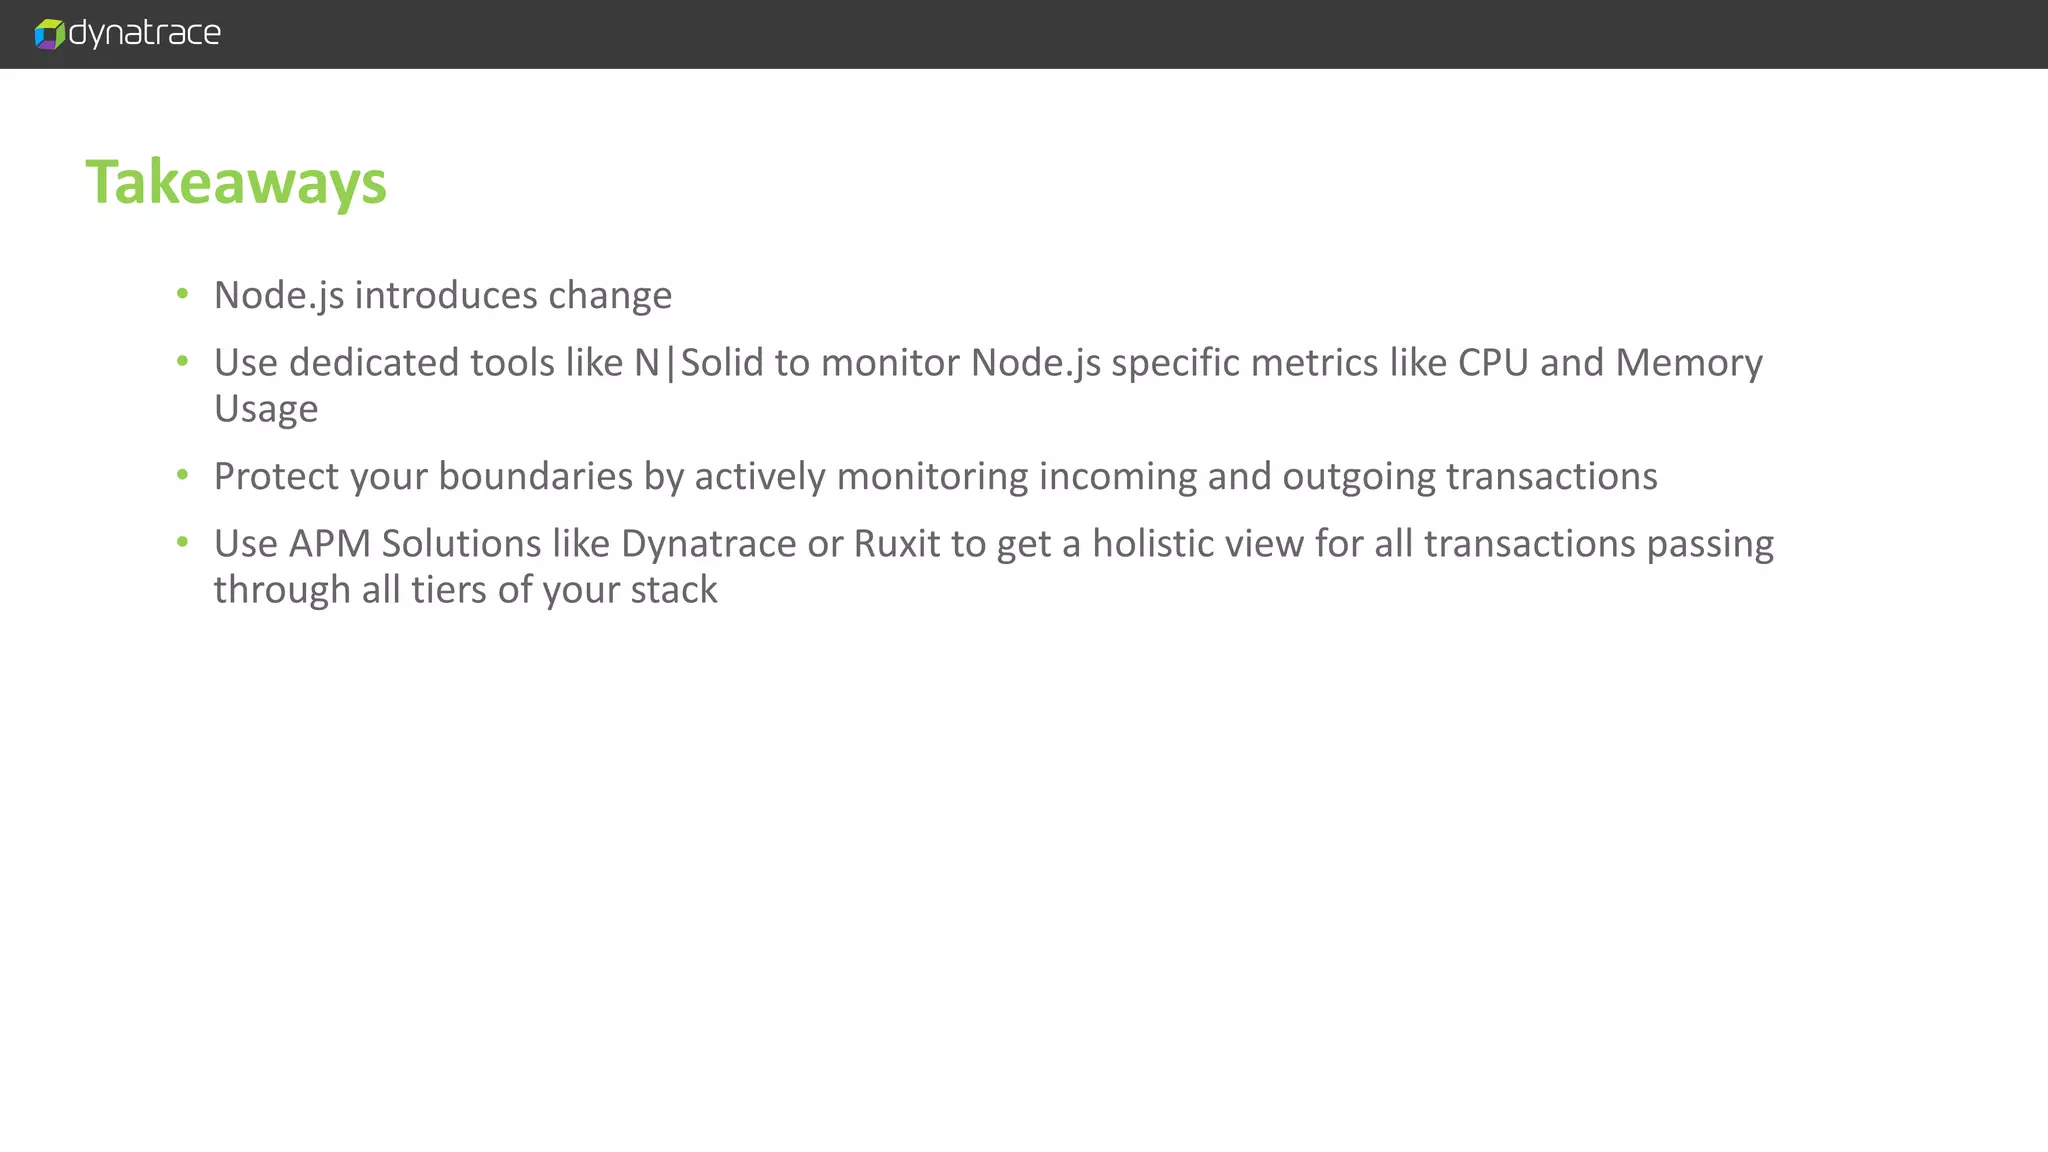


The document discusses performance issues in Node.js, highlighting the need for proactive defense against memory and CPU problems. It suggests using tools like n|solid for monitoring Node.js metrics and APM solutions such as Dynatrace for a comprehensive view of application performance. Key takeaways emphasize the importance of monitoring all transactions across the technology stack.