Download as PDF, PPTX


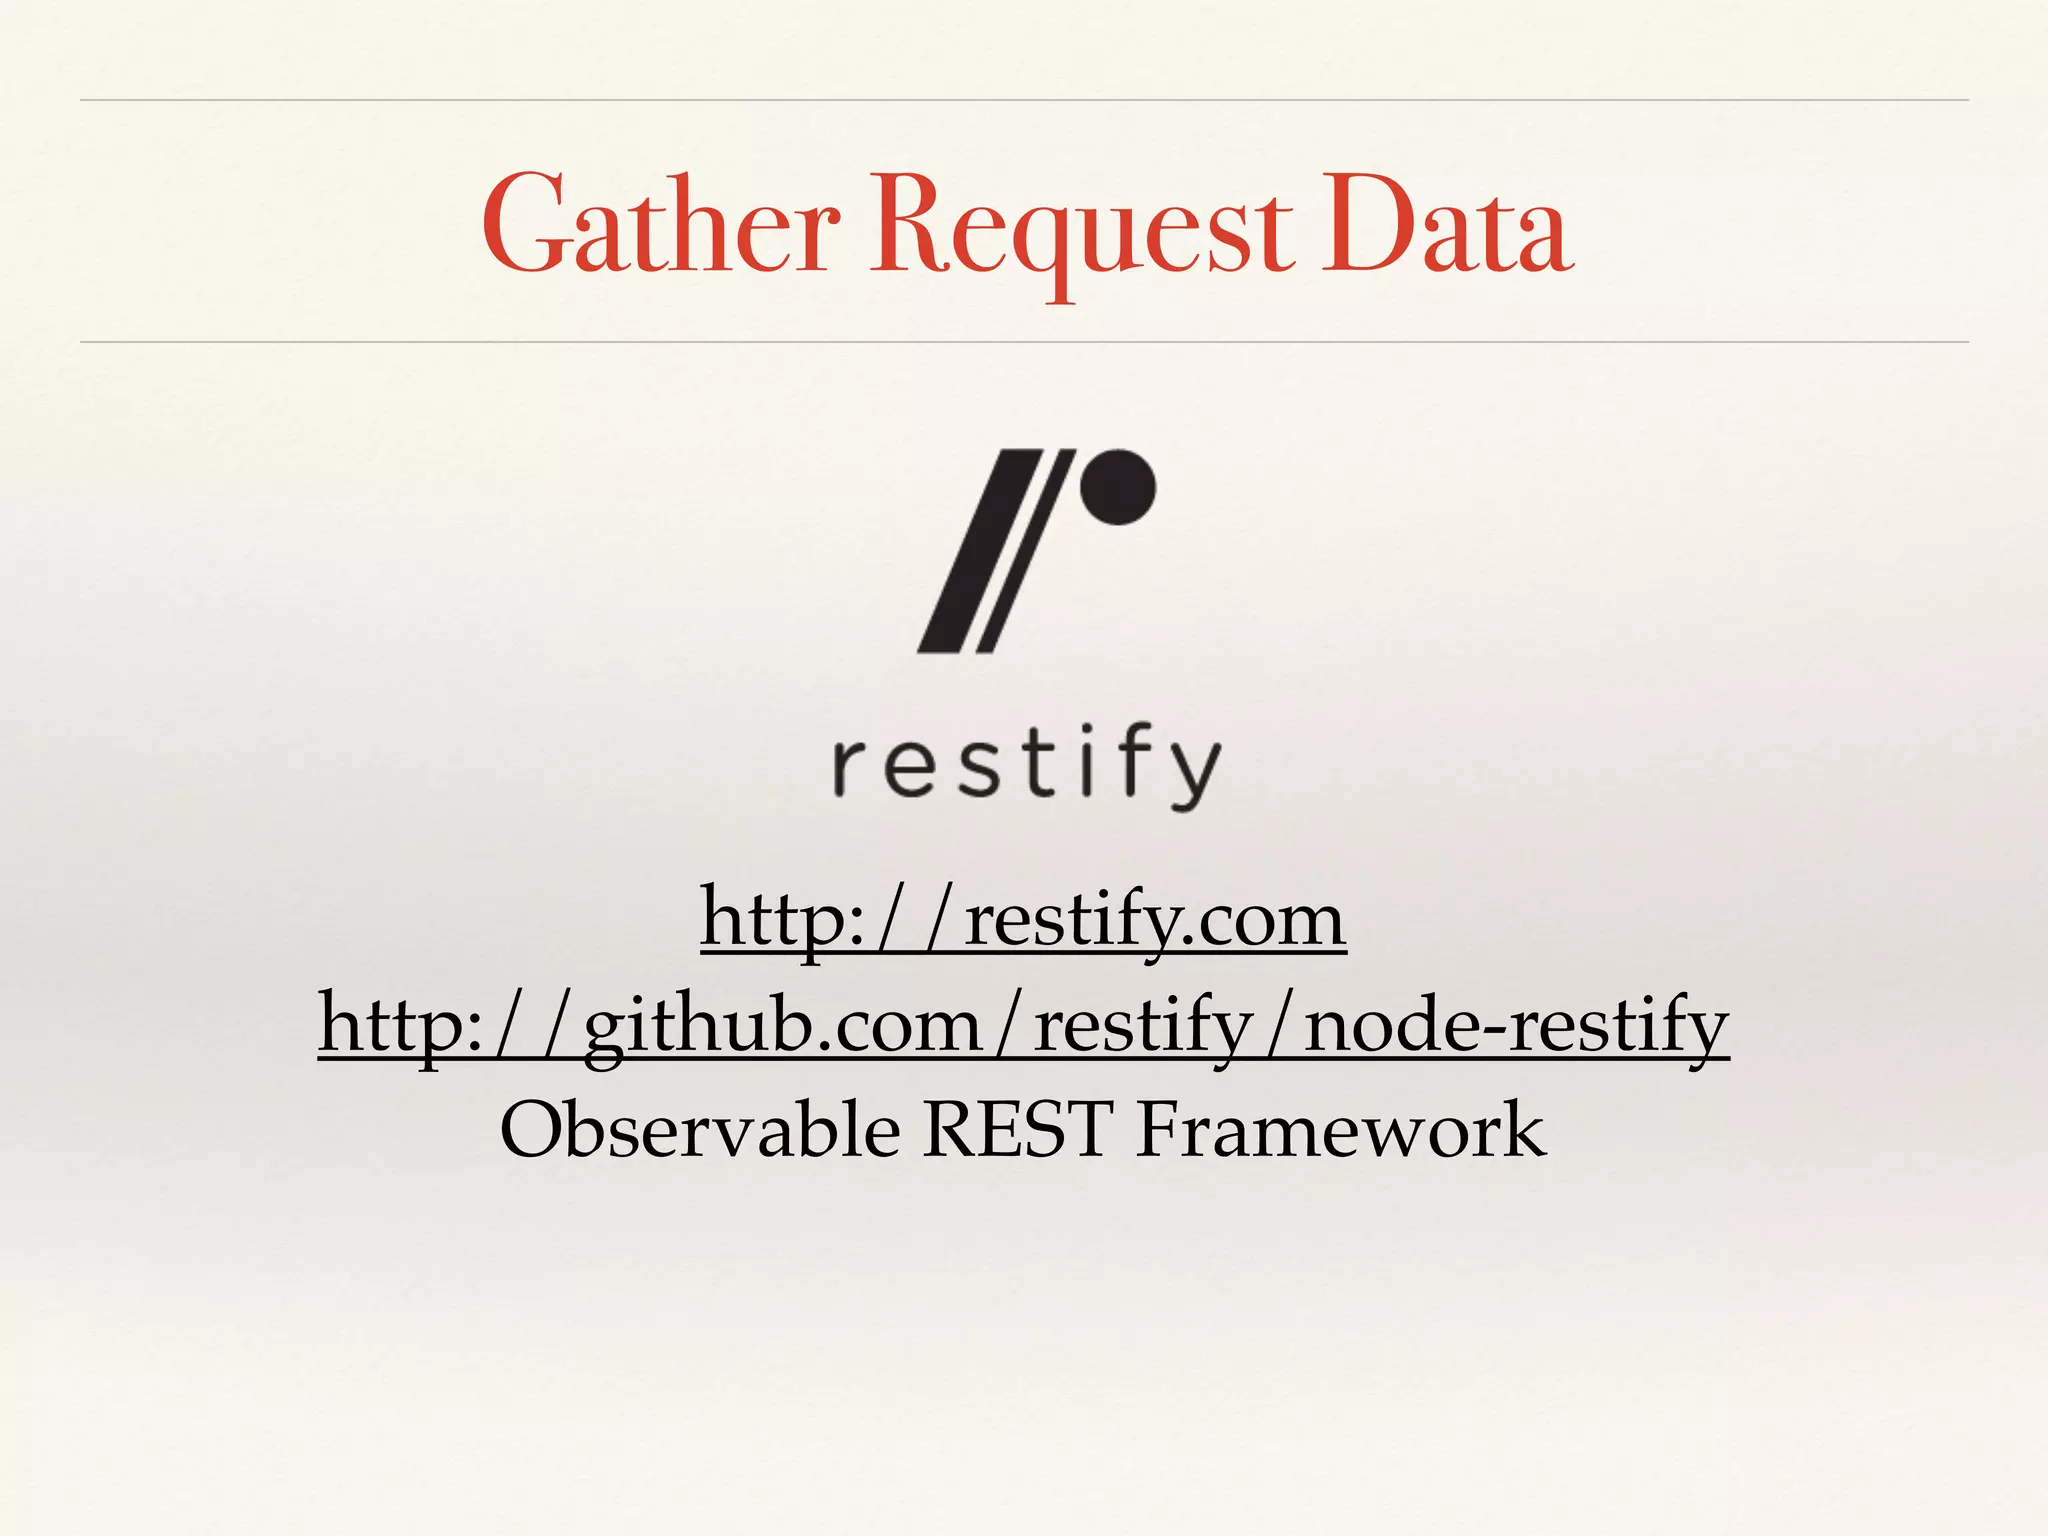
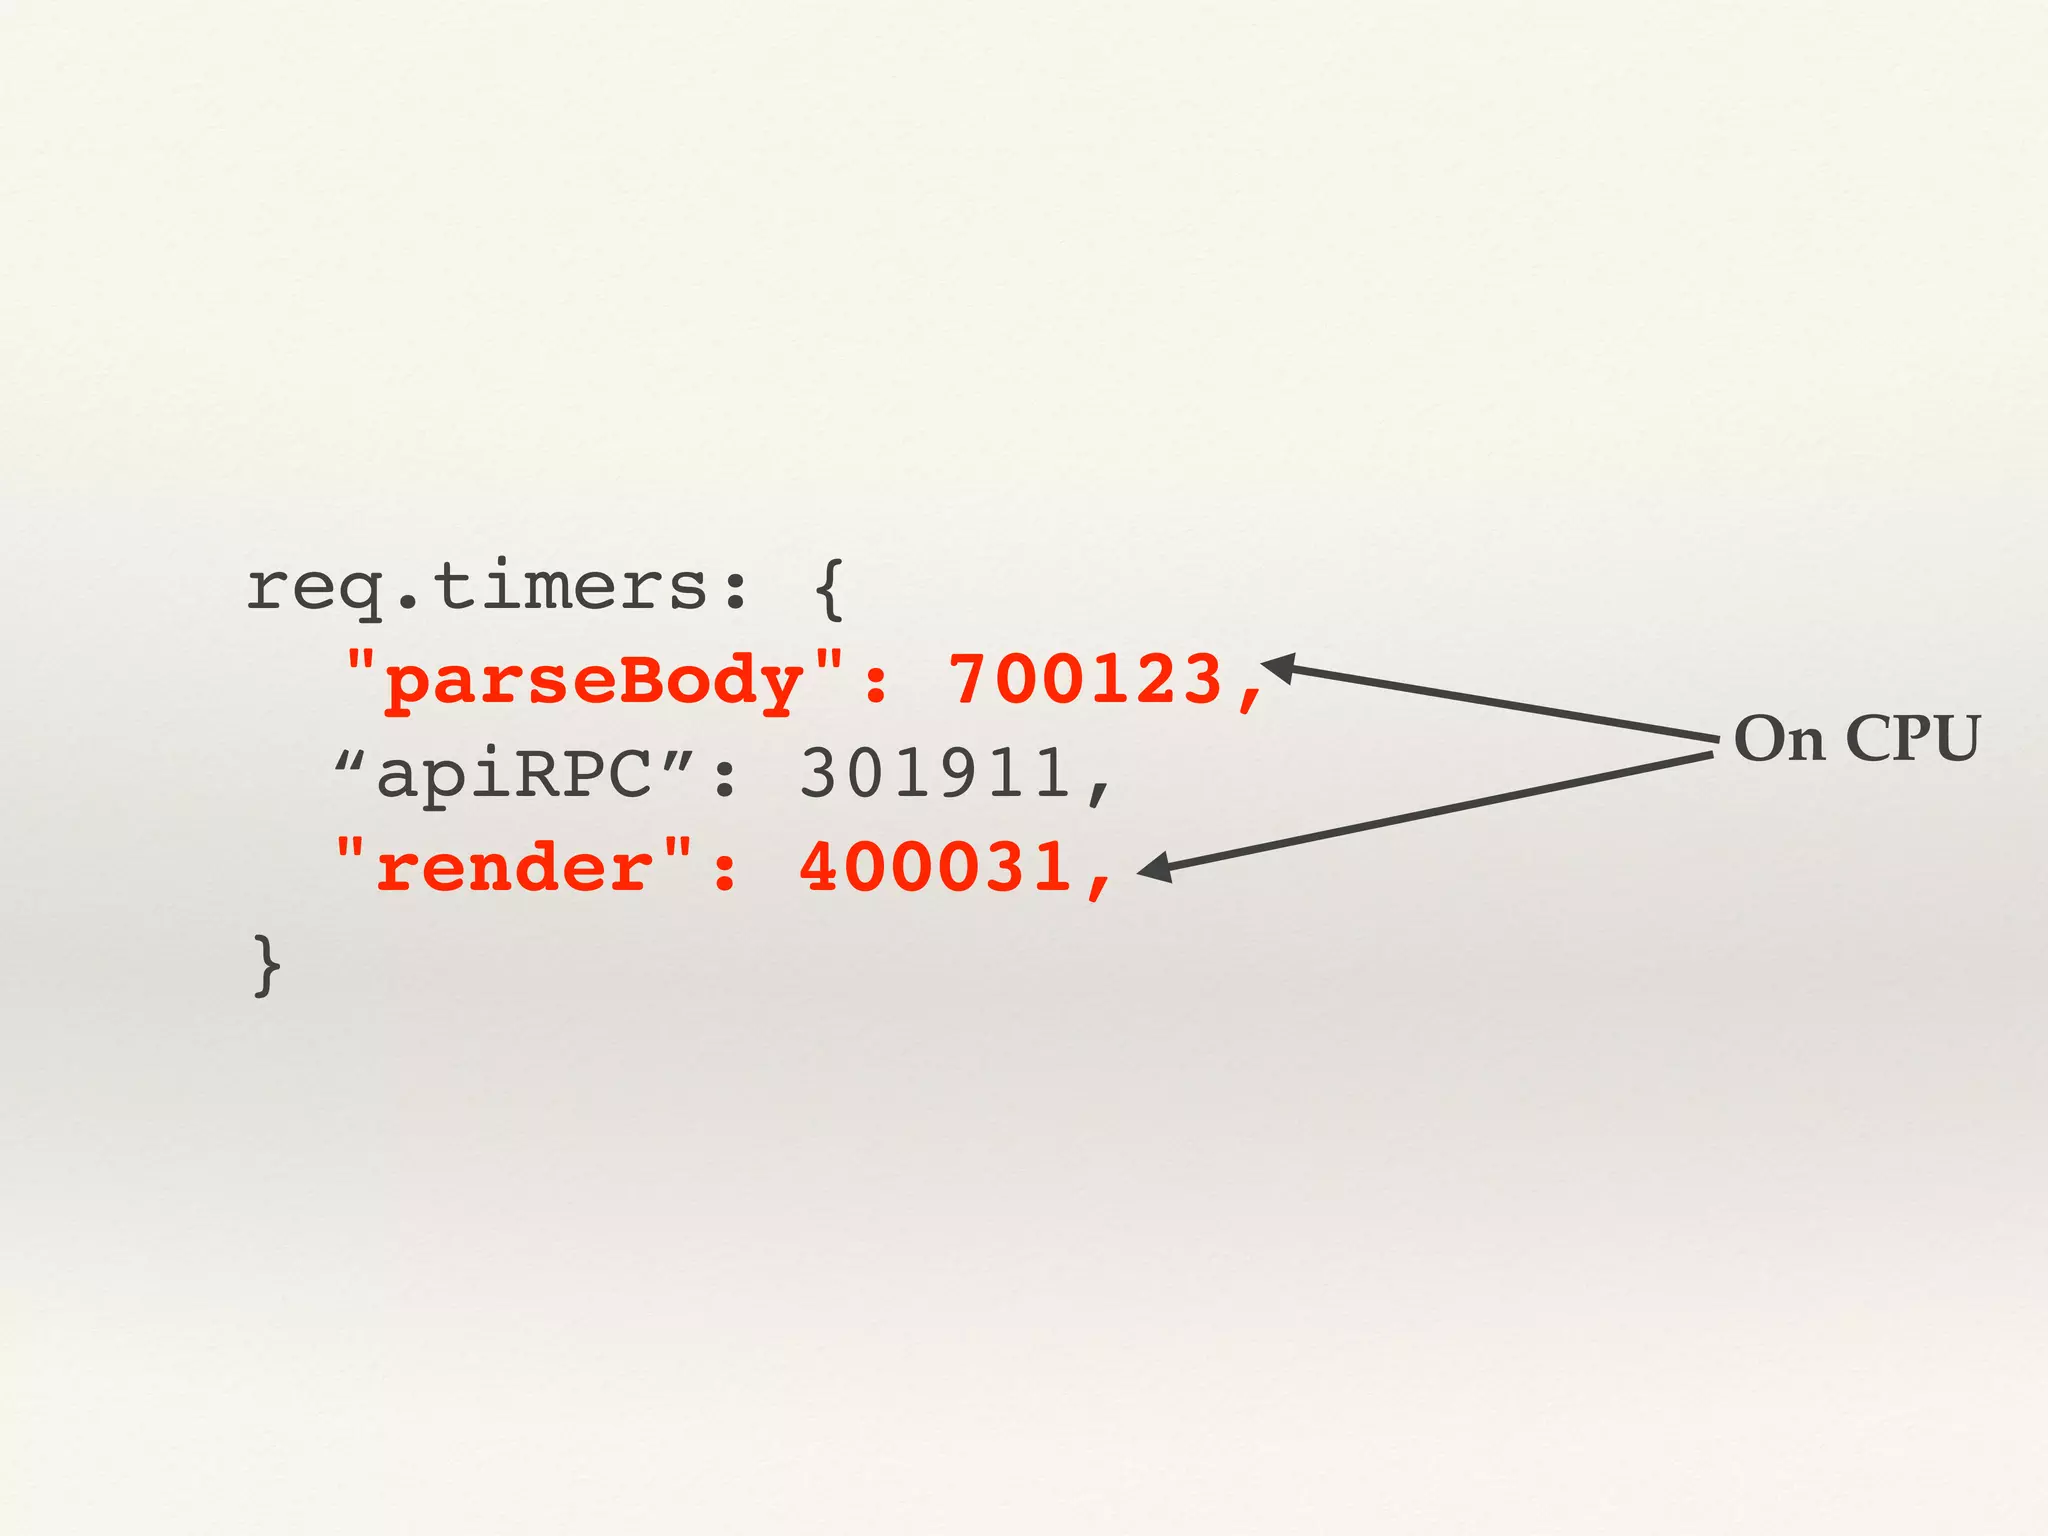
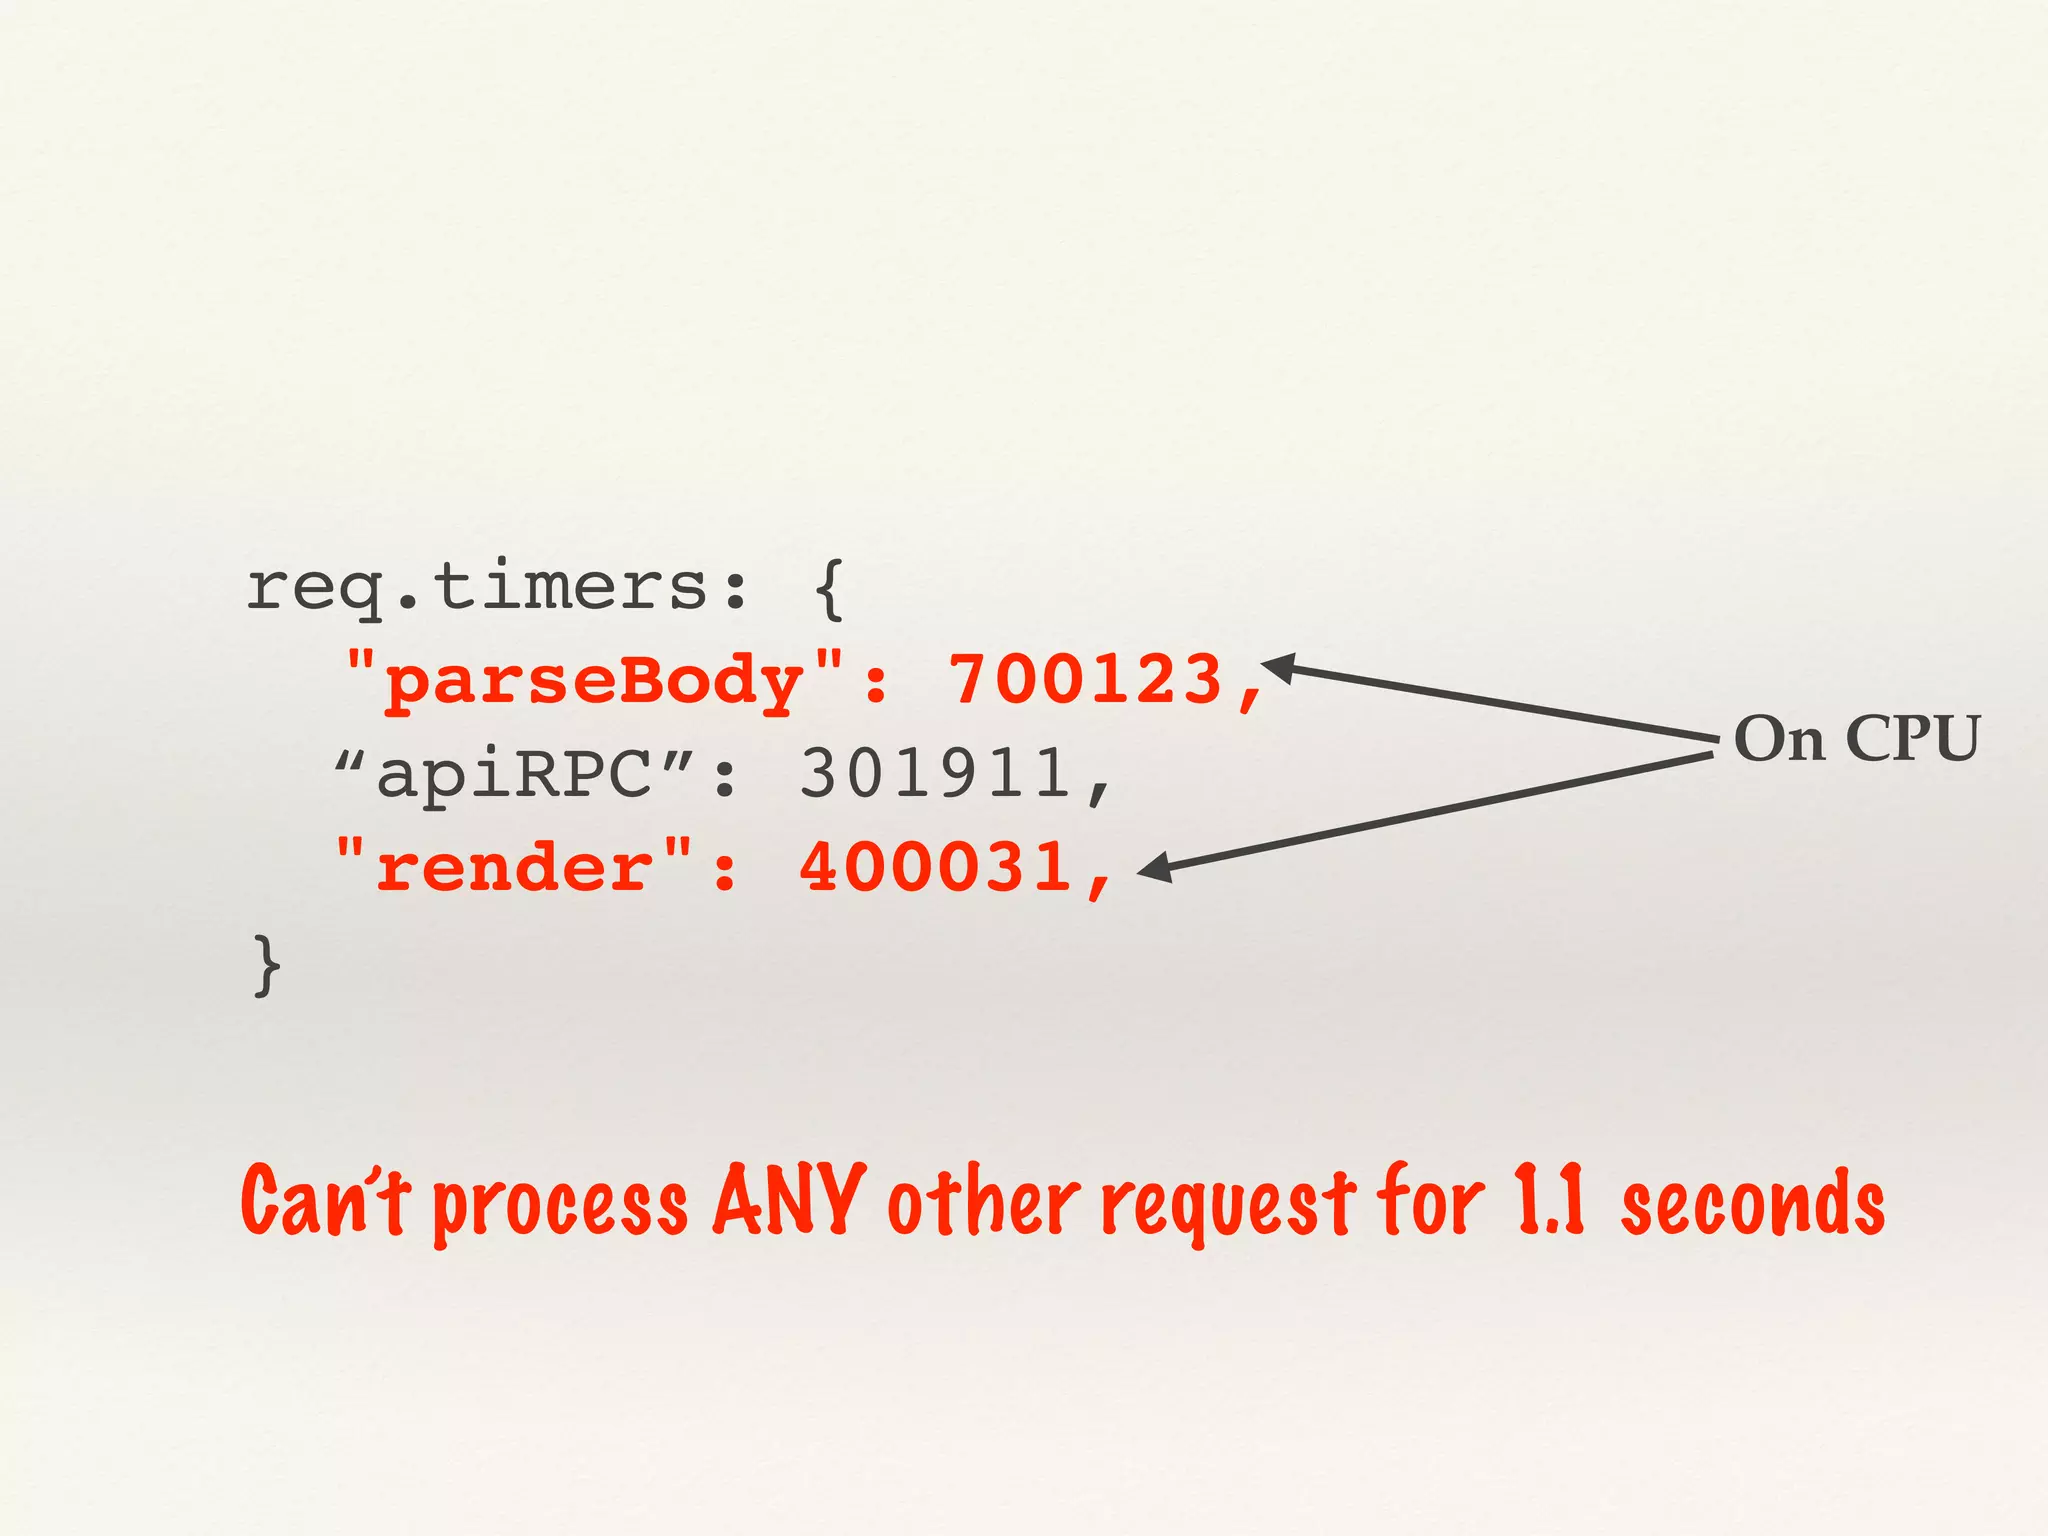
![to the Rescue [2014-12-09T14:07:26.293Z] INFO: shakti/restify-audit/20067: handled: 200, latency=1402 (req_id=b3fa3820-7fac-11e4-8908-a5c7b70d676f, latency=1435) GET / HTTP/1.1 host: www.netflix.com -- HTTP/1.1 200 OK x-netflix.client.instance: i-057e47ef x-frame-options: DENY content-type: text/html -- req.timers: { "parseBody": 700123, "apiRpc": 701911, "render": 400031 }](https://image.slidesharecdn.com/debuggingnodeinprodnodeinteractive-151209053355-lva1-app6891/75/Node-Interactive-Debugging-Node-js-In-Production-9-2048.jpg)

![Snapshot What’s Currently Executing Stacktrace: A stack trace is a report of the active stack frames at a certain point in time during the execution of a program. > console.log(ex, ex.stack.split("n")) ReferenceError: ex is not defined at repl:1:13 at REPLServer.defaultEval (repl.js:132:27) at bound (domain.js:254:14) at REPLServer.runBound [as eval] (domain.js:267:12) at REPLServer.<anonymous> (repl.js:279:12) at REPLServer.emit (events.js:107:17) at REPLServer.Interface._onLine (readline.js:214:10) at REPLServer.Interface._line (readline.js:553:8) at REPLServer.Interface._ttyWrite (readline.js:830:14) at ReadStream.onkeypress (readline.js:109:10)](https://image.slidesharecdn.com/debuggingnodeinprodnodeinteractive-151209053355-lva1-app6891/75/Node-Interactive-Debugging-Node-js-In-Production-15-2048.jpg)
![Linux Perf Events PERF(1) perf Manual PERF(1) NAME perf - Performance analysis tools for Linux SYNOPSIS perf [--version] [--help] COMMAND [ARGS] DESCRIPTION Performance counters for Linux are a new kernel-based subsystem that provide a framework for all things performance analysis. It covers hardware level (CPU/PMU, Performance Monitoring Unit) features and software features (software counters, tracepoints) as well.](https://image.slidesharecdn.com/debuggingnodeinprodnodeinteractive-151209053355-lva1-app6891/75/Node-Interactive-Debugging-Node-js-In-Production-17-2048.jpg)
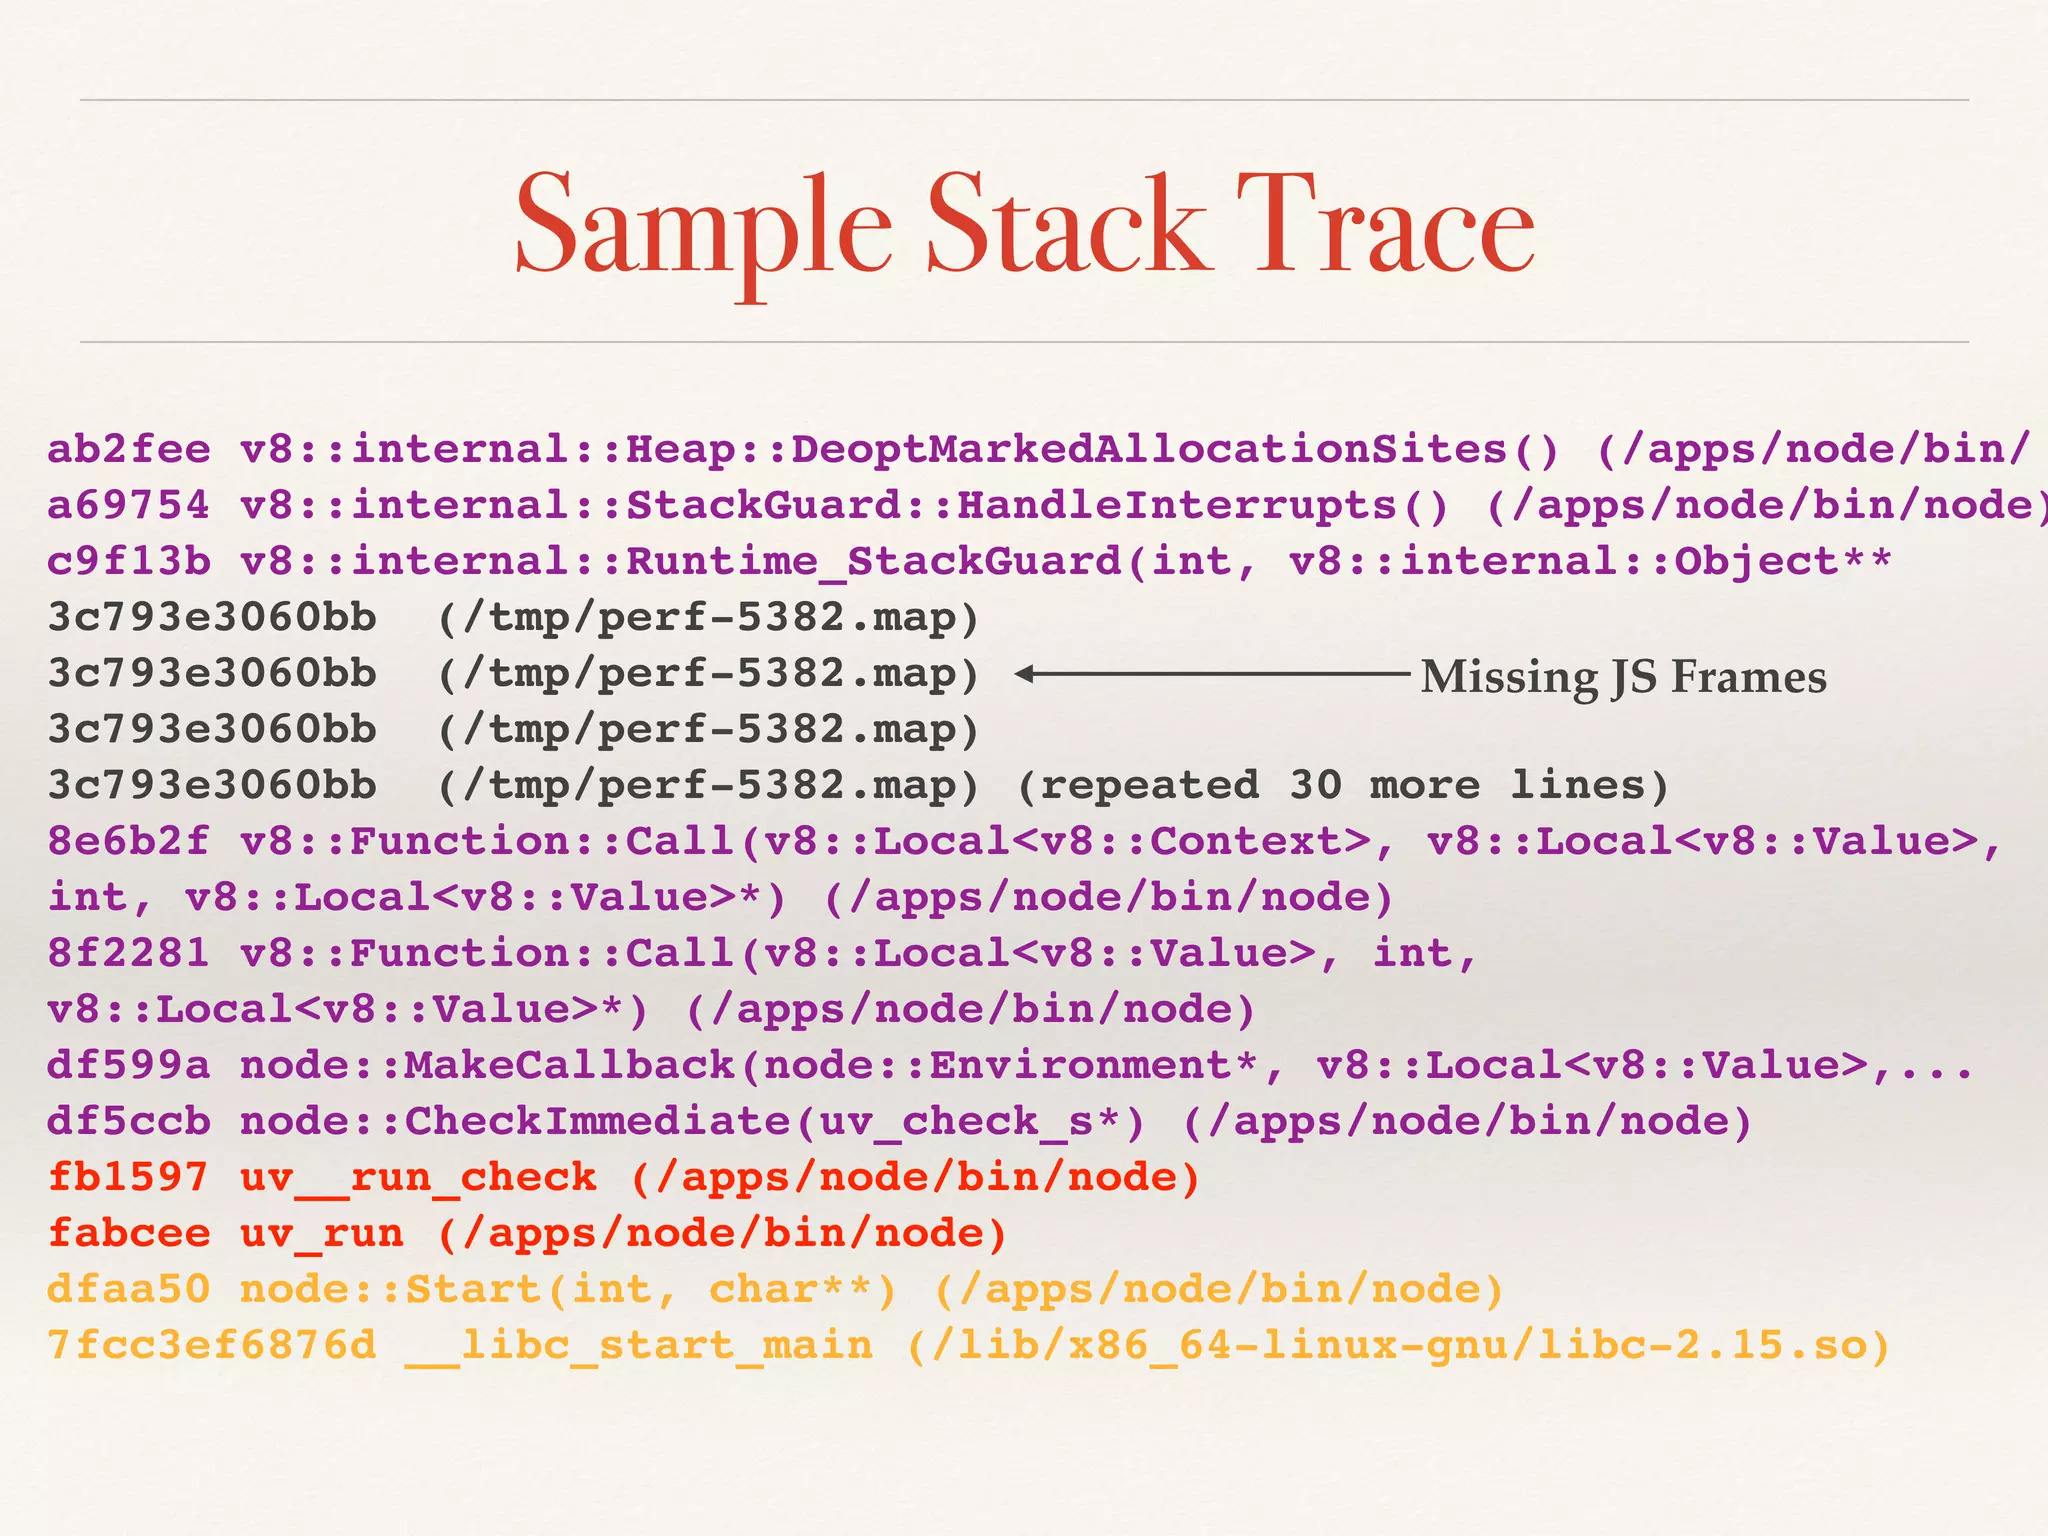
![Sample Stack Traces w/ perf(1) # perf record -F 99 -p `pgrep -n node` -g -- sleep 30 [ perf record: Woken up 2 times to write data ] [ perf record: Captured and wrote 0.524 MB perf.data (~22912 samples) ]](https://image.slidesharecdn.com/debuggingnodeinprodnodeinteractive-151209053355-lva1-app6891/75/Node-Interactive-Debugging-Node-js-In-Production-18-2048.jpg)


![Configure Node to Dump Core on Error !"[0] <> node --abort_on_uncaught_exception throw.js Uncaught Error FROM Object.<anonymous> (/Users/yunong/throw.js:1:63) Module._compile (module.js:435:26) Object.Module._extensions..js (module.js:442:10) Module.load (module.js:356:32) Function.Module._load (module.js:311:12) Function.Module.runMain (module.js:467:10) startup (node.js:134:18) node.js:961:3 [1] 4131 illegal hardware instruction (core dumped) node -- abort_on_uncaught_exception throw.js](https://image.slidesharecdn.com/debuggingnodeinprodnodeinteractive-151209053355-lva1-app6891/75/Node-Interactive-Debugging-Node-js-In-Production-49-2048.jpg)
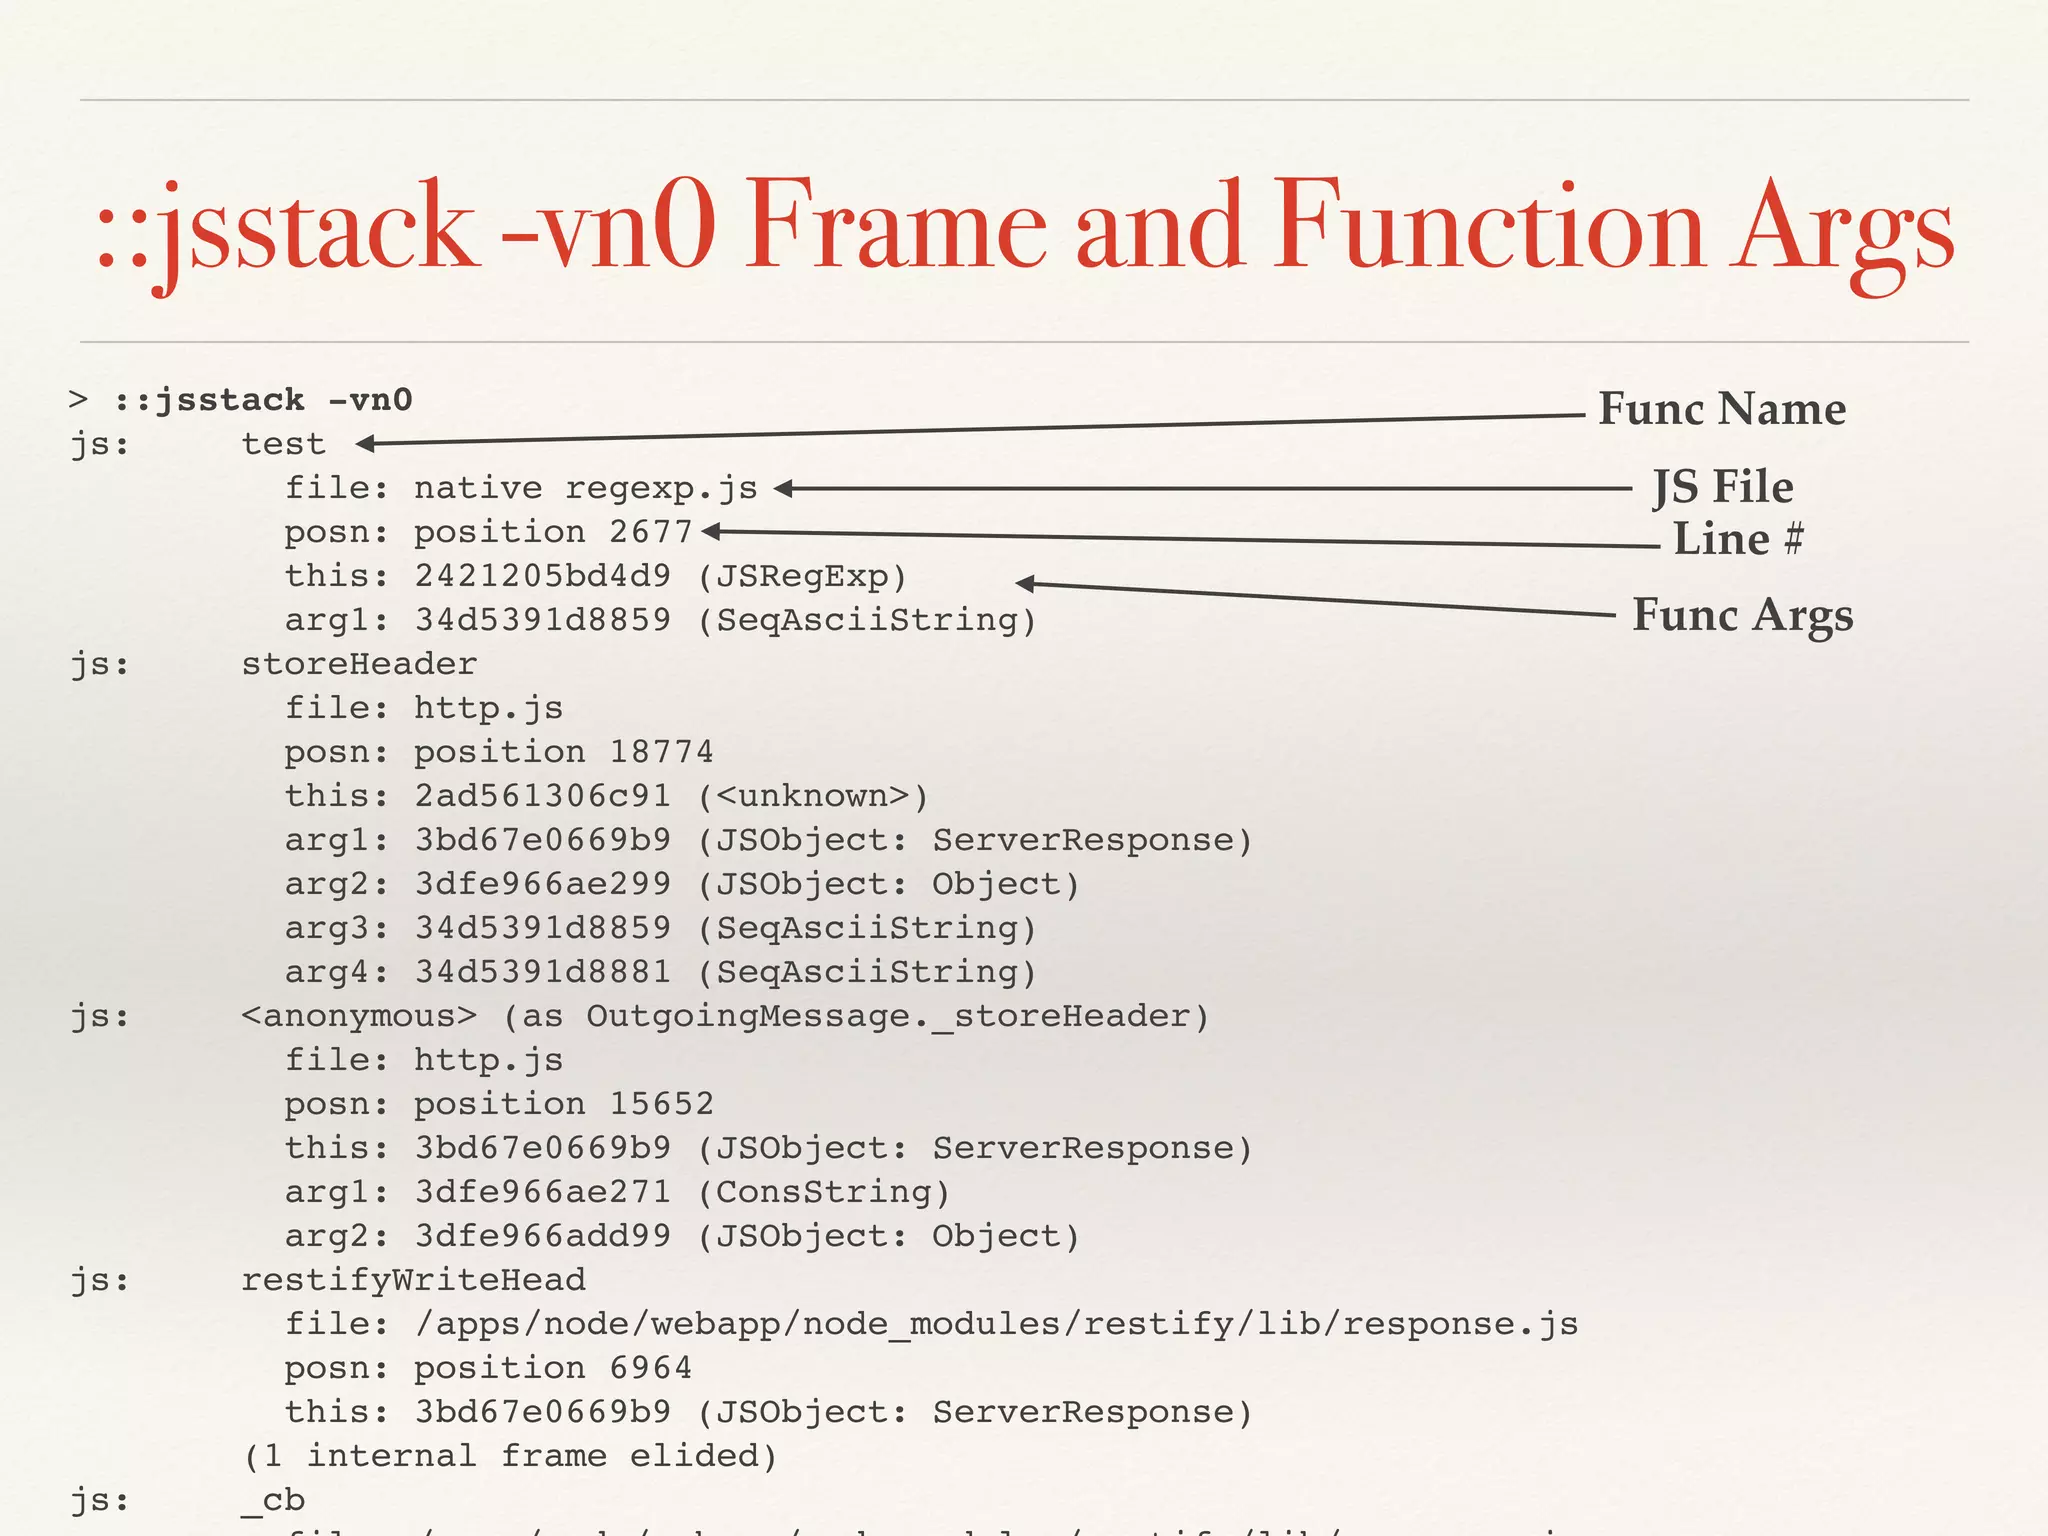
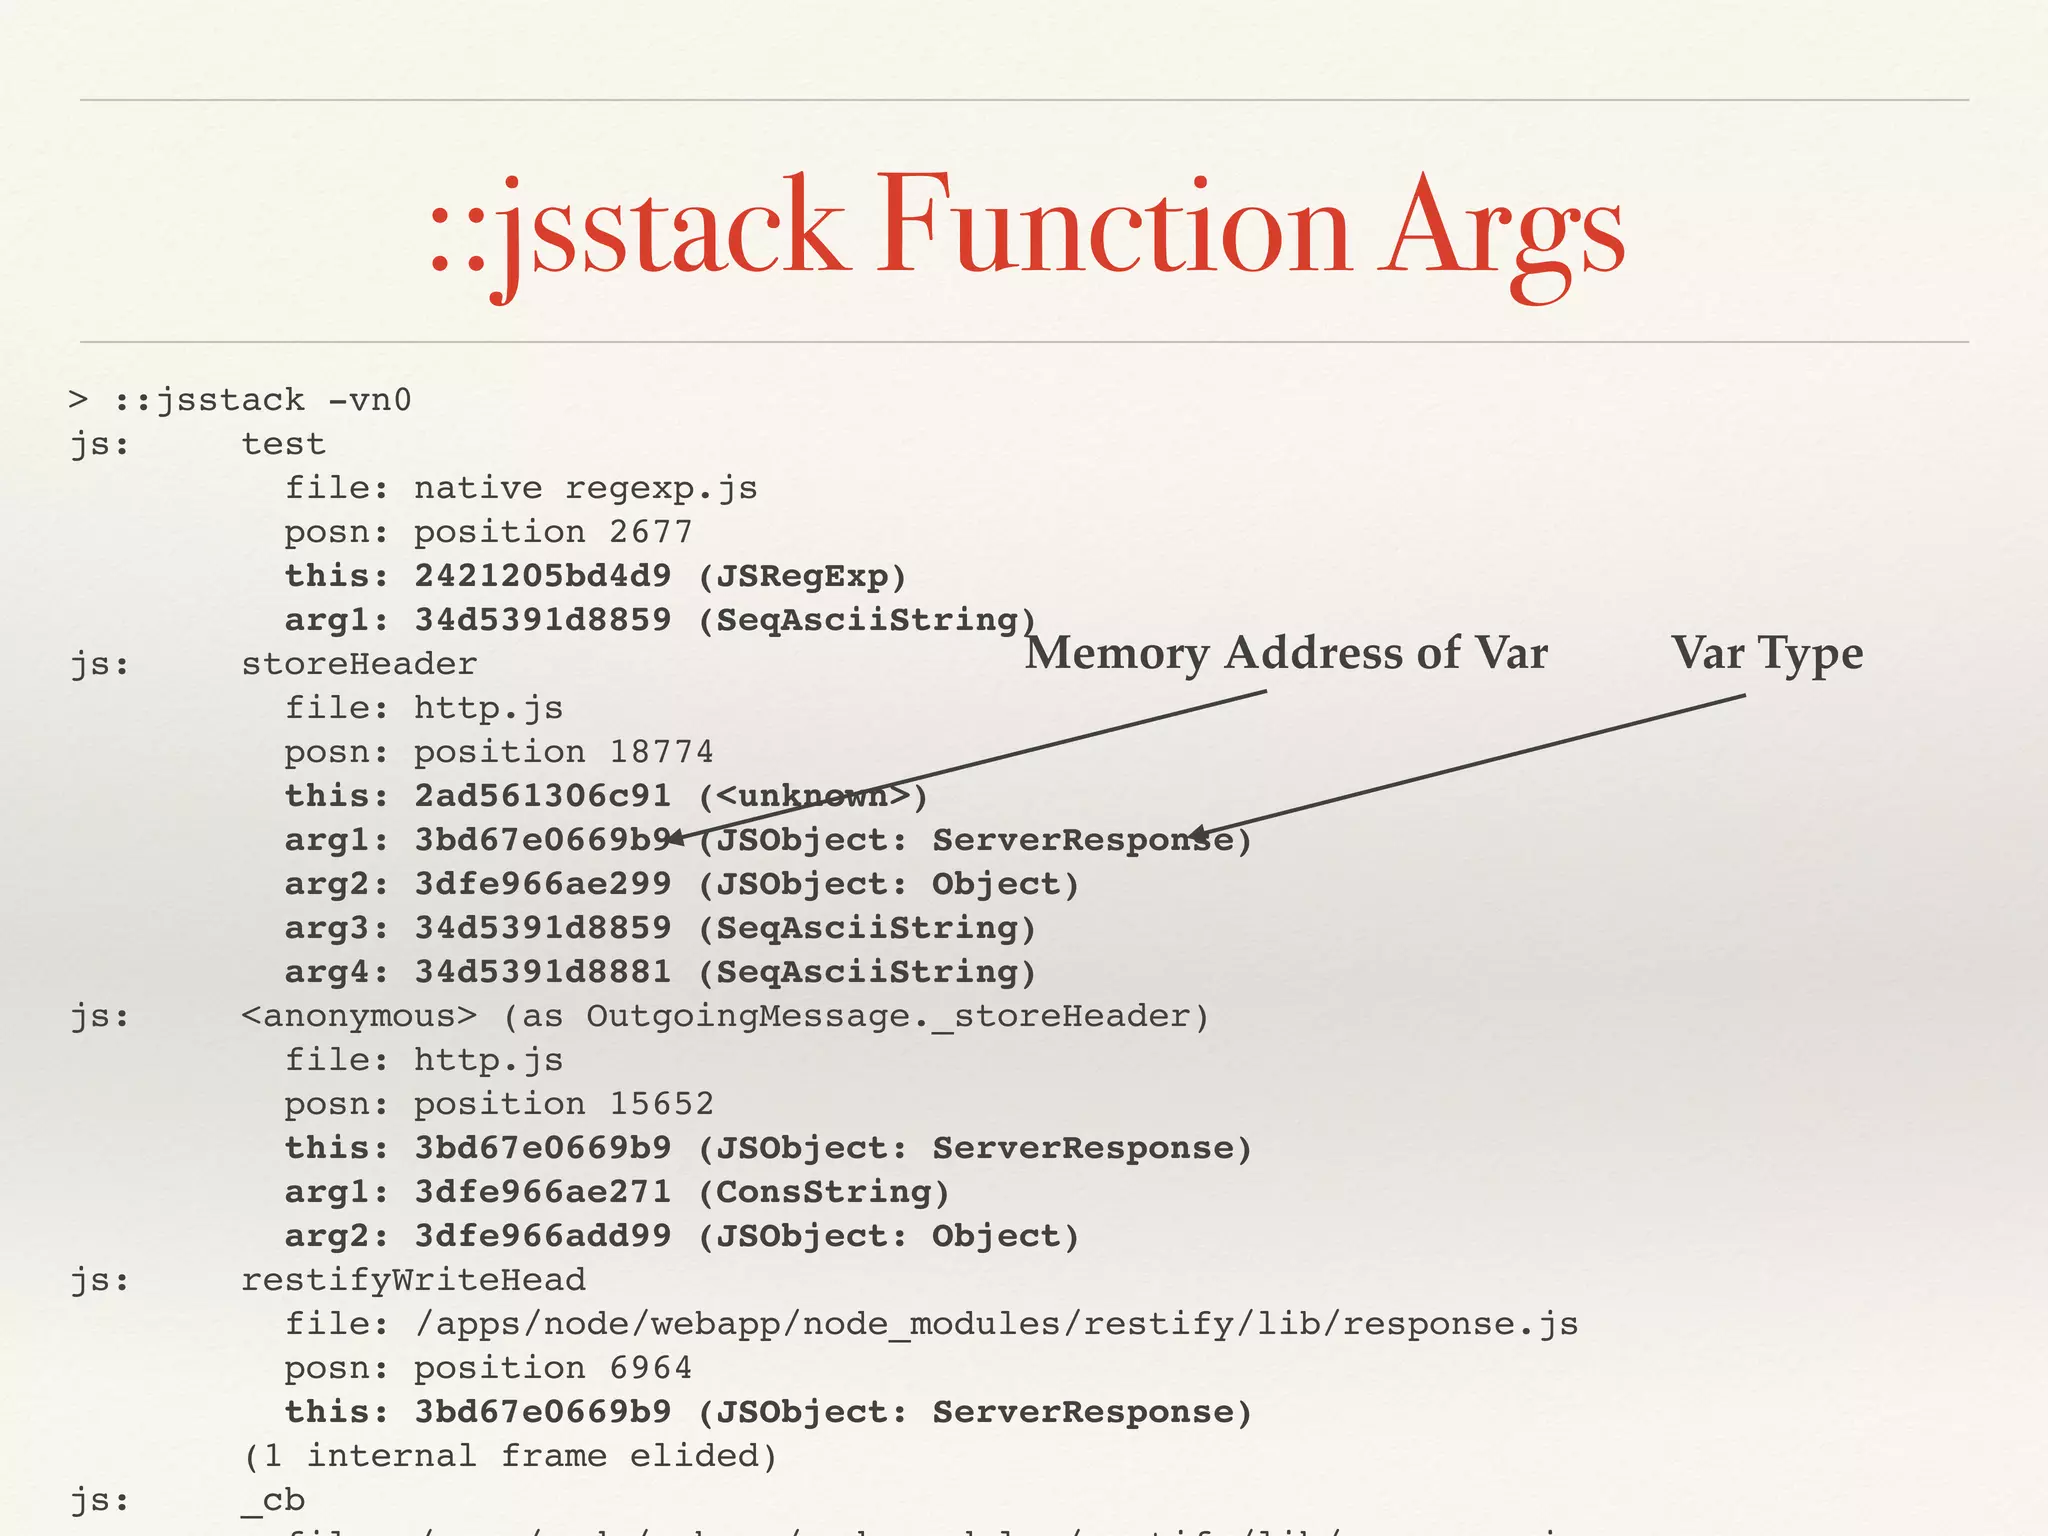
![::jsstack -v Frame Source > ::jsstack -v js: storeHeader file: http.js posn: position 18774 this: 2ad561306c91 (<unknown>) arg1: 3bd67e0669b9 (JSObject: ServerResponse) arg2: 3dfe966ae299 (JSObject: Object) arg3: 34d5391d8859 (SeqAsciiString) arg4: 34d5391d8881 (SeqAsciiString) 652 653 function storeHeader(self, state, field, value) { 654 // Protect against response splitting. The if statement is there to 655 // minimize the performance impact in the common case. 656 if (/[rn]/.test(value)) 657 value = value.replace(/[rn]+[ t]*/g, ''); 658 659 state.messageHeader += field + ': ' + value + CRLF; 660 661 if (connectionExpression.test(field)) { 662 state.sentConnectionHeader = true; 663 if (closeExpression.test(value)) { 664 self._last = true; 665 } else { 666 self.shouldKeepAlive = true; 667 } 668](https://image.slidesharecdn.com/debuggingnodeinprodnodeinteractive-151209053355-lva1-app6891/75/Node-Interactive-Debugging-Node-js-In-Production-58-2048.jpg)
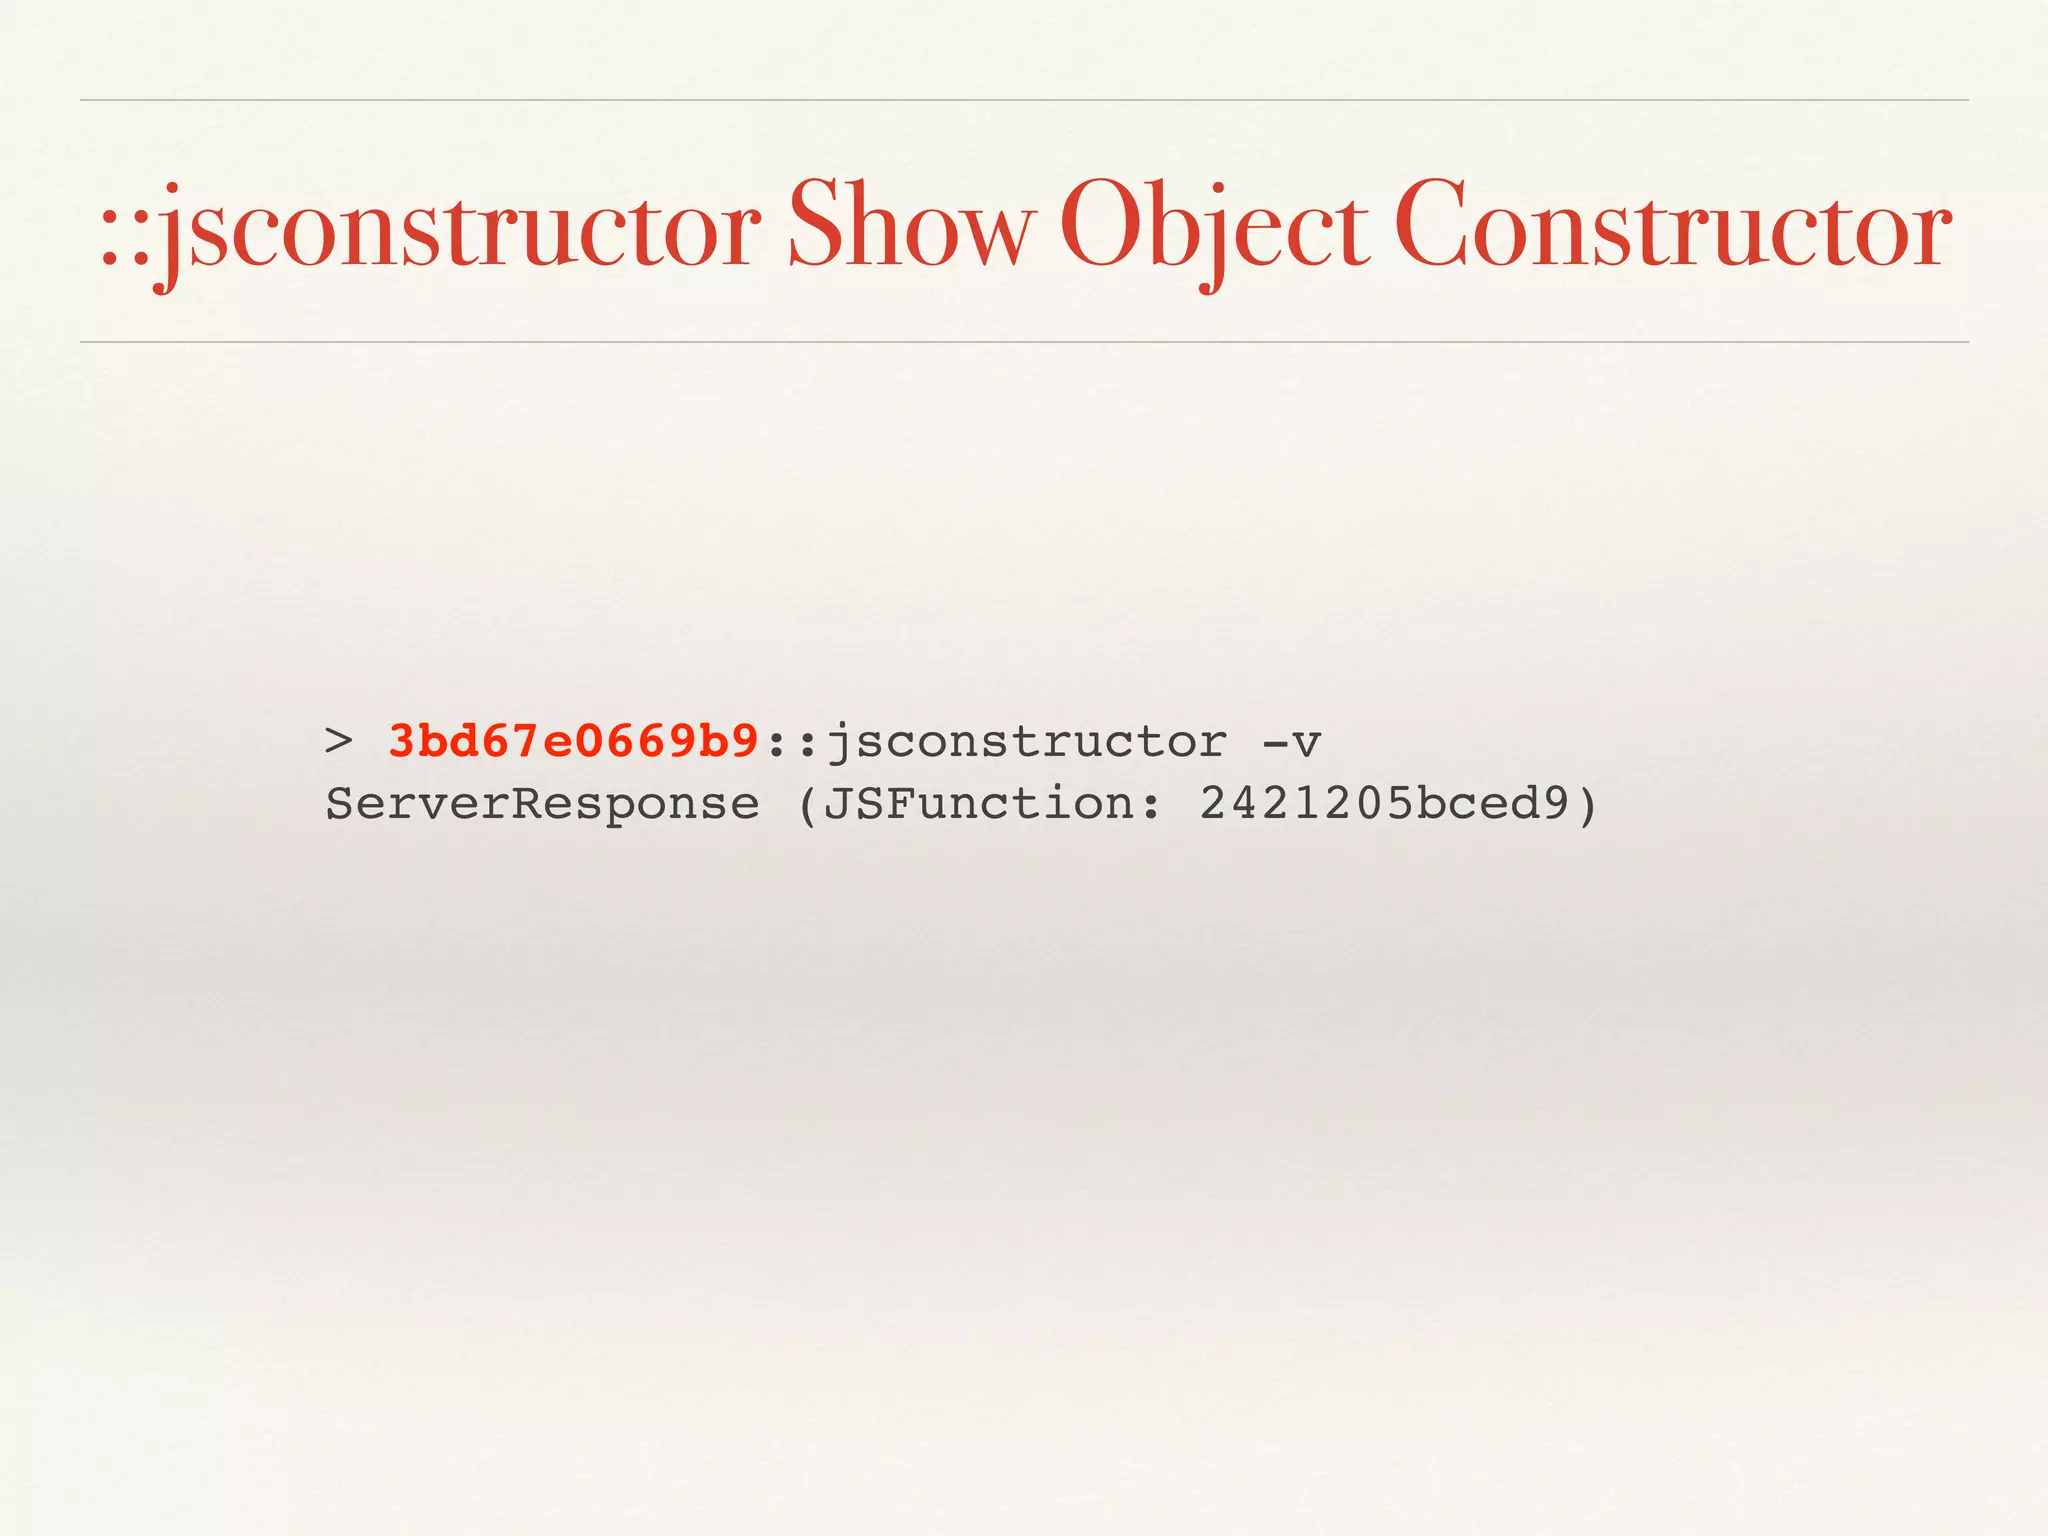
![::jsprint Print JS Objects > 3bd67e0669b9::jsprint { "_time": 1437690472539, "_headers": { "content-type": "text/html", "req_id": "5b7f18f2-7f12-4c68-b07f-3cd75698ba65", "set-cookie": “CENSORED; Domain=.netflix.com; Expires=Fri, 24 Jul 2015 10:27:52 GMT "x-frame-options": "DENY", "x-ua-compatible": "IE=edge", "x-netflix.client.instance": "i-c420596c", }, "output": [], "_last": false, "_hangupClose": false, "_hasBody": true, "socket": { "_connecting": false, "_handle": [...], "_readableState": [...], "readable": true, "domain": null, "_events": [...], "_maxListeners": 10, "_writableState": [...], "writable": true, "allowHalfOpen": true, Actual JS Object Instance](https://image.slidesharecdn.com/debuggingnodeinprodnodeinteractive-151209053355-lva1-app6891/75/Node-Interactive-Debugging-Node-js-In-Production-61-2048.jpg)


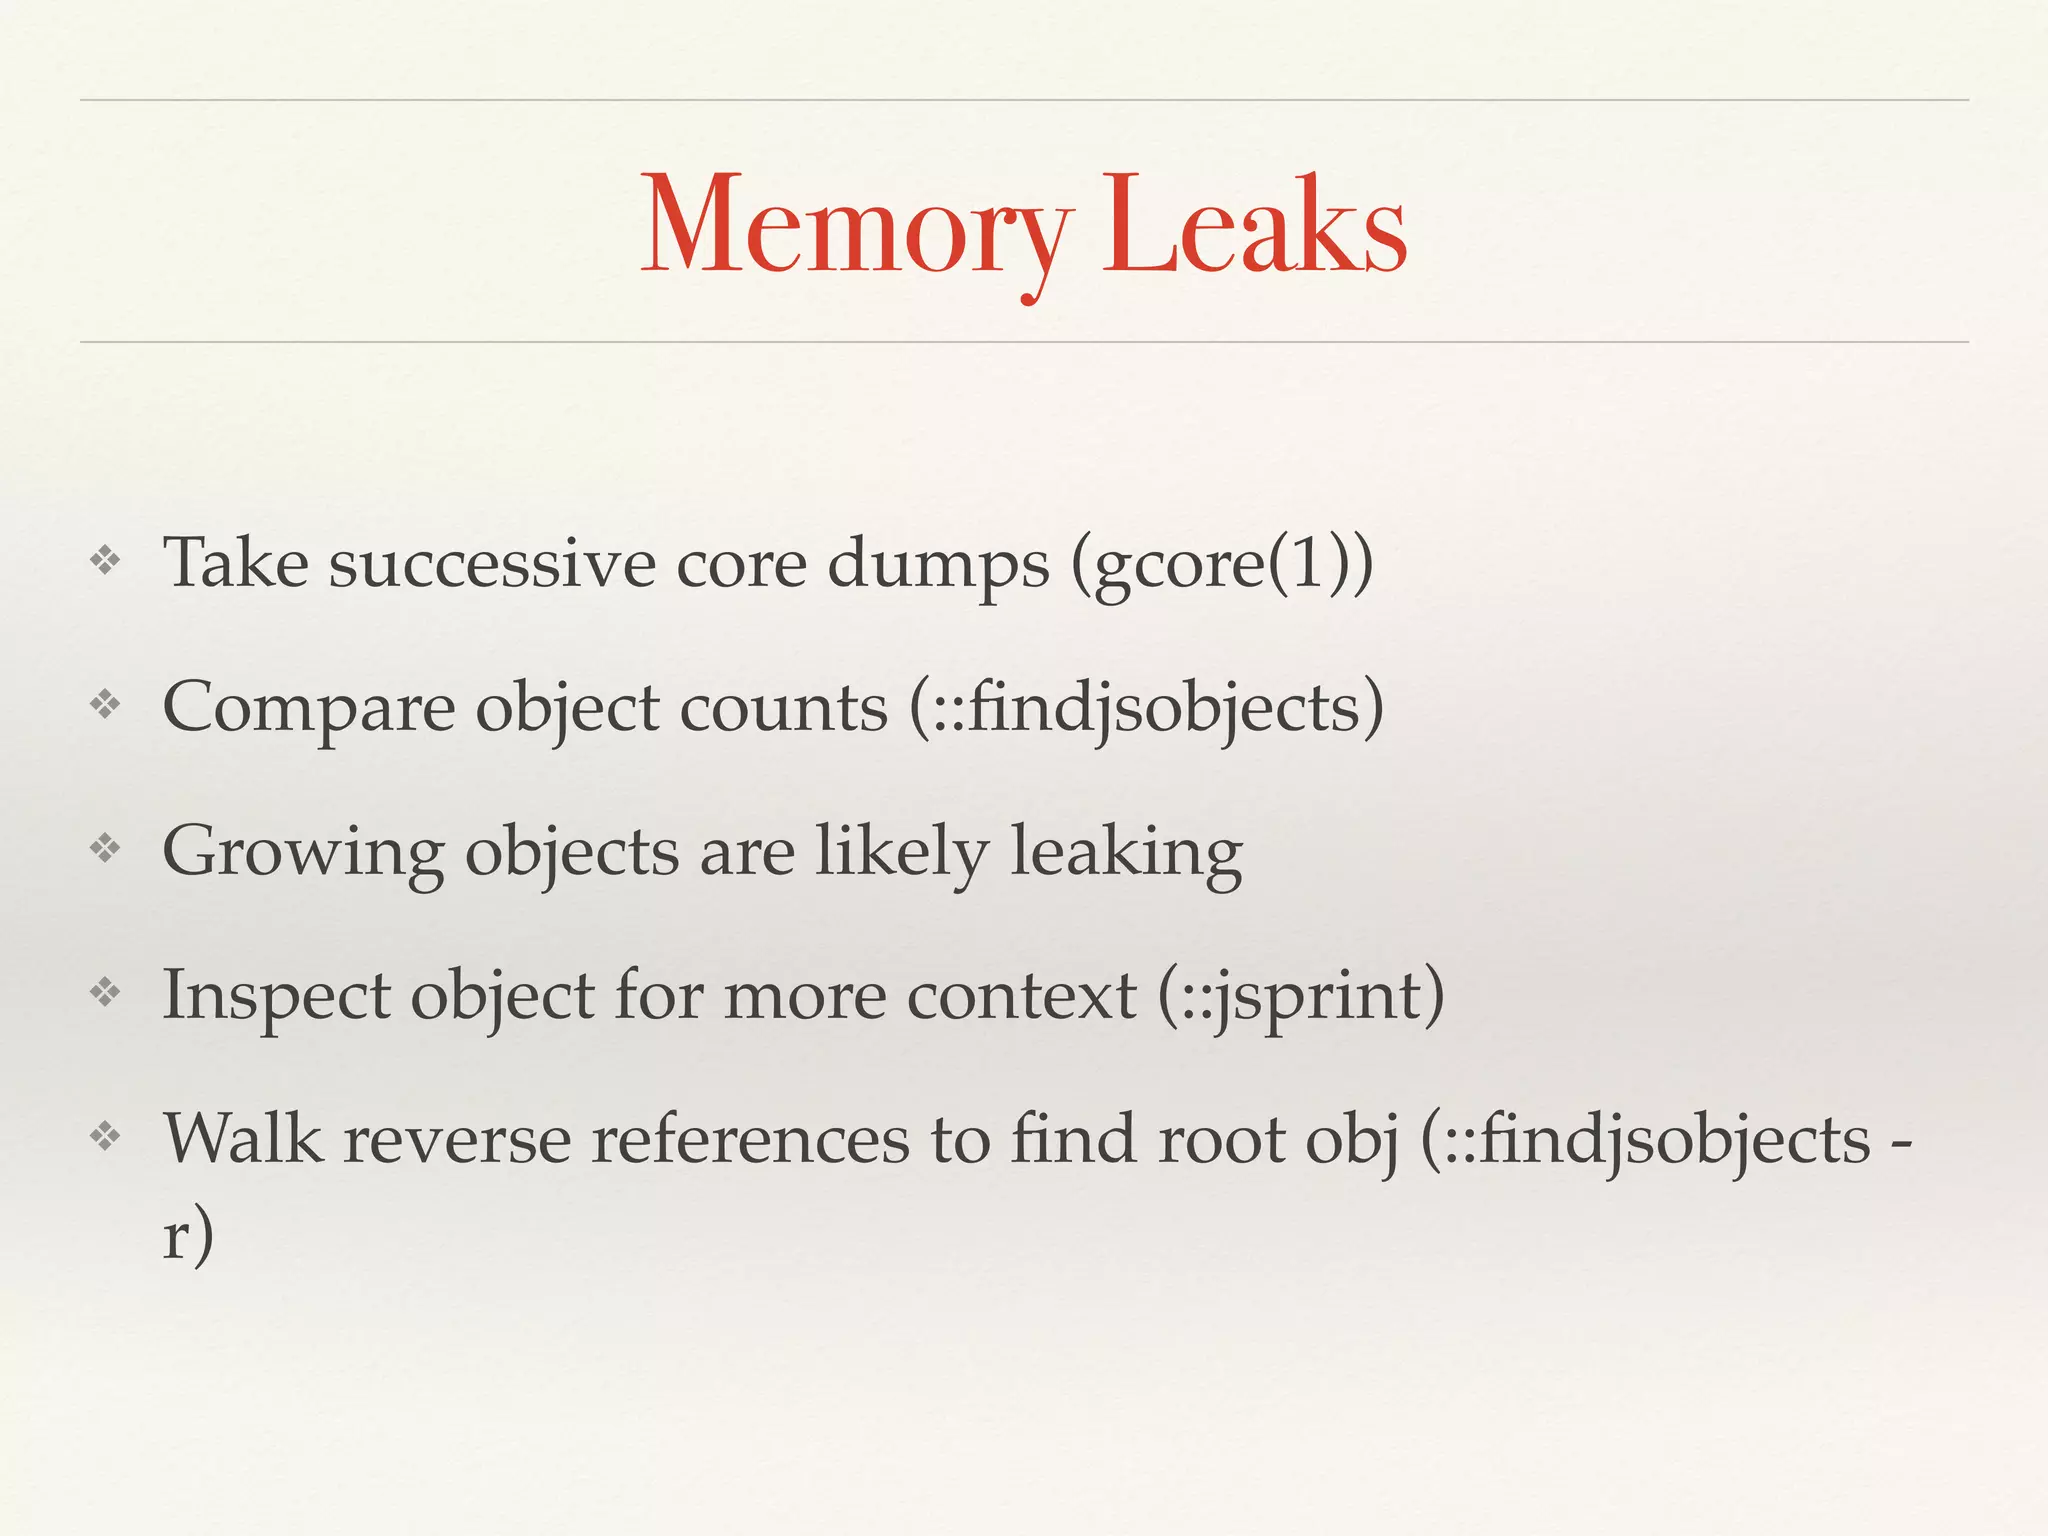
![gcore(1) GNU Tools gcore(1) NAME gcore - Generate a core file for a running process SYNOPSIS gcore [-o filename] pid](https://image.slidesharecdn.com/debuggingnodeinprodnodeinteractive-151209053355-lva1-app6891/75/Node-Interactive-Debugging-Node-js-In-Production-70-2048.jpg)
![Take a Core Dump! root@demo:~# gcore `pgrep node` [Thread debugging using libthread_db enabled] Using host libthread_db library "/lib/x86_64-linux-gnu/ libthread_db.so.1". [New Thread 0x7facaeffd700 (LWP 5650)] [New Thread 0x7facaf7fe700 (LWP 5649)] [New Thread 0x7facaffff700 (LWP 5648)] [New Thread 0x7facbc967700 (LWP 5647)] [New Thread 0x7facbd168700 (LWP 5617)] [New Thread 0x7facbd969700 (LWP 5616)] [New Thread 0x7facbe16a700 (LWP 5615)] [New Thread 0x7facbe96b700 (LWP 5614)] 0x00007facbea5b5a9 in syscall () from /lib/x86_64-linux-gnu/libc.so.6 Saved corefile core.5602](https://image.slidesharecdn.com/debuggingnodeinprodnodeinteractive-151209053355-lva1-app6891/75/Node-Interactive-Debugging-Node-js-In-Production-71-2048.jpg)
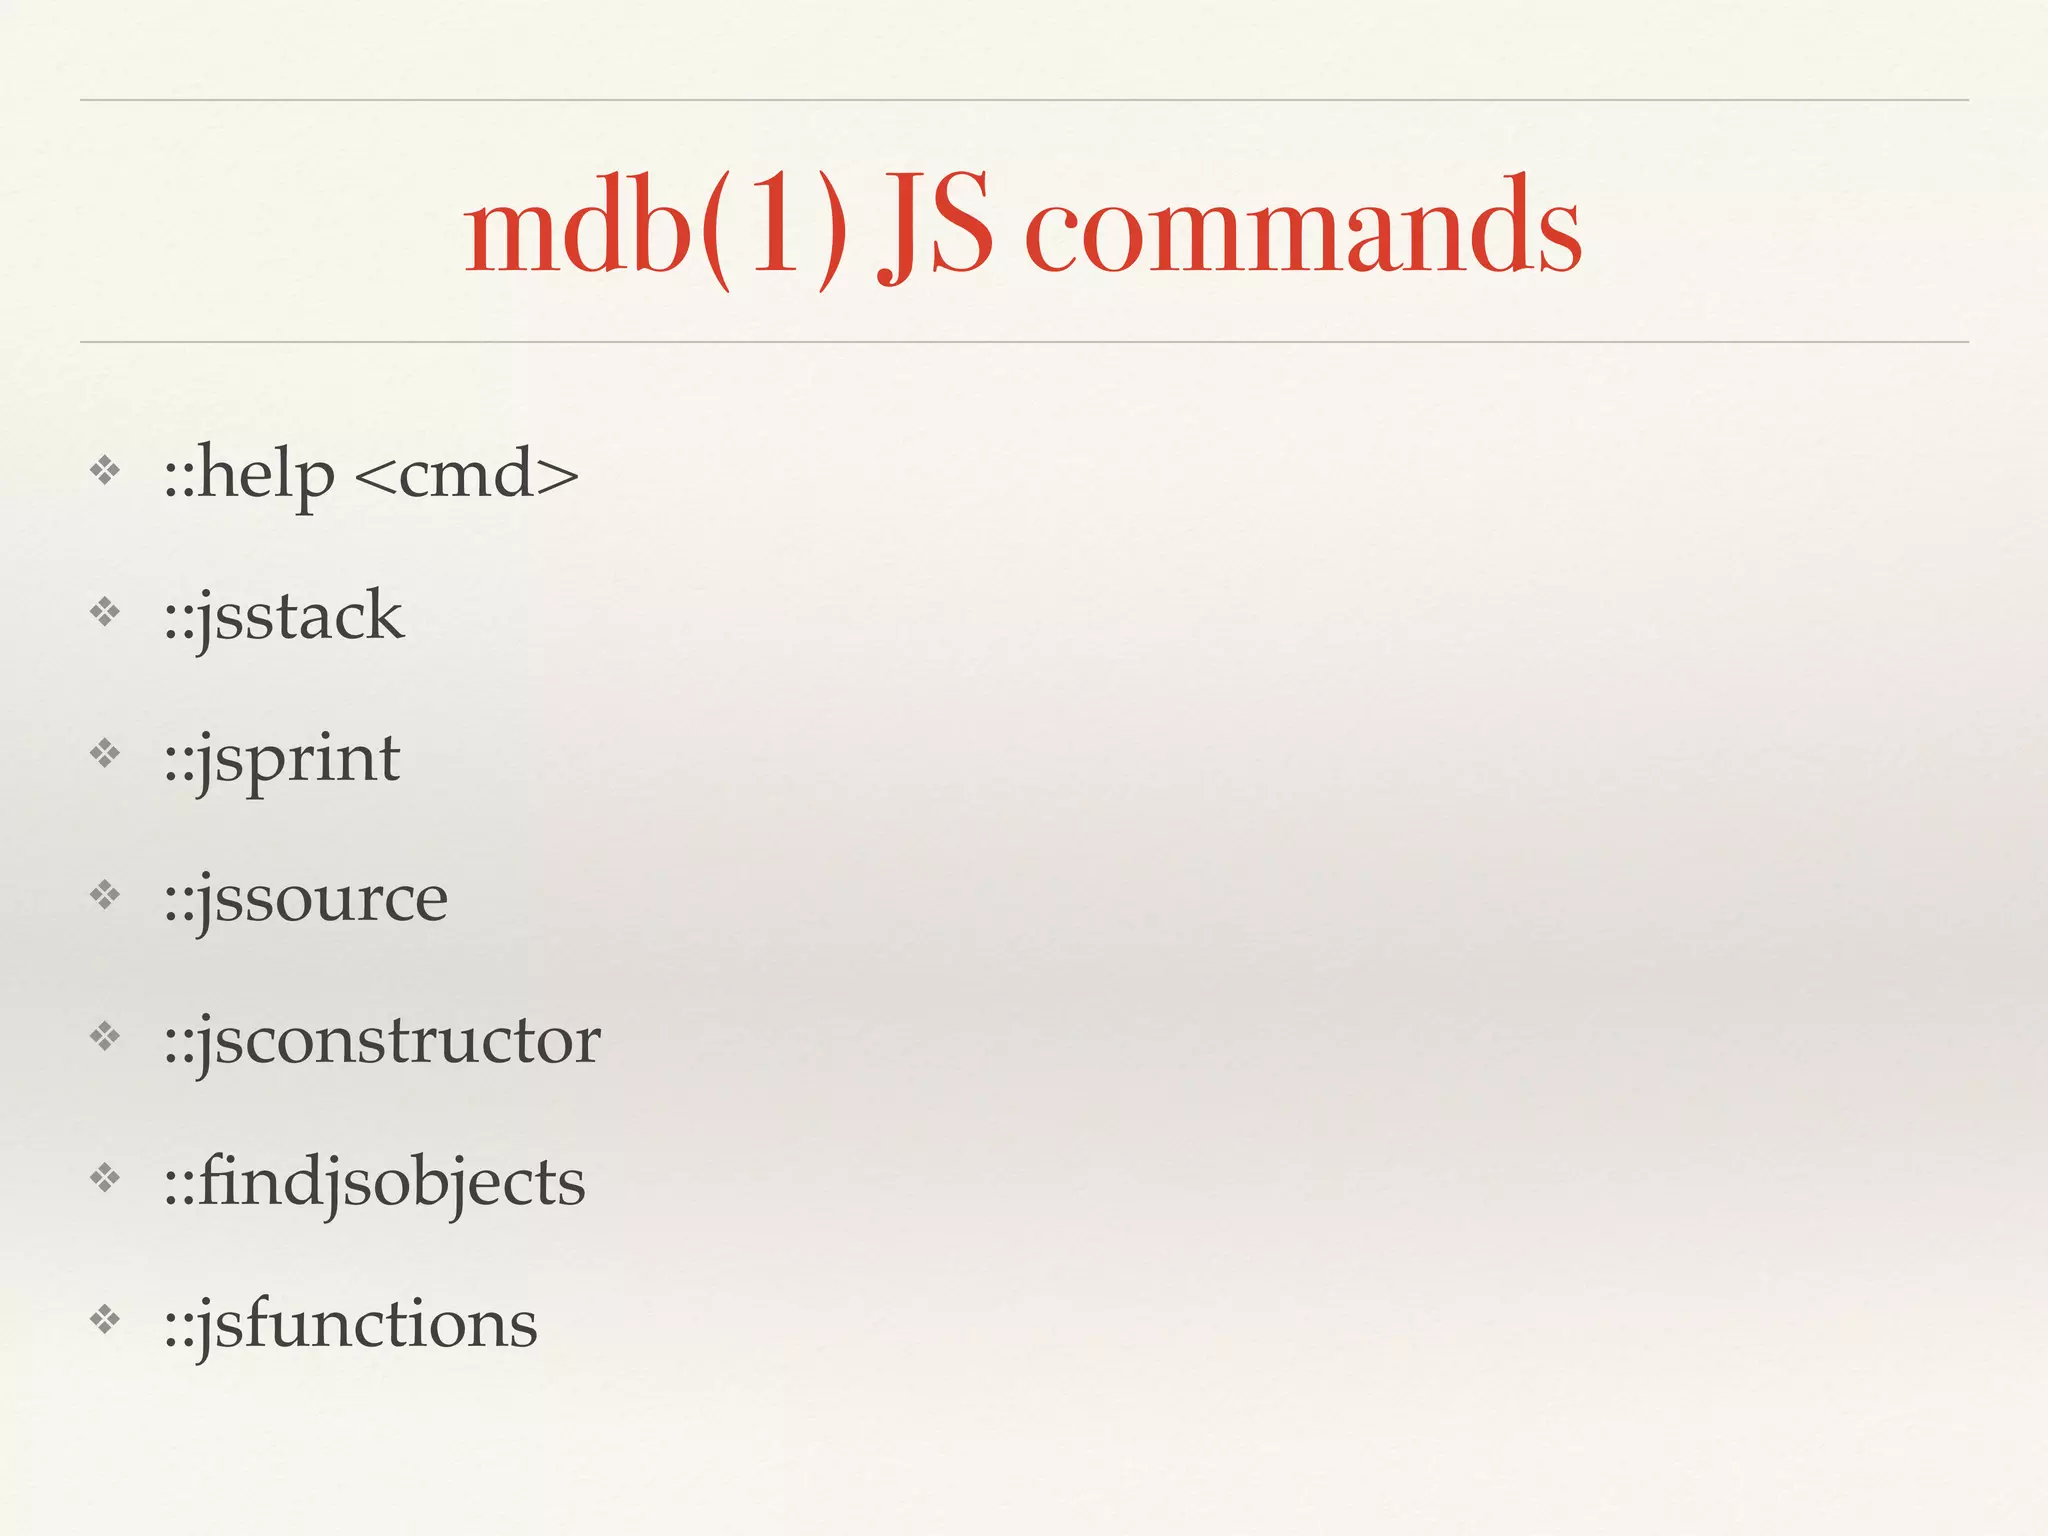
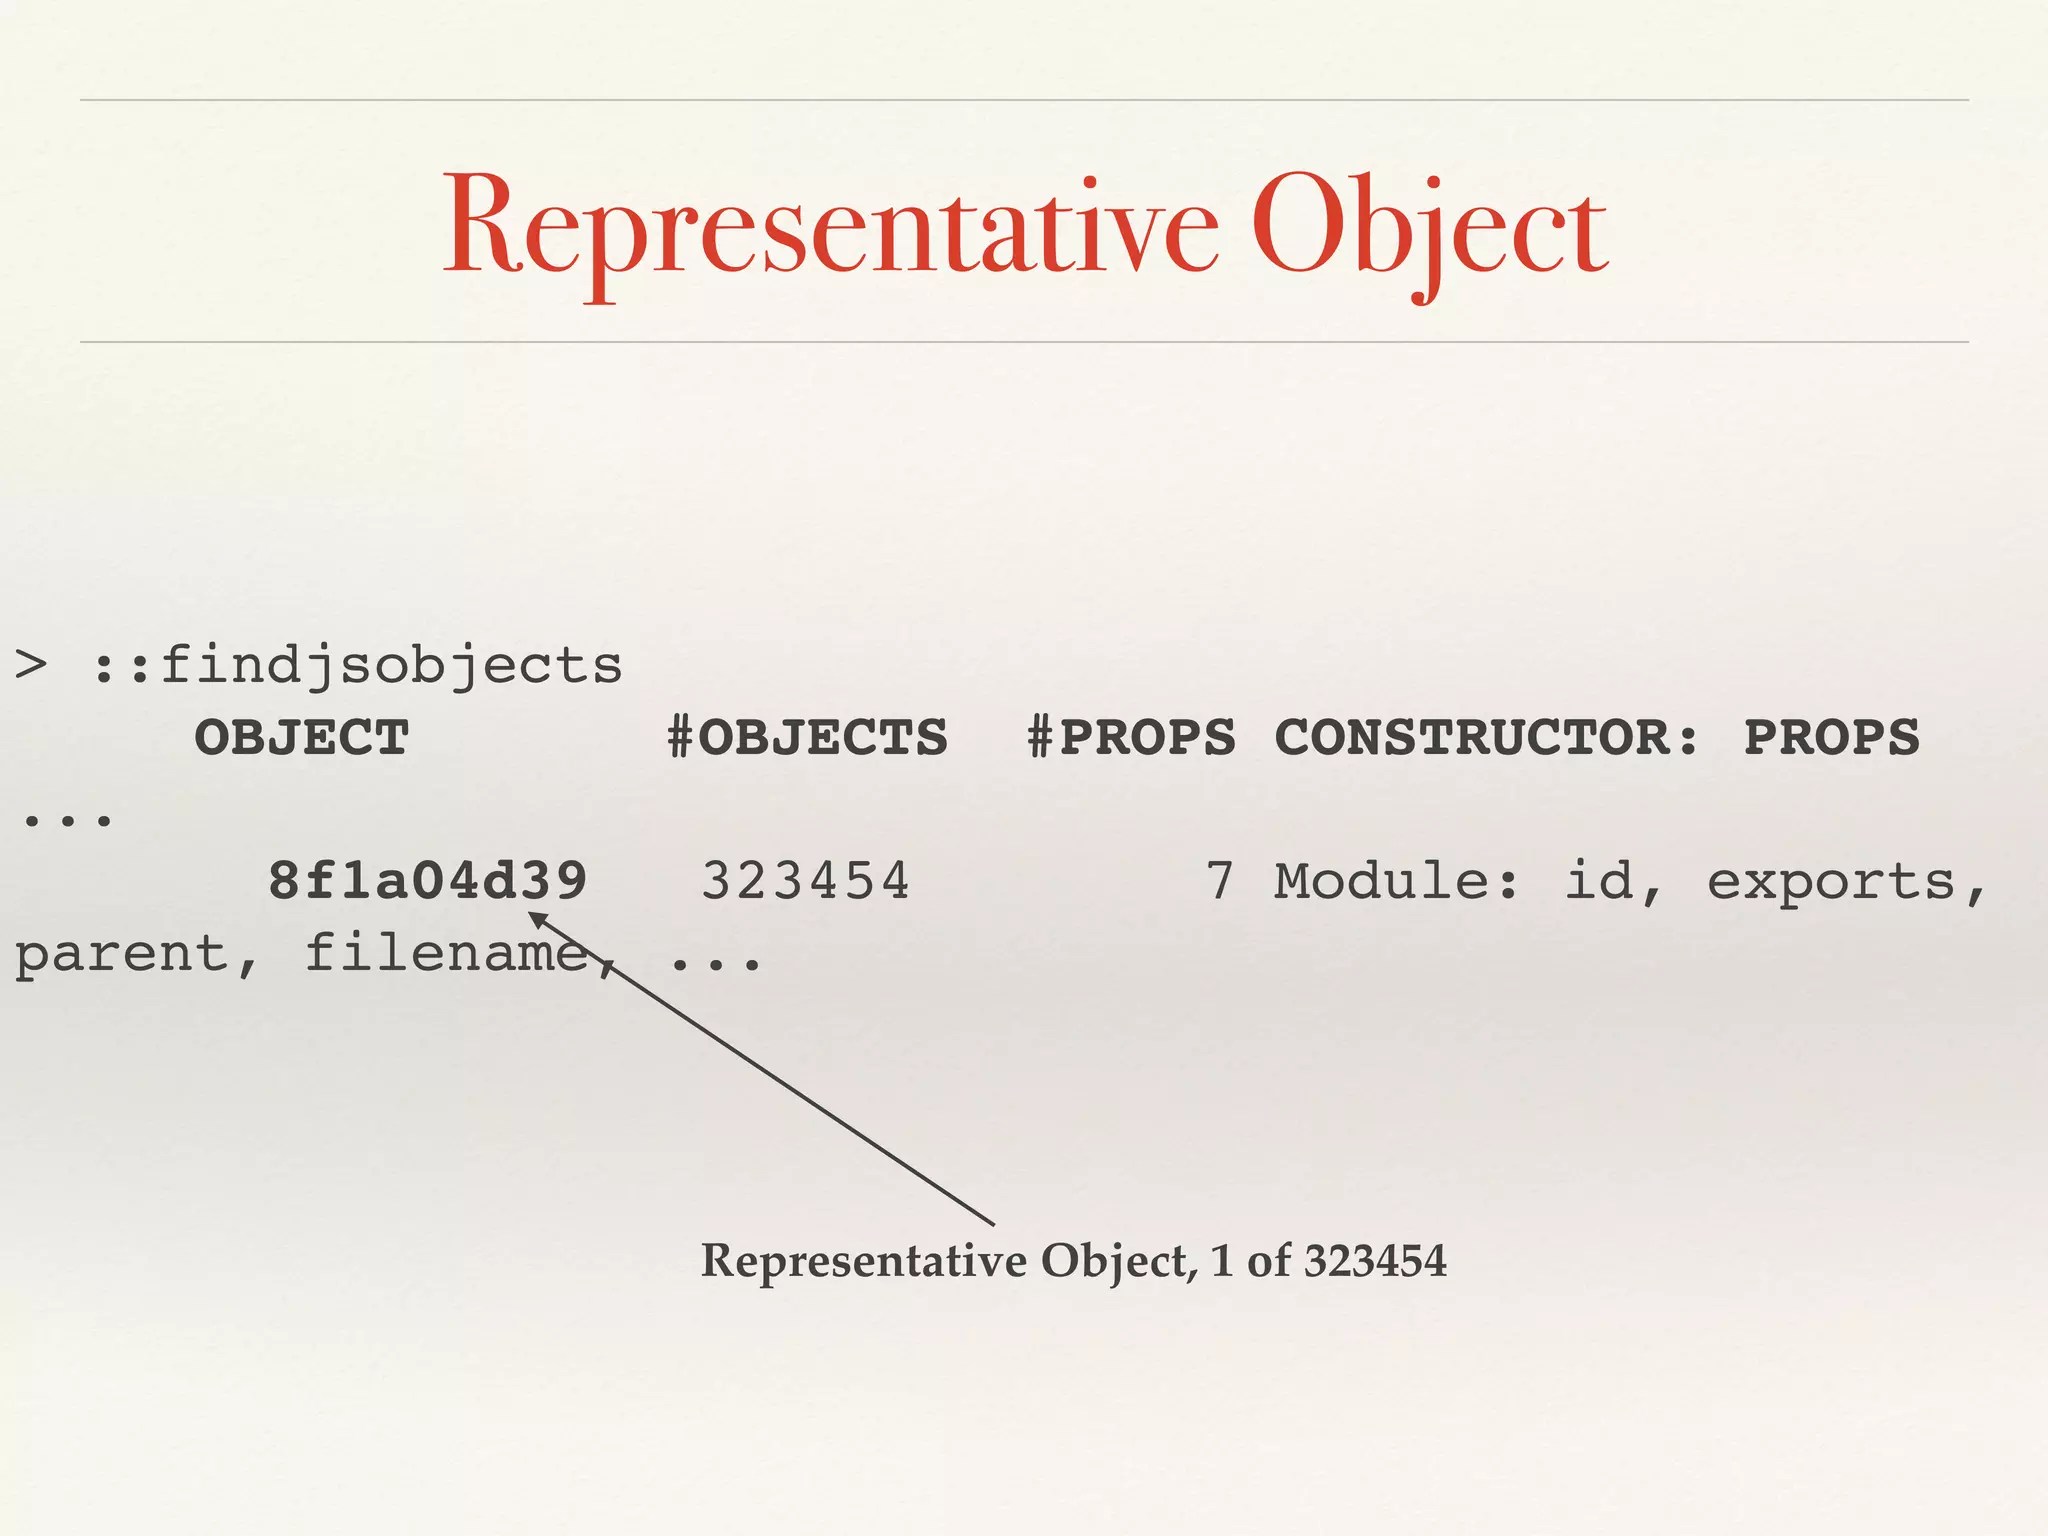
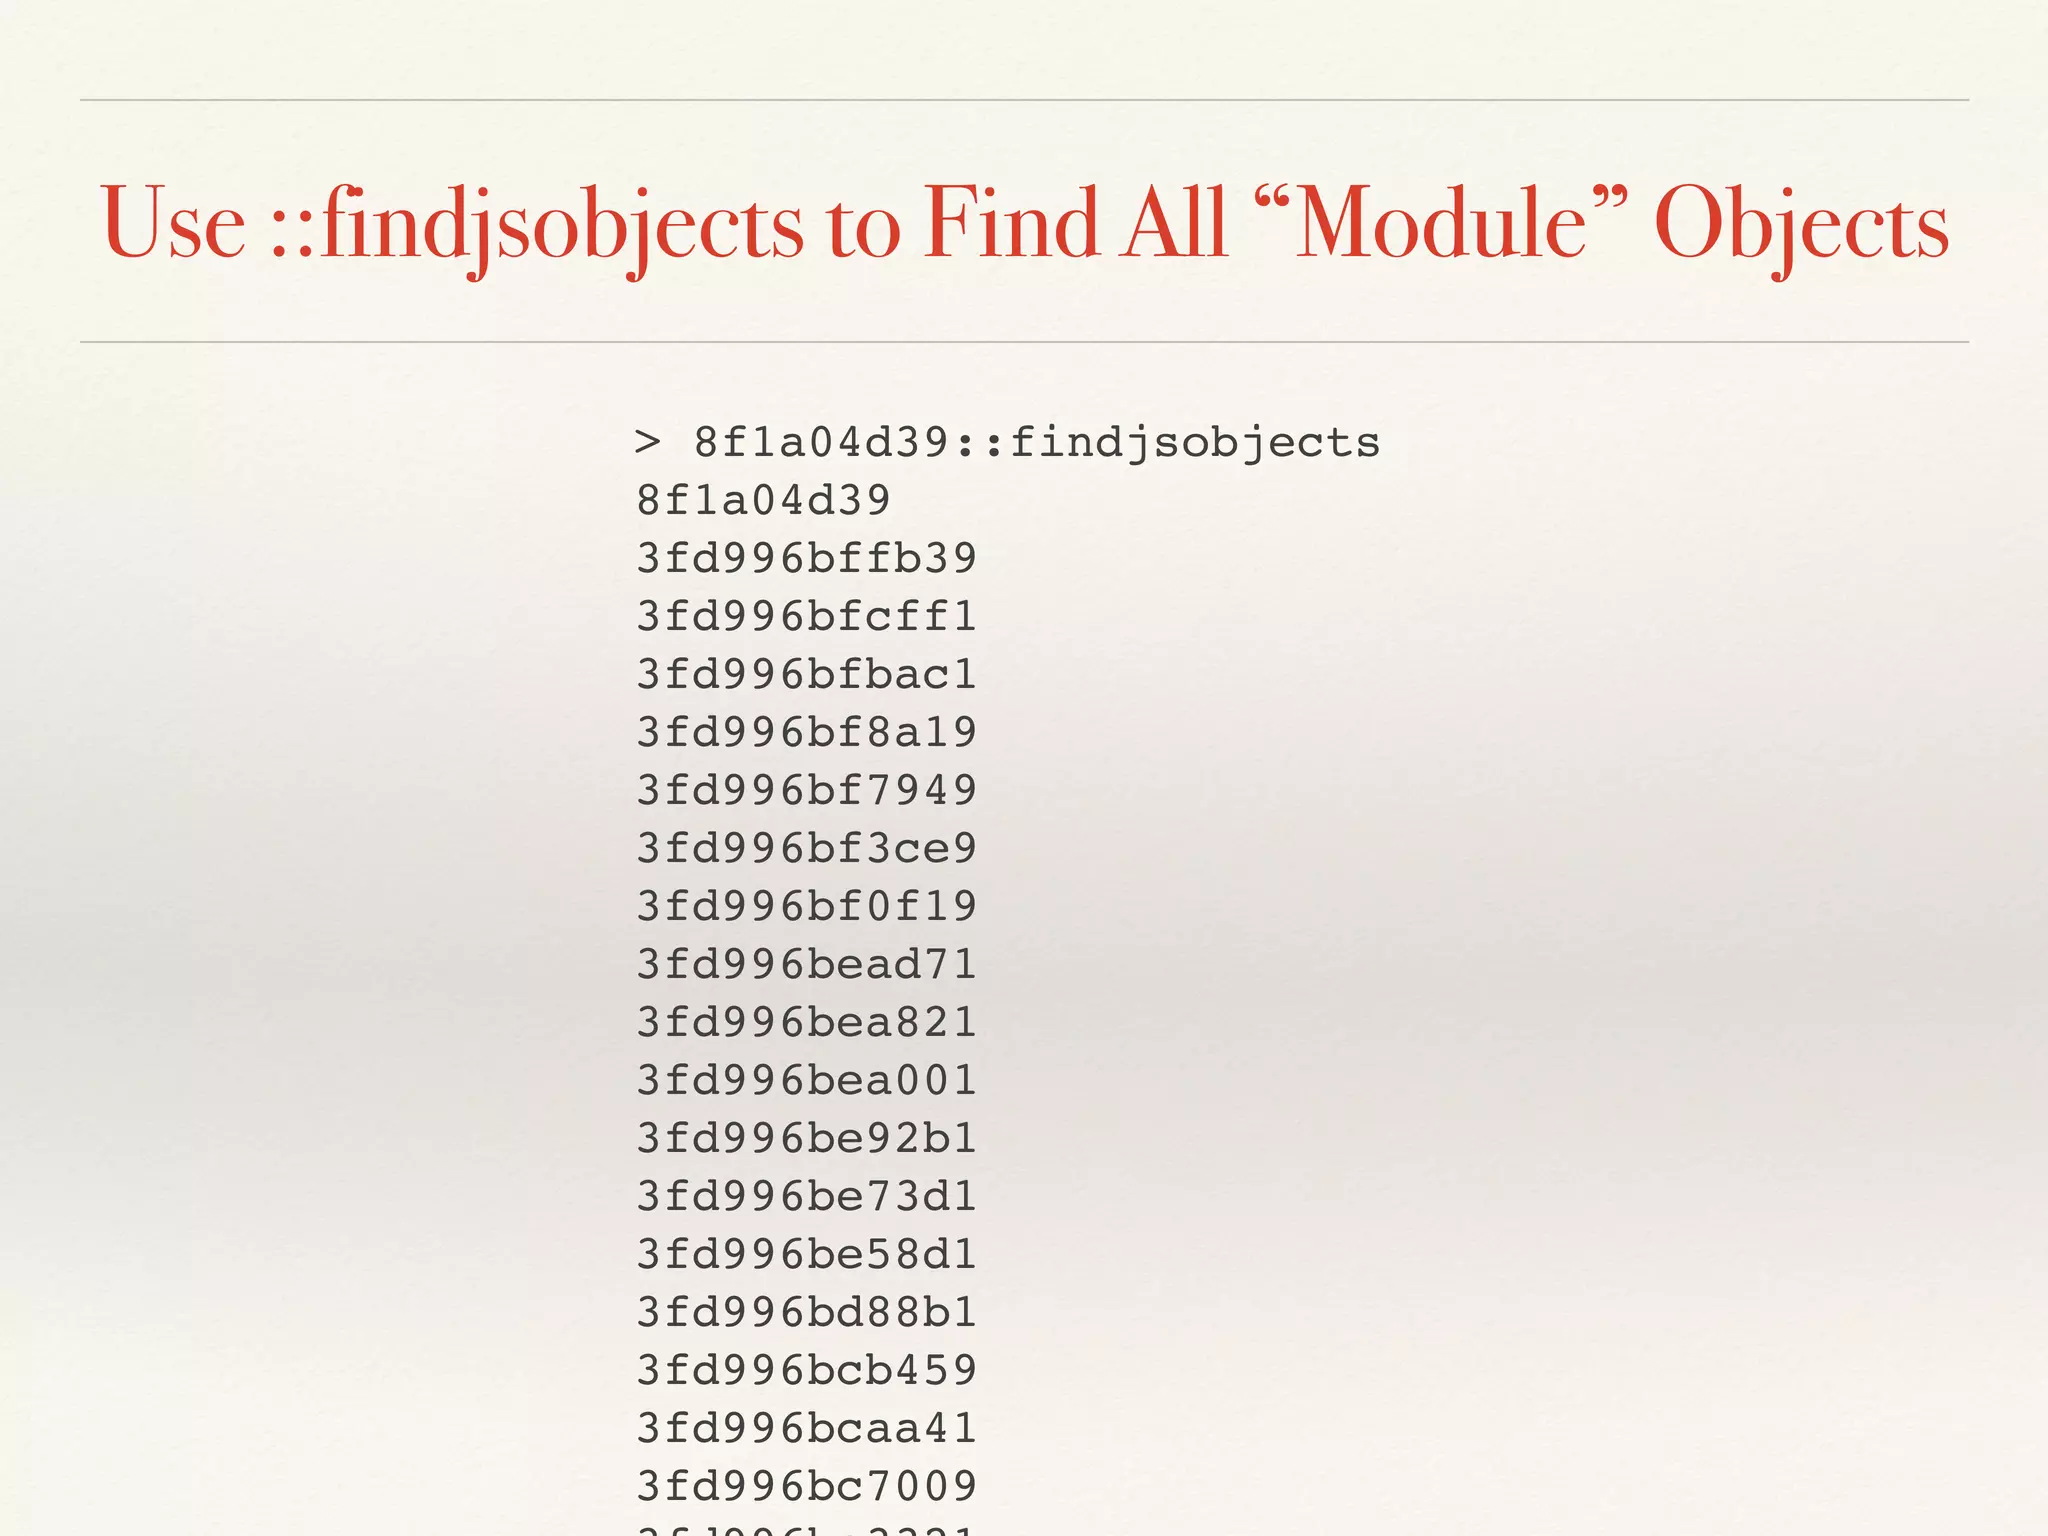
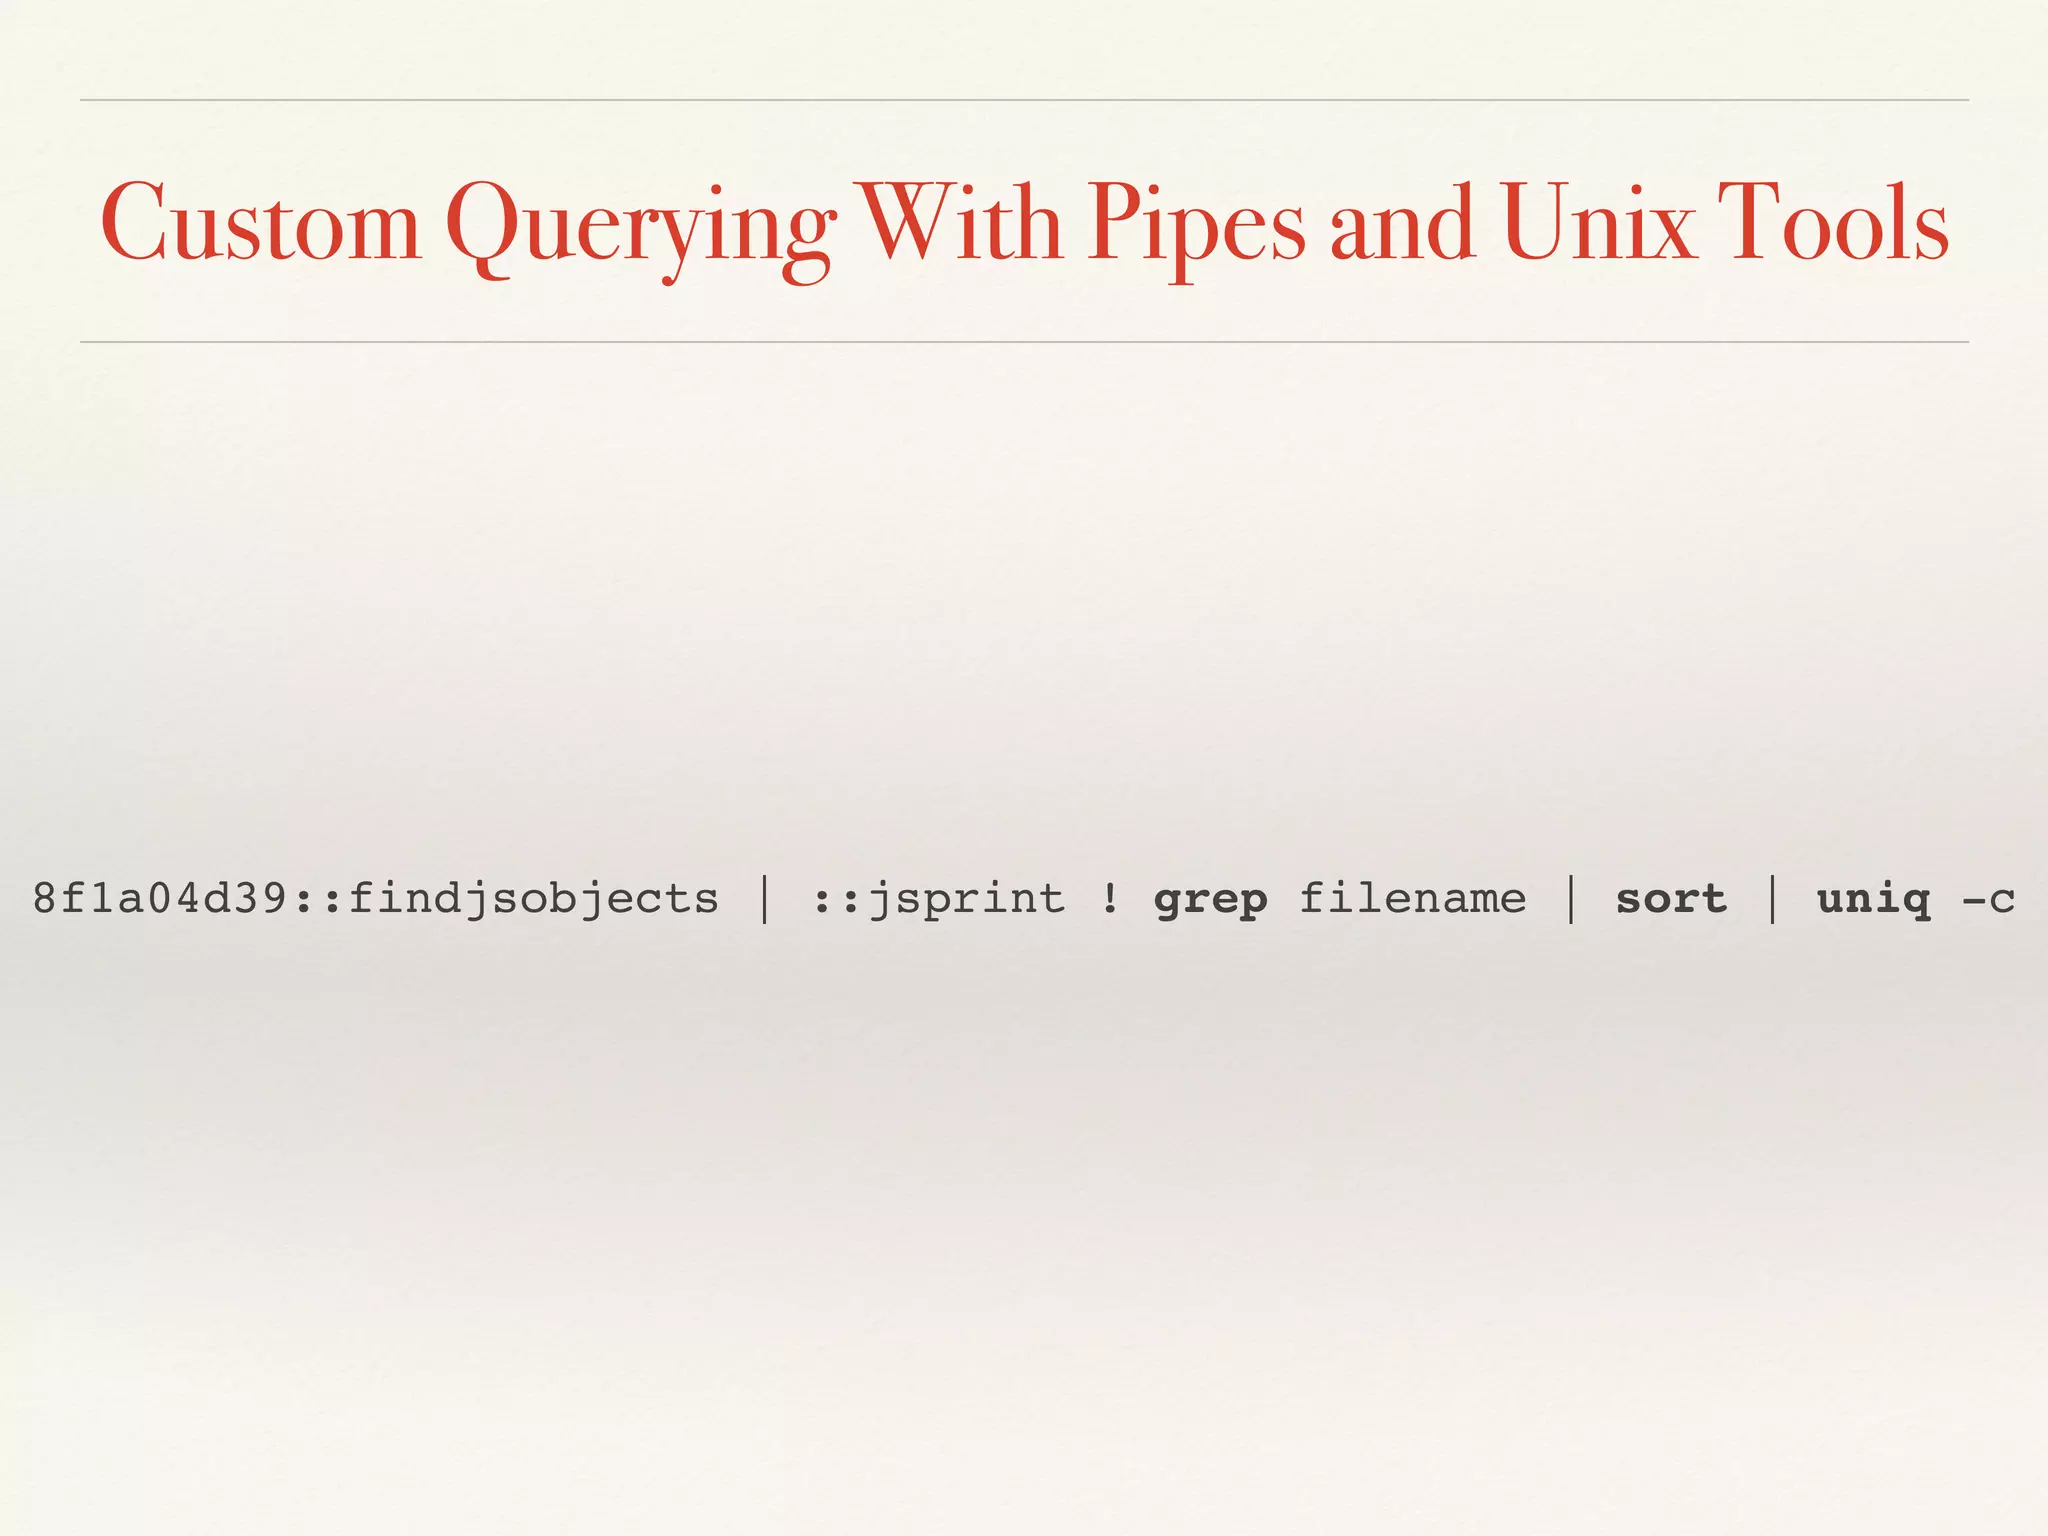
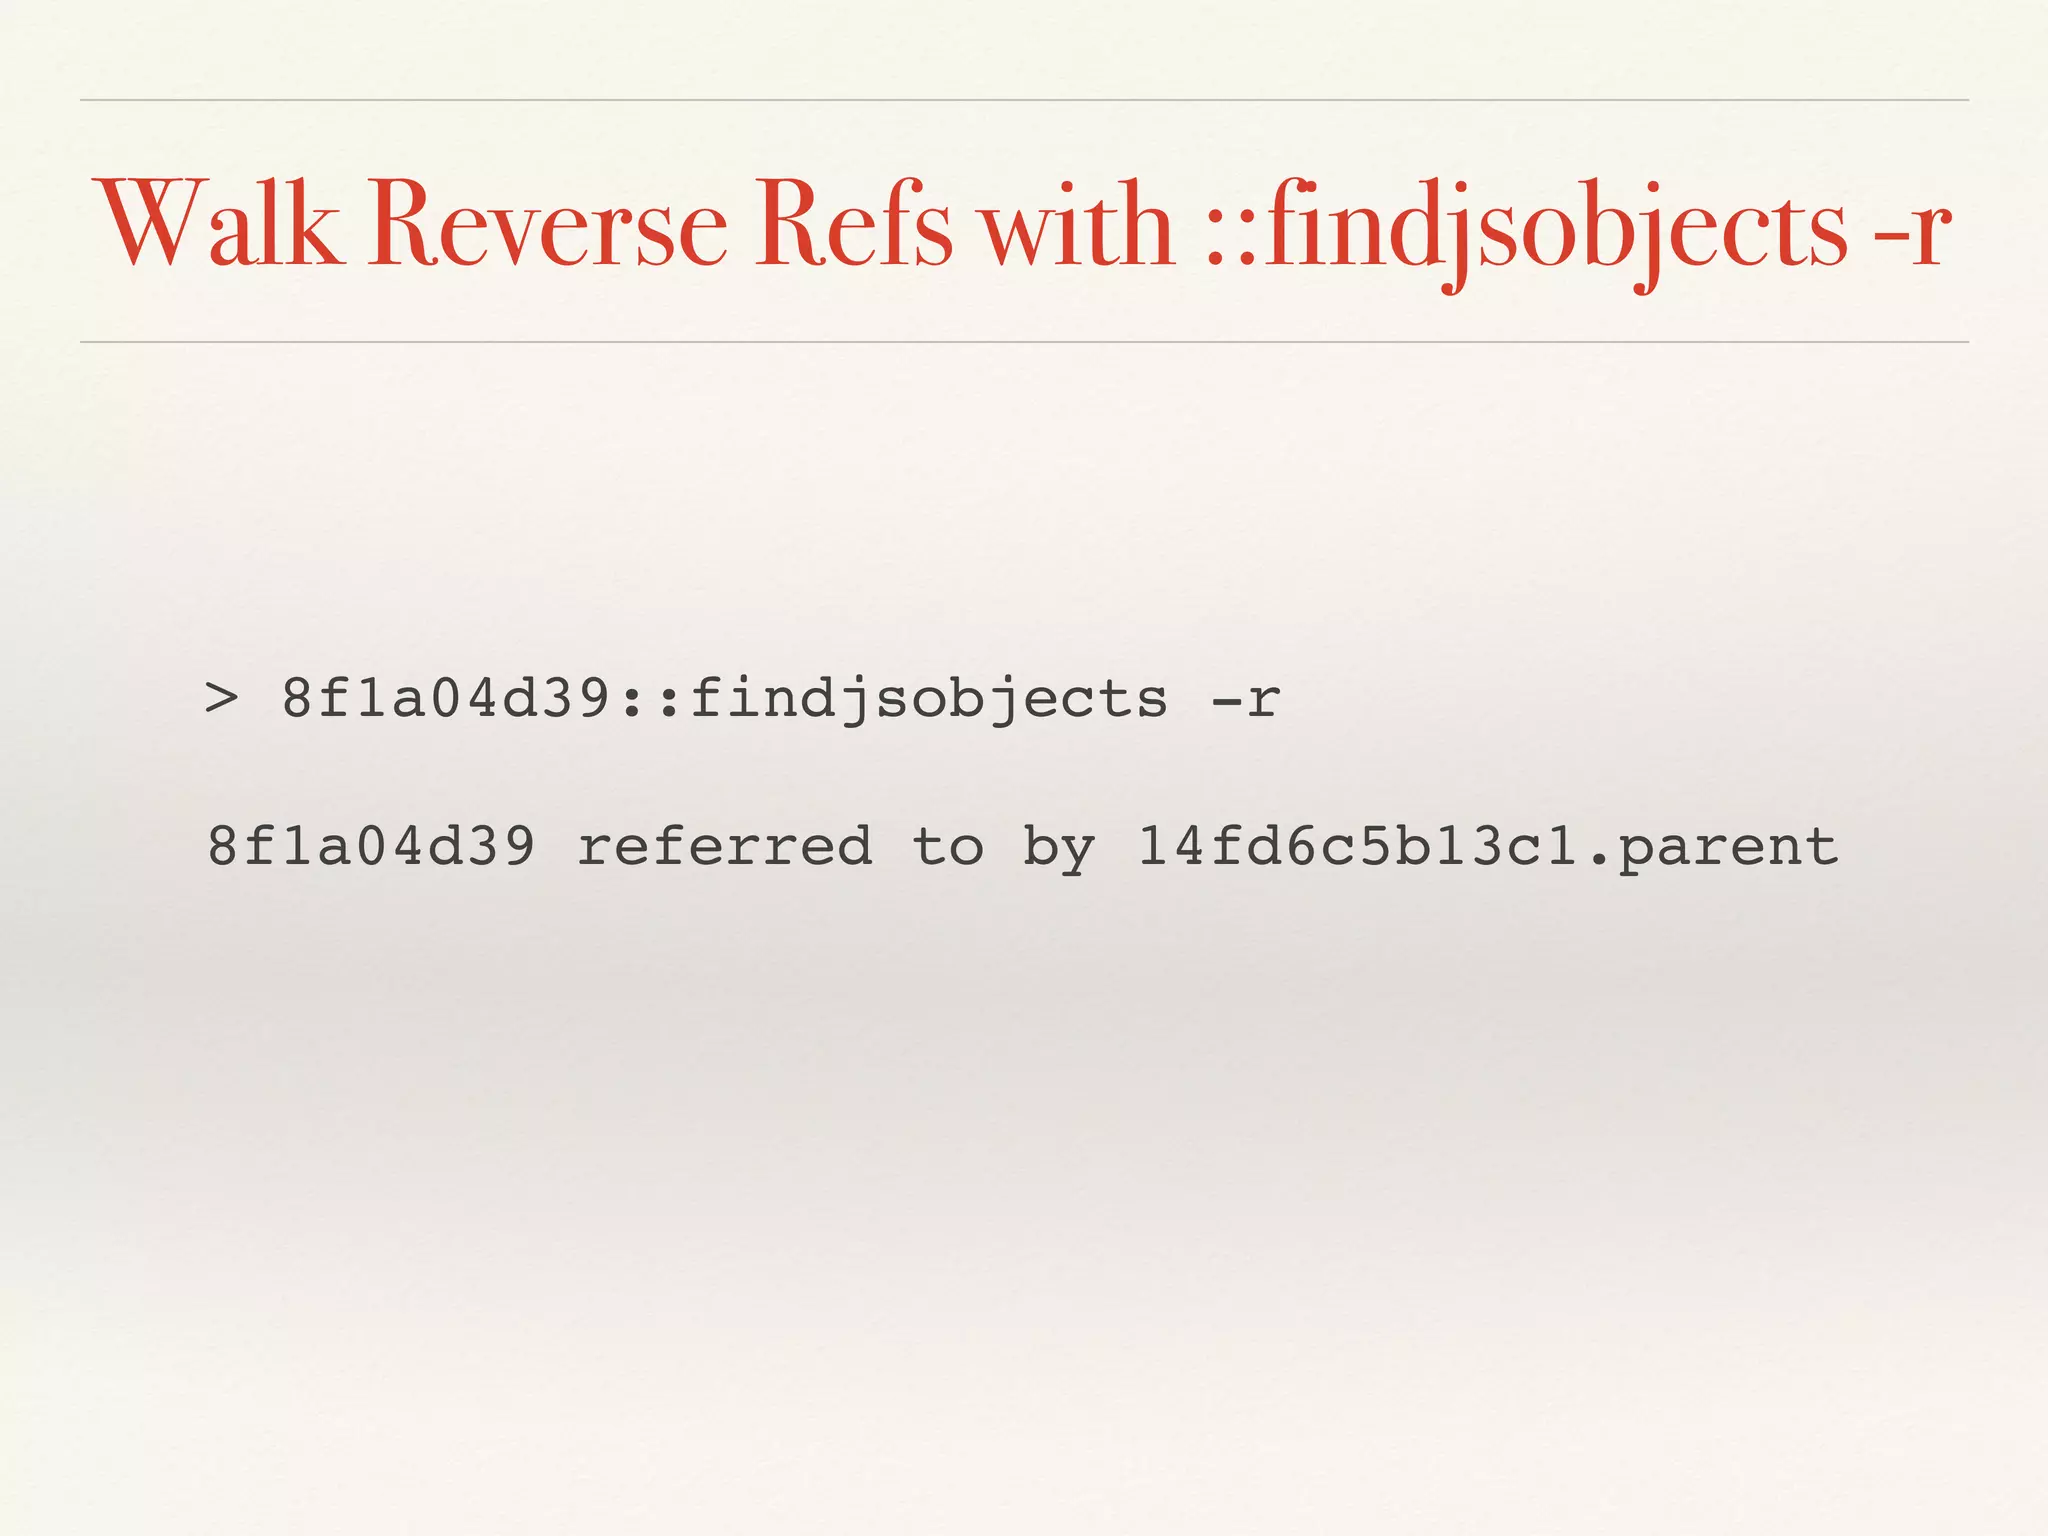
![::findjsobjects NAME findjsobjects - find JavaScript objects SYNOPSIS [ addr ] ::findjsobjects [-vb] [-r | -c cons | -p prop]](https://image.slidesharecdn.com/debuggingnodeinprodnodeinteractive-151209053355-lva1-app6891/75/Node-Interactive-Debugging-Node-js-In-Production-73-2048.jpg)


![Look Closer > 8f1a04d39::jsprint { "id": "/apps/node/webapp/ui/js/pages/akiraClient.js", "exports": {}, "parent": { "id": "/apps/node/webapp/middleware/autoClientStrings.js", "exports": function autoExposeClientStrings, "parent": [...], "filename": "/apps/node/webapp/middleware/ autoClientStrings.js", "loaded": true, "children": [...], "paths": [...], }, "filename": "/apps/node/webapp/ui/js/pages/akiraClient.js",](https://image.slidesharecdn.com/debuggingnodeinprodnodeinteractive-151209053355-lva1-app6891/75/Node-Interactive-Debugging-Node-js-In-Production-81-2048.jpg)


![Root Object > 1f313791bb41::jsprint [ { "id": "/apps/node/webapp/ui/js/pages/akiraClient.js", "exports": [...], "parent": [...], "filename": "/apps/node/webapp/ui/js/pages/akiraClient.js", "loaded": false, "children": [...], "paths": [...], }, { "id": "/apps/node/webapp/ui/js/pages/akiraClient.js", "exports": [...], "parent": [...], "filename": "/apps/node/webapp/ui/js/pages/akiraClient.js", "loaded": false, "children": [...], "paths": [...], }, { "id": "/apps/node/webapp/ui/js/pages/akiraClient.js", "exports": [...], "parent": [...],](https://image.slidesharecdn.com/debuggingnodeinprodnodeinteractive-151209053355-lva1-app6891/75/Node-Interactive-Debugging-Node-js-In-Production-89-2048.jpg)
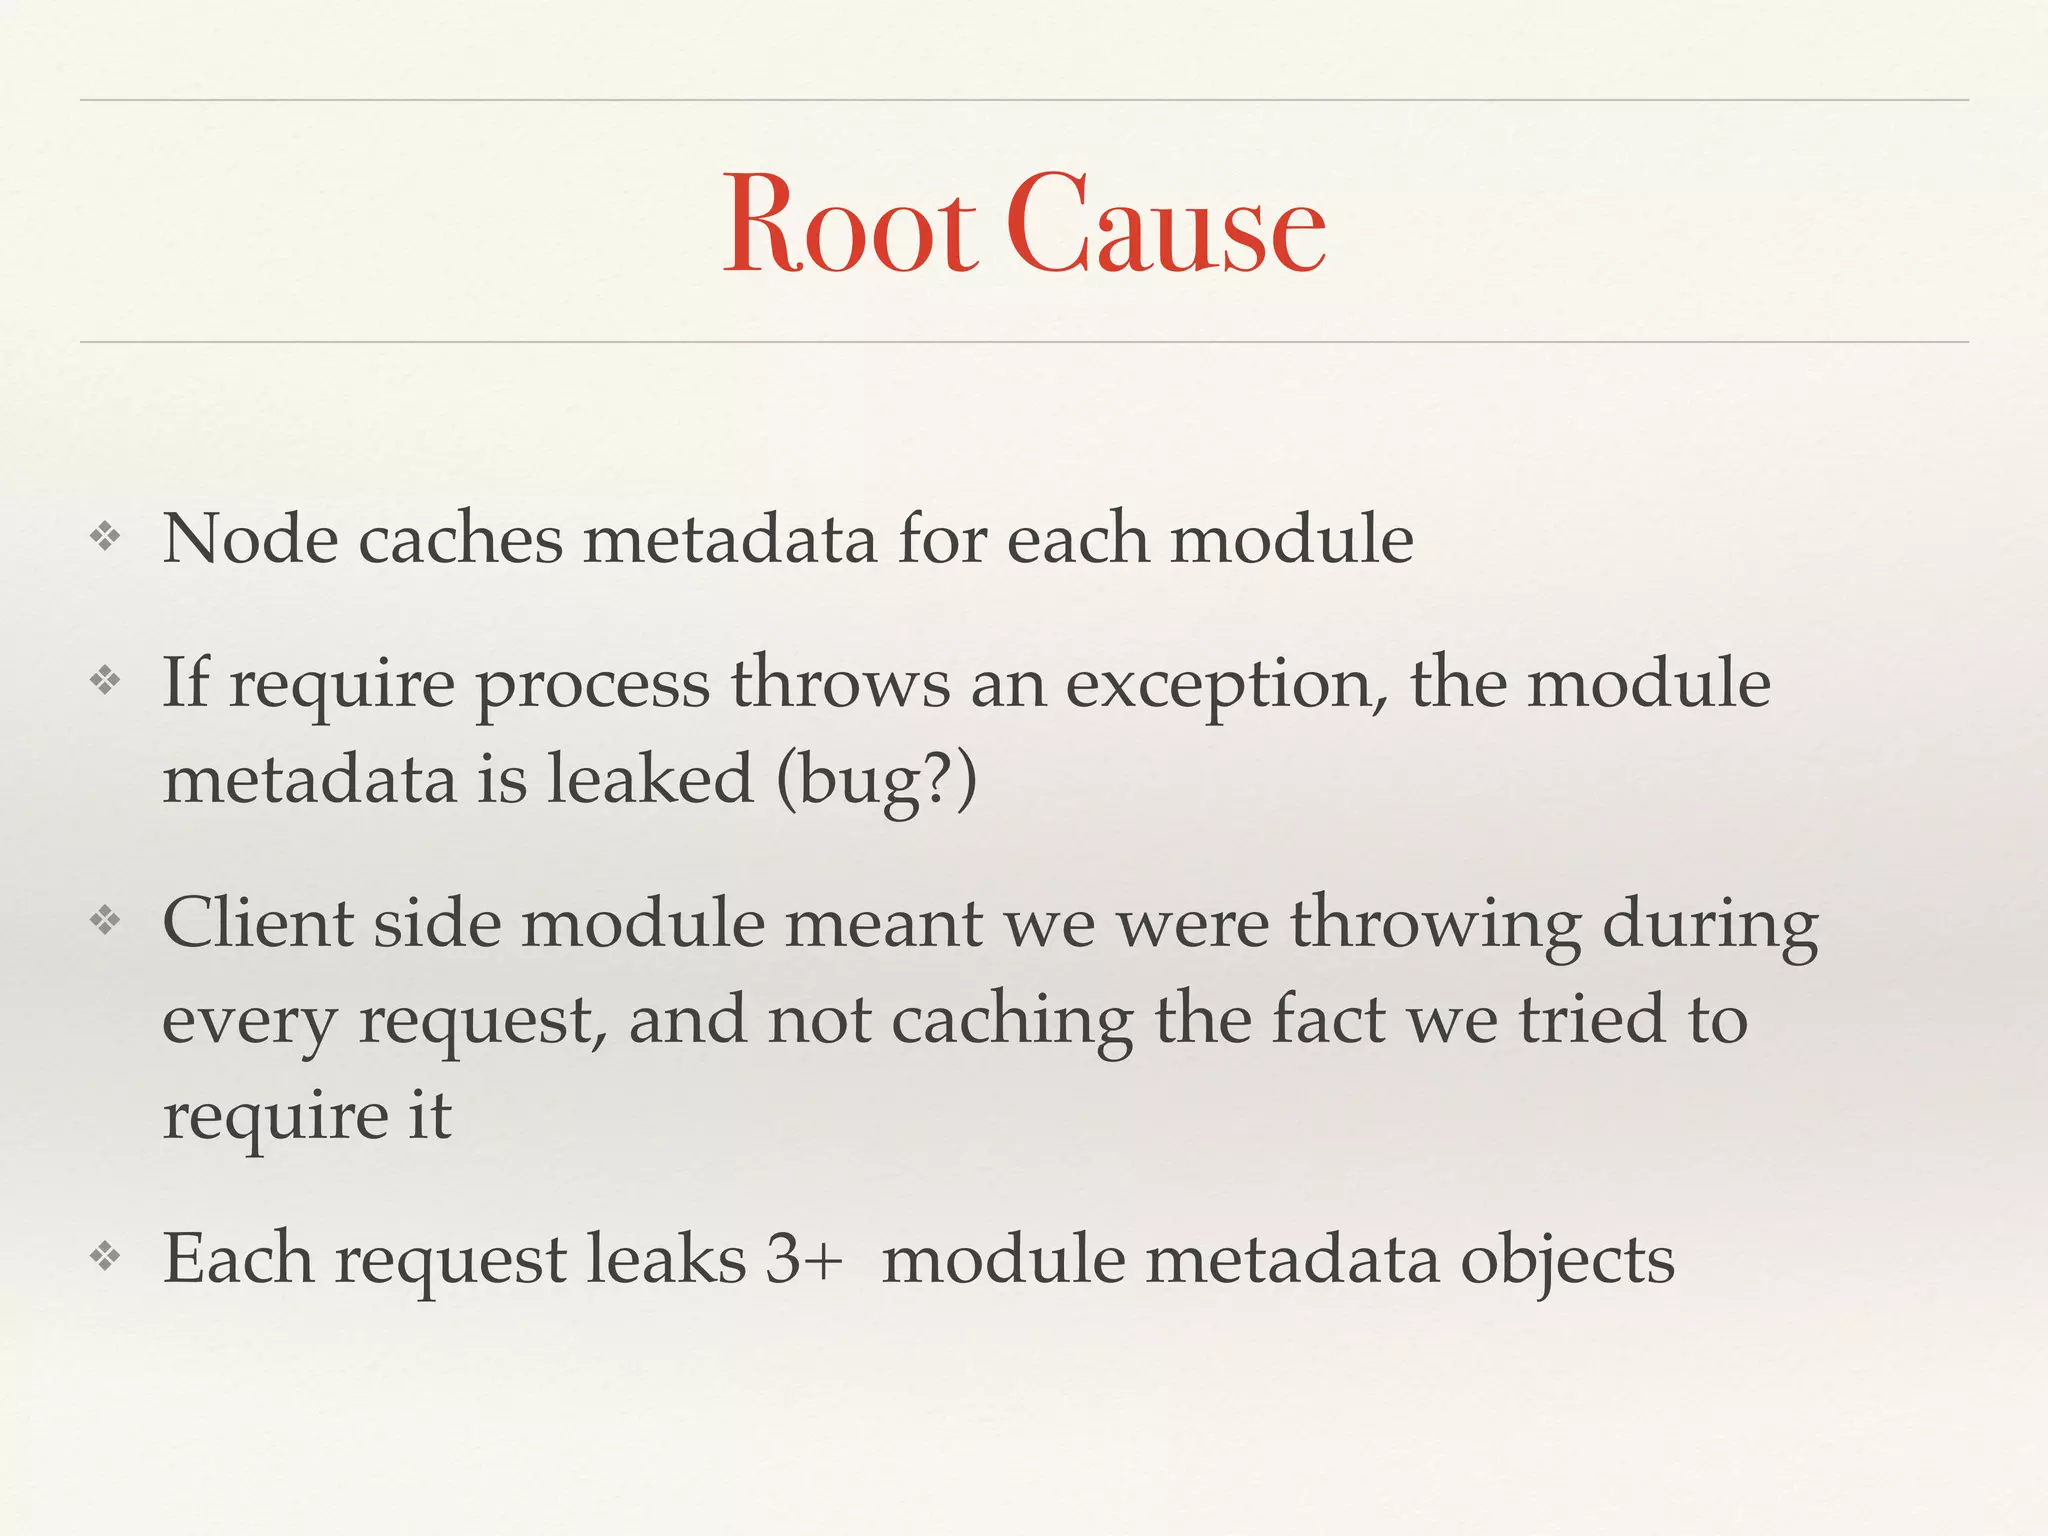
![Spot the Leak var cache = {}; function checkCache(someModule) { var mod = cache[someModule]; if (!mod) { try { mod = require(someModule); cache[someModule] = mod; return mod; } catch (e) { return {}; } } return mod; } Module could be client only, must catch Should cache the fact we caught an exception here](https://image.slidesharecdn.com/debuggingnodeinprodnodeinteractive-151209053355-lva1-app6891/75/Node-Interactive-Debugging-Node-js-In-Production-90-2048.jpg)


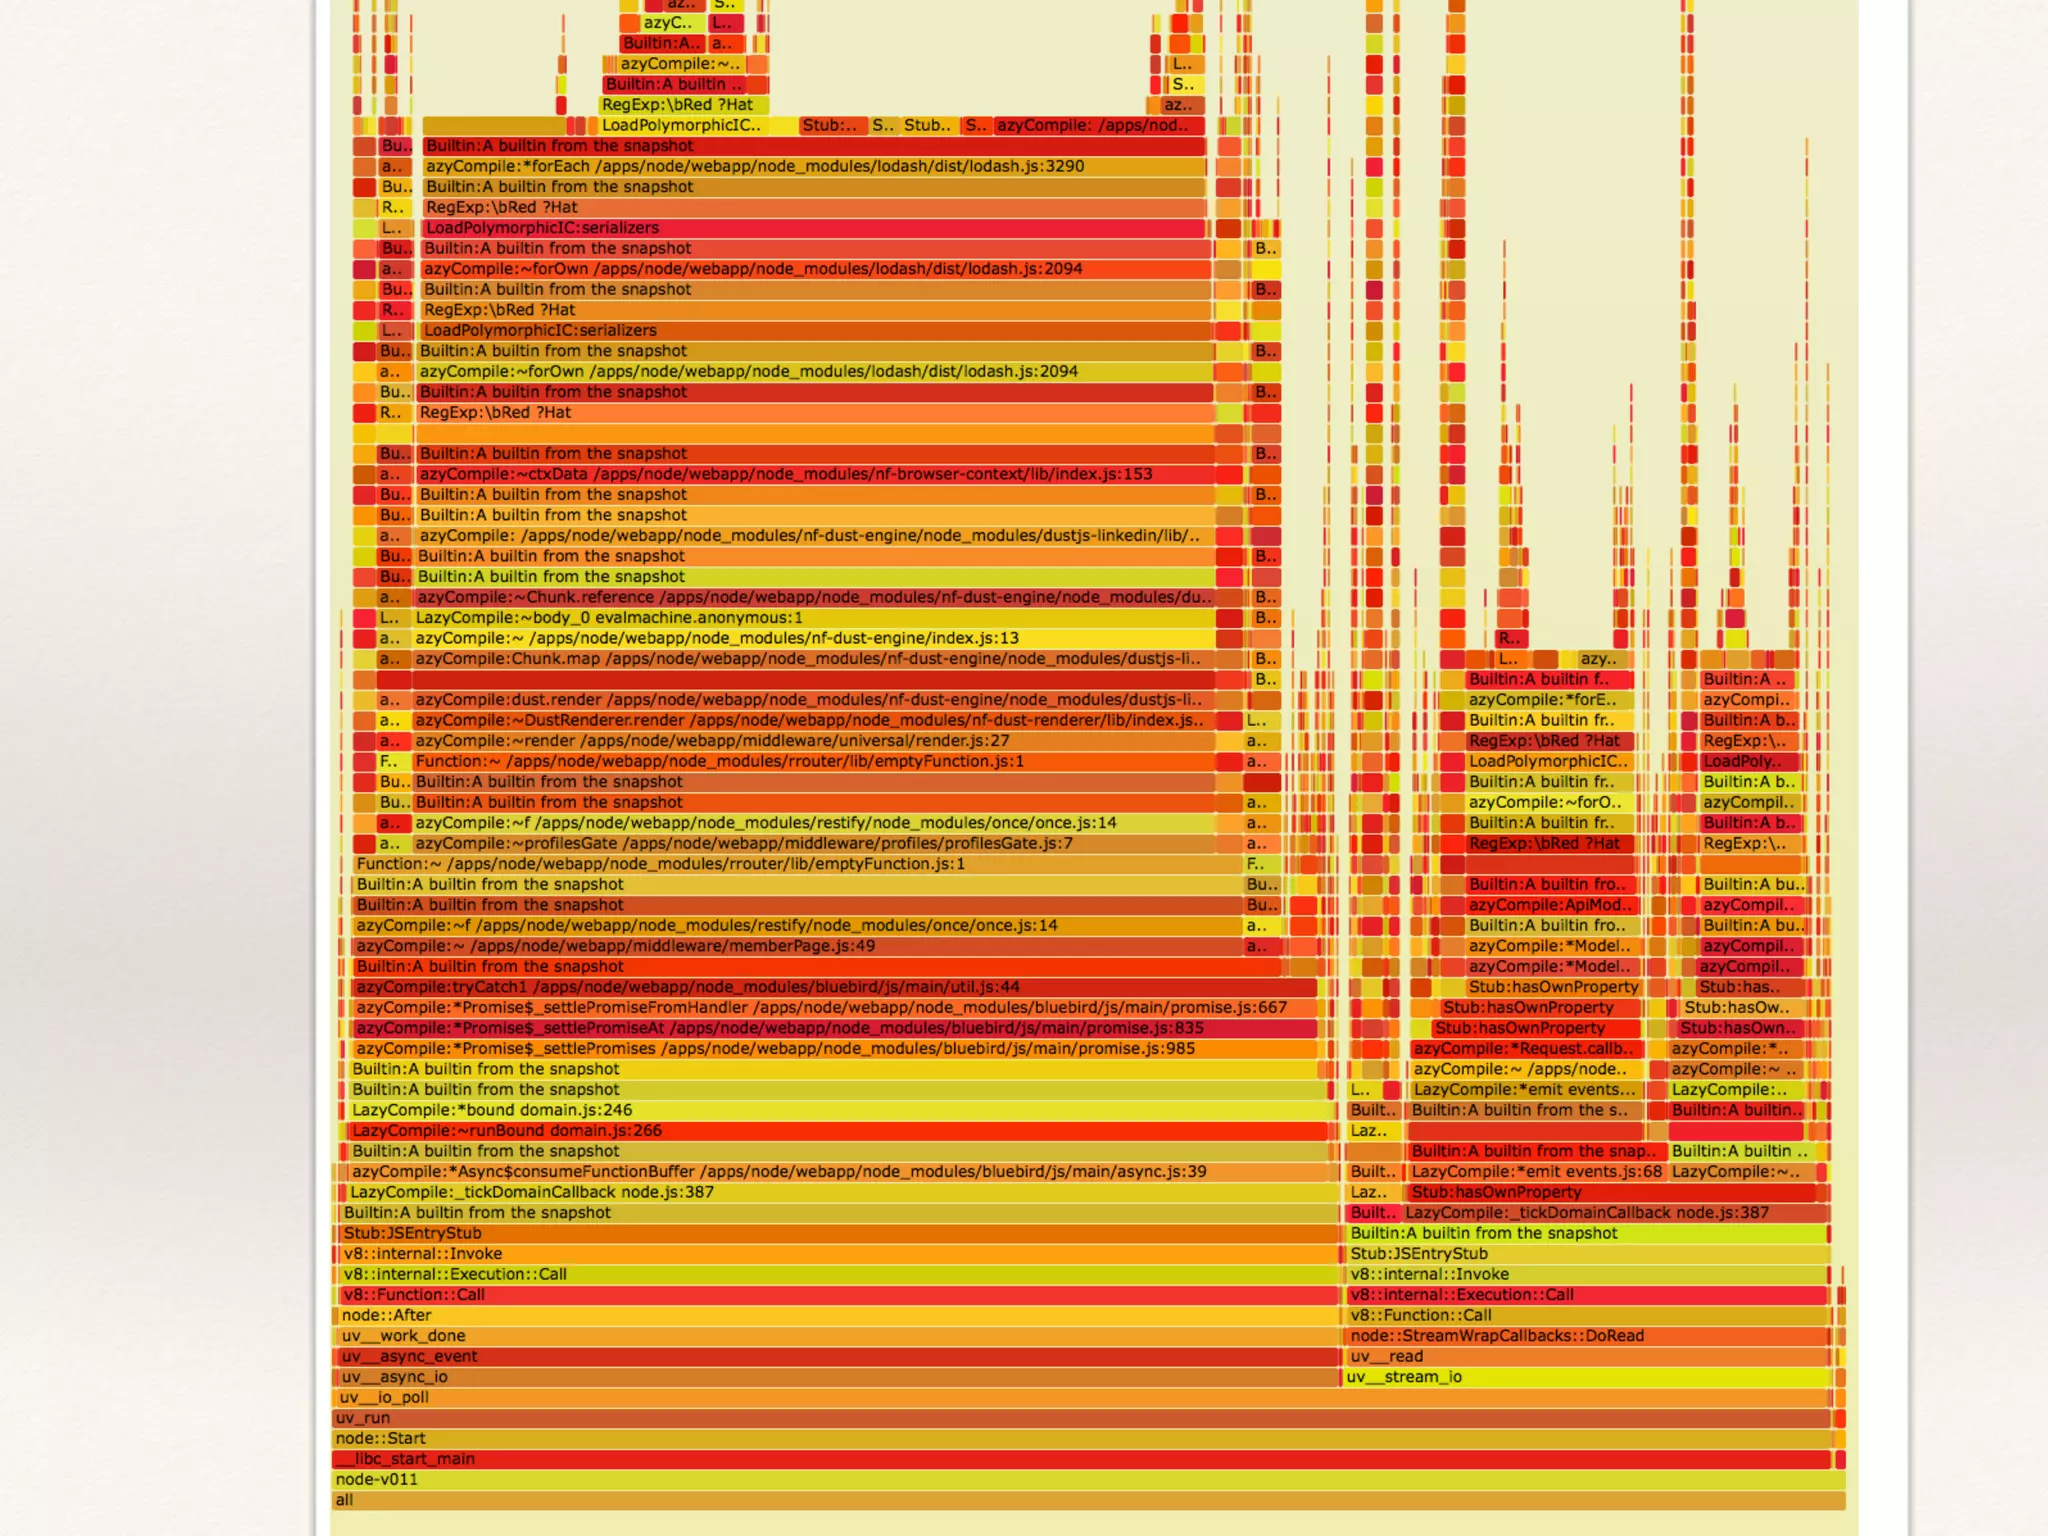
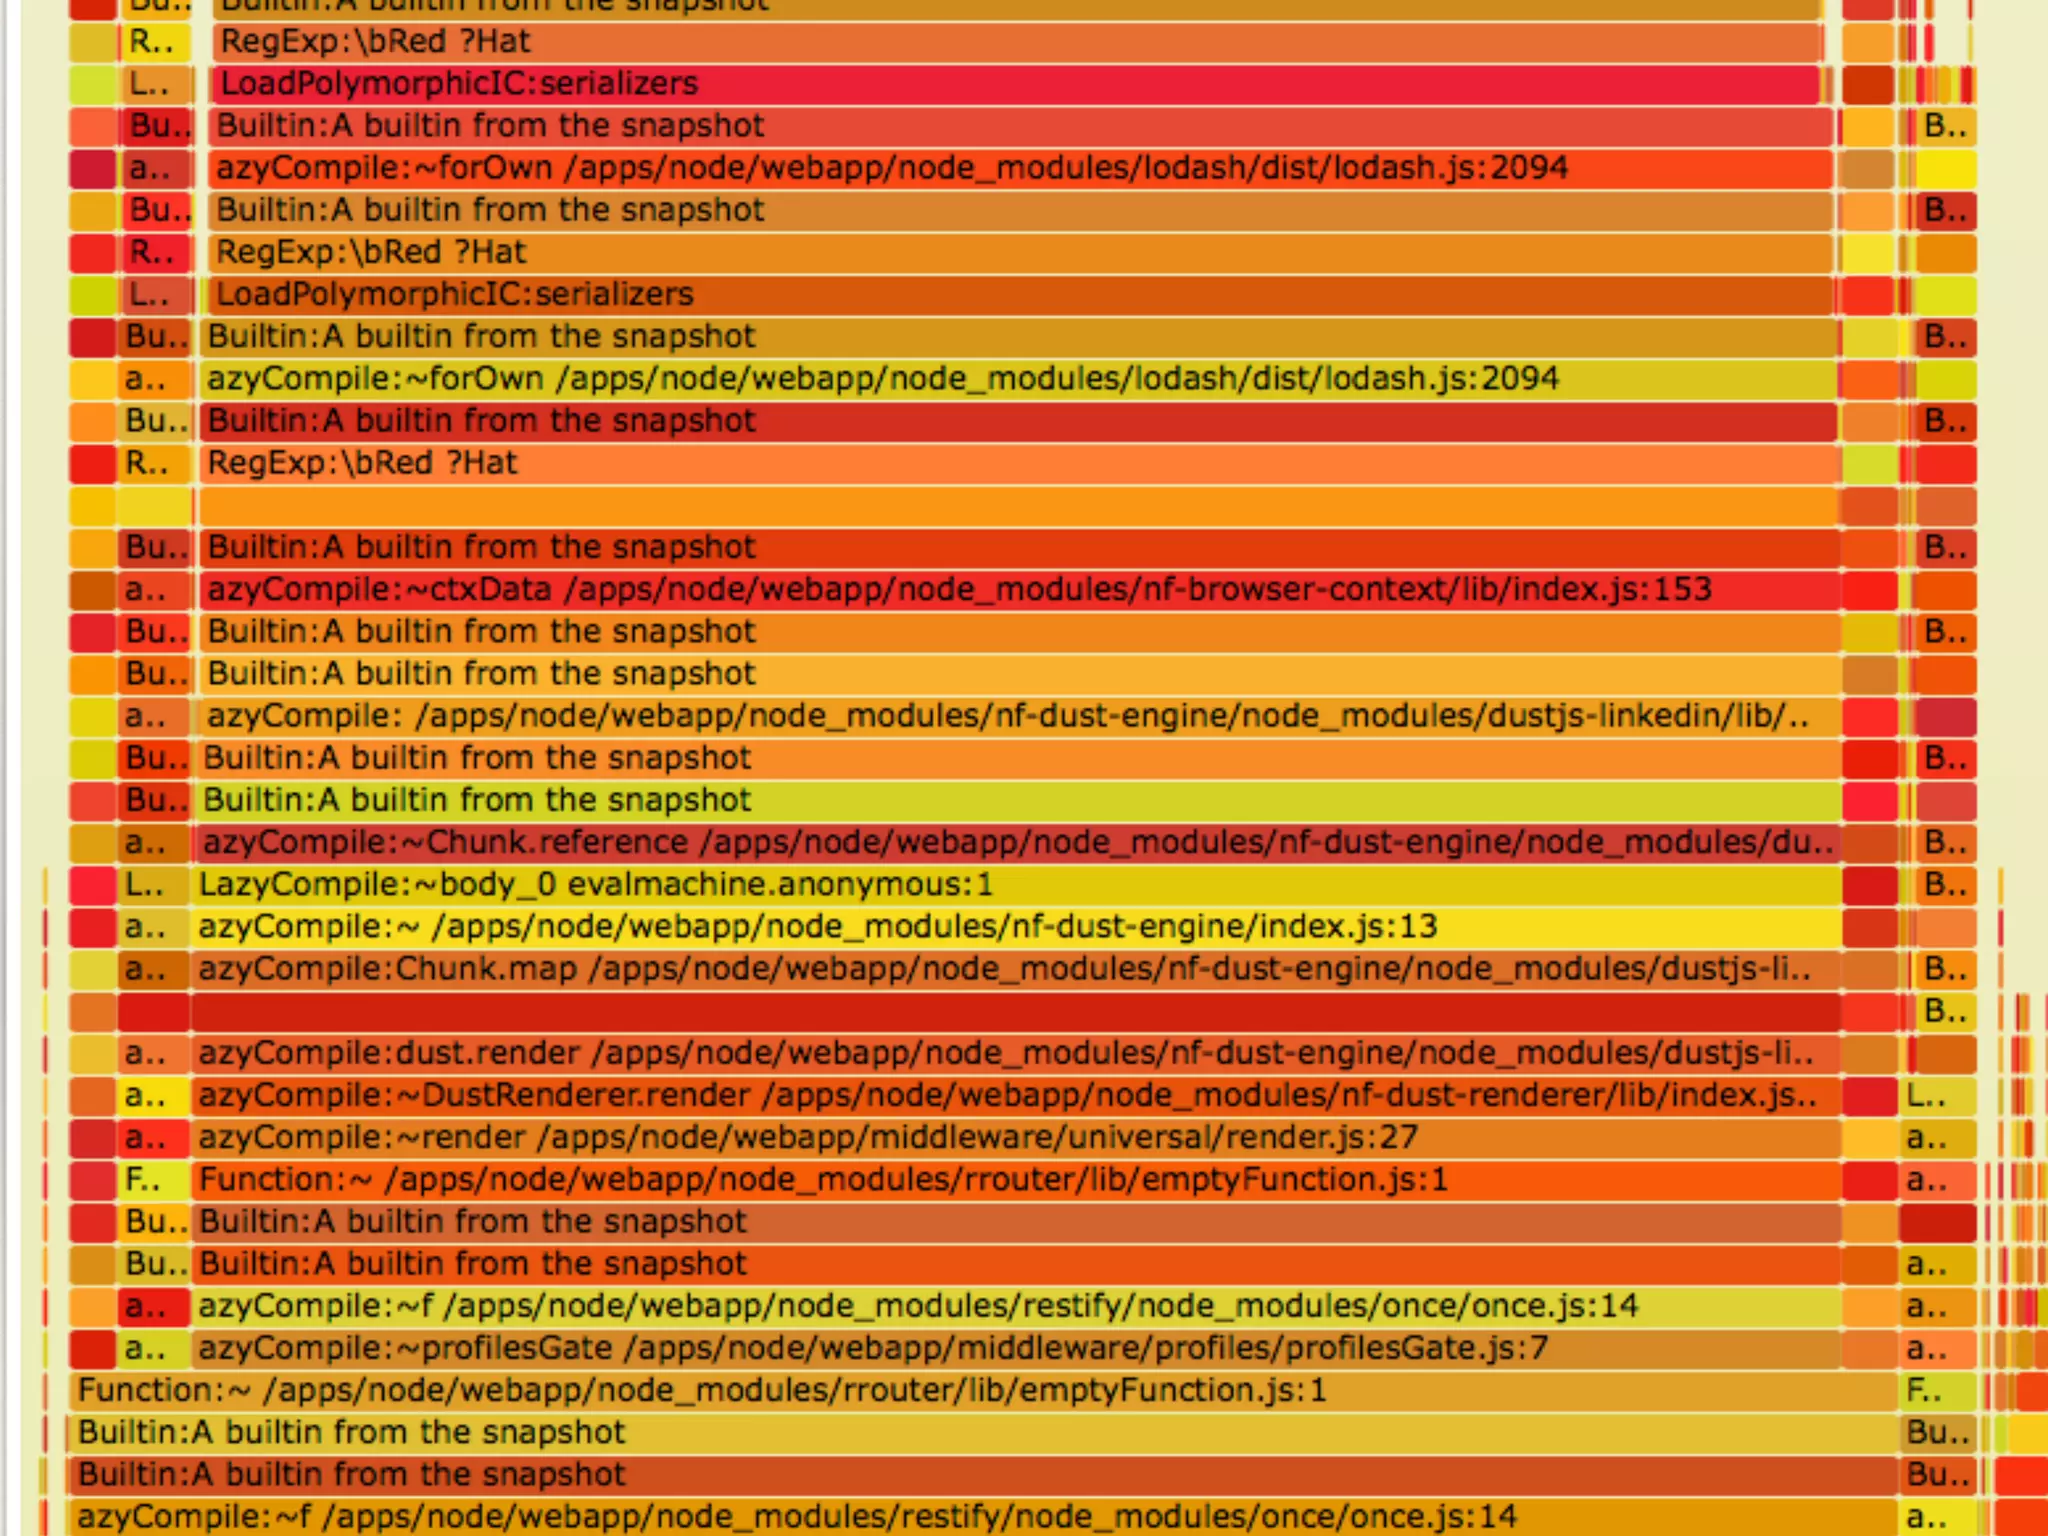
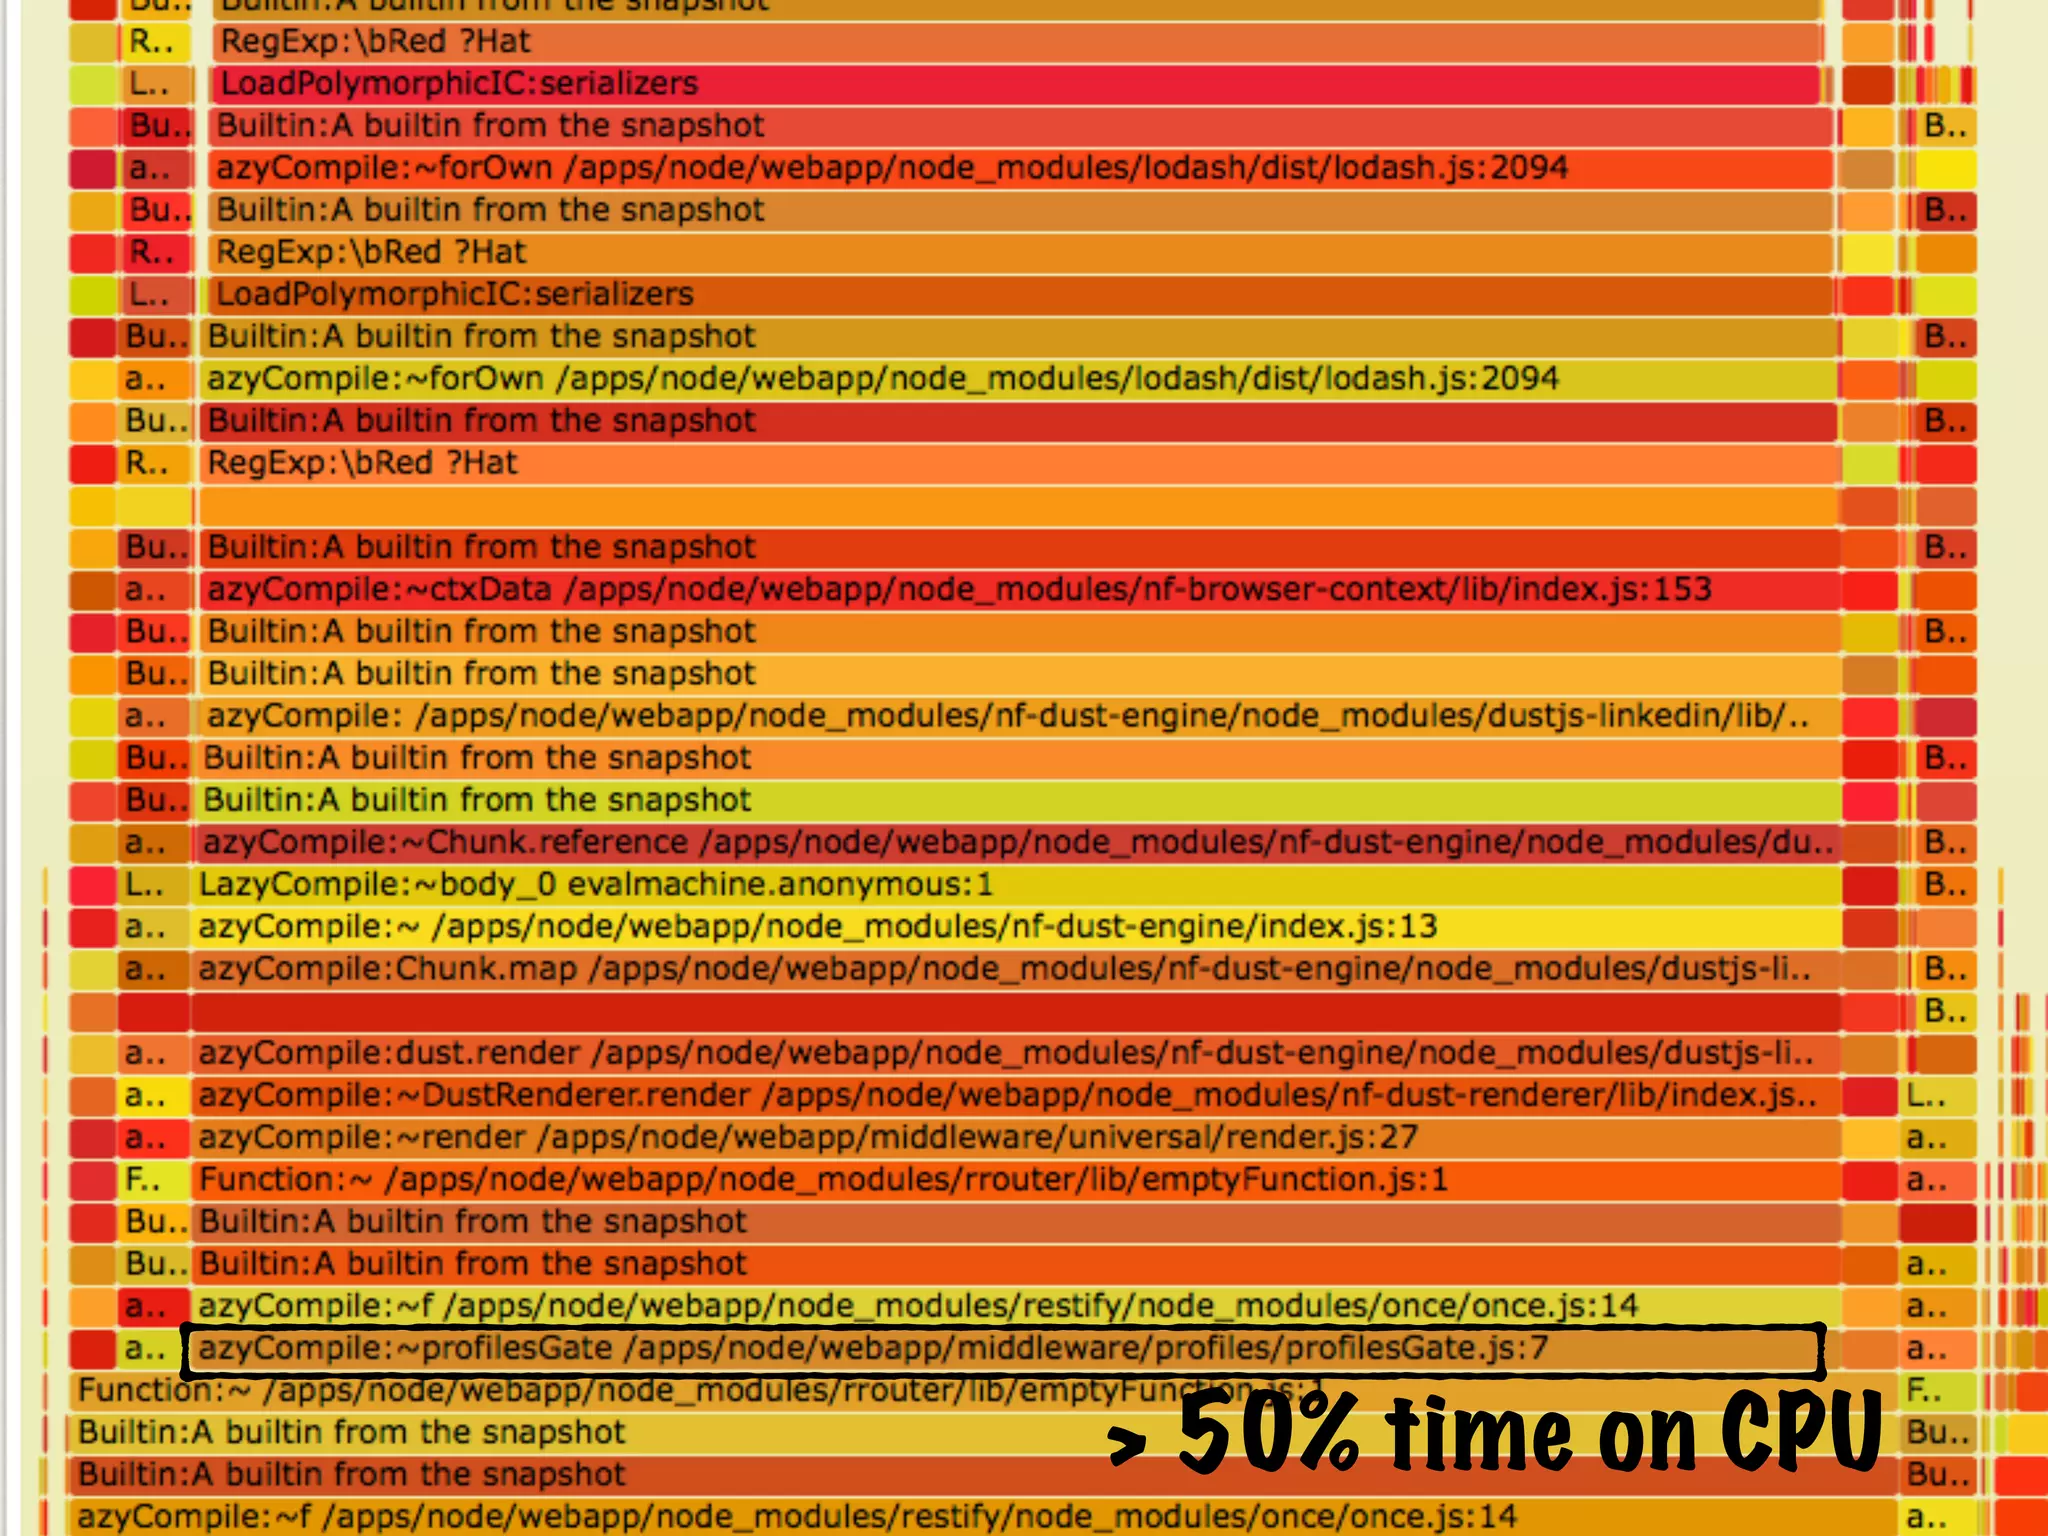
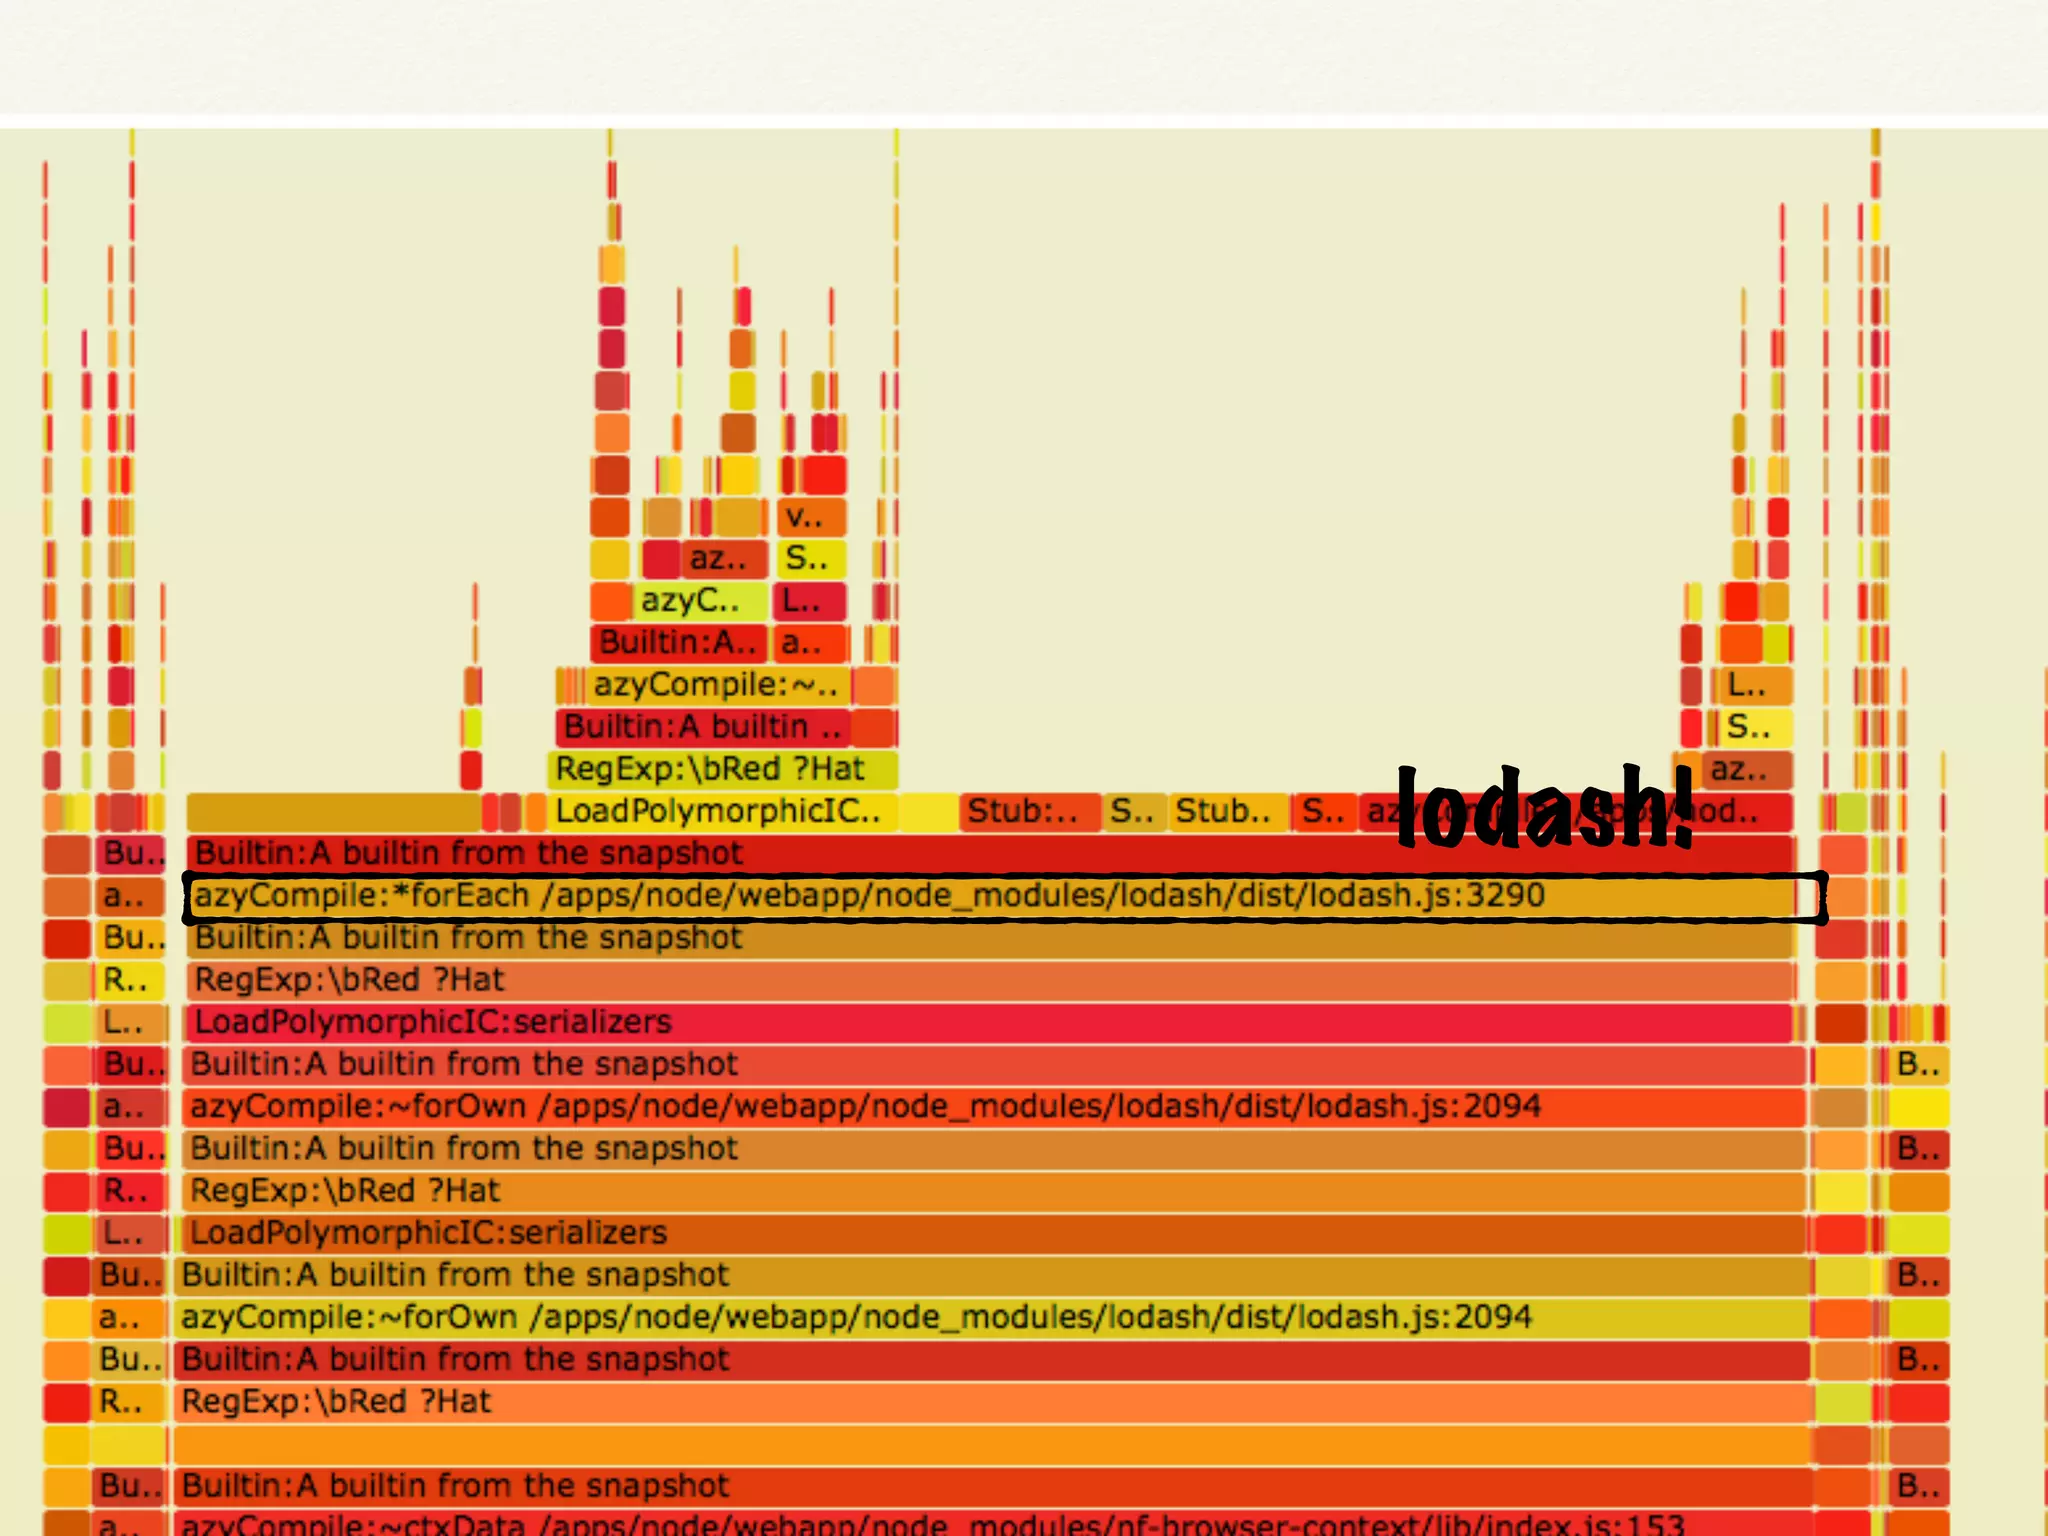
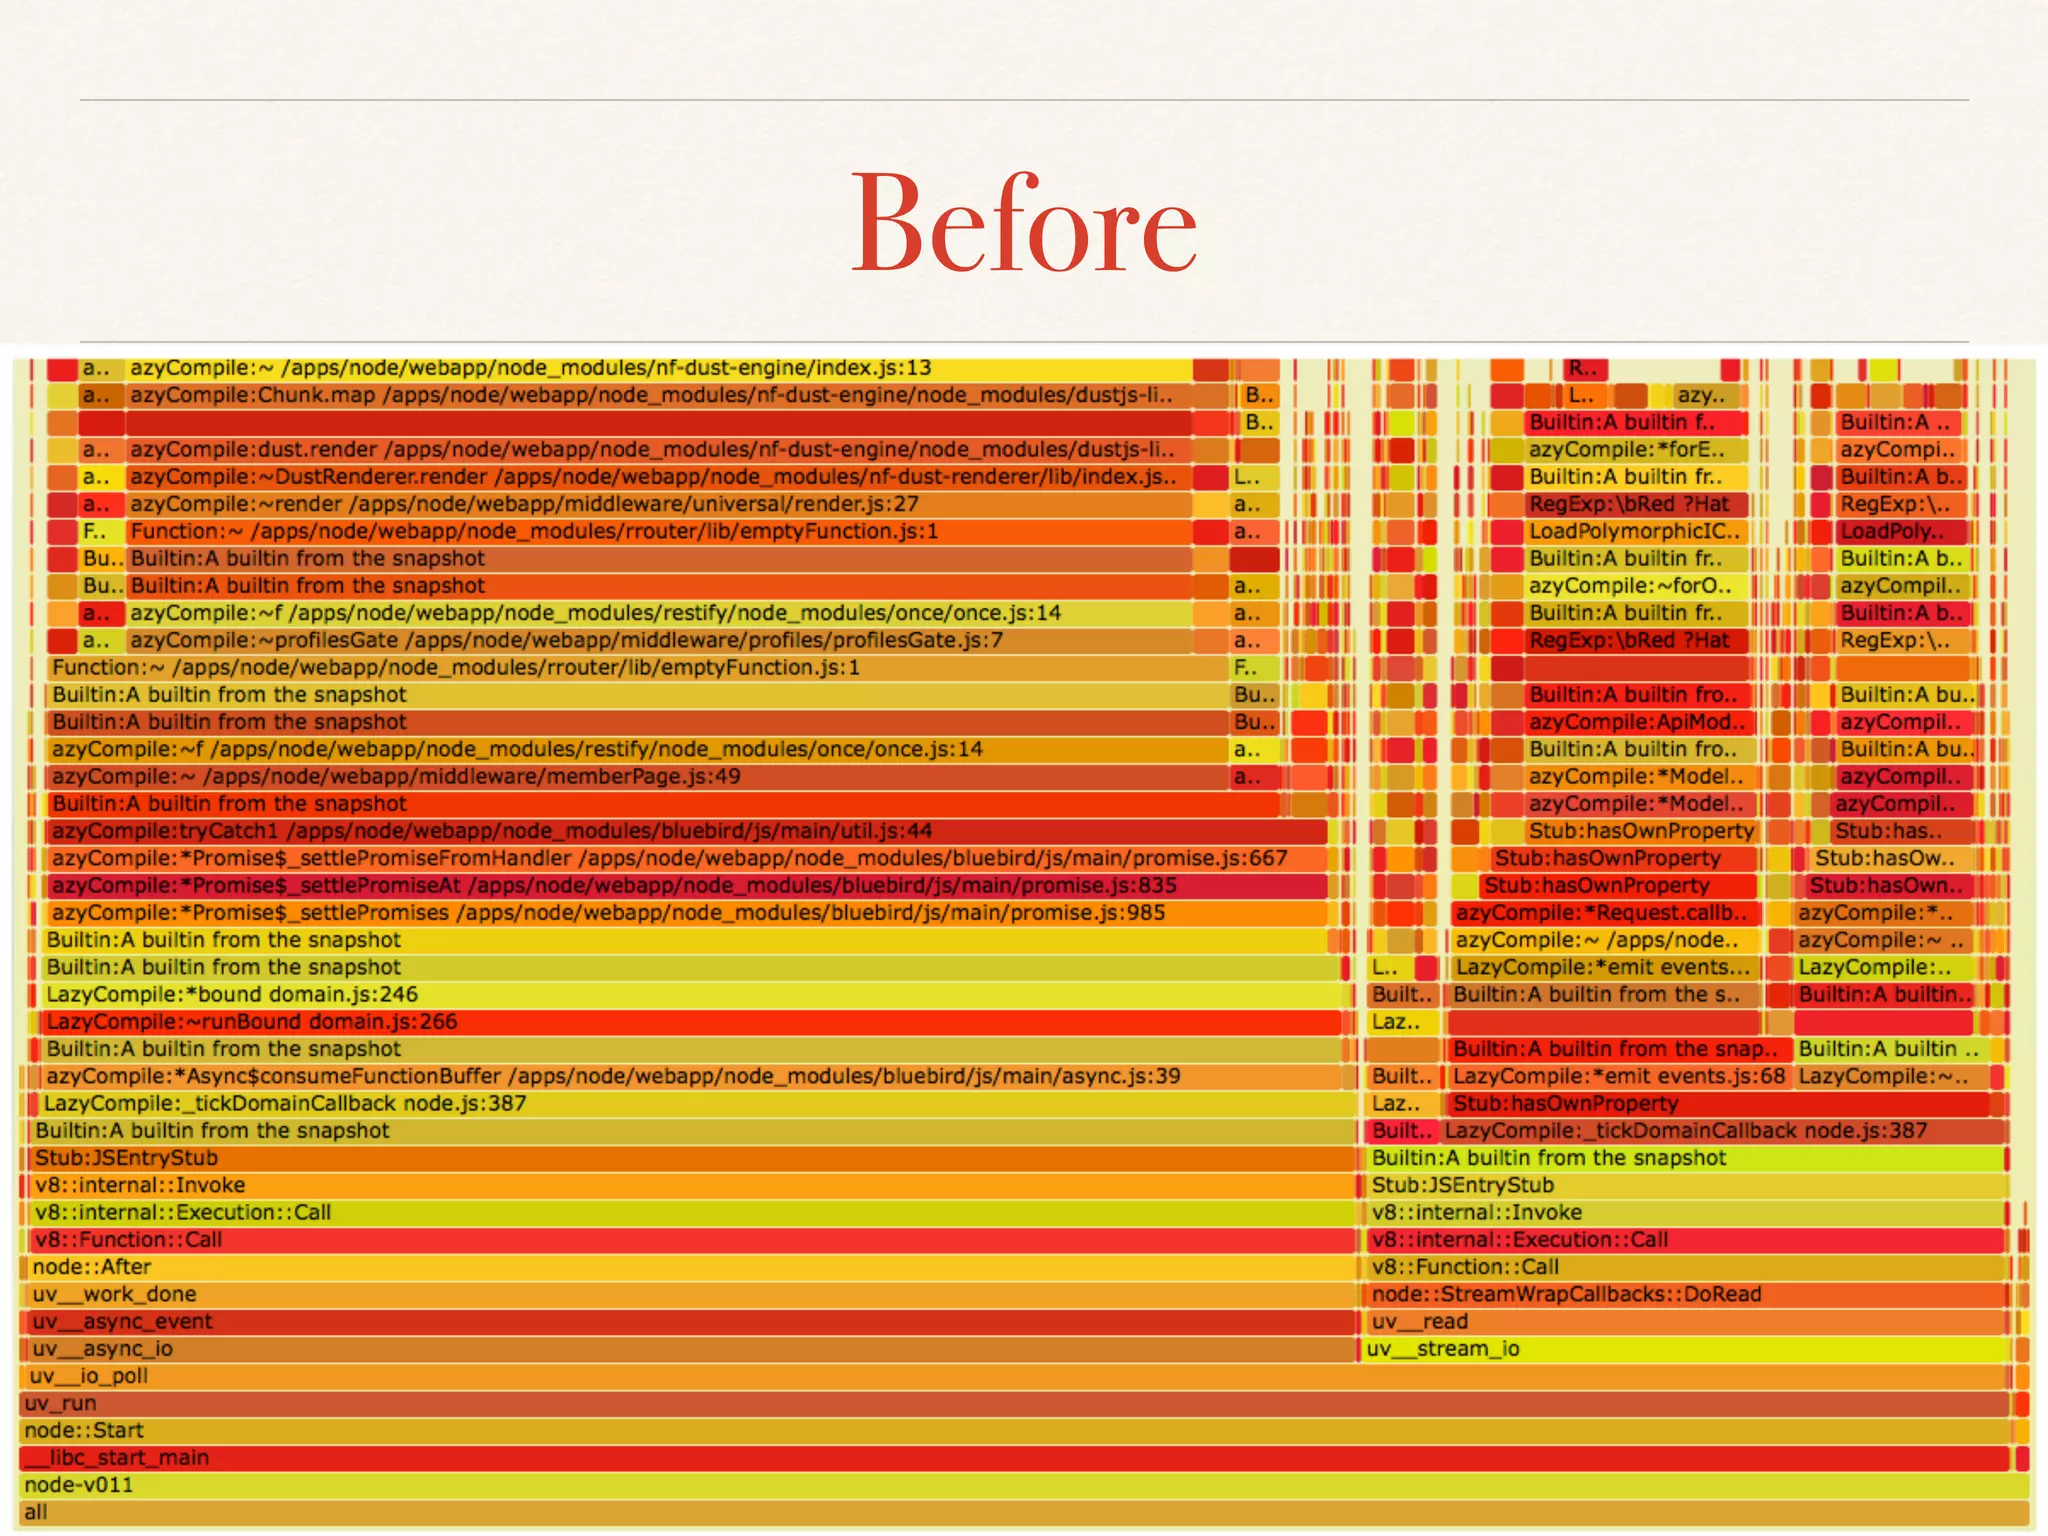
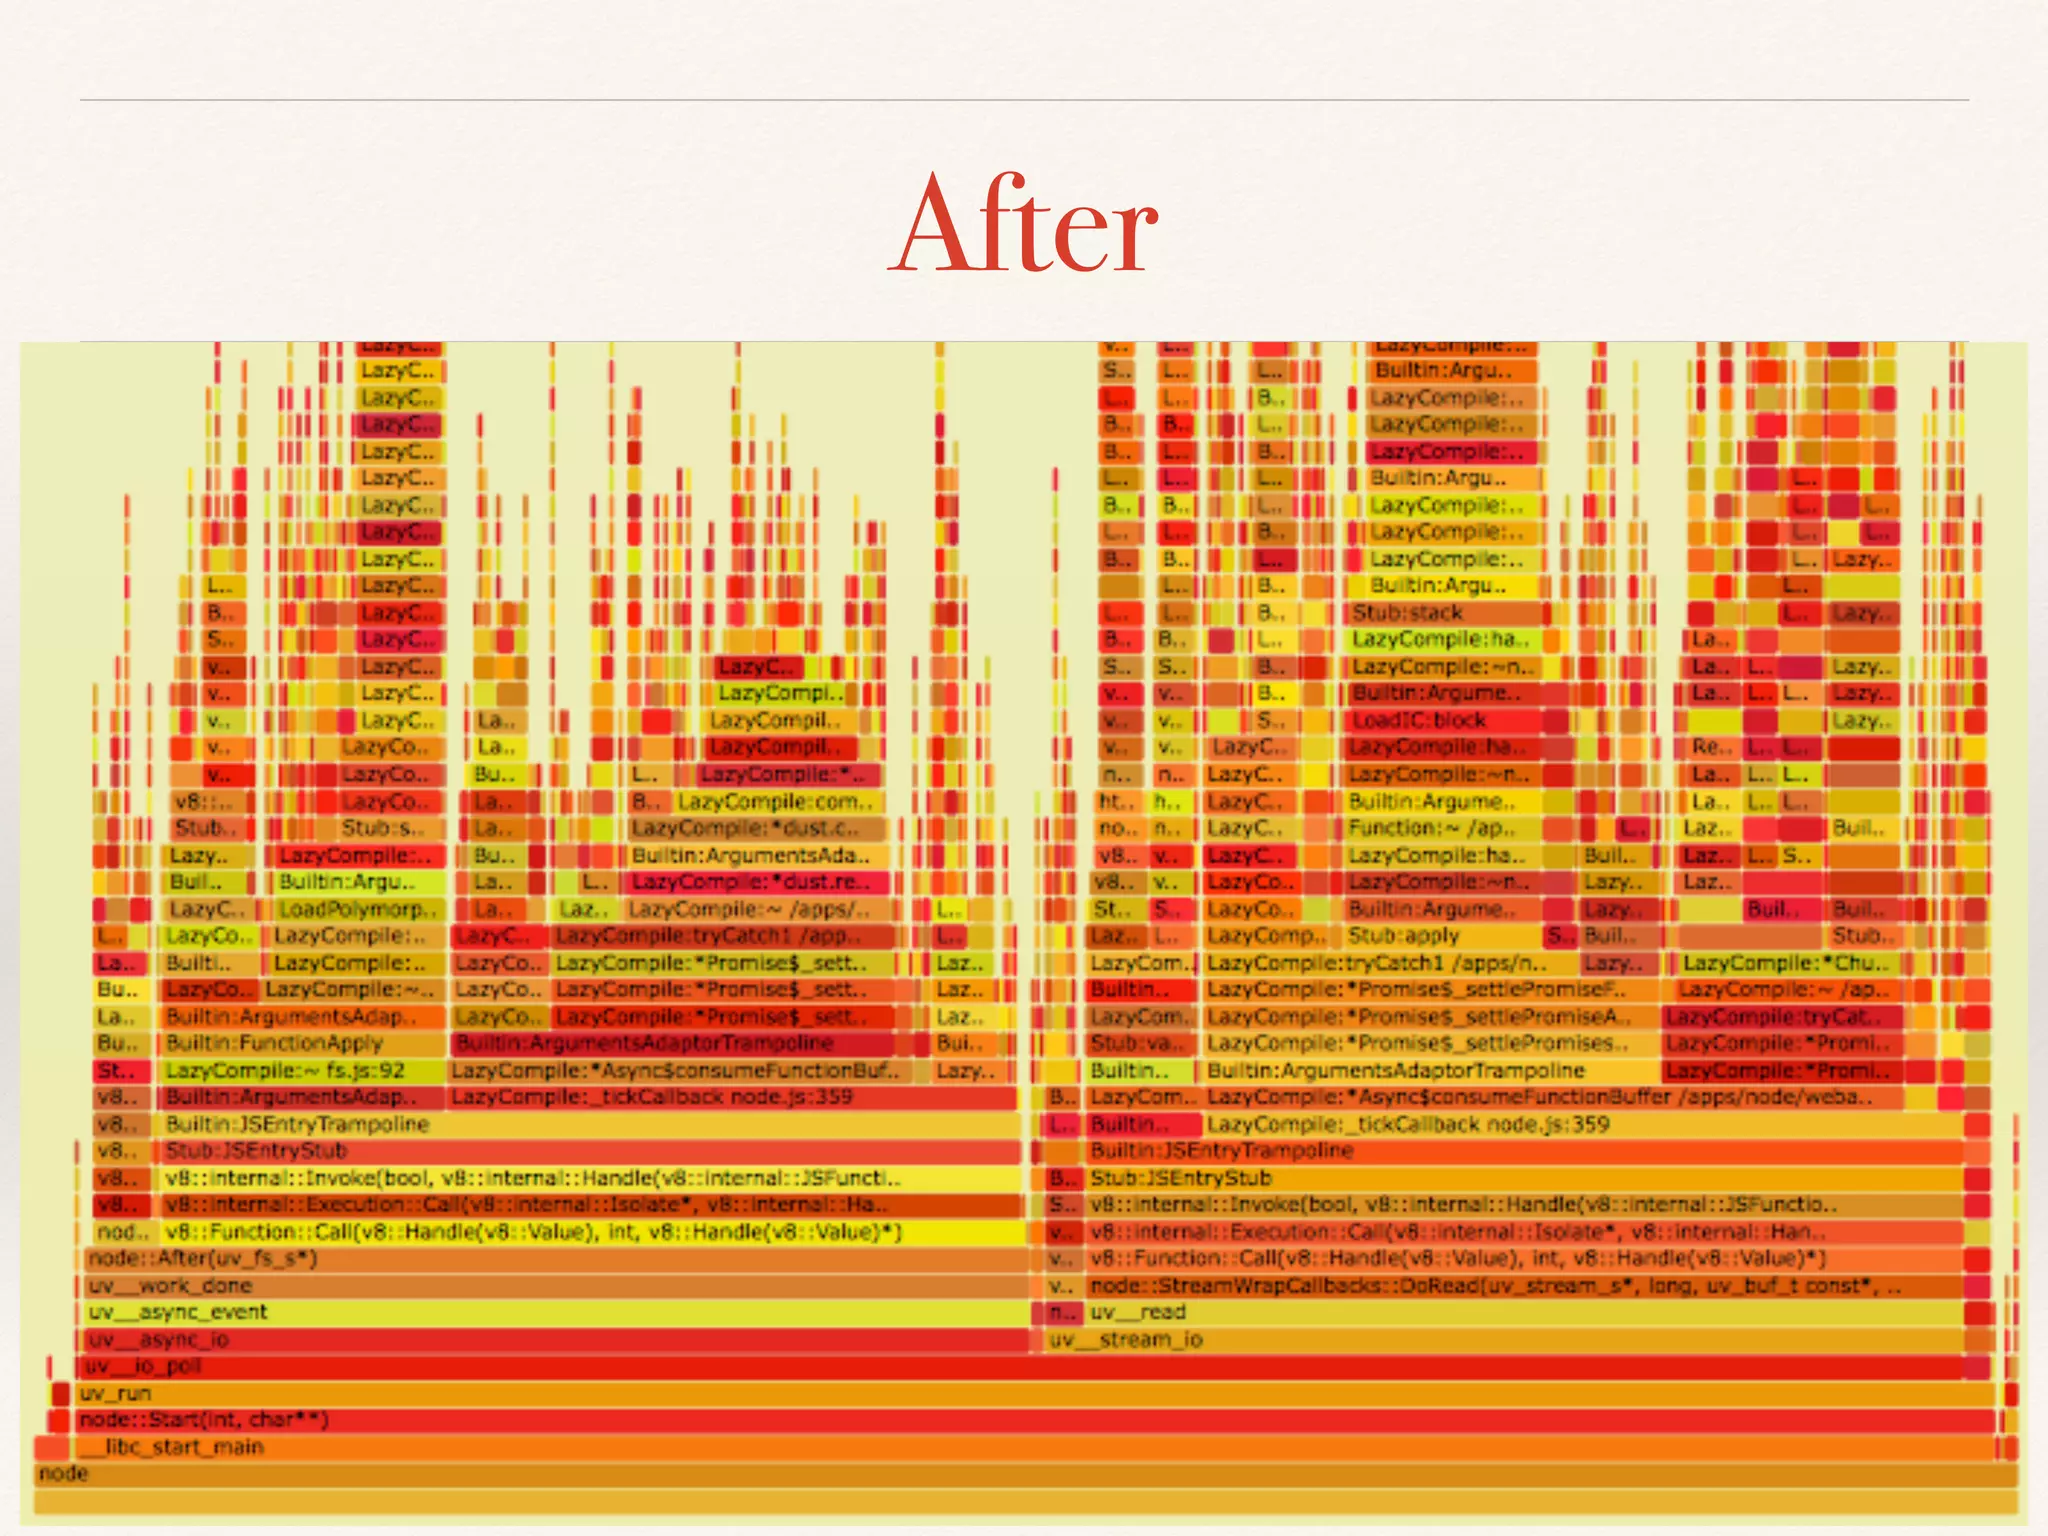
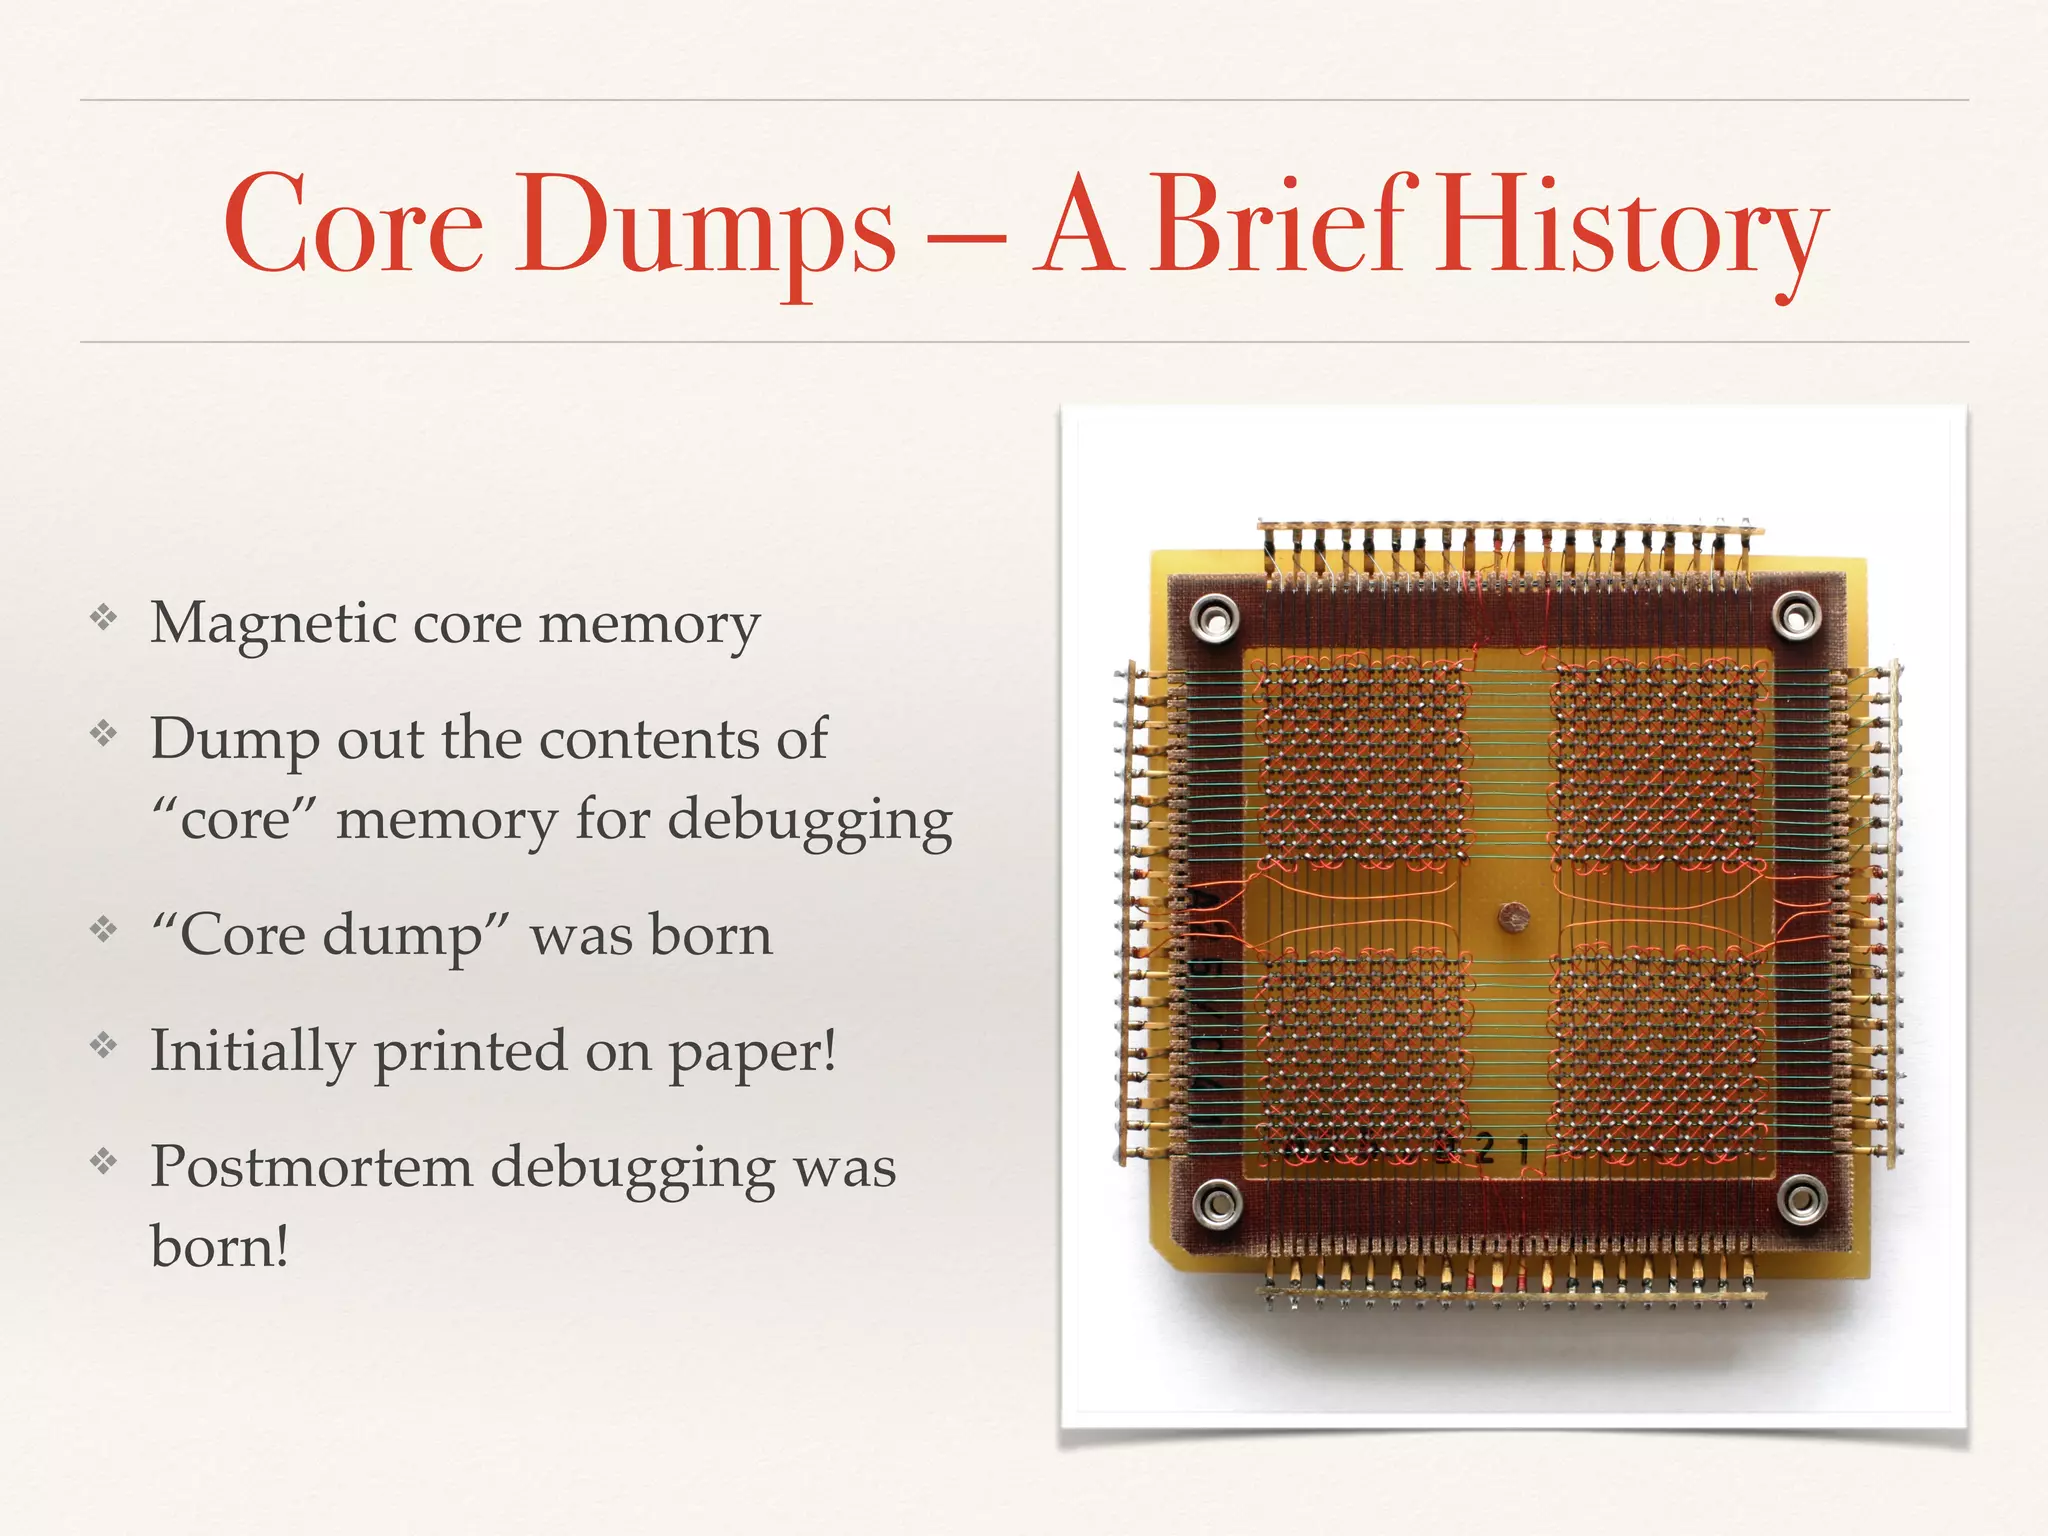
The document discusses debugging strategies for Node.js in a production environment at Netflix, emphasizing the importance of performance analysis tools and systematic troubleshooting methods such as stack trace sampling and core dumps. It covers techniques for identifying runtime issues, including latency and memory leaks, and highlights the use of flame graphs to visualize CPU usage and optimize performance. The content also touches on the historical context of debugging and the critical need for uptime and efficient debugging processes in production situations.