Downloaded 608 times

![Page5 © Hortonworks Inc. 2011 – 2014. All Rights Reserved High level plan comparison: Postgres QUERY PLAN --------------------------------------------------------------------------------- Group (cost=3.83..3.84 rows=2 width=18) Output: a11.pbtname Group Key: a11.pbtname -> Sort (cost=3.83..3.84 rows=2 width=18) Output: a11.pbtname Sort Key: a11.pbtname -> Hash Join (cost=2.62..3.83 rows=2 width=18) Output: a11.pbtname Hash Cond: (a11.quarter_id = a12.quarter_id) -> Seq Scan on public.pmt_inventory a11 (cost=0.00..1.12 rows=12 width=22) Output: a11.quarter_id, a11.pbtname -> Hash (cost=2.60..2.60 rows=2 width=4) Output: a12.quarter_id -> Seq Scan on public.lu_month a12 (cost=0.00..2.60 rows=2 width=4) Output: a12.quarter_id Filter: (a12.month_id = ANY ('{200607,200606}'::integer[])) 16 lines](https://image.slidesharecdn.com/m11thur1210pengchengxiong-160906150344/75/How-to-understand-and-analyze-Apache-Hive-query-execution-plan-for-performance-debugging-5-2048.jpg)
![Page11 © Hortonworks Inc. 2011 – 2014. All Rights Reserved Back to Postgres QUERY PLAN --------------------------------------------------------------------------------- Group (cost=3.83..3.84 rows=2 width=18) Output: a11.pbtname Group Key: a11.pbtname -> Sort (cost=3.83..3.84 rows=2 width=18) Output: a11.pbtname Sort Key: a11.pbtname -> Hash Join (cost=2.62..3.83 rows=2 width=18) Output: a11.pbtname Hash Cond: (a11.quarter_id = a12.quarter_id) -> Seq Scan on public.pmt_inventory a11 (cost=0.00..1.12 rows=12 width=22) Output: a11.quarter_id, a11.pbtname -> Hash (cost=2.60..2.60 rows=2 width=4) Output: a12.quarter_id -> Seq Scan on public.lu_month a12 (cost=0.00..2.60 rows=2 width=4) Output: a12.quarter_id Filter: (a12.month_id = ANY ('{200607,200606}'::integer[])) Data flows bottom to top](https://image.slidesharecdn.com/m11thur1210pengchengxiong-160906150344/75/How-to-understand-and-analyze-Apache-Hive-query-execution-plan-for-performance-debugging-11-2048.jpg)
![Page12 © Hortonworks Inc. 2011 – 2014. All Rights Reserved Back to Postgres QUERY PLAN --------------------------------------------------------------------------------- Group (cost=3.83..3.84 rows=2 width=18) Output: a11.pbtname Group Key: a11.pbtname -> Sort (cost=3.83..3.84 rows=2 width=18) Output: a11.pbtname Sort Key: a11.pbtname -> Hash Join (cost=2.62..3.83 rows=2 width=18) Output: a11.pbtname Hash Cond: (a11.quarter_id = a12.quarter_id) -> Seq Scan on public.pmt_inventory a11 (cost=0.00..1.12 rows=12 width=22) Output: a11.quarter_id, a11.pbtname -> Hash (cost=2.60..2.60 rows=2 width=4) Output: a12.quarter_id -> Seq Scan on public.lu_month a12 (cost=0.00..2.60 rows=2 width=4) Output: a12.quarter_id Filter: (a12.month_id = ANY ('{200607,200606}'::integer[])) Operators have multiple children when it makes sense](https://image.slidesharecdn.com/m11thur1210pengchengxiong-160906150344/75/How-to-understand-and-analyze-Apache-Hive-query-execution-plan-for-performance-debugging-12-2048.jpg)
![Page13 © Hortonworks Inc. 2011 – 2014. All Rights Reserved Back to Postgres QUERY PLAN --------------------------------------------------------------------------------- Group (cost=3.83..3.84 rows=2 width=18) Output: a11.pbtname Group Key: a11.pbtname -> Sort (cost=3.83..3.84 rows=2 width=18) Output: a11.pbtname Sort Key: a11.pbtname -> Hash Join (cost=2.62..3.83 rows=2 width=18) Output: a11.pbtname Hash Cond: (a11.quarter_id = a12.quarter_id) -> Seq Scan on public.pmt_inventory a11 (cost=0.00..1.12 rows=12 width=22) Output: a11.quarter_id, a11.pbtname -> Hash (cost=2.60..2.60 rows=2 width=4) Output: a12.quarter_id -> Seq Scan on public.lu_month a12 (cost=0.00..2.60 rows=2 width=4) Output: a12.quarter_id Filter: (a12.month_id = ANY ('{200607,200606}'::integer[])) Join is done using a scan of pmt_inventory and a hash following a scan of lu_month. All this info is available without referring to a stage plan. IOW you don’t have to jump around in the plan.](https://image.slidesharecdn.com/m11thur1210pengchengxiong-160906150344/75/How-to-understand-and-analyze-Apache-Hive-query-execution-plan-for-performance-debugging-13-2048.jpg)
![Page14 © Hortonworks Inc. 2011 – 2014. All Rights Reserved Back to Postgres QUERY PLAN --------------------------------------------------------------------------------- Group (cost=3.83..3.84 rows=2 width=18) Output: a11.pbtname Group Key: a11.pbtname -> Sort (cost=3.83..3.84 rows=2 width=18) Output: a11.pbtname Sort Key: a11.pbtname -> Hash Join (cost=2.62..3.83 rows=2 width=18) Output: a11.pbtname Hash Cond: (a11.quarter_id = a12.quarter_id) -> Seq Scan on public.pmt_inventory a11 (cost=0.00..1.12 rows=12 width=22) Output: a11.quarter_id, a11.pbtname -> Hash (cost=2.60..2.60 rows=2 width=4) Output: a12.quarter_id -> Seq Scan on public.lu_month a12 (cost=0.00..2.60 rows=2 width=4) Output: a12.quarter_id Filter: (a12.month_id = ANY ('{200607,200606}'::integer[])) Actual schema / table names visible](https://image.slidesharecdn.com/m11thur1210pengchengxiong-160906150344/75/How-to-understand-and-analyze-Apache-Hive-query-execution-plan-for-performance-debugging-14-2048.jpg)
![Page15 © Hortonworks Inc. 2011 – 2014. All Rights Reserved Back to Postgres QUERY PLAN --------------------------------------------------------------------------------- Group (cost=3.83..3.84 rows=2 width=18) Output: a11.pbtname Group Key: a11.pbtname -> Sort (cost=3.83..3.84 rows=2 width=18) Output: a11.pbtname Sort Key: a11.pbtname -> Hash Join (cost=2.62..3.83 rows=2 width=18) Output: a11.pbtname Hash Cond: (a11.quarter_id = a12.quarter_id) -> Seq Scan on public.pmt_inventory a11 (cost=0.00..1.12 rows=12 width=22) Output: a11.quarter_id, a11.pbtname -> Hash (cost=2.60..2.60 rows=2 width=4) Output: a12.quarter_id -> Seq Scan on public.lu_month a12 (cost=0.00..2.60 rows=2 width=4) Output: a12.quarter_id Filter: (a12.month_id = ANY ('{200607,200606}'::integer[])) Cost mentioned once per operator Cost monotonically increases as you go up](https://image.slidesharecdn.com/m11thur1210pengchengxiong-160906150344/75/How-to-understand-and-analyze-Apache-Hive-query-execution-plan-for-performance-debugging-15-2048.jpg)
![Page16 © Hortonworks Inc. 2011 – 2014. All Rights Reserved WHAT is new style Hive explain plan (HIVE-9780) • Set hive.explain.user=true; (by default). Use Tez, LLAP, etc Stage-1 Reducer 3 File Output Operator [FS_14] Group By Operator [GBY_12] (rows=8 width=101) Output:["_col0"],keys:KEY._col0 <-Map 2 [SIMPLE_EDGE] SHUFFLE [RS_11] PartitionCols:_col0 Group By Operator [GBY_10] (rows=8 width=101) Output:["_col0"],keys:_col1 Map Join Operator [MAPJOIN_19] (rows=33 width=101) Conds:RS_6._col0=SEL_5._col1(Inner),HybridGraceHashJoin:true,Output:["_col1"] <-Map 1 [BROADCAST_EDGE] BROADCAST [RS_6] PartitionCols:_col0 Select Operator [SEL_2] (rows=12 width=105) Output:["_col0","_col1"] Filter Operator [FIL_17] (rows=12 width=105) predicate:quarter_id is not null TableScan [TS_0] (rows=12 width=105) m****@pmt_inventory,a11,Tbl:COMPLETE,Col:COMPLETE,Output:["quarter_id","pbtname"] <-Select Operator [SEL_5] (rows=48 width=8) Output:["_col1"] Filter Operator [FIL_18] (rows=48 width=8) predicate:((month_id) IN (200607, 200606) and quarter_id is not null) TableScan [TS_3] (rows=48 width=8) m****@lu_month,a12,Tbl:COMPLETE,Col:COMPLETE,Output:["month_id","quarter_id"] Immediate Notes: 1. Much smaller 2. Can be read in order](https://image.slidesharecdn.com/m11thur1210pengchengxiong-160906150344/75/How-to-understand-and-analyze-Apache-Hive-query-execution-plan-for-performance-debugging-16-2048.jpg)
![Page17 © Hortonworks Inc. 2011 – 2014. All Rights Reserved WHAT is new style Hive explain plan (HIVE-9780) Stage-1 Reducer 3 File Output Operator [FS_14] Group By Operator [GBY_12] (rows=8 width=101) Output:["_col0"],keys:KEY._col0 <-Map 2 [SIMPLE_EDGE] SHUFFLE [RS_11] PartitionCols:_col0 Group By Operator [GBY_10] (rows=8 width=101) Output:["_col0"],keys:_col1 Map Join Operator [MAPJOIN_19] (rows=33 width=101) Conds:RS_6._col0=SEL_5._col1(Inner),HybridGraceHashJoin:true,Output:["_col1"] <-Map 1 [BROADCAST_EDGE] BROADCAST [RS_6] PartitionCols:_col0 Select Operator [SEL_2] (rows=12 width=105) Output:["_col0","_col1"] Filter Operator [FIL_17] (rows=12 width=105) predicate:quarter_id is not null TableScan [TS_0] (rows=12 width=105) m****@pmt_inventory,a11,Tbl:COMPLETE,Col:COMPLETE,Output:["quarter_id","pbtname"] <-Select Operator [SEL_5] (rows=48 width=8) Output:["_col1"] Filter Operator [FIL_18] (rows=48 width=8) predicate:((month_id) IN (200607, 200606) and quarter_id is not null) TableScan [TS_3] (rows=48 width=8) m****@lu_month,a12,Tbl:COMPLETE,Col:COMPLETE,Output:["month_id","quarter_id"] Data flows bottom to top](https://image.slidesharecdn.com/m11thur1210pengchengxiong-160906150344/75/How-to-understand-and-analyze-Apache-Hive-query-execution-plan-for-performance-debugging-17-2048.jpg)
![Page18 © Hortonworks Inc. 2011 – 2014. All Rights Reserved WHAT is new style Hive explain plan (HIVE-9780) Stage-1 Reducer 3 File Output Operator [FS_14] Group By Operator [GBY_12] (rows=8 width=101) Output:["_col0"],keys:KEY._col0 <-Map 2 [SIMPLE_EDGE] SHUFFLE [RS_11] PartitionCols:_col0 Group By Operator [GBY_10] (rows=8 width=101) Output:["_col0"],keys:_col1 Map Join Operator [MAPJOIN_19] (rows=33 width=101) Conds:RS_6._col0=SEL_5._col1(Inner),HybridGraceHashJoin:true,Output:["_col1"] <-Map 1 [BROADCAST_EDGE] BROADCAST [RS_6] PartitionCols:_col0 Select Operator [SEL_2] (rows=12 width=105) Output:["_col0","_col1"] Filter Operator [FIL_17] (rows=12 width=105) predicate:quarter_id is not null TableScan [TS_0] (rows=12 width=105) m****@pmt_inventory,a11,Tbl:COMPLETE,Col:COMPLETE,Output:["quarter_id","pbtname"] <-Select Operator [SEL_5] (rows=48 width=8) Output:["_col1"] Filter Operator [FIL_18] (rows=48 width=8) predicate:((month_id) IN (200607, 200606) and quarter_id is not null) TableScan [TS_3] (rows=48 width=8) m****@lu_month,a12,Tbl:COMPLETE,Col:COMPLETE,Output:["month_id","quarter_id"] Operators have multiple children when it makes sense](https://image.slidesharecdn.com/m11thur1210pengchengxiong-160906150344/75/How-to-understand-and-analyze-Apache-Hive-query-execution-plan-for-performance-debugging-18-2048.jpg)
![Page19 © Hortonworks Inc. 2011 – 2014. All Rights Reserved WHAT is new style Hive explain plan (HIVE-9780) Stage-1 Reducer 3 File Output Operator [FS_14] Group By Operator [GBY_12] (rows=8 width=101) Output:["_col0"],keys:KEY._col0 <-Map 2 [SIMPLE_EDGE] SHUFFLE [RS_11] PartitionCols:_col0 Group By Operator [GBY_10] (rows=8 width=101) Output:["_col0"],keys:_col1 Map Join Operator [MAPJOIN_19] (rows=33 width=101) Conds:RS_6._col0=SEL_5._col1(Inner),HybridGraceHashJoin:true,Output:["_col1"] <-Map 1 [BROADCAST_EDGE] BROADCAST [RS_6] PartitionCols:_col0 Select Operator [SEL_2] (rows=12 width=105) Output:["_col0","_col1"] Filter Operator [FIL_17] (rows=12 width=105) predicate:quarter_id is not null TableScan [TS_0] (rows=12 width=105) m****@pmt_inventory,a11,Tbl:COMPLETE,Col:COMPLETE,Output:["quarter_id","pbtname"] <-Select Operator [SEL_5] (rows=48 width=8) Output:["_col1"] Filter Operator [FIL_18] (rows=48 width=8) predicate:((month_id) IN (200607, 200606) and quarter_id is not null) TableScan [TS_3] (rows=48 width=8) m****@lu_month,a12,Tbl:COMPLETE,Col:COMPLETE,Output:["month_id","quarter_id"] Join’s information is clear pmt_inventory is broadcasted to lu_month and a MapJoin is done](https://image.slidesharecdn.com/m11thur1210pengchengxiong-160906150344/75/How-to-understand-and-analyze-Apache-Hive-query-execution-plan-for-performance-debugging-19-2048.jpg)
![Page20 © Hortonworks Inc. 2011 – 2014. All Rights Reserved WHAT is new style Hive explain plan (HIVE-9780) Stage-1 Reducer 3 File Output Operator [FS_14] Group By Operator [GBY_12] (rows=8 width=101) Output:["_col0"],keys:KEY._col0 <-Map 2 [SIMPLE_EDGE] SHUFFLE [RS_11] PartitionCols:_col0 Group By Operator [GBY_10] (rows=8 width=101) Output:["_col0"],keys:_col1 Map Join Operator [MAPJOIN_19] (rows=33 width=101) Conds:RS_6._col0=SEL_5._col1(Inner),HybridGraceHashJoin:true,Output:["_col1"] <-Map 1 [BROADCAST_EDGE] BROADCAST [RS_6] PartitionCols:_col0 Select Operator [SEL_2] (rows=12 width=105) Output:["_col0","_col1"] Filter Operator [FIL_17] (rows=12 width=105) predicate:quarter_id is not null TableScan [TS_0] (rows=12 width=105) m****@pmt_inventory,a11,Tbl:COMPLETE,Col:COMPLETE,Output:["quarter_id","pbtname"] <-Select Operator [SEL_5] (rows=48 width=8) Output:["_col1"] Filter Operator [FIL_18] (rows=48 width=8) predicate:((month_id) IN (200607, 200606) and quarter_id is not null) TableScan [TS_3] (rows=48 width=8) m****@lu_month,a12,Tbl:COMPLETE,Col:COMPLETE,Output:["month_id","quarter_id"] Cost mentioned once per operator](https://image.slidesharecdn.com/m11thur1210pengchengxiong-160906150344/75/How-to-understand-and-analyze-Apache-Hive-query-execution-plan-for-performance-debugging-20-2048.jpg)
![Page22 © Hortonworks Inc. 2011 – 2014. All Rights Reserved <-Reducer 3 [SIMPLE_EDGE] SHUFFLE [RS_15] PartitionCols:_col0, _col1, _col2 Group By Operator [GBY_14] (rows=1 width=116) Output:["_col0","_col1","_col2","_col3"],aggregations:["sum(_col45)"],keys:_col6, _col65, _col64 Select Operator [SEL_13] (rows=76515 width=128) Output:["_col6","_col65","_col64","_col45"] Filter Operator [FIL_23] (rows=76515 width=128) predicate:((_col0 = _col53) and (_col32 = _col57)) Merge Join Operator [MERGEJOIN_28] (rows=306061 width=128) Conds:RS_8._col32=RS_34.i_item_sk(Inner),Output:["_col0","_col6","_col32","_col45","_col53","_col57","_col64","_col65"] <-Map 7 [SIMPLE_EDGE] vectorized SHUFFLE [RS_34] PartitionCols:i_item_sk Filter Operator [FIL_33] (rows=434 width=111) predicate:(i_item_sk is not null and (i_manufact_id = 436)) TableScan [TS_2] (rows=300000 width=111) tpcds_bin_partitioned_orc_1000@item,item,Tbl:COMPLETE,Col:COMPLETE,Output:["i_item_sk","i_brand_id","i_brand","i_manufact_id"] <-Reducer 2 [SIMPLE_EDGE] SHUFFLE [RS_8] PartitionCols:_col32 Merge Join Operator [MERGEJOIN_27] (rows=211562452 width=20) Conds:RS_30.d_date_sk=RS_32.ss_sold_date_sk(Inner),Output:["_col0","_col6","_col32","_col45","_col53"] <-Map 1 [SIMPLE_EDGE] vectorized SHUFFLE [RS_30] PartitionCols:d_date_sk Filter Operator [FIL_29] (rows=5619 width=12) predicate:(d_date_sk is not null and (d_moy = 12)) TableScan [TS_0] (rows=73049 width=12) tpcds_bin_partitioned_orc_1000@date_dim,dt,Tbl:COMPLETE,Col:COMPLETE,Output:["d_date_sk","d_year","d_moy"] <-Map 6 [SIMPLE_EDGE] vectorized SHUFFLE [RS_32] PartitionCols:ss_sold_date_sk Filter Operator [FIL_31] (rows=2750387156 width=11) predicate:ss_item_sk is not null TableScan [TS_1] (rows=2750387156 width=11) tpcds_bin_partitioned_orc_1000@store_sales,store_sales,Tbl:COMPLETE,Col:COMPLETE,Output:["ss_item_sk","ss_ext_sales_price"] Original plan runs 163.33s. Sounds like column pruning and predicate push down are working fine. However, the join sequence store_sales✖date_dim✖item is not good enough. A better one is store_sales✖item✖date_dim Table Cardinality Cardinality after filter Selectivity date_dim 73K 5619 7.6% item 300K 434 0.14%](https://image.slidesharecdn.com/m11thur1210pengchengxiong-160906150344/75/How-to-understand-and-analyze-Apache-Hive-query-execution-plan-for-performance-debugging-22-2048.jpg)
![Page23 © Hortonworks Inc. 2011 – 2014. All Rights Reserved <-Reducer 3 [SIMPLE_EDGE] SHUFFLE [RS_17] PartitionCols:_col0, _col1, _col2 Group By Operator [GBY_16] (rows=9 width=116) Output:["_col0","_col1","_col2","_col3"],aggregations:["sum(_col1)"],keys:_col8, _col4, _col5 Select Operator [SEL_15] (rows=306061 width=112) Output:["_col8","_col4","_col5","_col1"] Merge Join Operator [MERGEJOIN_29] (rows=306061 width=112) Conds:RS_12._col2=RS_38._col0(Inner),Output:["_col1","_col4","_col5","_col8"] <-Map 7 [SIMPLE_EDGE] vectorized SHUFFLE [RS_38] PartitionCols:_col0 Select Operator [SEL_37] (rows=5619 width=12) Output:["_col0","_col1"] Filter Operator [FIL_36] (rows=5619 width=12) predicate:((d_moy = 12) and d_date_sk is not null) TableScan [TS_6] (rows=73049 width=12) tpcds_bin_partitioned_orc_1000@date_dim,dt,Tbl:COMPLETE,Col:COMPLETE,Output:["d_date_sk","d_year","d_moy"] <-Reducer 2 [SIMPLE_EDGE] SHUFFLE [RS_12] PartitionCols:_col2 Merge Join Operator [MERGEJOIN_28] (rows=3978894 width=112) Conds:RS_32._col0=RS_35._col0(Inner),Output:["_col1","_col2","_col4","_col5"] <-Map 1 [SIMPLE_EDGE] vectorized SHUFFLE [RS_32] PartitionCols:_col0 Select Operator [SEL_31] (rows=2750387156 width=11) Output:["_col0","_col1","_col2"] Filter Operator [FIL_30] (rows=2750387156 width=11) predicate:ss_item_sk is not null TableScan [TS_0] (rows=2750387156 width=11) tpcds_bin_partitioned_orc_1000@store_sales,store_sales,Tbl:COMPLETE,Col:COMPLETE,Output:["ss_item_sk","ss_ext_sales_price"] <-Map 6 [SIMPLE_EDGE] vectorized SHUFFLE [RS_35] PartitionCols:_col0 Select Operator [SEL_34] (rows=434 width=111) Output:["_col0","_col1","_col2"] Filter Operator [FIL_33] (rows=434 width=111) predicate:((i_manufact_id = 436) and i_item_sk is not null) TableScan [TS_3] (rows=300000 width=111) tpcds_bin_partitioned_orc_1000@item,item,Tbl:COMPLETE,Col:COMPLETE,Output:["i_item_sk","i_brand_id","i_brand","i_manufact_id"] CBO on, new plan runs 143.97s with new join sequence store_sales✖item✖date_dim. The input data size of one branch of join is pretty small, should use map join, rather than merge join.](https://image.slidesharecdn.com/m11thur1210pengchengxiong-160906150344/75/How-to-understand-and-analyze-Apache-Hive-query-execution-plan-for-performance-debugging-23-2048.jpg)
![Page24 © Hortonworks Inc. 2011 – 2014. All Rights Reserved SHUFFLE [RS_44] PartitionCols:_col0, _col1, _col2 Group By Operator [GBY_43] (rows=9 width=116) Output:["_col0","_col1","_col2","_col3"],aggregations:["sum(_col1)"],keys:_col8, _col4, _col5 Select Operator [SEL_42] (rows=306061 width=112) Output:["_col8","_col4","_col5","_col1"] Map Join Operator [MAPJOIN_41] (rows=306061 width=112) Conds:MAPJOIN_40._col2=RS_37._col0(Inner),HybridGraceHashJoin:true,Output:["_col1","_col4","_col5","_col8"] <-Map 5 [BROADCAST_EDGE] vectorized BROADCAST [RS_37] PartitionCols:_col0 Select Operator [SEL_36] (rows=5619 width=12) Output:["_col0","_col1"] Filter Operator [FIL_35] (rows=5619 width=12) predicate:((d_moy = 12) and d_date_sk is not null) TableScan [TS_6] (rows=73049 width=12) tpcds_bin_partitioned_orc_1000@date_dim,dt,Tbl:COMPLETE,Col:COMPLETE,Output:["d_date_sk","d_year","d_moy"] <-Map Join Operator [MAPJOIN_40] (rows=3978894 width=112) Conds:SEL_39._col0=RS_34._col0(Inner),HybridGraceHashJoin:true,Output:["_col1","_col2","_col4","_col5"] <-Map 4 [BROADCAST_EDGE] vectorized BROADCAST [RS_34] PartitionCols:_col0 Select Operator [SEL_33] (rows=434 width=111) Output:["_col0","_col1","_col2"] Filter Operator [FIL_32] (rows=434 width=111) predicate:((i_manufact_id = 436) and i_item_sk is not null) TableScan [TS_3] (rows=300000 width=111) tpcds_bin_partitioned_orc_1000@item,item,Tbl:COMPLETE,Col:COMPLETE,Output:["i_item_sk","i_brand_id","i_brand","i_manufact_id"] <-Select Operator [SEL_39] (rows=2750387156 width=11) Output:["_col0","_col1","_col2"] Filter Operator [FIL_38] (rows=2750387156 width=11) predicate:ss_item_sk is not null TableScan [TS_0] (rows=2750387156 width=11) tpcds_bin_partitioned_orc_1000@store_sales,store_sales,Tbl:COMPLETE,Col:COMPLETE,Output:["ss_item_sk","ss_ext_sales_price"] Increase hive.auto.convert.join.noconditionaltask.size= 1,359,688,499, we can see it is now using map join operators. New plan runs 45.84s. store_sales is a partitioned table on the join key ss_sold_date_sk with date_dim table.](https://image.slidesharecdn.com/m11thur1210pengchengxiong-160906150344/75/How-to-understand-and-analyze-Apache-Hive-query-execution-plan-for-performance-debugging-24-2048.jpg)
![Page25 © Hortonworks Inc. 2011 – 2014. All Rights Reserved SHUFFLE [RS_55] PartitionCols:_col0, _col1, _col2 Group By Operator [GBY_54] (rows=9 width=116) Output:["_col0","_col1","_col2","_col3"],aggregations:["sum(_col1)"],keys:_col8, _col4, _col5 Select Operator [SEL_53] (rows=306061 width=112) Output:["_col8","_col4","_col5","_col1"] Map Join Operator [MAPJOIN_52] (rows=306061 width=112) Conds:MAPJOIN_51._col2=RS_45._col0(Inner),HybridGraceHashJoin:true,Output:["_col1","_col4","_col5","_col8"] <-Map 5 [BROADCAST_EDGE] vectorized BROADCAST [RS_45] PartitionCols:_col0 Select Operator [SEL_44] (rows=5619 width=12) Output:["_col0","_col1"] Filter Operator [FIL_43] (rows=5619 width=12) predicate:((d_moy = 12) and d_date_sk is not null) TableScan [TS_6] (rows=73049 width=12) tpcds_bin_partitioned_orc_1000@date_dim,dt,Tbl:COMPLETE,Col:COMPLETE,Output:["d_date_sk","d_year","d_moy"] Dynamic Partitioning Event Operator [EVENT_48] (rows=2809 width=12) Group By Operator [GBY_47] (rows=2809 width=12) Output:["_col0"],keys:_col0 Select Operator [SEL_46] (rows=5619 width=12) Output:["_col0"] Please refer to the previous Select Operator [SEL_44] <-Map Join Operator [MAPJOIN_51] (rows=3978894 width=112) Conds:SEL_50._col0=RS_42._col0(Inner),HybridGraceHashJoin:true,Output:["_col1","_col2","_col4","_col5"] <-Map 4 [BROADCAST_EDGE] vectorized BROADCAST [RS_42] PartitionCols:_col0 Select Operator [SEL_41] (rows=434 width=111) Output:["_col0","_col1","_col2"] Filter Operator [FIL_40] (rows=434 width=111) predicate:((i_manufact_id = 436) and i_item_sk is not null) TableScan [TS_3] (rows=300000 width=111) tpcds_bin_partitioned_orc_1000@item,item,Tbl:COMPLETE,Col:COMPLETE,Output:["i_item_sk","i_brand_id","i_brand","i_manufact_id"] <-Select Operator [SEL_50] (rows=2750387156 width=11) Output:["_col0","_col1","_col2"] Filter Operator [FIL_49] (rows=2750387156 width=11) predicate:ss_item_sk is not null TableScan [TS_0] (rows=2750387156 width=11) tpcds_bin_partitioned_orc_1000@store_sales,store_sales,Tbl:COMPLETE,Col:COMPLETE,Output:["ss_item_sk","ss_ext_sales_price"] By setting hive.tez.dynamic.partition.pruning=true, we can see dynamic partitioning event operators. See more about this in HIVE-7826. New plan runs 31.35s. In the run time, dynamic partition event operator will send values needed to prune to the application master - where splits are generated and tasks are submitted. Using these values we can strip out any unneeded partitions dynamically, while the query is running.](https://image.slidesharecdn.com/m11thur1210pengchengxiong-160906150344/75/How-to-understand-and-analyze-Apache-Hive-query-execution-plan-for-performance-debugging-25-2048.jpg)
![Page31 © Hortonworks Inc. 2011 – 2014. All Rights Reserved SHUFFLE [RS_55] PartitionCols:d_year, i_brand, i_brand_id Group By Operator [GBY_54] (rows=9/10 width=116) Output:["d_year","sum_agg","i_brand","i_brand_id"],aggregations:["sum(ss_ext_sales_price)"],keys:d_year, i_brand, i_brand_id Select Operator [SEL_53] (rows=306061/324651 width=112) Output:["d_year","i_brand","i_brand_id","ss_ext_sales_price"] Map Join Operator [MAPJOIN_52] (rows=306061/324651 width=112) Conds:MAPJOIN_51. ss_sold_date_sk=RS_45. d_date_sk(Inner),HybridGraceHashJoin:true,Output:["d_year","i_brand","i_brand_id","ss_ext_sales_price"] <-Map 5 [BROADCAST_EDGE] vectorized BROADCAST [RS_45] PartitionCols:d_date_sk Select Operator [SEL_44] (rows=5619/6034 width=12) Output:["d_date_sk","d_year"] Filter Operator [FIL_43] (rows=5619/6034 width=12) predicate:((d_moy = 12) and d_date_sk is not null) TableScan [TS_6] (rows=73049/73049 width=12) tpcds_bin_partitioned_orc_1000@date_dim,dt,Tbl:COMPLETE,Col:COMPLETE,Output:["d_date_sk","d_year","d_moy"] Dynamic Partitioning Event Operator [EVENT_48] (rows=2809 width=12) Group By Operator [GBY_47] (rows=2809/2324 width=12) Output:["d_date_sk"],keys:d_date_sk Select Operator [SEL_46] (rows=5619/6034 width=12) Output:["d_date_sk"] Please refer to the previous Select Operator [SEL_44] <-Map Join Operator [MAPJOIN_51] (rows=3978894/4202377 width=112) Conds:SEL_50.ss_item_sk=RS_42. i_item_sk(Inner),HybridGraceHashJoin:true,Output:["ss_ext_sales_price",” ss_sold_date_sk","i_brand","i_brand_id"] <-Map 4 [BROADCAST_EDGE] vectorized BROADCAST [RS_42] PartitionCols:i_item_sk Select Operator [SEL_41] (rows=434/453 width=111) Output:[” i_item_sk","i_brand_id","i_brand"] Filter Operator [FIL_40] (rows=434/453 width=111) predicate:((i_manufact_id = 436) and i_item_sk is not null) TableScan [TS_3] (rows=300000/300000 width=111) tpcds_bin_partitioned_orc_1000@item,item,Tbl:COMPLETE,Col:COMPLETE,Output:["i_item_sk","i_brand_id","i_brand","i_manufact_id"] <-Select Operator [SEL_50] (rows=2750387156/2750387156 width=11) Output:["ss_item_sk","ss_ext_sales_price","ss_sold_date_sk"] Filter Operator [FIL_49] (rows=2750387156/2750387156 width=11) predicate:ss_item_sk is not null TableScan [TS_0] (rows=2750387156/2750387156 width=11) tpcds_bin_partitioned_orc_1000@store_sales,store_sales,Tbl:COMPLETE,Col:COMPLETE,Output:["ss_item_sk","ss_ext_sales_price"]](https://image.slidesharecdn.com/m11thur1210pengchengxiong-160906150344/75/How-to-understand-and-analyze-Apache-Hive-query-execution-plan-for-performance-debugging-31-2048.jpg)


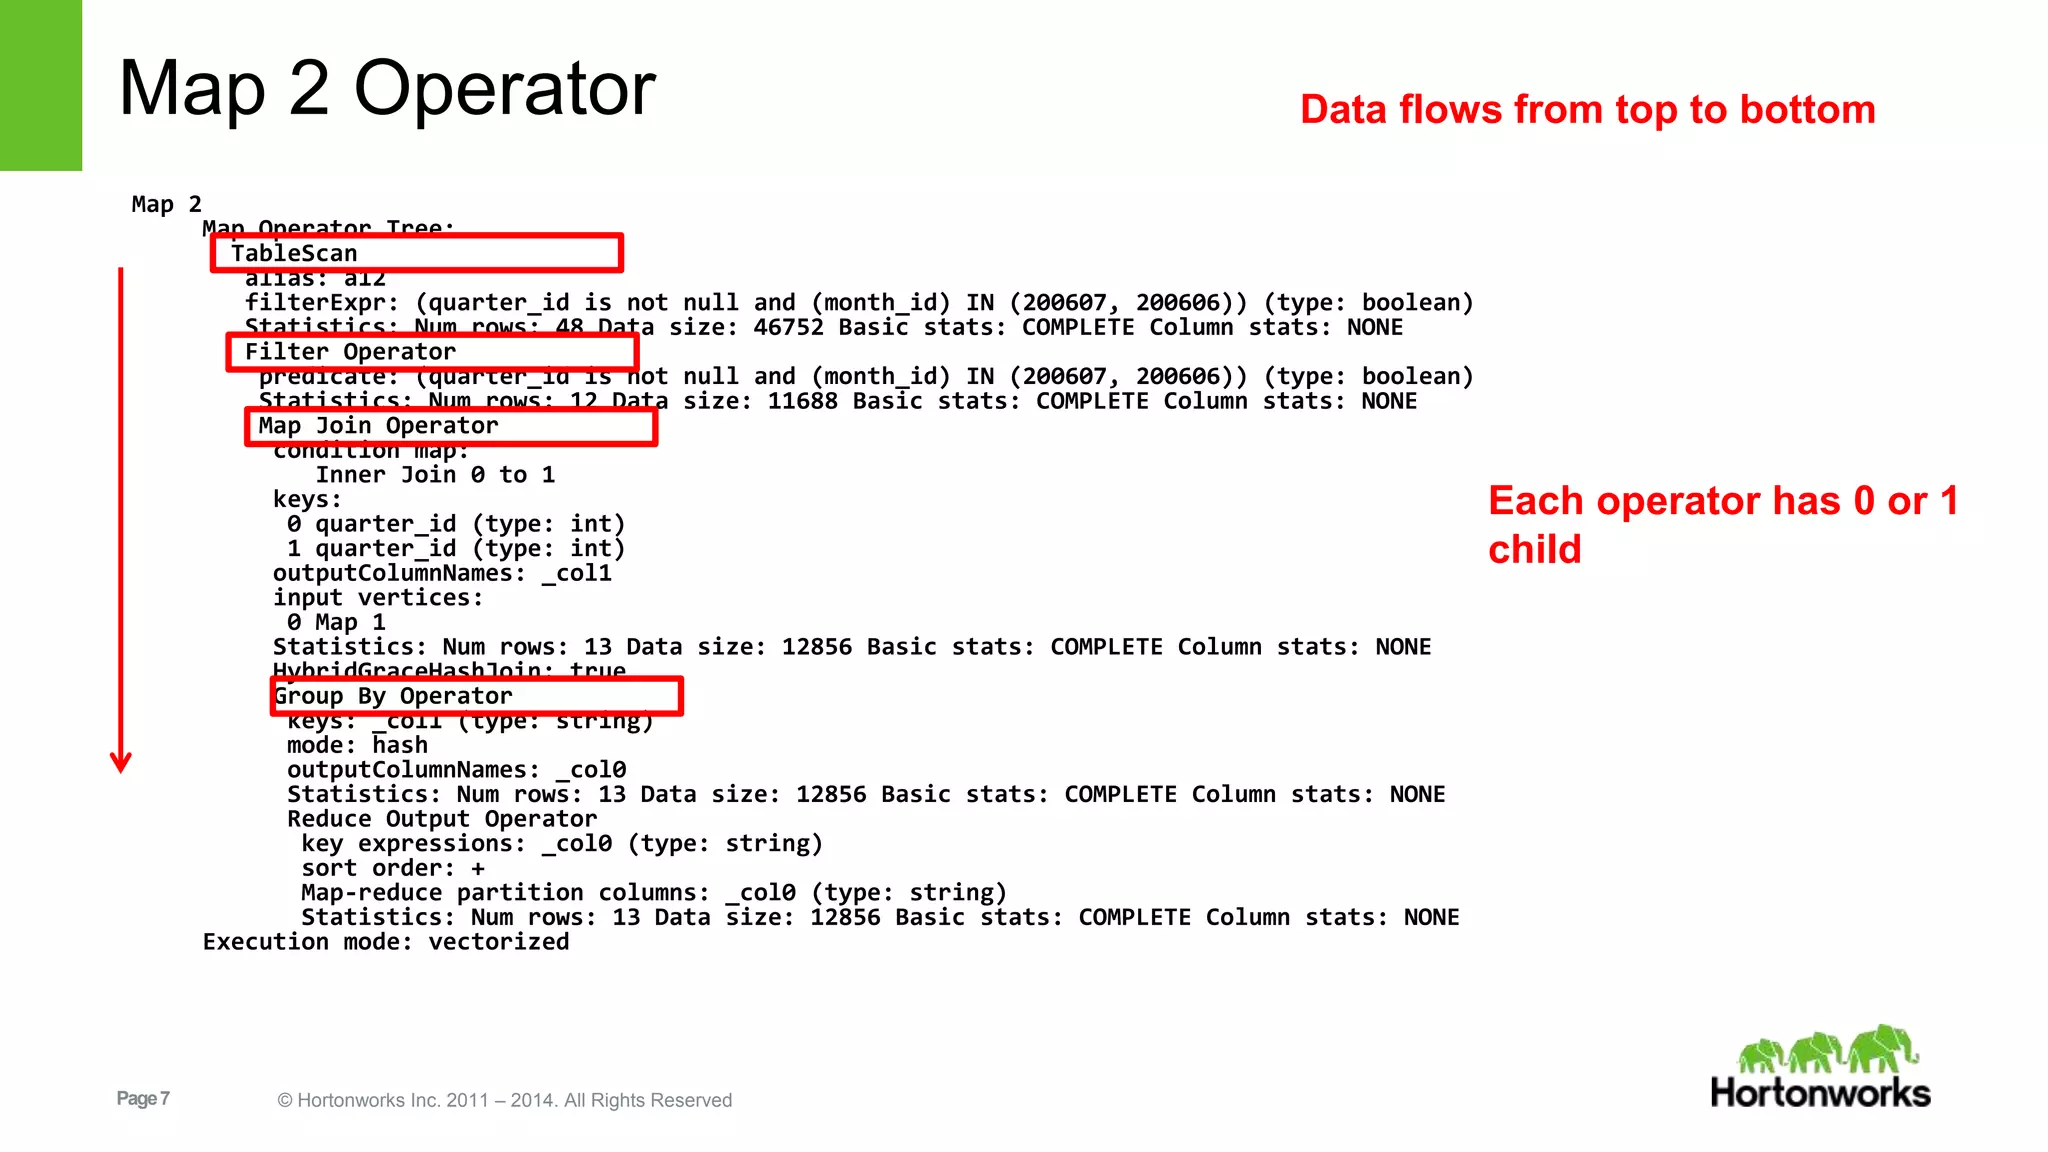
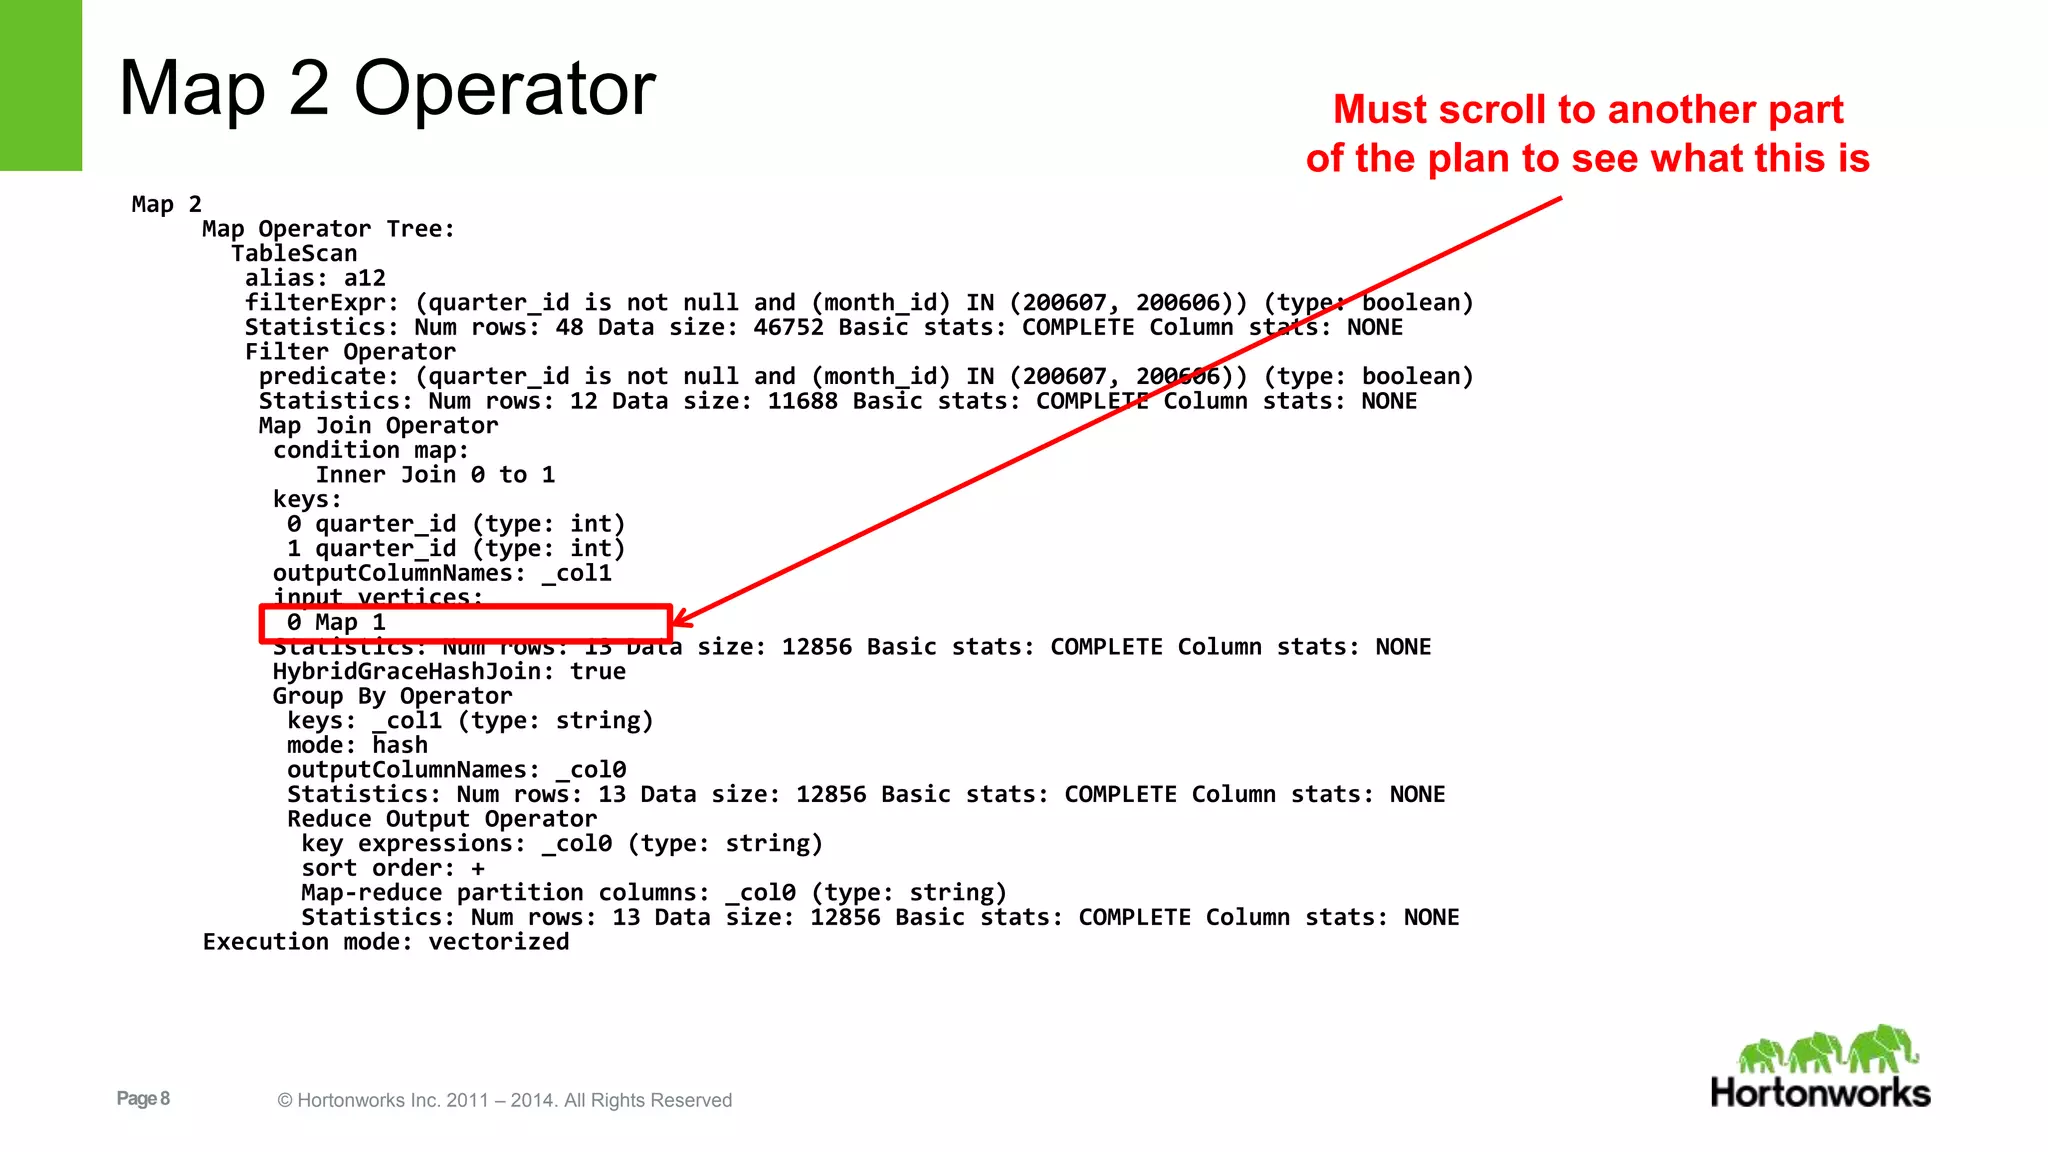
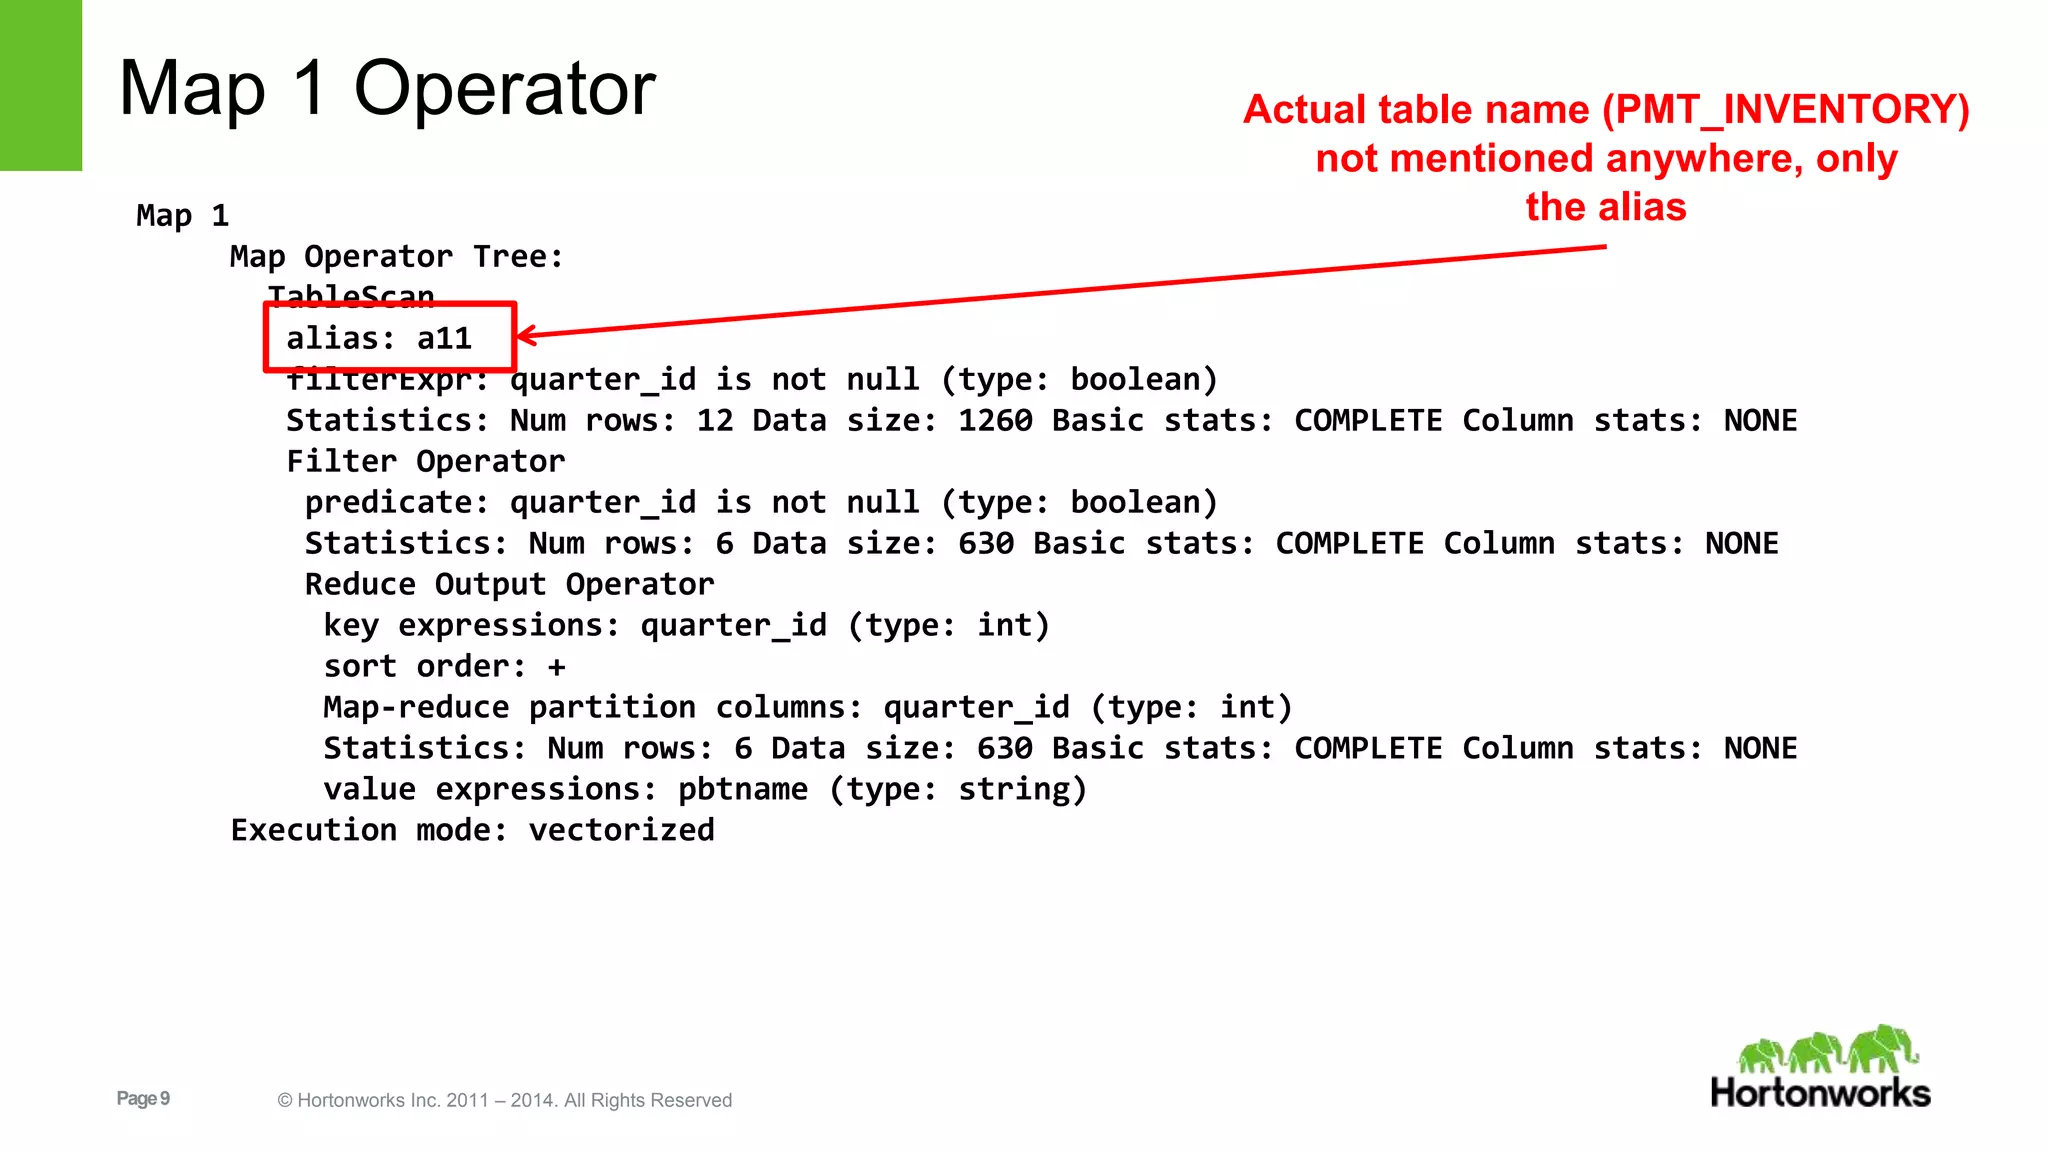
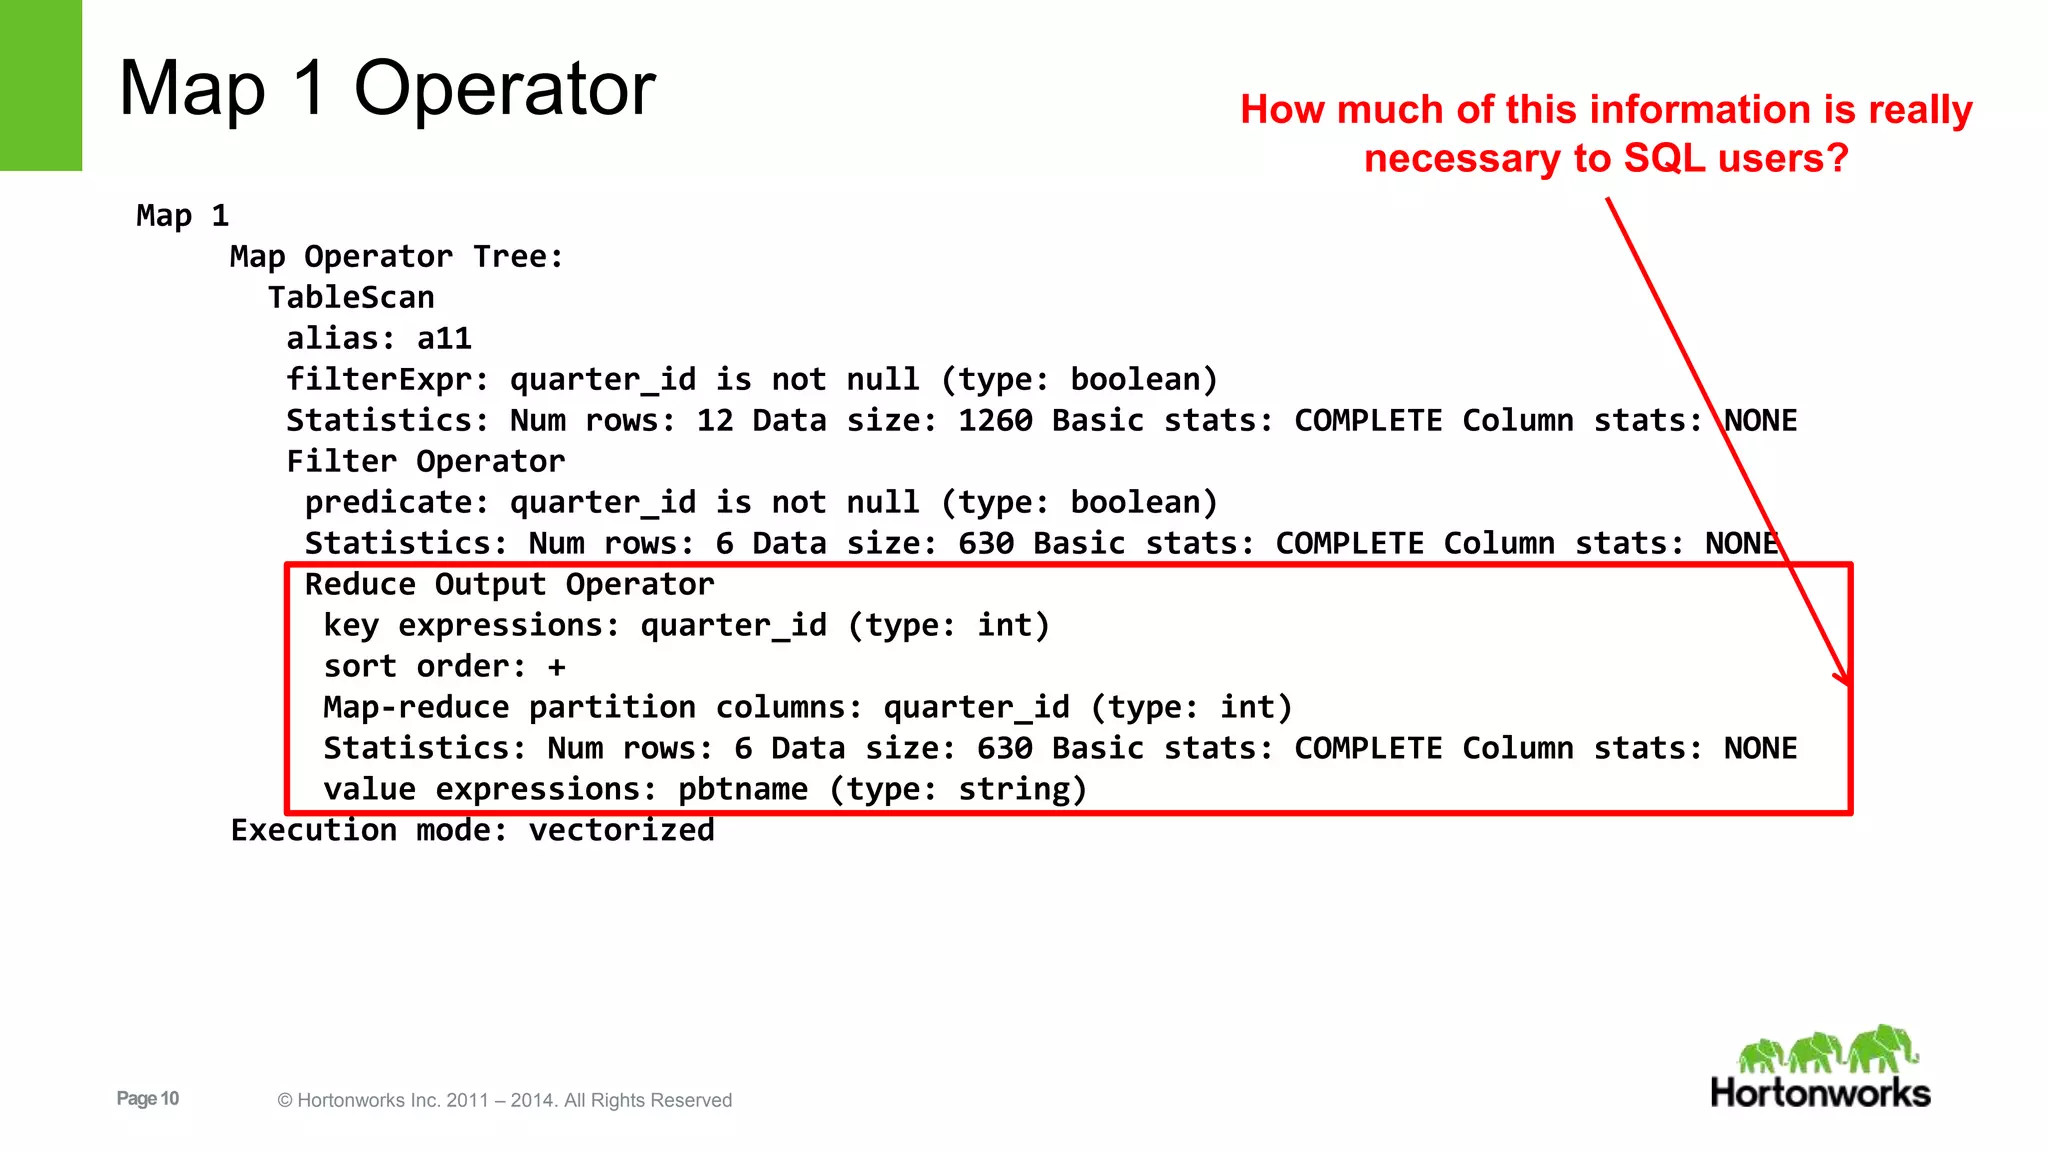
The document compares the query execution plans produced by Apache Hive and PostgreSQL. It shows that Hive's old-style execution plans are overly verbose and difficult to understand, providing many low-level details across multiple stages. In contrast, PostgreSQL's plans are more concise and readable, showing the logical query plan in a top-down manner with actual table names and fewer lines of text. The document advocates for Hive to adopt a simpler execution plan format similar to PostgreSQL's.
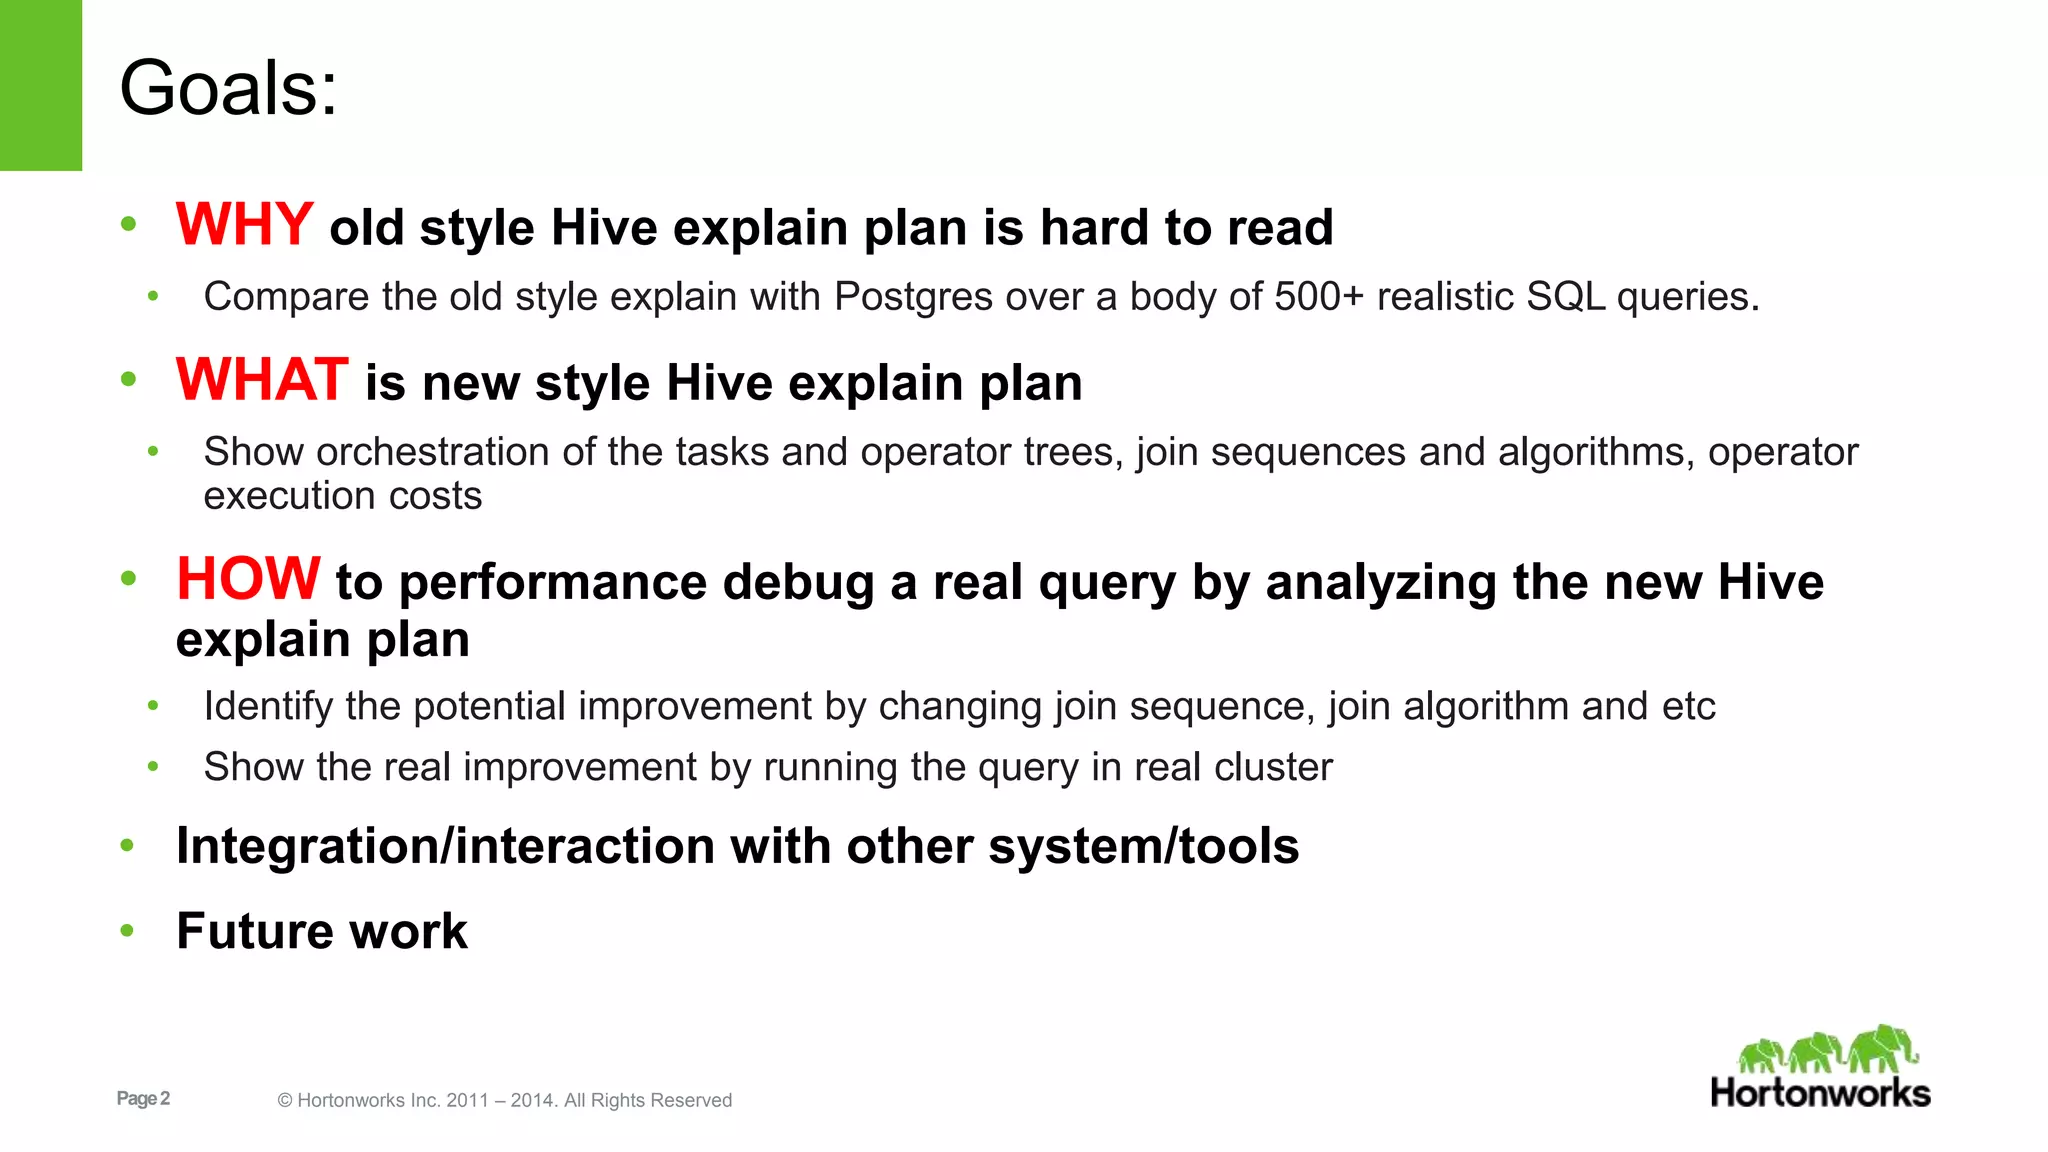
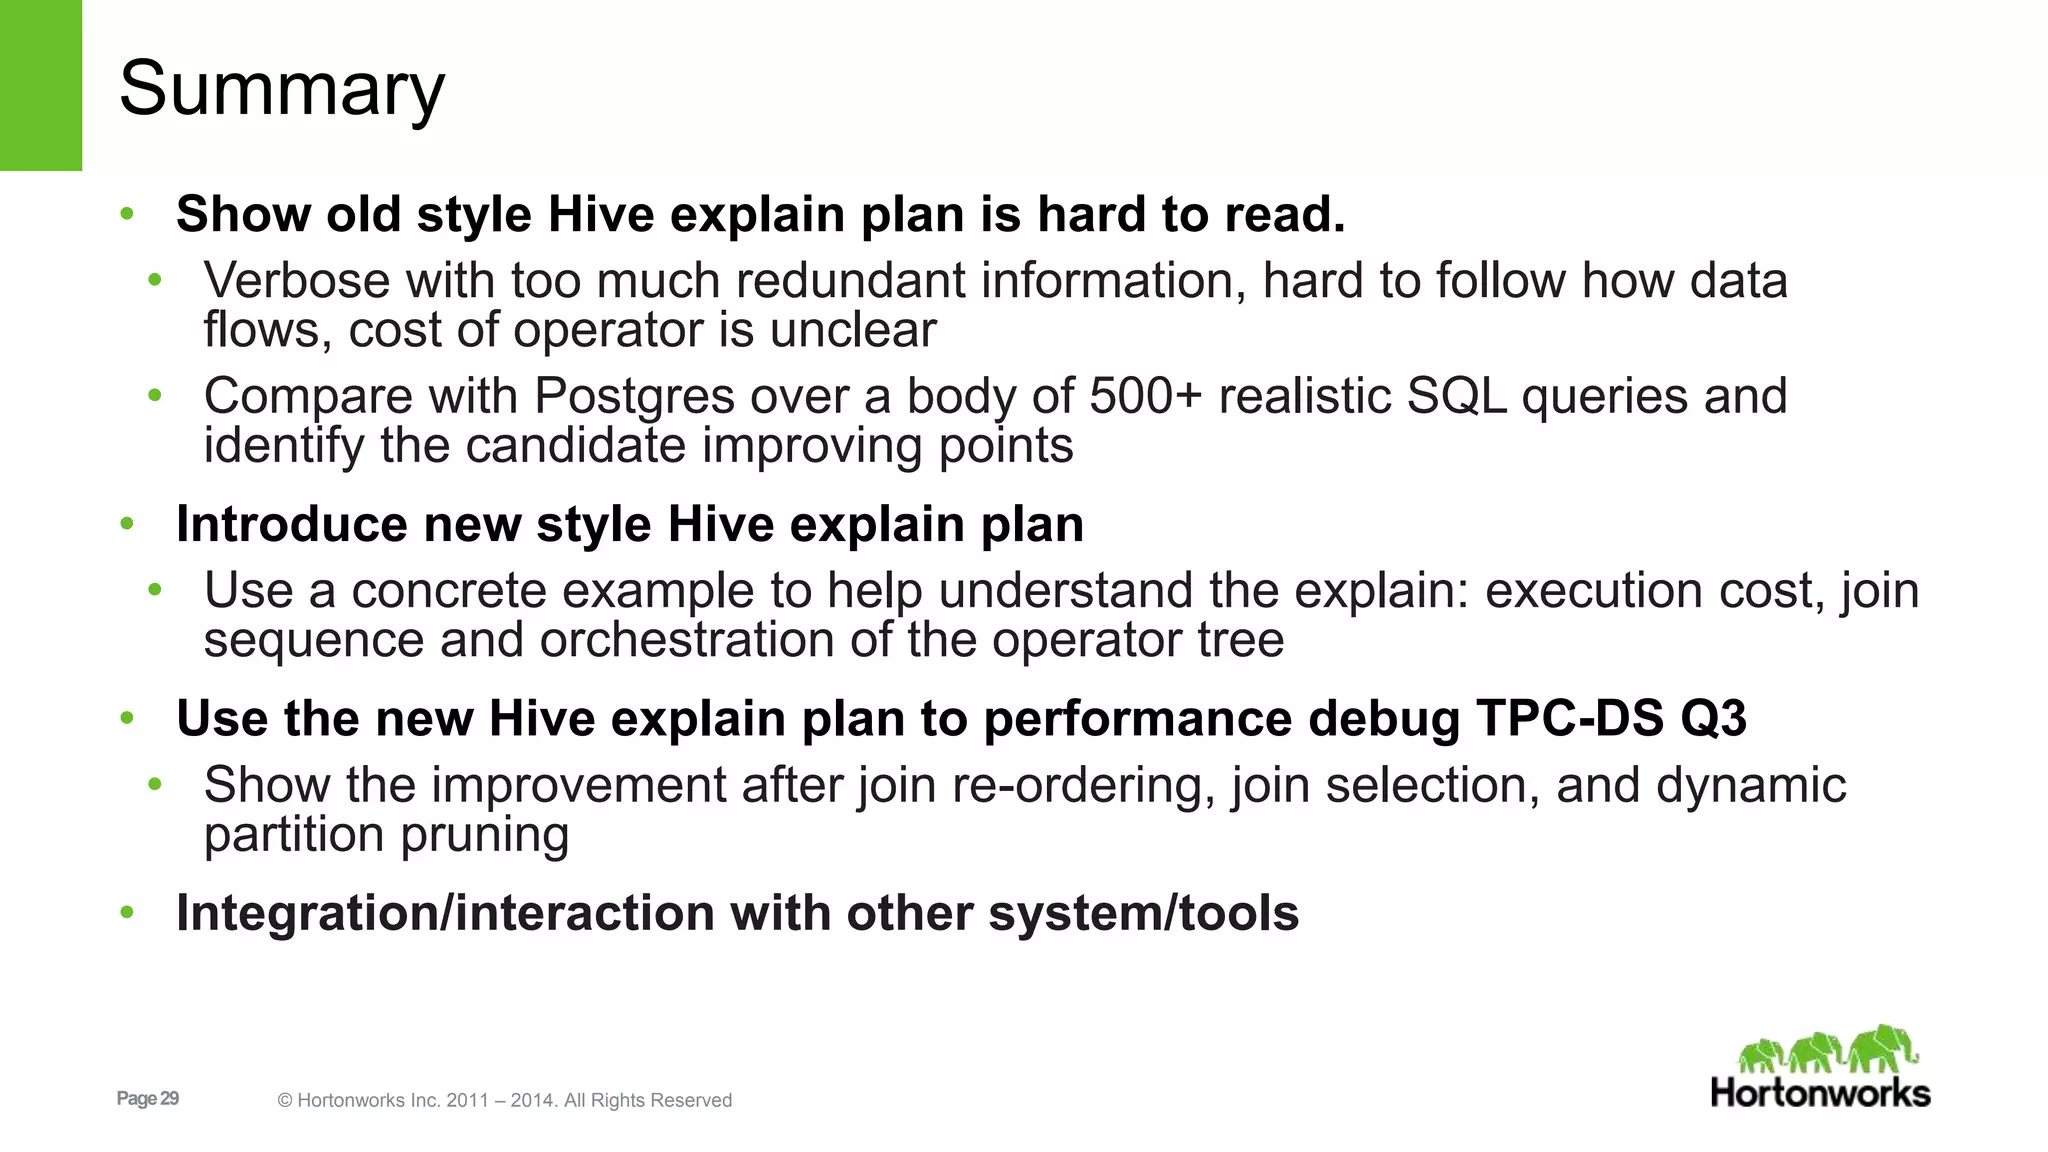
Overview of analyzing Hive query execution plans for performance debugging and comparison with Postgres.
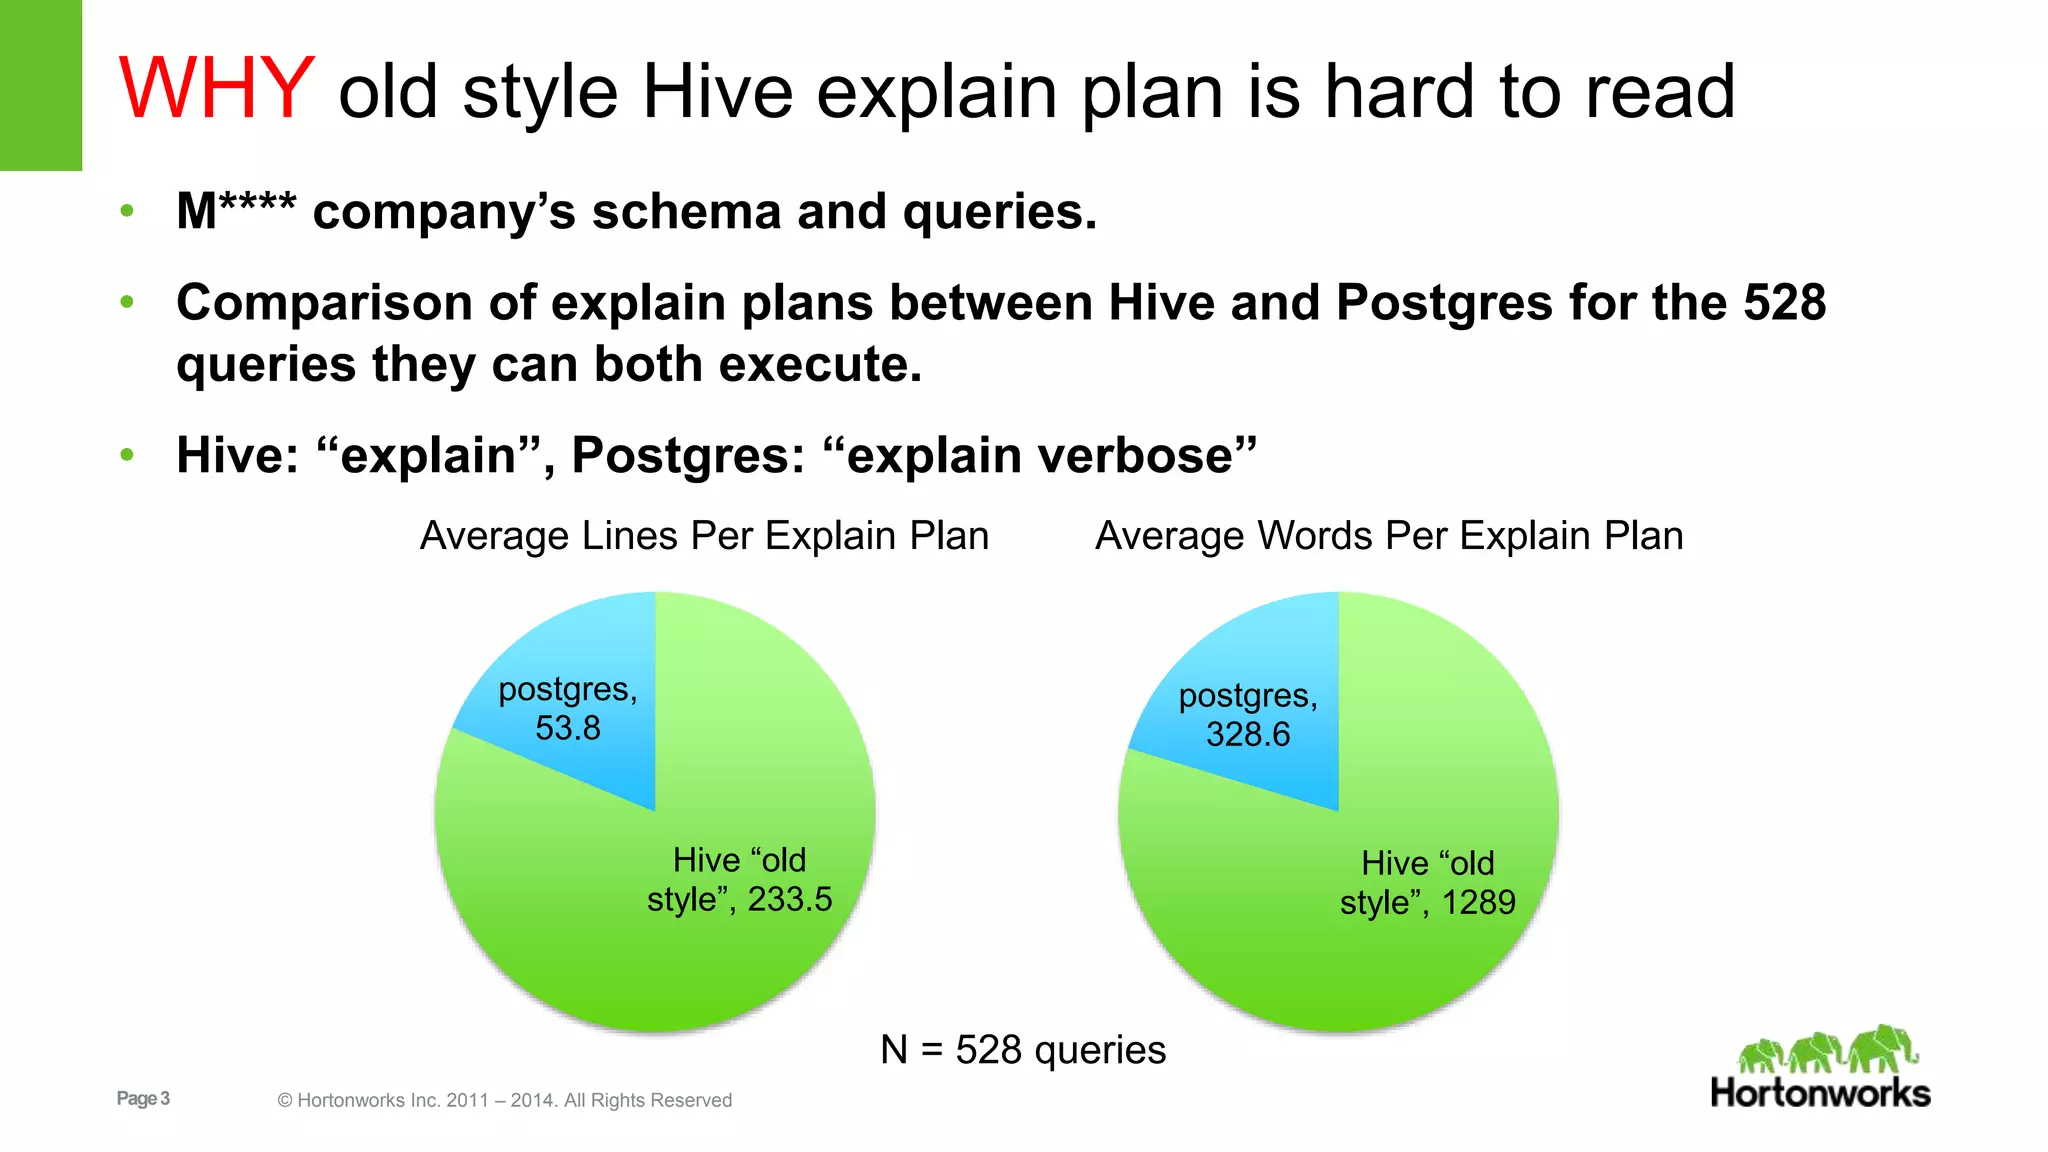
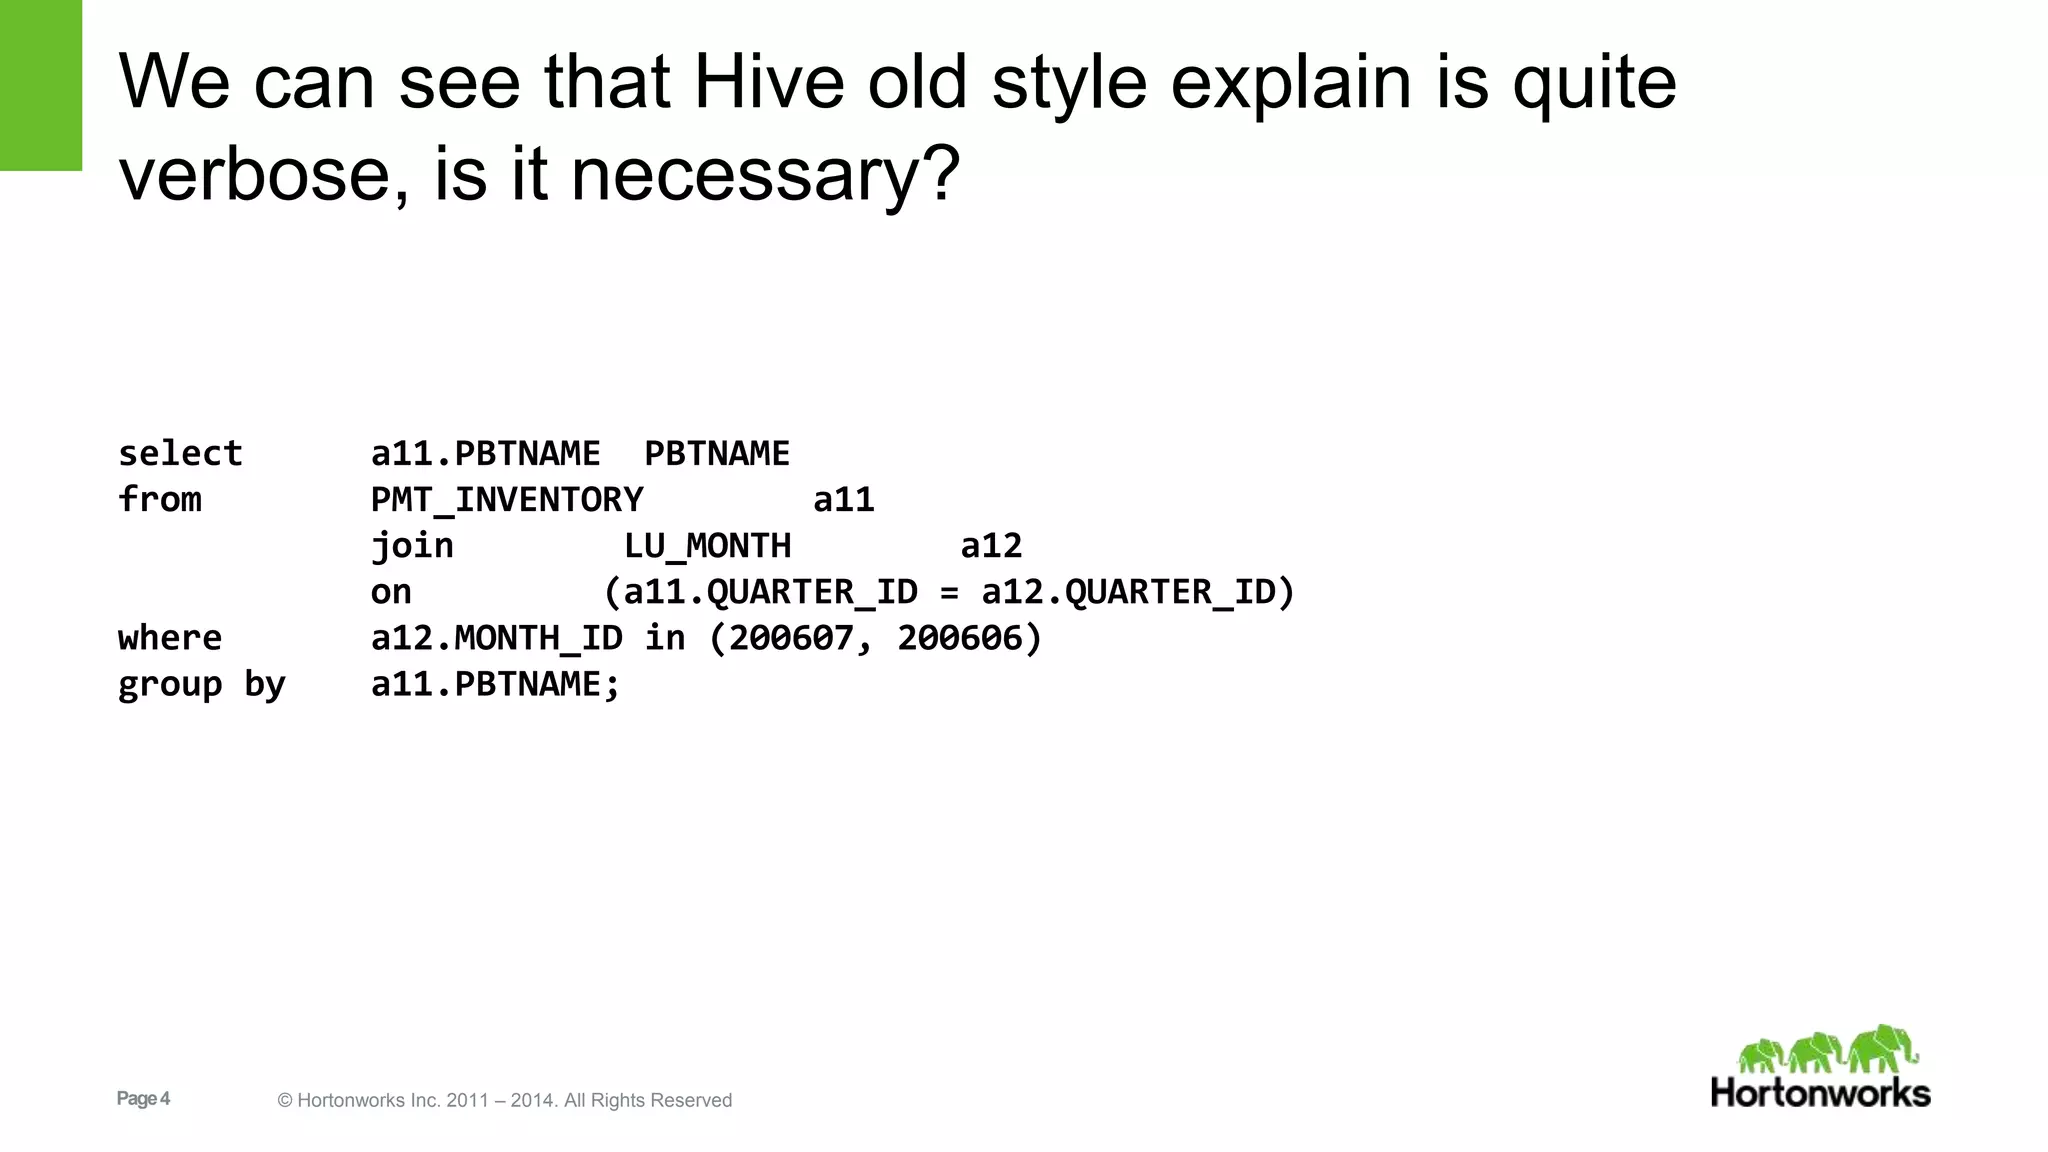
Old Hive explain plans are verbose; examples show comparison in lines and words vs Postgres.
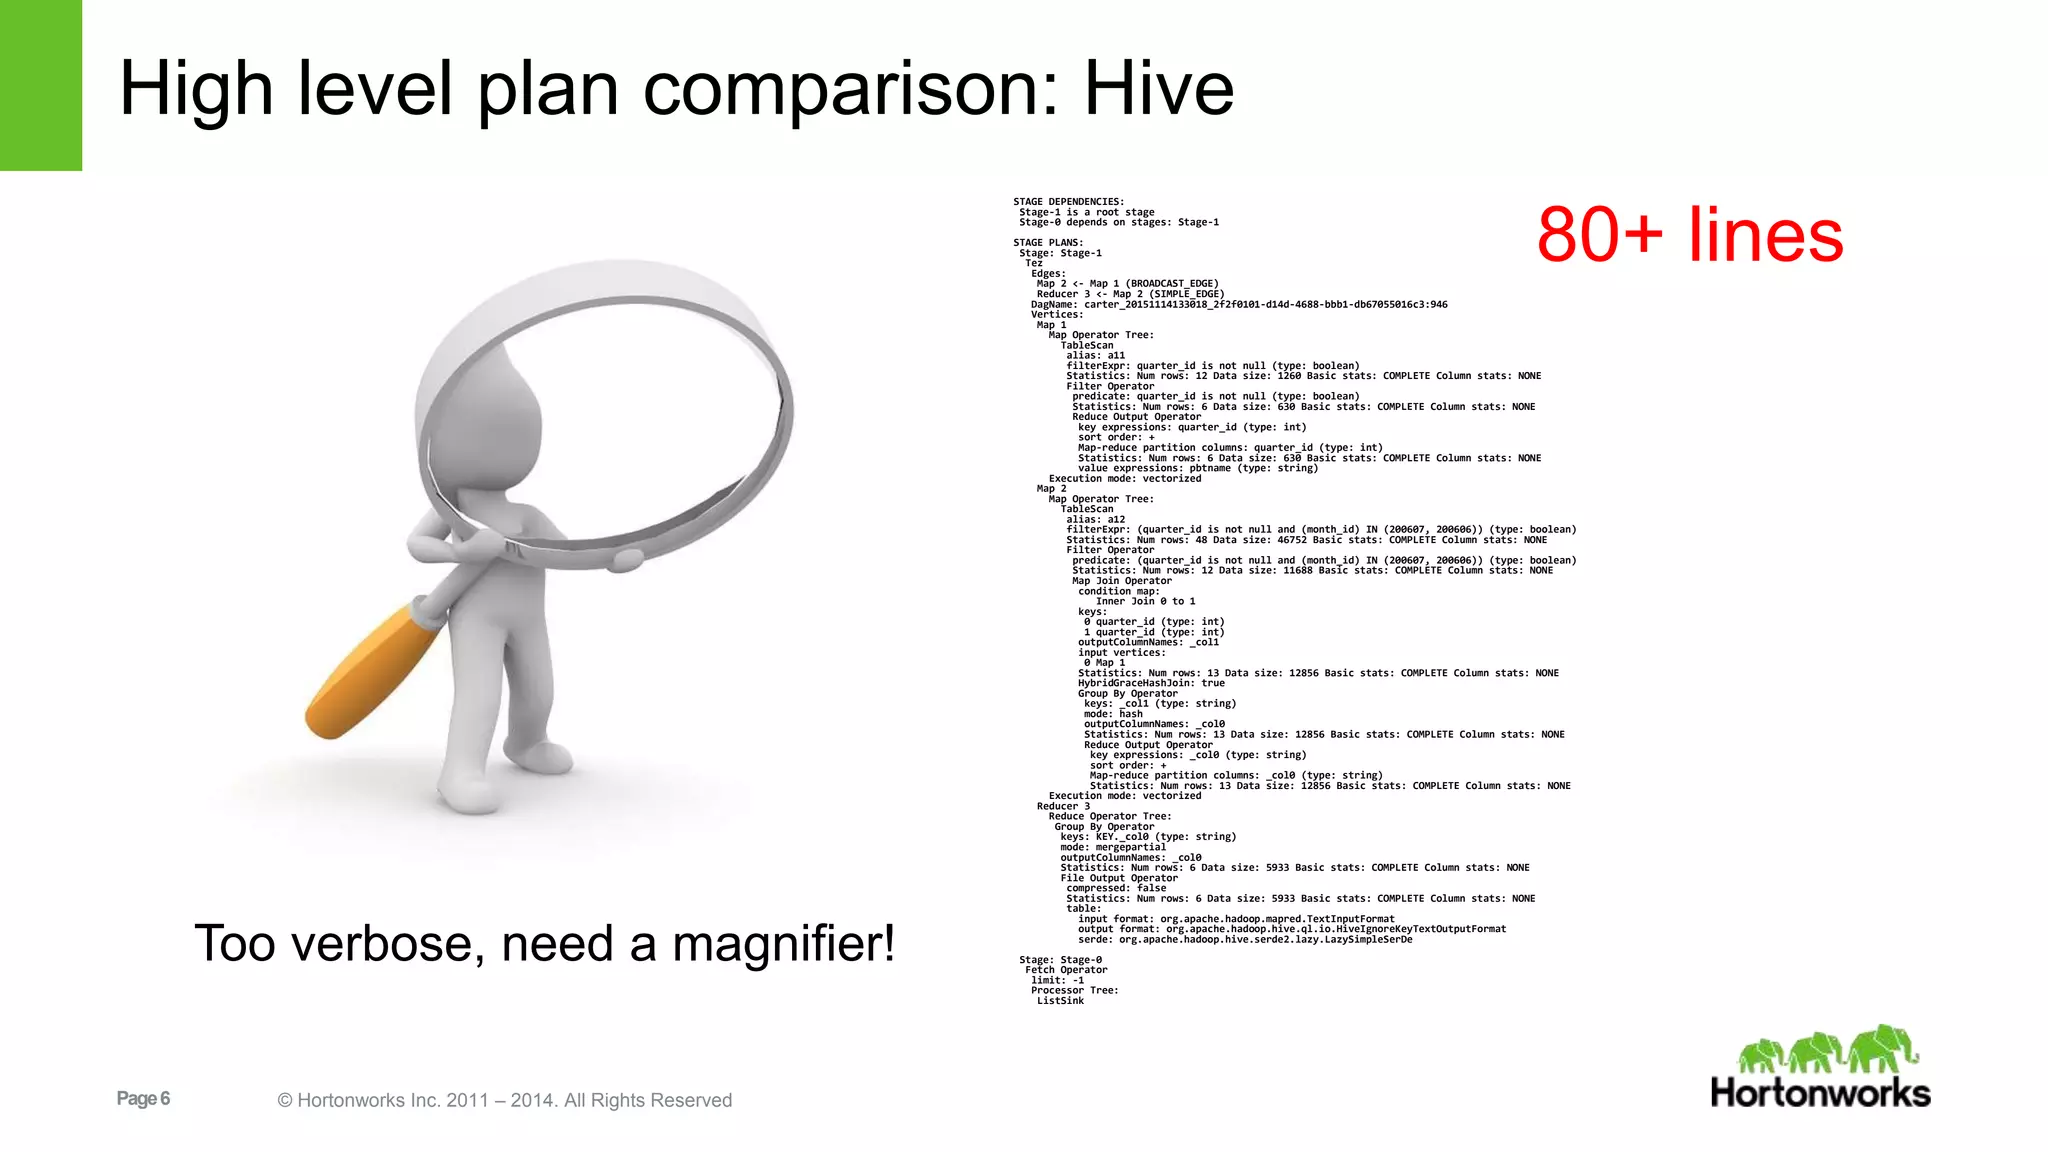
High level comparison of old-style Hive plans reveals verbosity and difficulty in extracting useful information.
Back to Postgres, illustrating dense plan structure and clarity with joins compared to Hive.
New Hive explain plans are concise, ordered, and include useful operator information for analysis.
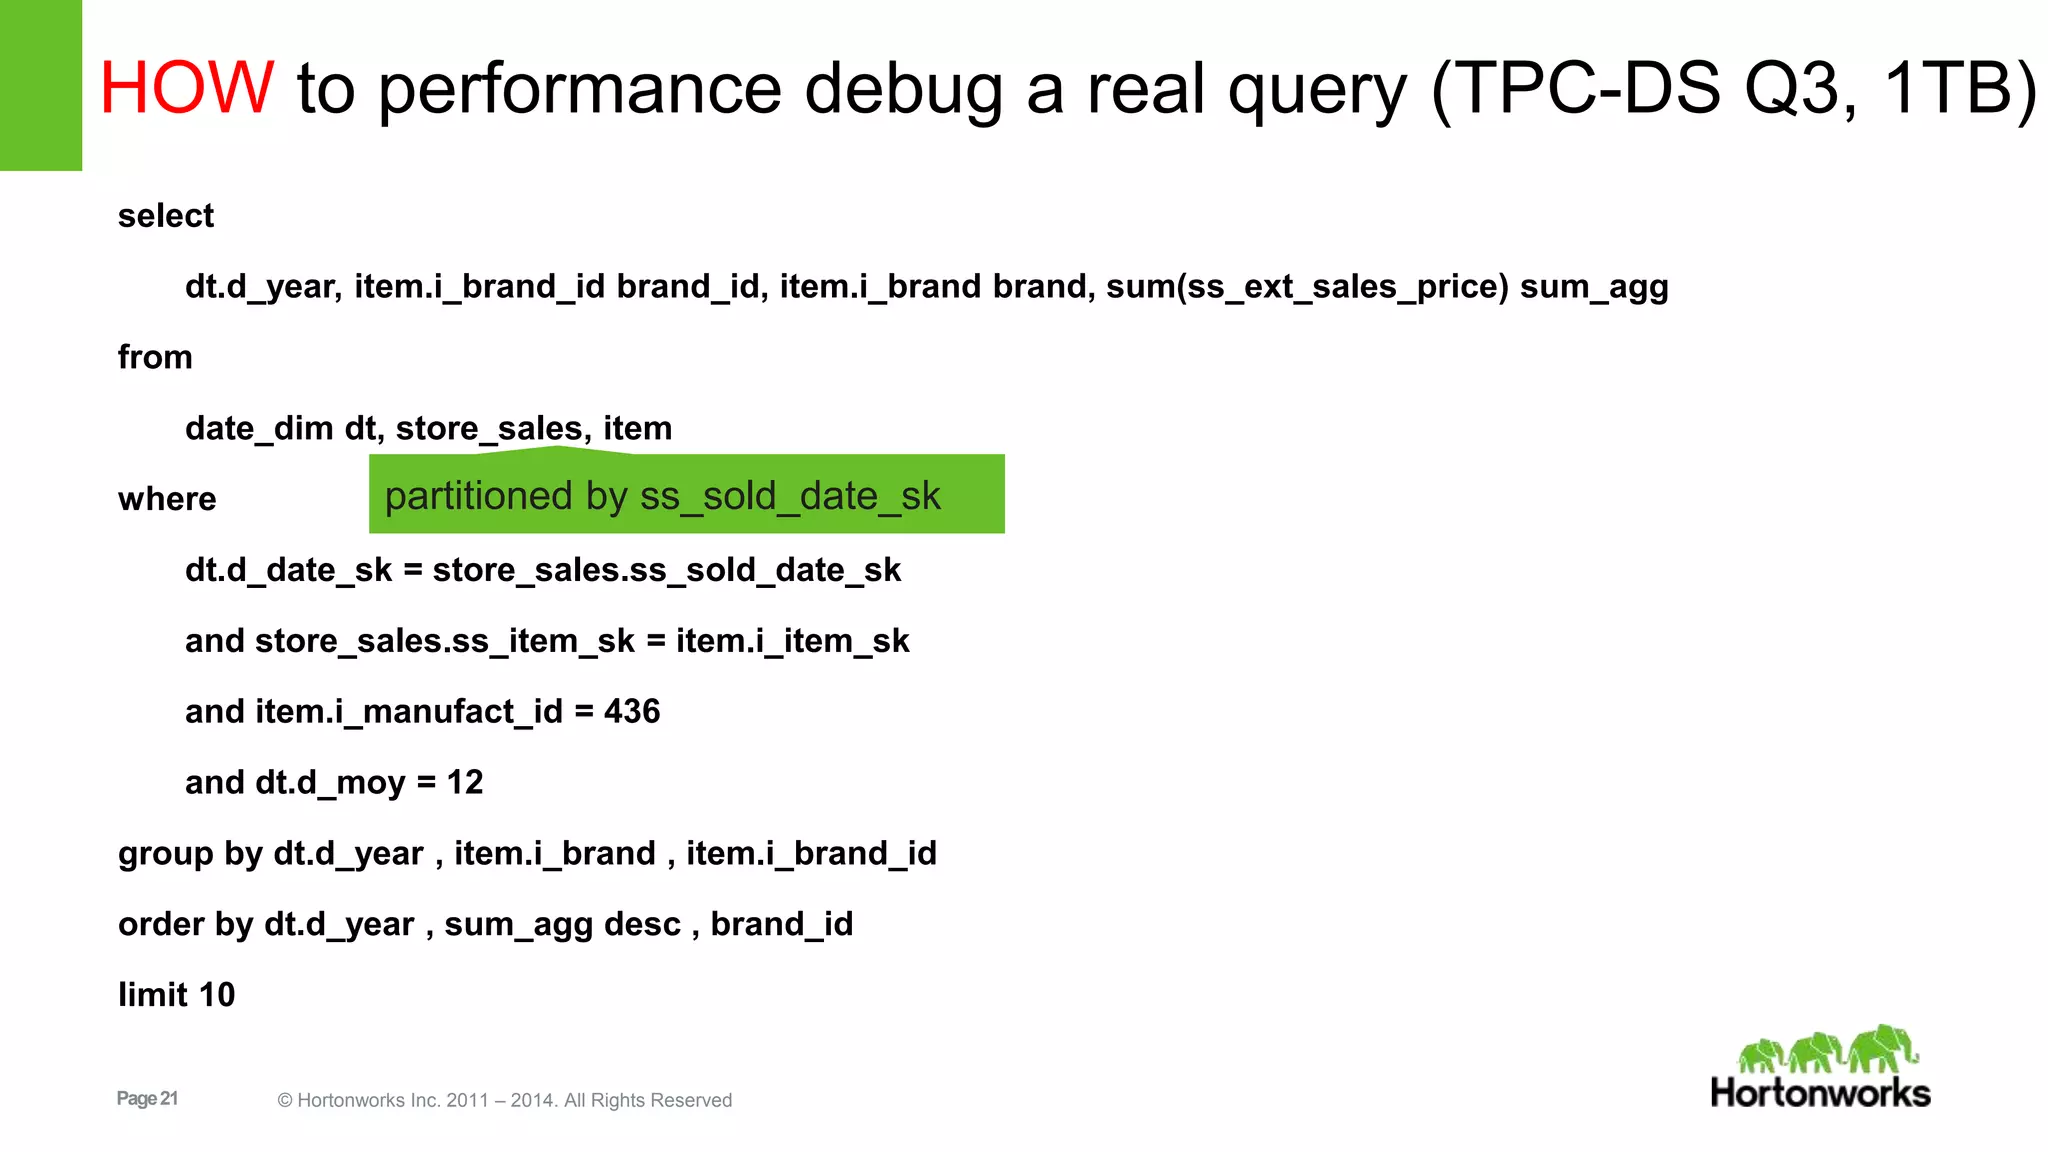
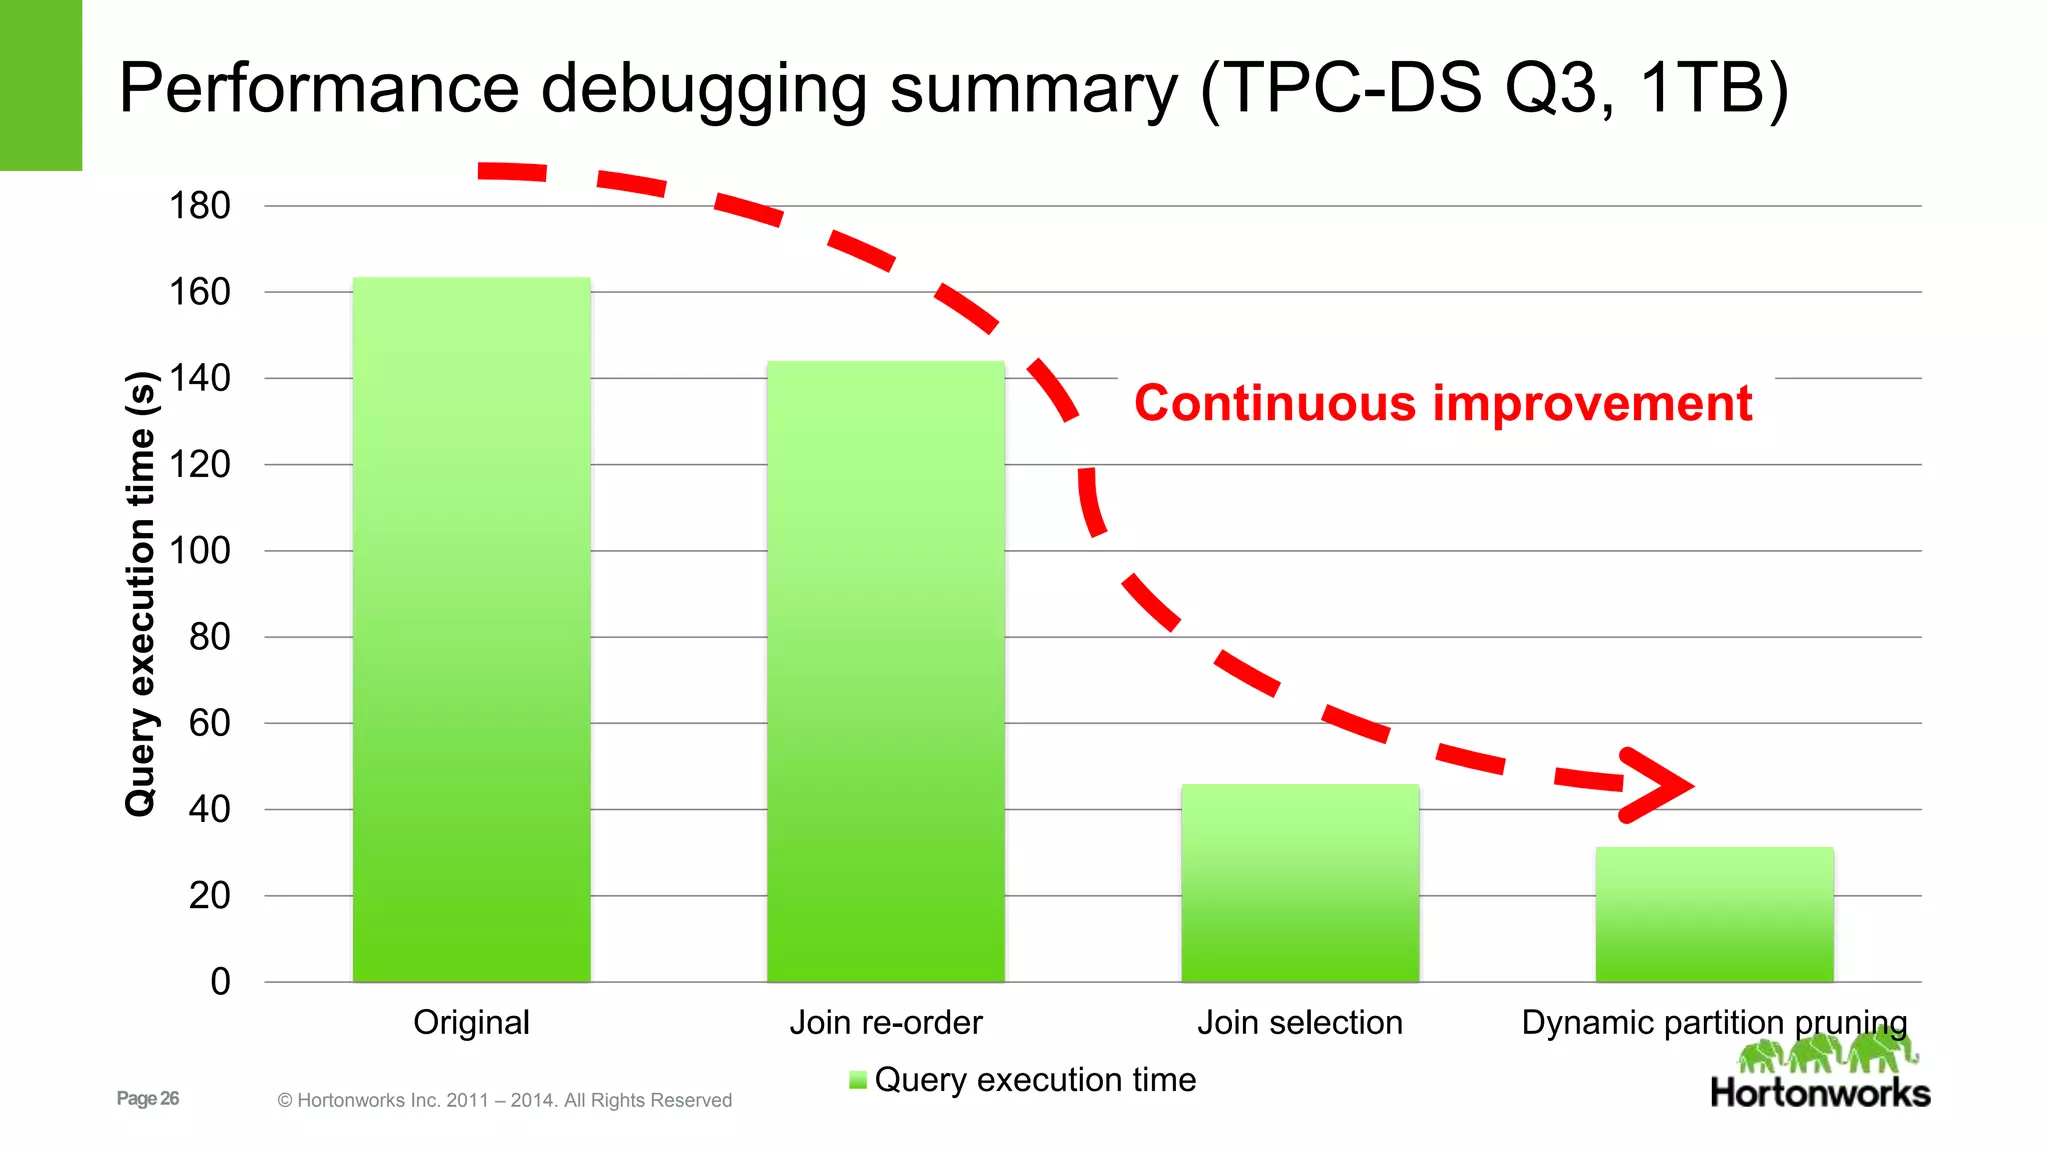
Example query execution for performance debugging, analyzing execution time, join orders, and optimizations.
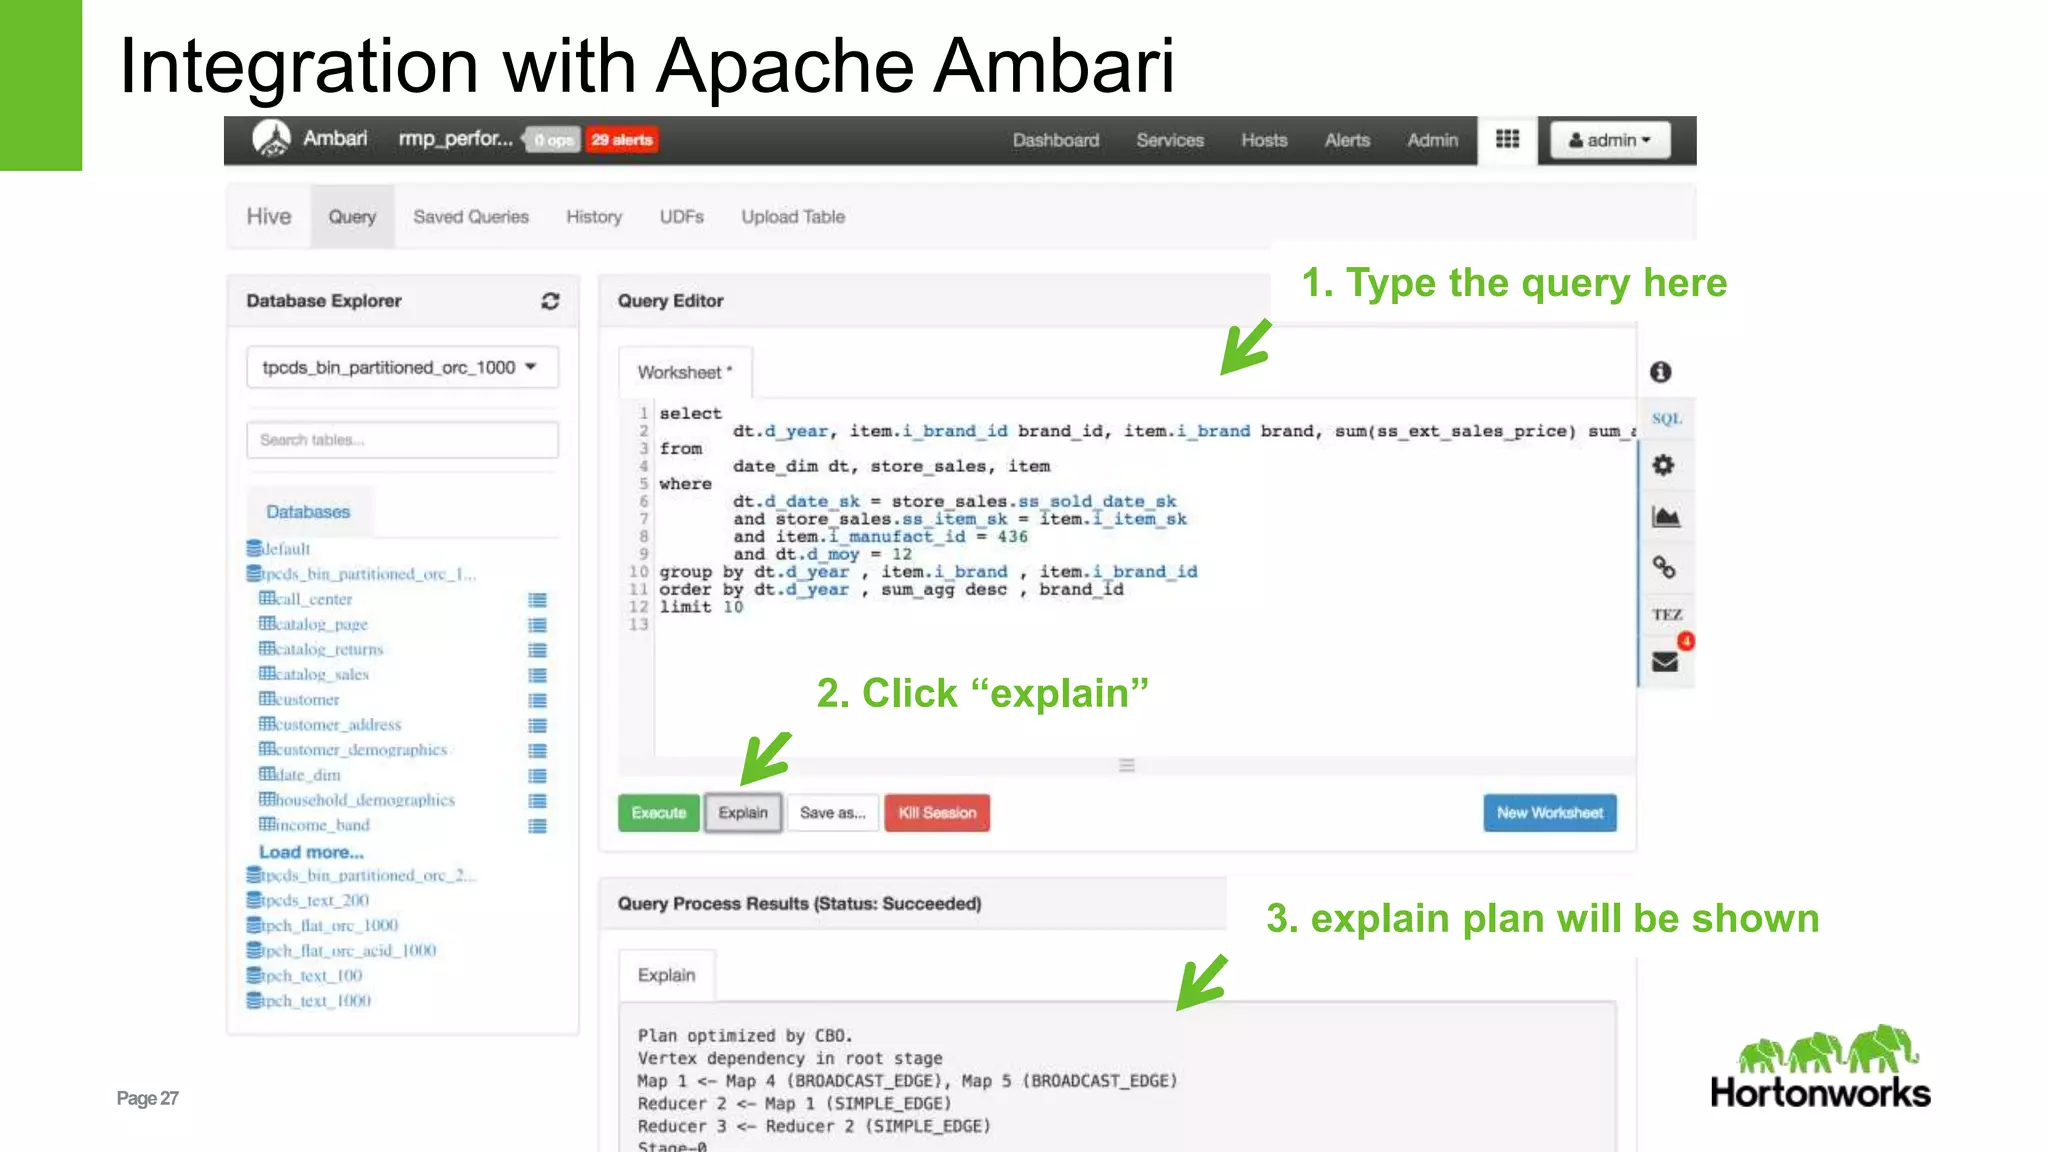
Integration of query plans with tools like Apache Ambari for better insights into query performance.
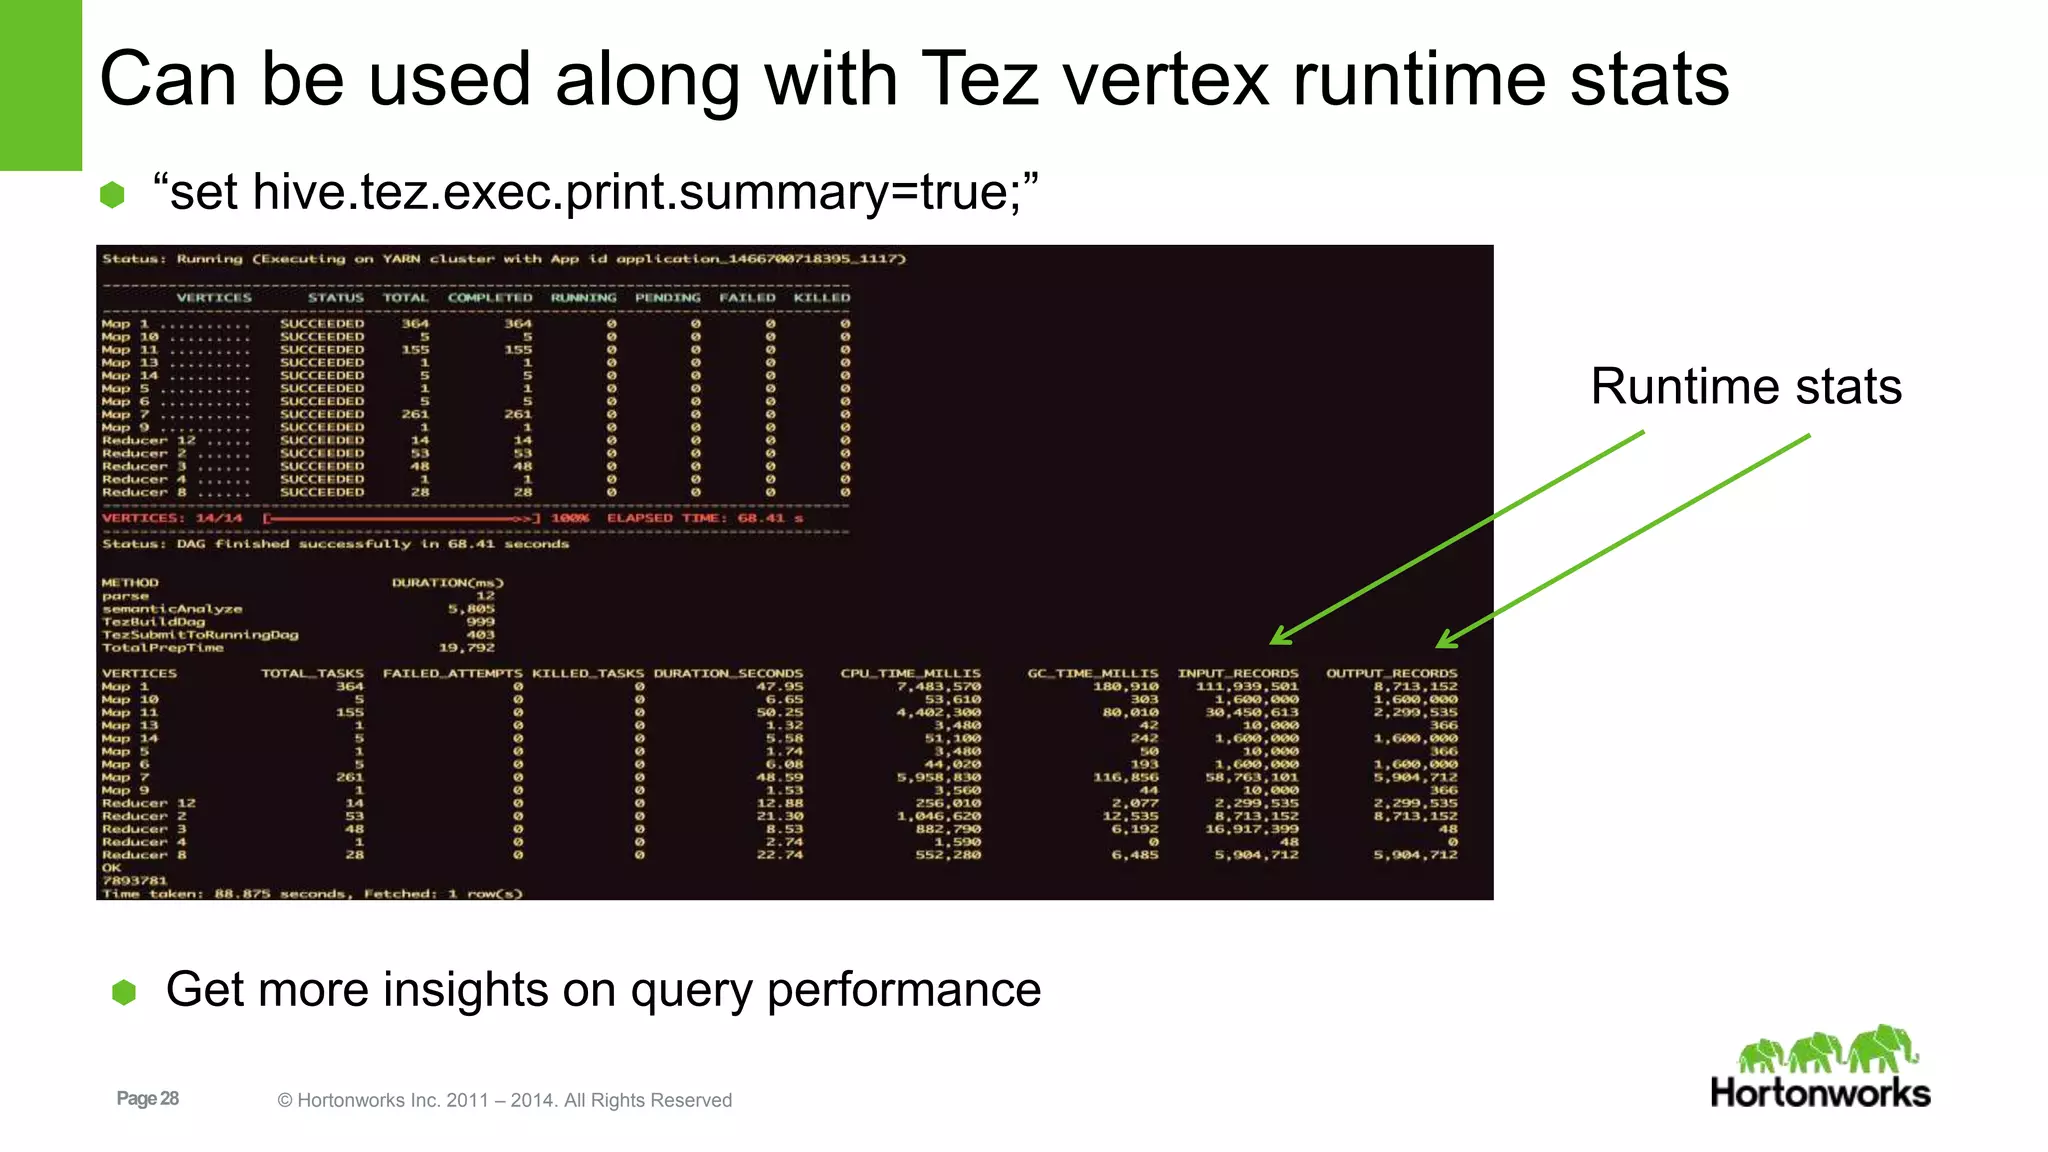
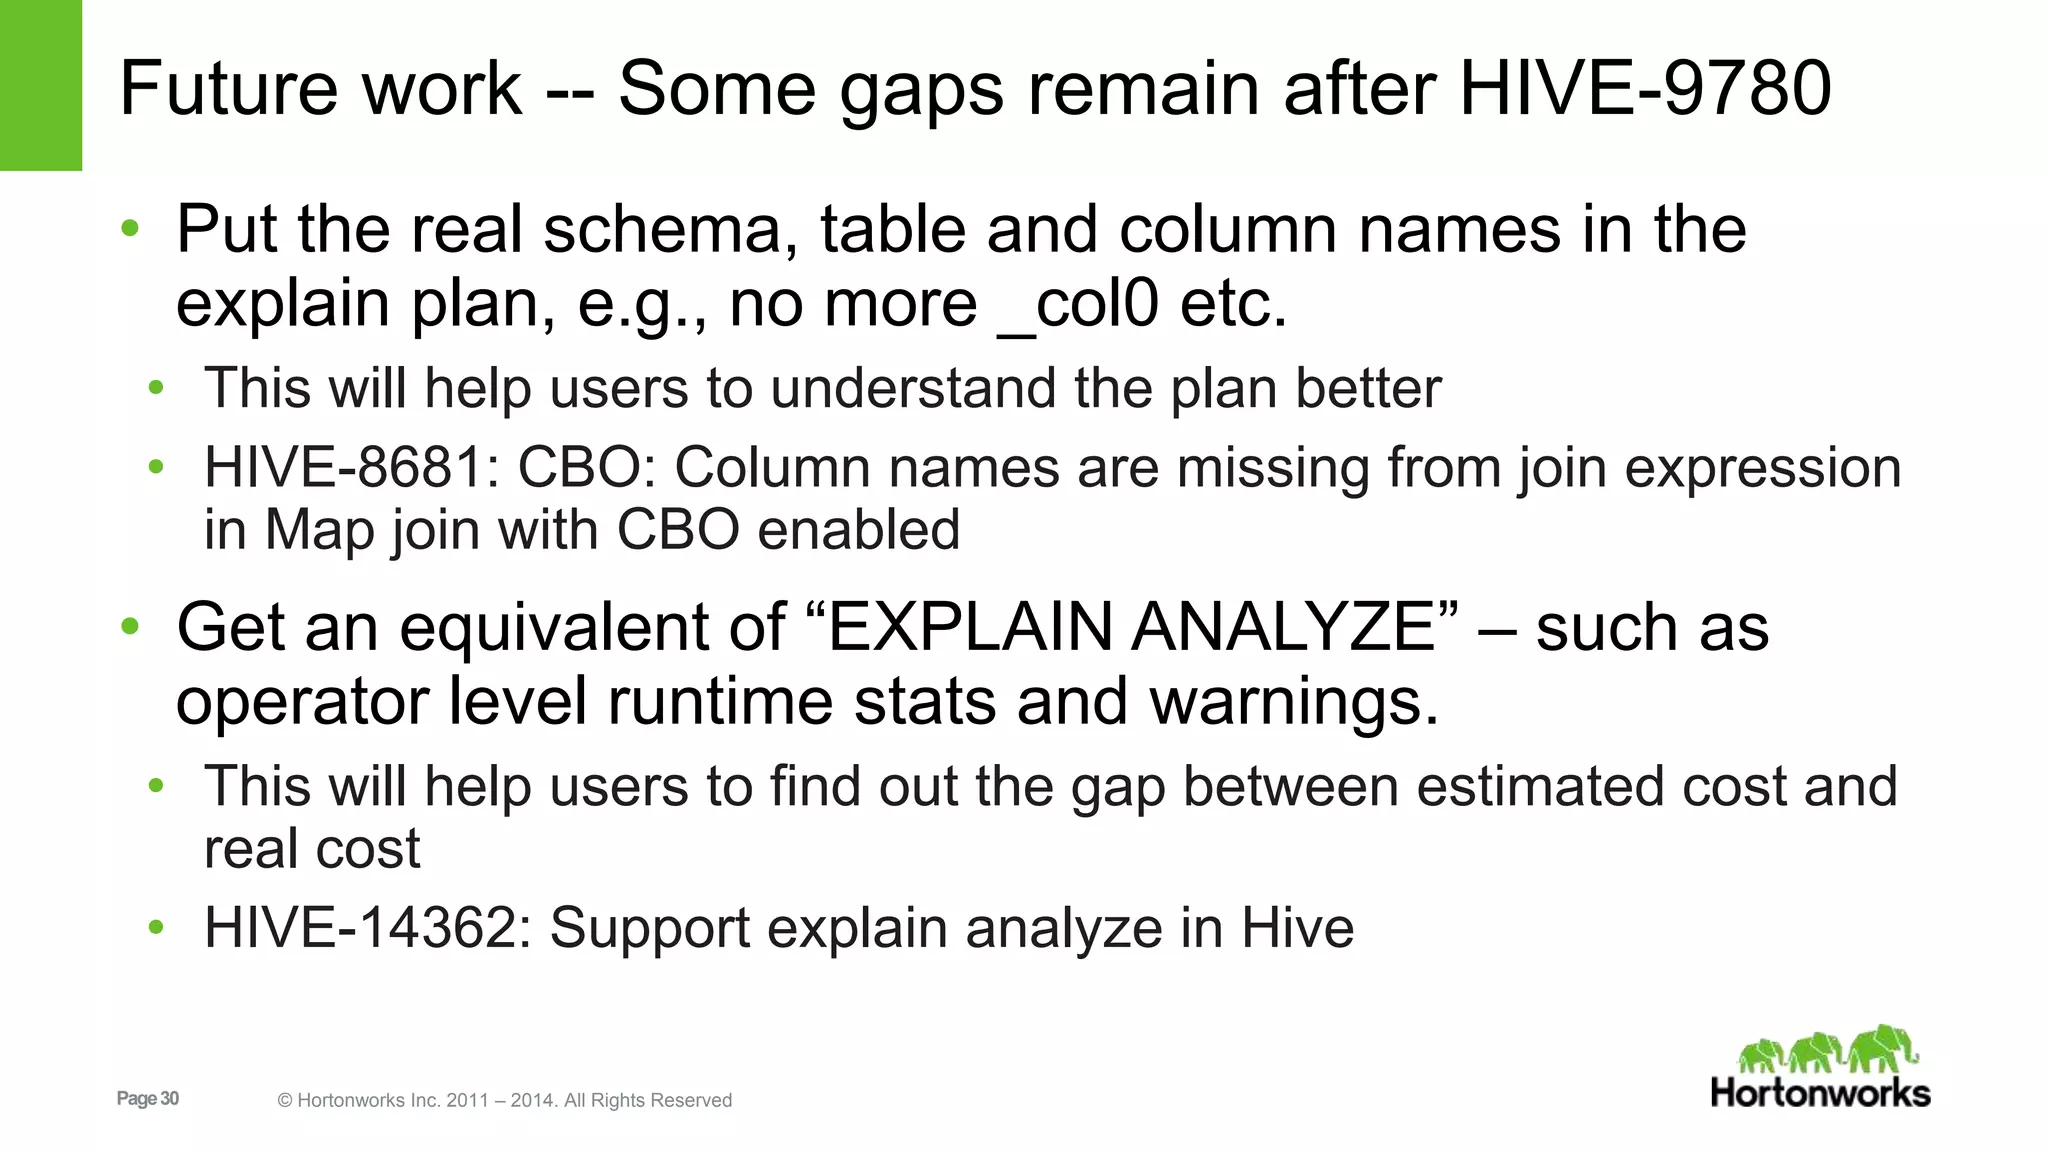
Identifying gaps in the current system for better schema visibility, runtime stats, and ongoing improvements.