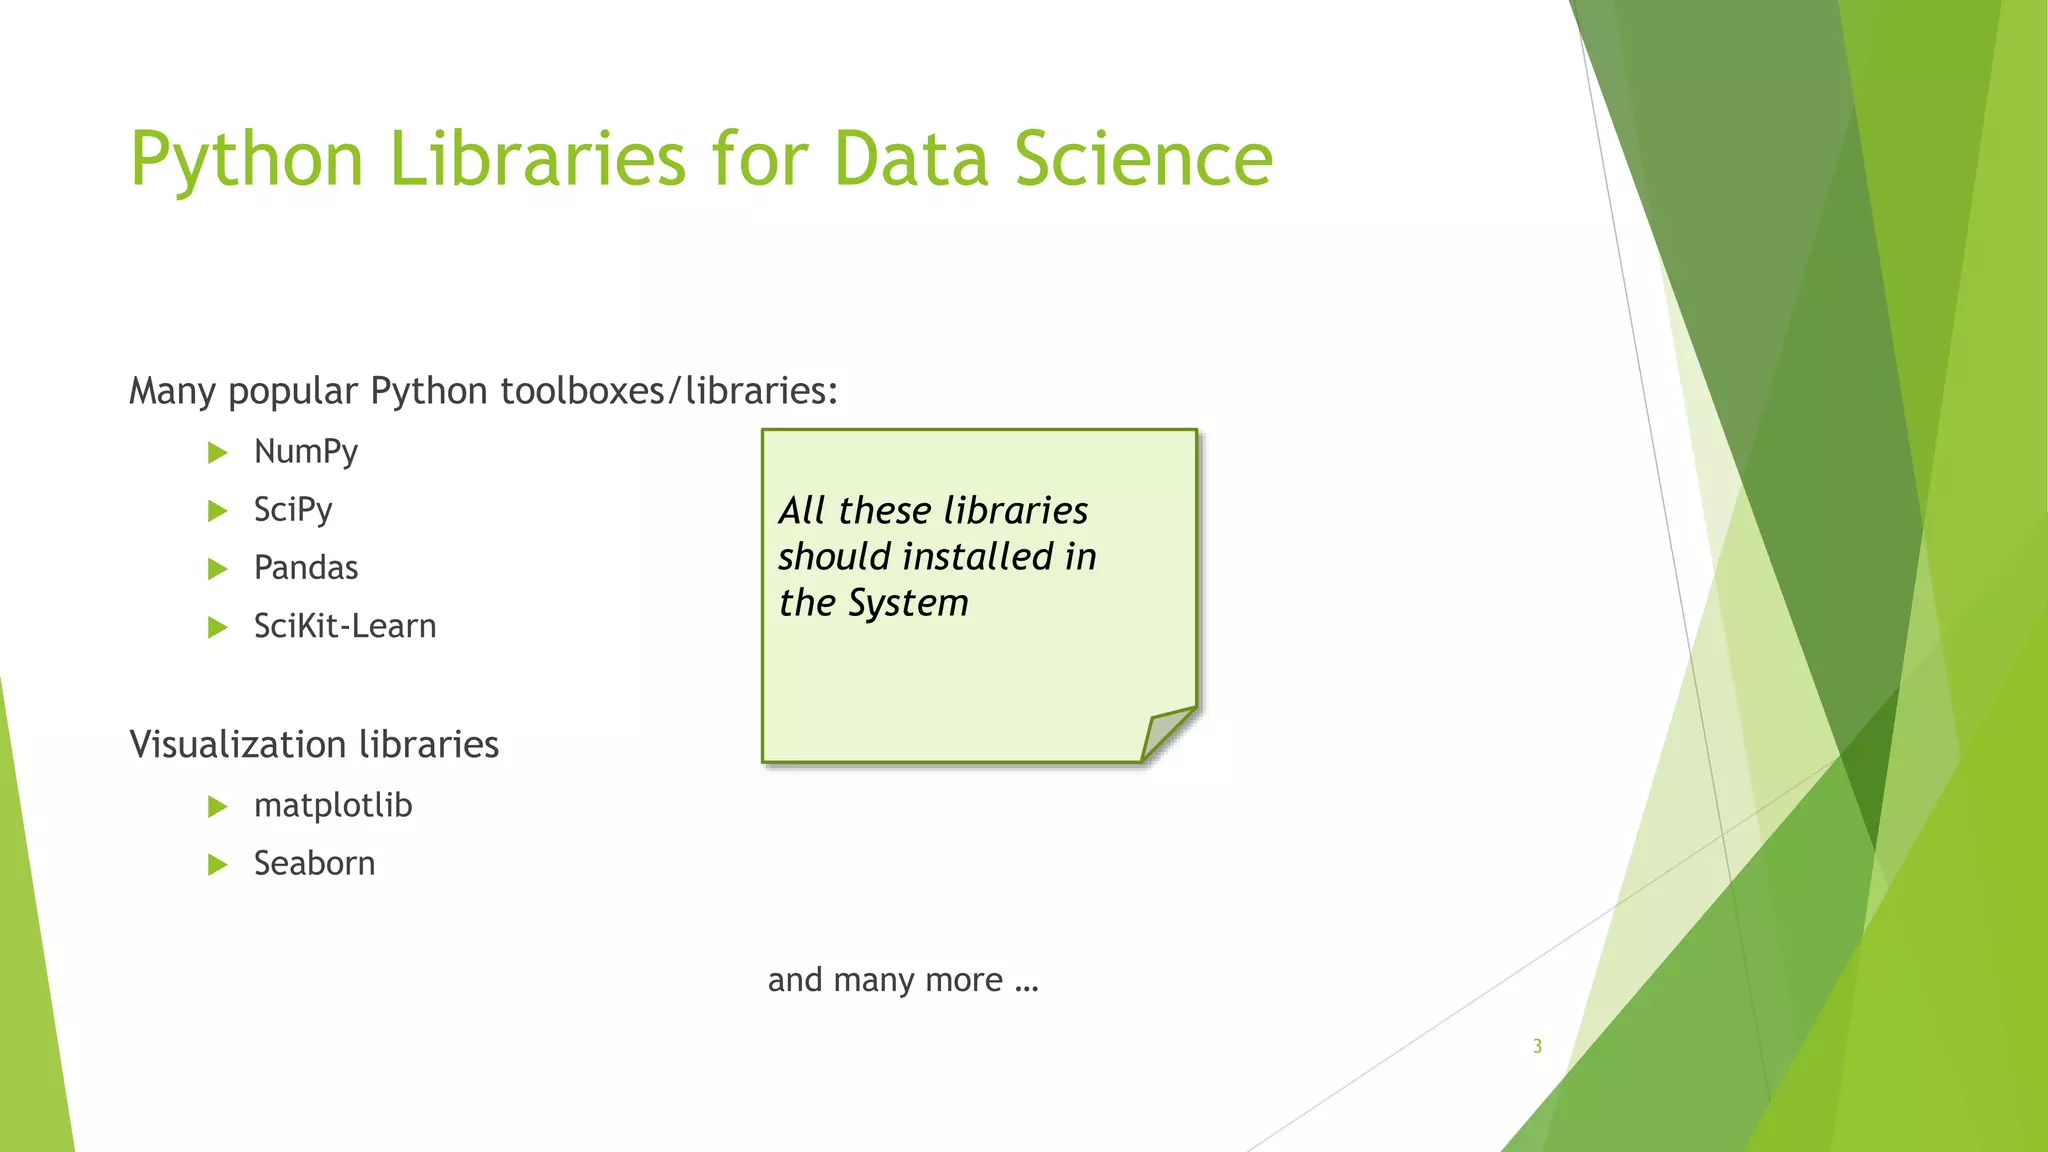
The presentation covers data science using Python, focusing on key libraries including NumPy, SciPy, Pandas, Scikit-learn, Matplotlib, and Seaborn for data manipulation, analysis, and visualization. It provides practical commands and examples for working with data through Jupyter notebooks, and explains various functions and methods for data handling in Pandas. Additionally, it addresses statistical analysis techniques and operations on datasets.

![Selecting Python Version on the SCC # view available python versions on the SCC [scc1 ~] module avail python # load python 3 version [scc1 ~] module load python/3.6.2 10](https://image.slidesharecdn.com/myppt-210131084201/75/PPT-on-Data-Science-Using-Python-10-2048.jpg)
![Download Csv or Xlsx file from given link # On the Shared Computing Cluster [scc1 ~] cp /project/scv/examples/python/data_analysis/dataScience.ipynb . # On a local computer save the link: http://rcs.bu.edu/examples/python/data_analysis/dataScience.i pynb 11](https://image.slidesharecdn.com/myppt-210131084201/75/PPT-on-Data-Science-Using-Python-11-2048.jpg)
![Start Jupyter nootebook # On the Shared Computing Cluster [scc1 ~] jupyter notebook 12](https://image.slidesharecdn.com/myppt-210131084201/75/PPT-on-Data-Science-Using-Python-12-2048.jpg)
![In [ ]: Loading Python Libraries 13 #Import Python Libraries import numpy as np import scipy as sp import pandas as pd import matplotlib as mpl import seaborn as sns Press Shift+Enter to execute the jupyter cell](https://image.slidesharecdn.com/myppt-210131084201/75/PPT-on-Data-Science-Using-Python-13-2048.jpg)
![In [ ]: Reading data using pandas 14 #Read csv file df = pd.read_csv("http://rcs.bu.edu/examples/python/data_analysis/Salaries.csv") There is a number of pandas commands to read other data formats: pd.read_excel('myfile.xlsx',sheet_name='Sheet1', index_col=None, na_values=['NA']) pd.read_stata('myfile.dta') pd.read_sas('myfile.sas7bdat') pd.read_hdf('myfile.h5','df') Note: The above command has many optional arguments to fine-tune the data import process.](https://image.slidesharecdn.com/myppt-210131084201/75/PPT-on-Data-Science-Using-Python-14-2048.jpg)
![In [3]: Exploring data frames 15 #List first 5 records df.head() Out[3]:](https://image.slidesharecdn.com/myppt-210131084201/75/PPT-on-Data-Science-Using-Python-15-2048.jpg)
![Data Frame data types Pandas Type Native Python Type Description object string The most general dtype. Will be assigned to your column if column has mixed types (numbers and strings). int64 int Numeric characters. 64 refers to the memory allocated to hold this character. float64 float Numeric characters with decimals. If a column contains numbers and NaNs(see below), pandas will default to float64, in case your missing value has a decimal. datetime64, timedelta[ns] N/A (but see the datetime module in Python’s standard library) Values meant to hold time data. Look into these for time series experiments. 16](https://image.slidesharecdn.com/myppt-210131084201/75/PPT-on-Data-Science-Using-Python-16-2048.jpg)
![In [4]: Data Frame data types 17 #Check a particular column type df['salary'].dtype Out[4]: dtype('int64') In [5]:#Check types for all the columns df.dtypes Out[4]:rank discipline phd service sex salary dtype: object object object int64 int64 object int64](https://image.slidesharecdn.com/myppt-210131084201/75/PPT-on-Data-Science-Using-Python-17-2048.jpg)
![Data Frames methods 19 df.method() description head( [n] ), tail( [n] ) first/last n rows describe() generate descriptive statistics (for numeric columns only) max(), min() return max/min values for all numeric columns mean(), median() return mean/median values for all numeric columns std() standard deviation sample([n]) returns a random sample of the data frame dropna() drop all the records with missing values Unlike attributes, python methods have parenthesis. All attributes and methods can be listed with a dir() function: dir(df)](https://image.slidesharecdn.com/myppt-210131084201/75/PPT-on-Data-Science-Using-Python-19-2048.jpg)
![Selecting a column in a Data Frame Method 1: Subset the data frame using column name: df['sex'] Method 2: Use the column name as an attribute: df.sex Note: there is an attribute rank for pandas data frames, so to select a column with a name "rank" we should use method 1. 20](https://image.slidesharecdn.com/myppt-210131084201/75/PPT-on-Data-Science-Using-Python-20-2048.jpg)
![Data Frames groupby method 21 Using "group by" method we can: • Split the data into groups based on some criteria • Calculate statistics (or apply a function) to each group • Similar to dplyr() function in R In [ ]:#Group data using rank df_rank = df.groupby(['rank']) In [ ]:#Calculate mean value for each numeric column per each group df_rank.mean()](https://image.slidesharecdn.com/myppt-210131084201/75/PPT-on-Data-Science-Using-Python-21-2048.jpg)
![Data Frames groupby method 22 Once groupby object is create we can calculate various statistics for each group: In [ ]: #Calculate mean salary for each professor rank: df.groupby('rank')[['salary']].mean() Note: If single brackets are used to specify the column (e.g. salary), then the output is Pandas Series object. When double brackets are used the output is a Data Frame](https://image.slidesharecdn.com/myppt-210131084201/75/PPT-on-Data-Science-Using-Python-22-2048.jpg)
![Data Frames groupby method 23 groupby performance notes: - no grouping/splitting occurs until it's needed. Creating the groupby object only verifies that you have passed a valid mapping - by default the group keys are sorted during the groupby operation. You may want to pass sort=False for potential speedup: In [ ]:#Calculate mean salary for each professor rank: df.groupby(['rank'], sort=False)[['salary']].mean()](https://image.slidesharecdn.com/myppt-210131084201/75/PPT-on-Data-Science-Using-Python-23-2048.jpg)
![Data Frame: filtering 24 To subset the data we can apply Boolean indexing. This indexing is commonly known as a filter. For example if we want to subset the rows in which the salary value is greater than $120K: In [ ]:#Calculate mean salary for each professor rank: df_sub = df[ df['salary'] > 120000 ] In [ ]:#Select only those rows that contain female professors: df_f = df[ df['sex'] == 'Female' ] Any Boolean operator can be used to subset the data: > greater; >= greater or equal; < less; <= less or equal; == equal; != not equal;](https://image.slidesharecdn.com/myppt-210131084201/75/PPT-on-Data-Science-Using-Python-24-2048.jpg)
![Data Frames: Slicing 26 When selecting one column, it is possible to use single set of brackets, but the resulting object will be a Series (not a DataFrame): In [ ]:#Select column salary: df['salary'] When we need to select more than one column and/or make the output to be a DataFrame, we should use double brackets: In [ ]:#Select column salary: df[['rank','salary']]](https://image.slidesharecdn.com/myppt-210131084201/75/PPT-on-Data-Science-Using-Python-26-2048.jpg)
![Data Frames: Selecting rows 27 If we need to select a range of rows, we can specify the range using ":" In [ ]:#Select rows by their position: df[10:20] Notice that the first row has a position 0, and the last value in the range is omitted: So for 0:10 range the first 10 rows are returned with the positions starting with 0 and ending with 9](https://image.slidesharecdn.com/myppt-210131084201/75/PPT-on-Data-Science-Using-Python-27-2048.jpg)
![Data Frames: method loc 28 If we need to select a range of rows, using their labels we can use method loc: In [ ]:#Select rows by their labels: df_sub.loc[10:20,['rank','sex','salary']] Out[ ]:](https://image.slidesharecdn.com/myppt-210131084201/75/PPT-on-Data-Science-Using-Python-28-2048.jpg)
![Data Frames: method iloc 29 If we need to select a range of rows and/or columns, using their positions we can use method iloc: In [ ]:#Select rows by their labels: df_sub.iloc[10:20,[0, 3, 4, 5]] Out[ ]:](https://image.slidesharecdn.com/myppt-210131084201/75/PPT-on-Data-Science-Using-Python-29-2048.jpg)
![Data Frames: method iloc (summary) 30 df.iloc[0] # First row of a data frame df.iloc[i] #(i+1)th row df.iloc[-1] # Last row df.iloc[:, 0] # First column df.iloc[:, -1] # Last column df.iloc[0:7] #First 7 rows df.iloc[:, 0:2] #First 2 columns df.iloc[1:3, 0:2] #Second through third rows and first 2 columns df.iloc[[0,5], [1,3]] #1st and 6th rows and 2nd and 4th columns](https://image.slidesharecdn.com/myppt-210131084201/75/PPT-on-Data-Science-Using-Python-30-2048.jpg)
![Data Frames: Sorting 31 We can sort the data by a value in the column. By default the sorting will occur in ascending order and a new data frame is return. In [ ]:# Create a new data frame from the original sorted by the column Salary df_sorted = df.sort_values( by ='service') df_sorted.head() Out[ ]:](https://image.slidesharecdn.com/myppt-210131084201/75/PPT-on-Data-Science-Using-Python-31-2048.jpg)
![Data Frames: Sorting 32 We can sort the data using 2 or more columns: In [ ]:df_sorted = df.sort_values( by =['service', 'salary'], ascending = [True, False]) df_sorted.head(10) Out[ ]:](https://image.slidesharecdn.com/myppt-210131084201/75/PPT-on-Data-Science-Using-Python-32-2048.jpg)
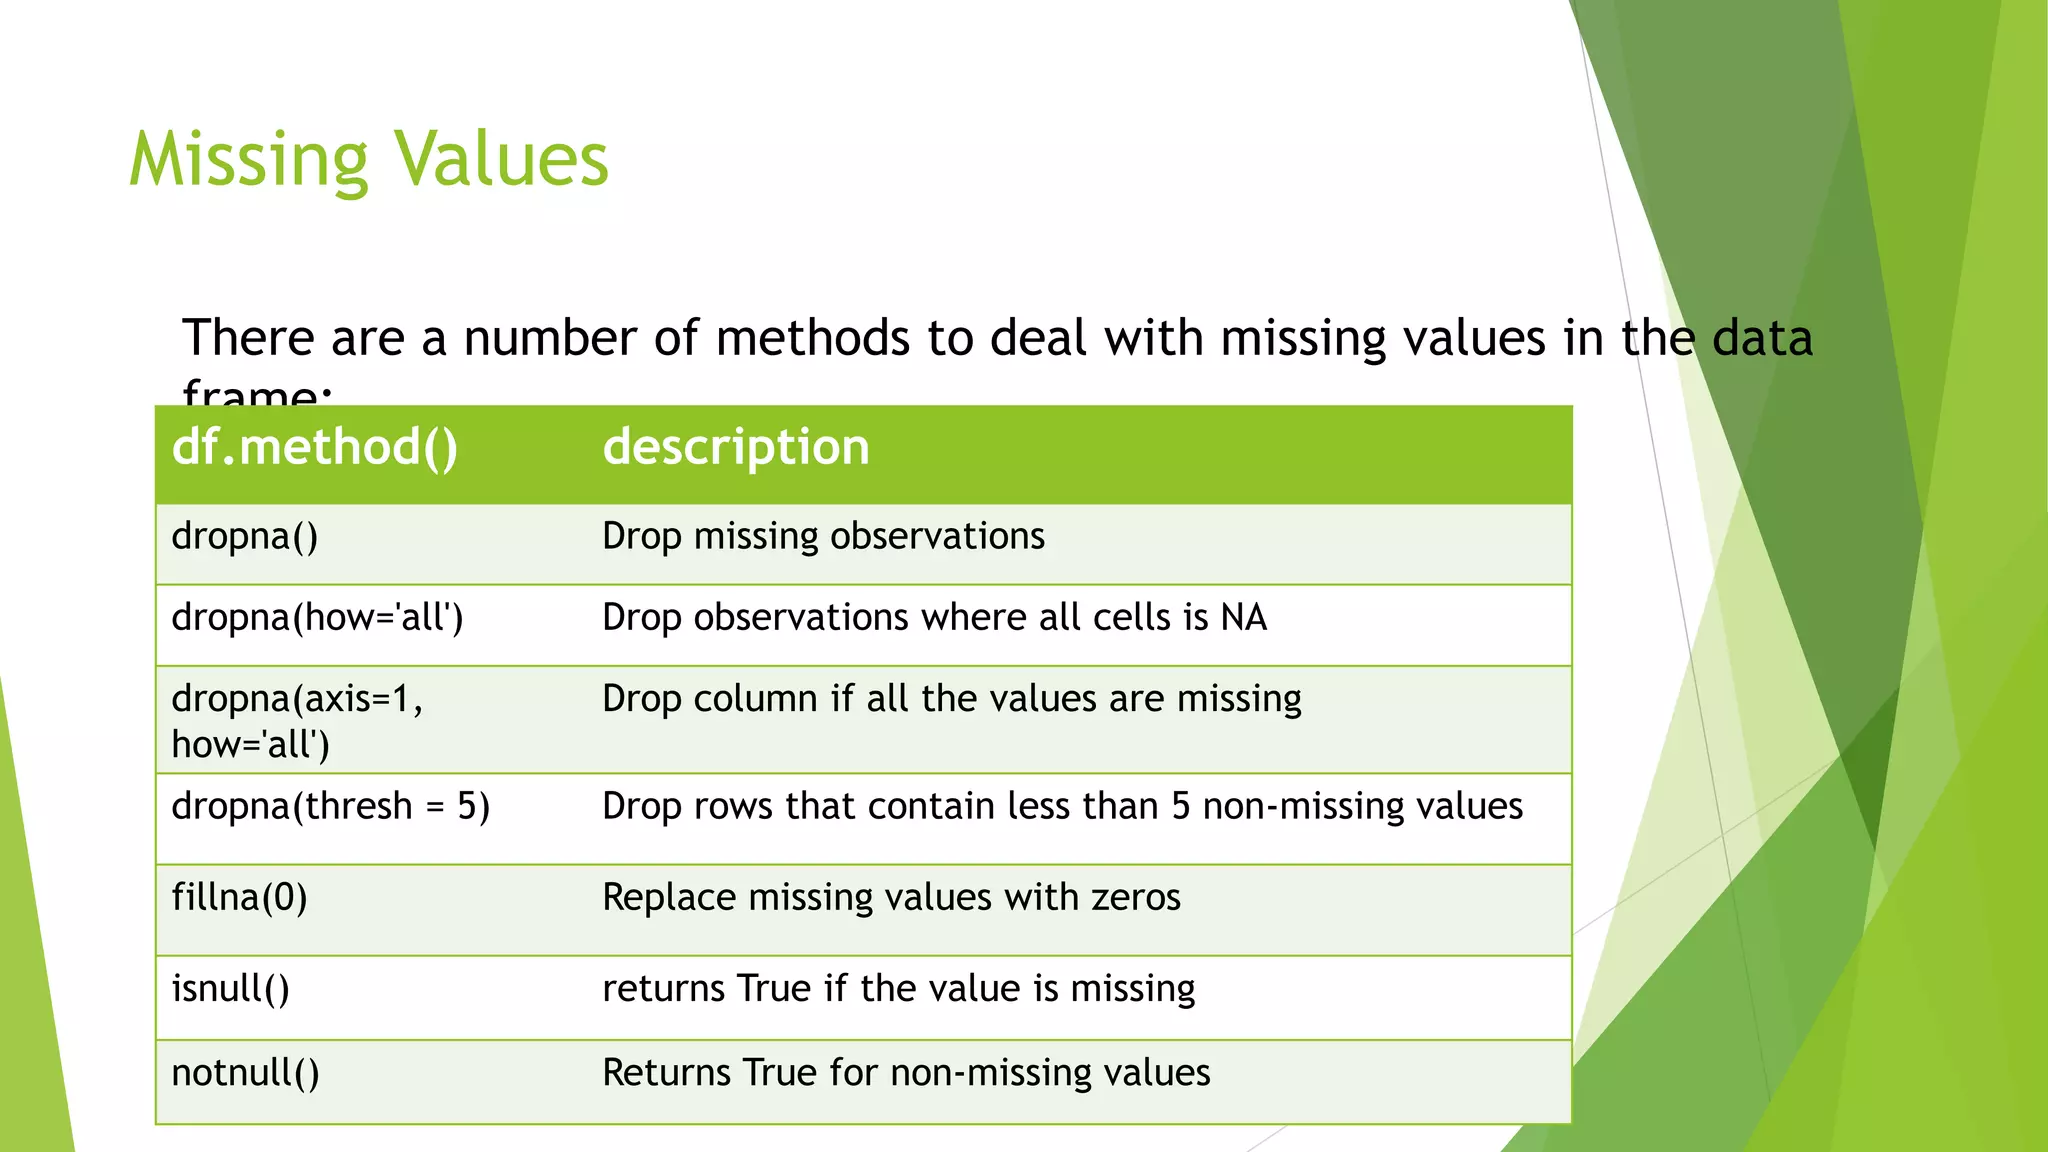
![Missing Values 33 Missing values are marked as NaN In [ ]:# Read a dataset with missing values flights = pd.read_csv("http://rcs.bu.edu/examples/python/data_analysis/flights.csv") In [ ]:# Select the rows that have at least one missing value flights[flights.isnull().any(axis=1)].head() Out[ ]:](https://image.slidesharecdn.com/myppt-210131084201/75/PPT-on-Data-Science-Using-Python-33-2048.jpg)
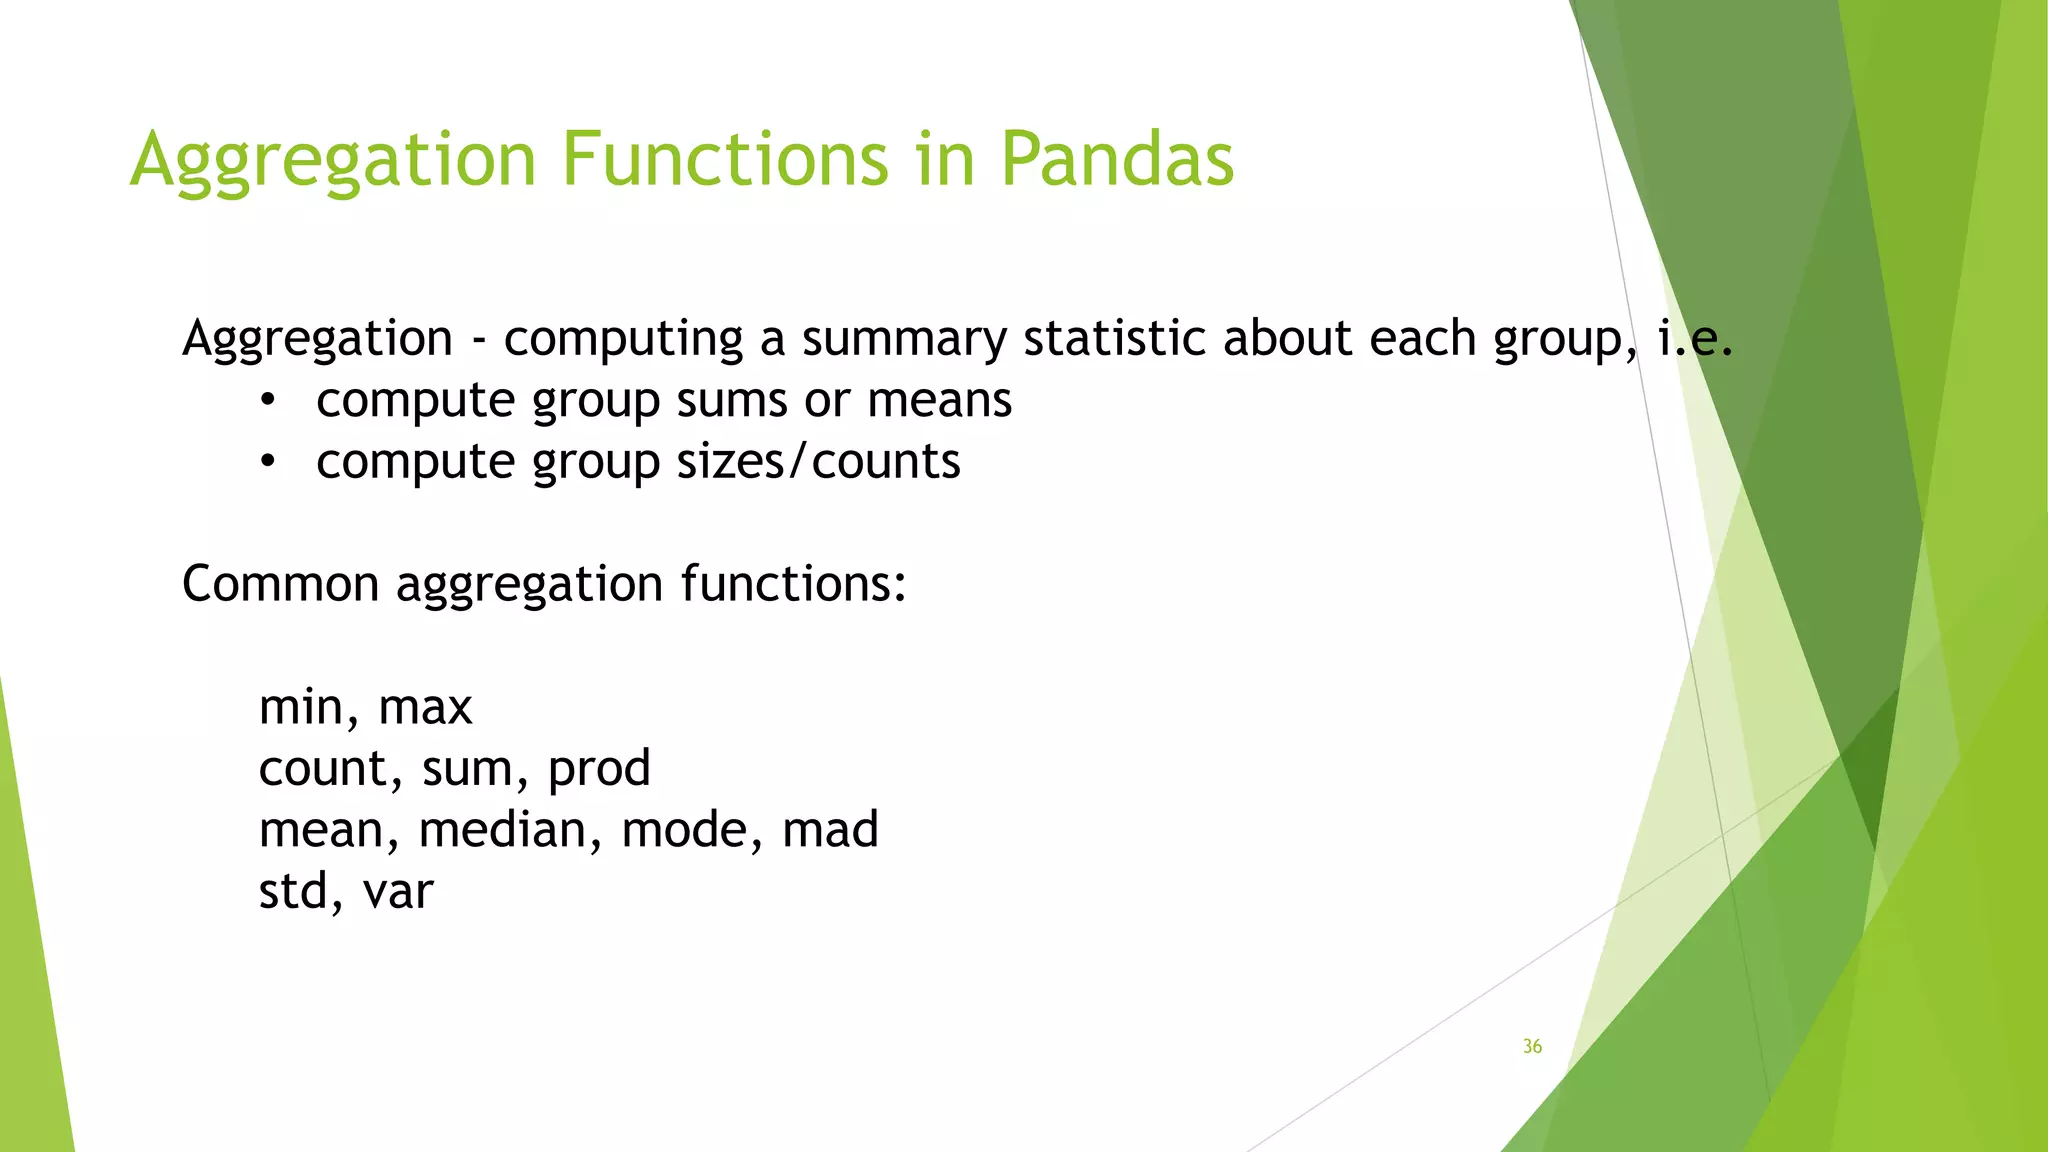
![Aggregation Functions in Pandas 37 agg() method are useful when multiple statistics are computed per column: In [ ]:flights[['dep_delay','arr_delay']].agg(['min','mean','max']) Out[ ]:](https://image.slidesharecdn.com/myppt-210131084201/75/PPT-on-Data-Science-Using-Python-37-2048.jpg)
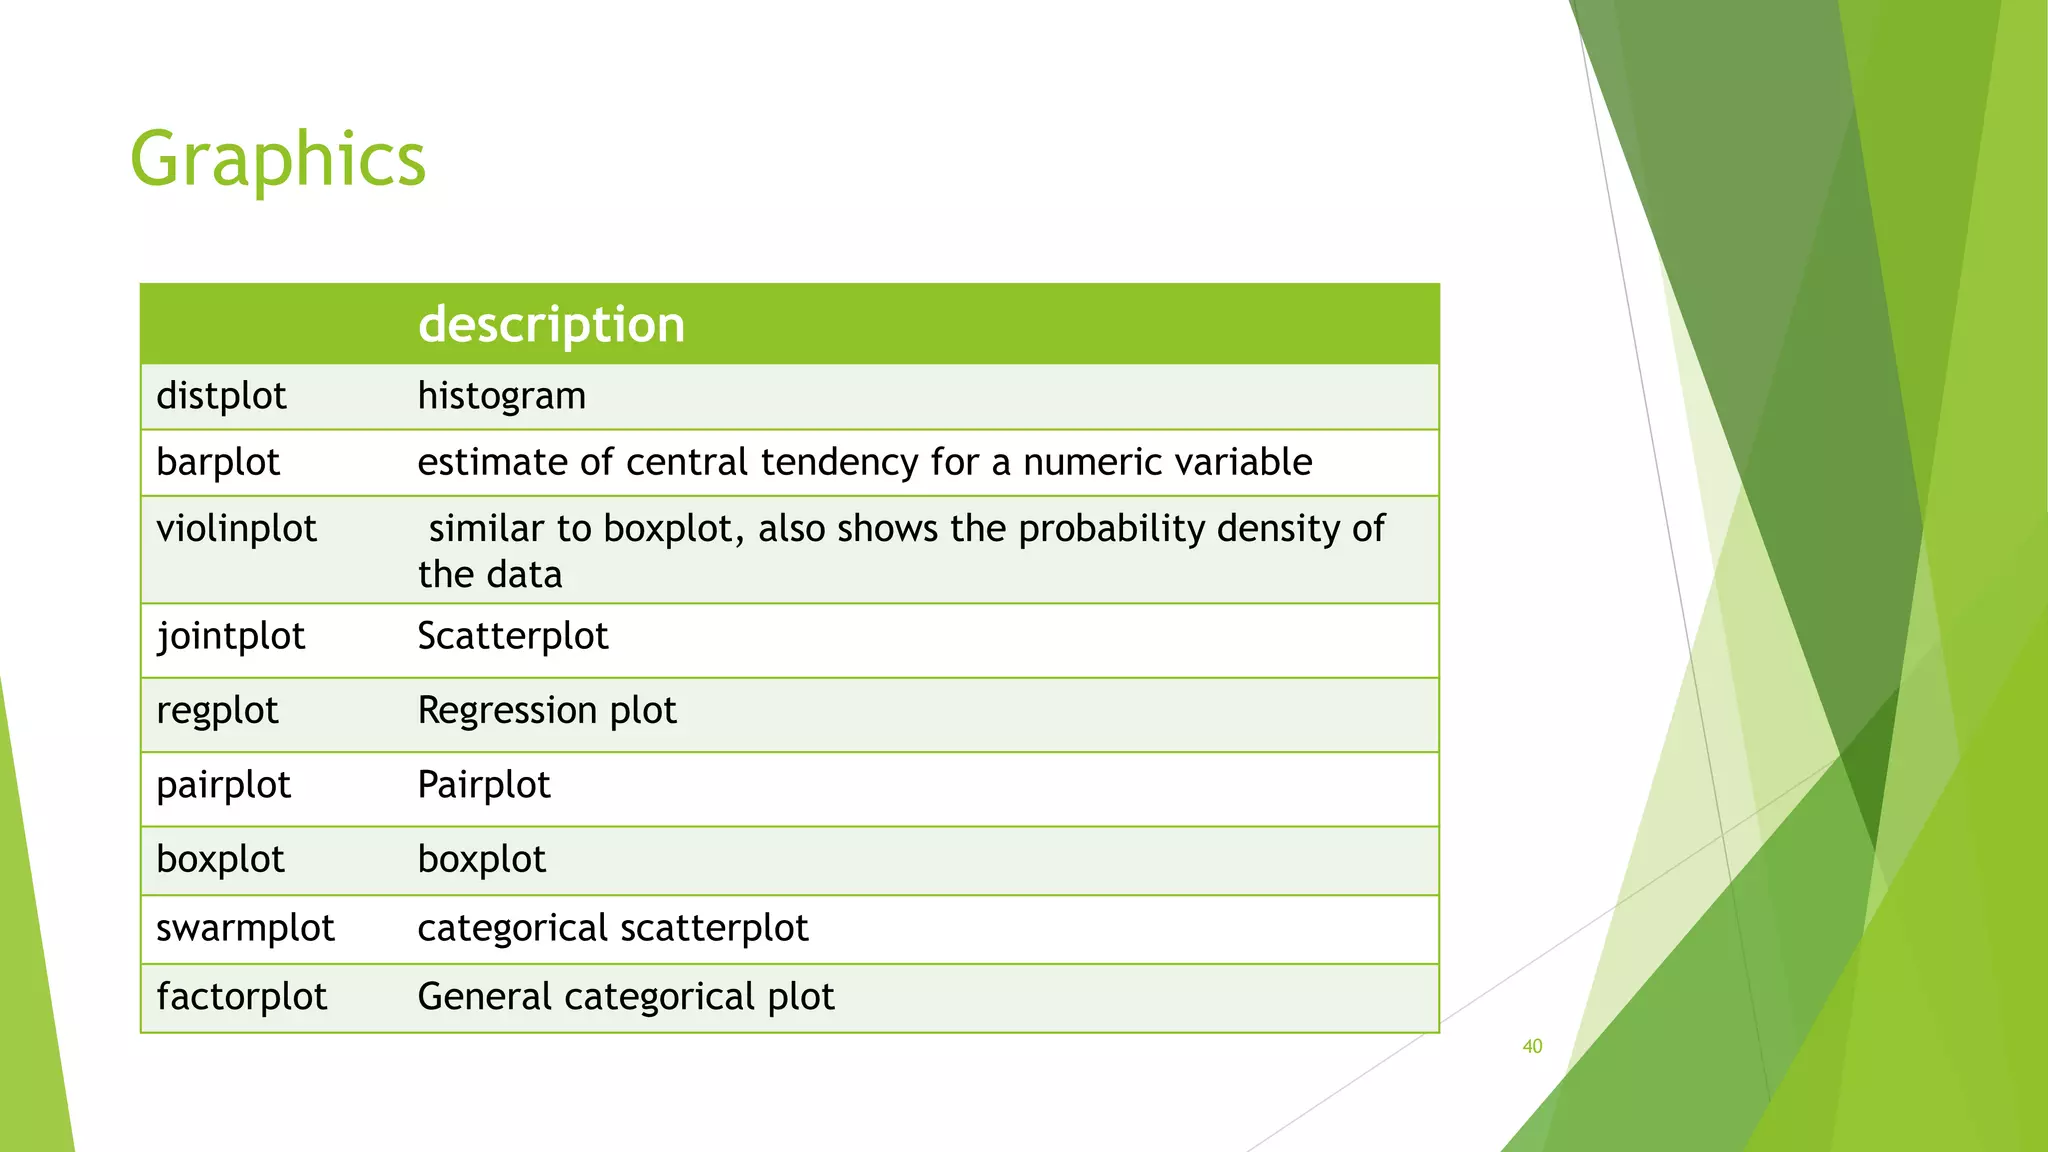
![Graphics to explore the data 39 To show graphs within Python notebook include inline directive: In [ ]:%matplotlib inline Seaborn package is built on matplotlib but provides high level interface for drawing attractive statistical graphics, similar to ggplot2 library in R. It specifically targets statistical data visualization](https://image.slidesharecdn.com/myppt-210131084201/75/PPT-on-Data-Science-Using-Python-39-2048.jpg)