This research paper presents a genetic algorithm to optimize a mathematical model for dengue disease control, incorporating three strategies: vaccination, mosquito repellent use, and introducing Wolbachia bacteria into mosquito populations. The model indicates that the strategies can effectively reduce the infected human population by 45.2%, with simulations conducted in Yogyakarta and Semarang, Indonesia, showcasing similar trends in infection rates. The study employs a genetic algorithm for parameter estimation and applies Pontryagin's minimum principle for optimal control strategy design.
![International Journal of Electrical and Computer Engineering (IJECE) Vol. 13, No. 4, August 2023, pp. 4535~4546 ISSN: 2088-8708, DOI: 10.11591/ijece.v13i4.pp4535-4546 4535 Journal homepage: http://ijece.iaescore.com Genetic algorithm to optimization mobility-based dengue mathematical model Tegar Arifin Prasetyo1 , Roberd Saragih2 , Dewi Handayani2 1 Department of Information Technology, Faculty of Vocational Studies, Institut Teknologi Del, Sitoluama, Indonesia 2 Department of Mathematics, Faculty of Mathematics and Natural Sciences, Institut Teknologi Bandung, Bandung, Indonesia Article Info ABSTRACT Article history: Received Nov 15, 2022 Revised Dec 15, 2022 Accepted Dec 17, 2022 Implementation of vaccines, mosquito repellents and several Wolbachia schemes have been proposed recently as strategies against dengue. Research showed that the use of vaccine and repellent is highly effective when implemented to individuals who are in area with high transmission rates, while the use of Wolbachia bacteria is strongly effective when implemented in area with low transmission rates. This research is to show a three-strategy combination to cope with the dengue using mathematical model. In dengue mathematical model construction, several parameters are not yet known, therefore a genetic algorithm method was used to estimate dengue model parameters. Numerical simulation results showed that the combination of three strategies were able to reduce the number of infected humans. The dynamic of the human population with the combination of three strategies on average was able to reduce the infected human population by 45.2% in immobility aspect. Furthermore, the mobility aspect in dengue model was presented by reviewing two areas; Yogyakarta and Semarang in Indonesia. The numerical solutions showed that the trend graph was almost similar between the two areas. With the maximum effort given, the combination control values decreased slowly until the 100th day. Keywords: Genetic algorithm Mobility-based dengue Numerical analysis Optimal control Parameter estimation This is an open access article under the CC BY-SA license. Corresponding Author: Tegar Arifin Prasetyo Department of Information Technology, Faculty of Vocational Studies, Institut Teknologi Del Sisingamangaraja Street, Sitoluama, Laguboti 22381, Indonesia Email: tegar.prasetyo@del.ac.id 1. INTRODUCTION Dengue is an infectious disease caused by dengue virus and becomes one health issue predominantly found in tropical and sub-tropical area. This disease is a mosquito-borne infection from dengue-infected female Aedes aegypti. The dengue virus consists of 4 serotypes called DEN-1, DEN-2, DEN-3 and DEN-4 [1]–[3]. These serotypes can cause yearly epidemic in the tropical and sub-tropical area. Since 1943 when the dengue-virus serotypes were first isolated in Japan, the number of dengue transmissions is raising in all of the tropical countries [4]. Indonesia as one of the tropical countries in the world, is now classified as endemic country with category-A for dengue-virus infections in Southeast Asia. One of the most effective ways to cope with the mosquito bites is through personal protection, including the use of diethyltoluamide (DEET)-based mosquito repellent. DEET-based mosquito repellents can cause the central nervous system of the mosquito. Within 1 meter, DEET ingredient is effective to deter mosquito up to 60% [5]. Moreover, researchers have investigated some medication to treat dengue infections but the result was not optimum [6]. One most common treatment conducted in the past research was to use living vector to create vaccine. Vaccine use can reduce the dengue case up to 80% in one area identified as high transmission rate [7].](https://image.slidesharecdn.com/v9030847emf-230621071431-19367605/75/Genetic-algorithm-to-optimization-mobility-based-dengue-mathematical-model-1-2048.jpg)
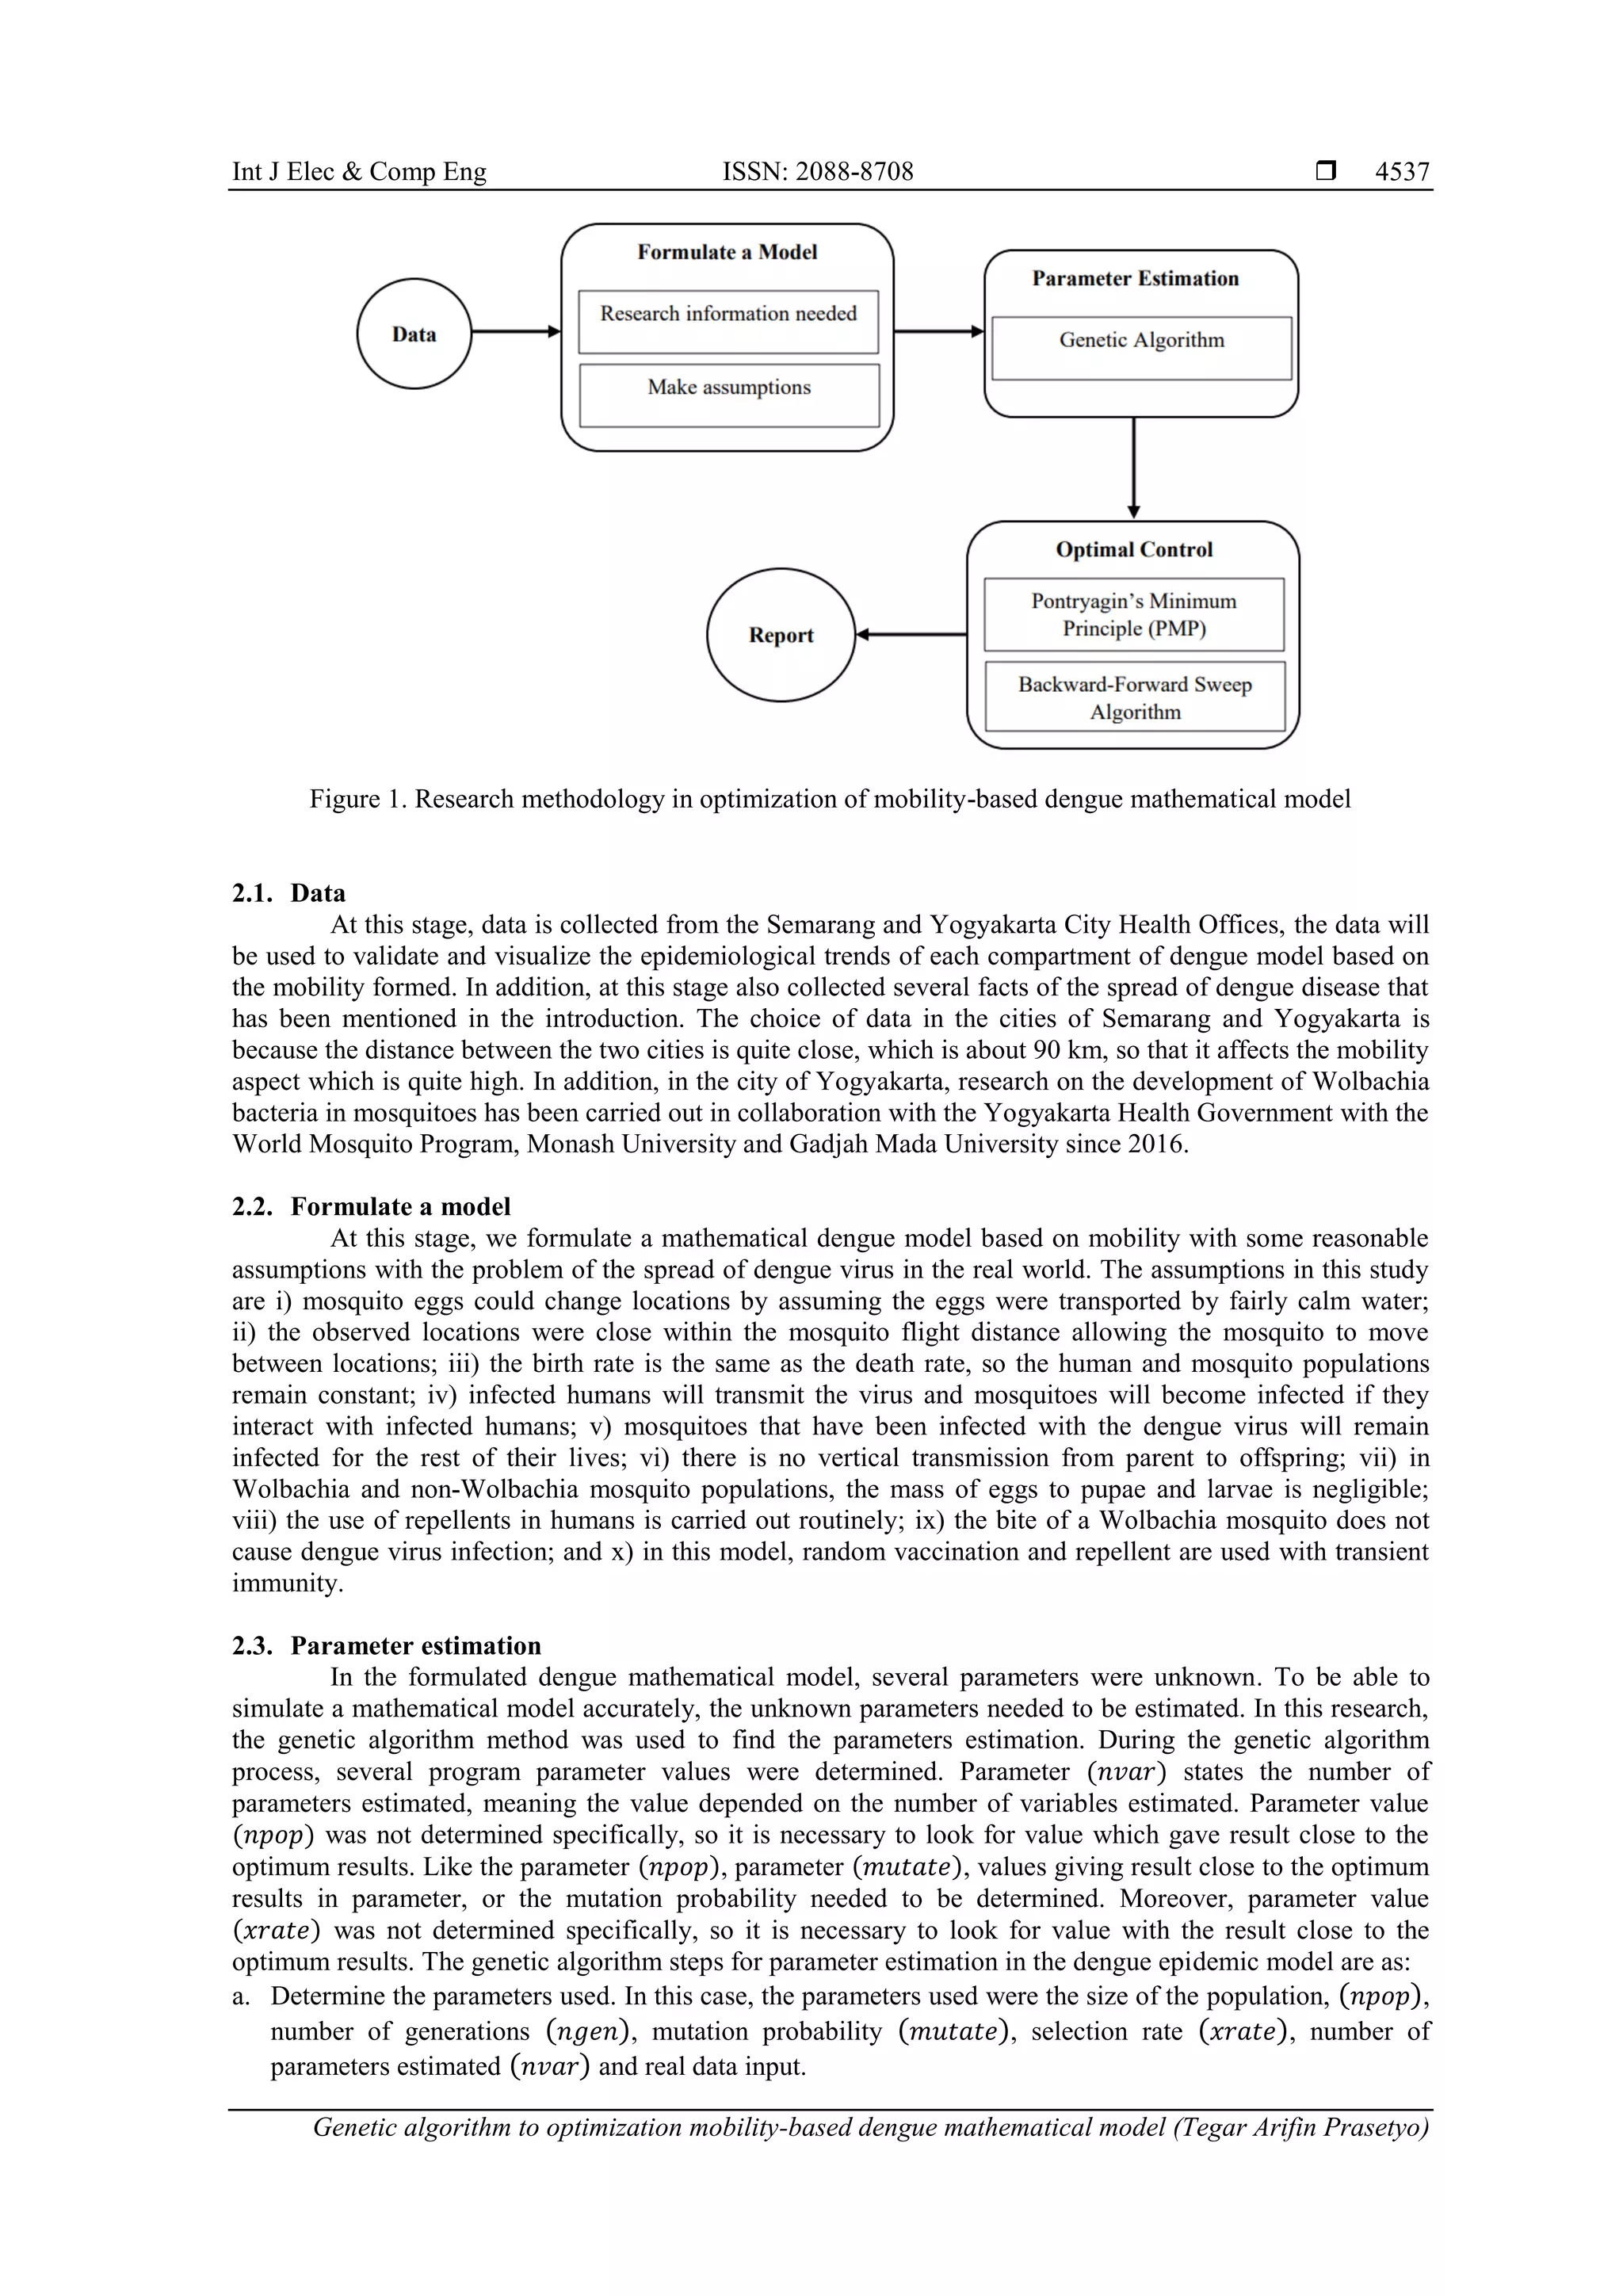
![ ISSN: 2088-8708 Int J Elec & Comp Eng, Vol. 13, No. 4, August 2023: 4535-4546 4536 In recent years, there have been several studies conducted for vector control by genetic modification. In addition, several methods of biological control to replace wild mosquitoes by releasing genetically modified mosquitoes have also been tried by several researchers. The methods of biological control are sterilization of male mosquitoes [8] and genetic modification to reduce reproduction and increase the life-shortening Wolbachia bacteria [9]. The use of intracellular Wolbachia symbionts has attracted much attention. This indicates that Wolbachia can inhibit dengue virus replication in mosquitoes. One prominent strategy proposed over the some last years to reduce the dengue transmission is by infecting mosquito population using the Wolbachia bacteria [10]–[12]. Wolbachia is generally transmitted maternally, i.e., only females infected with Wolbachia can pass it on to their offspring. Wolbachia intervention has been proved to reduce the chance of being infected in the areas with low and medium rate of transmission [13]. Moreover, Wolbachia intervention can slow down the dengue-virus developed inside Aedes aegypti [14]. If the male Wolbachia-carrying Aedes aegypti mates the female non Wolbachia-carrying Aedes aegypti, the dengue virus in the egg is terminated. On the other hand, if the female Wolbachia-carrying Aedes aegypti mates the male non-Wolbachia-carrying Aedes aegypti, all the eggs will be Wolbachia-infected. This results in the Wolbachia mosquito population. Wolbachia-carrying mosquito bites will not cause dengue virus infections. The Wolbachia bacteria being used in areas with low and medium rate of transmission can reduce the dengue transmission up to 86% [15]. In Indonesia, specifically in Yogyakarta, Wolbachia mosquitoes have begun to be developed which are members of the Eliminate Dengue Project-Yogyakarta program which is collaborative research between the Faculty of Medicine Gadjah Mada University (UGM) and Monash University, Australia. This study focused on producing Aedes aegypti mosquitoes with Wolbachia through the cross-breeding method to be spread in the Yogyakarta area [16]. Several modeling efforts focusing on dengue control strategies have been carried out in recent years. The application of mathematical models in disease epidemiology studies has a considerable impact on public health in general. Mathematical models are tools that can understand and interpret complex case studies so that they can be translated easily. It can be used to understand population dynamics [17], virus transmission dynamics [18] and others [19]. For the spread of dengue virus, mathematical models involving mosquitoes and human populations have been studied [20]. Similarly, many researchers have previously dengue model mathematical compartment deterministic to recognize the dynamic pattern of the dengue spread in several areas [21], [22]. The study of mathematical models of dengue fever cases has been carried out using the suspected, infected, and recovered (SIR) and suspected, exposed, infected, and recovered (SEIR) models. The SIR model studied assumes that individuals who recover from the disease will not become infected again. The facts show that the possibility of recovered patients has a chance to be reinfected. This is the main reason for modifying SIR to SIRS [23]. One model of human population control using repellents has been studied in [24]. Another study in [22] developed a model involving eight mutually exclusive compartments by repellent personal protection, larvicide, and adult control strategies that describe the population dynamics of dengue transmission. Zhou et al. [25] built a dengue model with the assumption of vertical transmission in mosquitoes and concluded that dengue virus can be significantly reduced by controlling the growth of the mosquito population. O'Reilly [15] also studied and used mathematical models to assess Wolbachia's performance in reducing dengue transmission in Indonesia and found an 80% reduction in dengue cases. In addition, the long-term application of Wolbachia provides a higher reduction in the incidence of dengue fever [26]. Although various mathematical models have been studied and developed to obtain strategies to reduce the spread of dengue fever, studies on the use of combination vaccination, repellent and Wolbachia are rarely considered. Therefore, this study will investigate the optimization of controlled design for dengue model with and without the mobility aspects using the combination of vaccination and repellent to human and Wolbachia bacteria injected to non-Wolbachia mosquito eggs. This research will focus on formulating a mathematical dengue model with and without the mobility aspect. The model will then be analyzed to estimate the parameters using genetics algorithm method to formulate a model simulation. The combination effect of all the controlled groups will be compared and concluded based on the numerical results. 2. METHOD The problem with mathematical model epidemiology is that it is difficult to find parameter estimates that fit the data. In this regard, we have successfully applied a genetic algorithm to estimate the unknown parameters in the formed epidemiological mathematical model that affect the optimization results of numerical simulation results. The explanation of the research methodology to be carried in this study shown in Figure 1.](https://image.slidesharecdn.com/v9030847emf-230621071431-19367605/75/Genetic-algorithm-to-optimization-mobility-based-dengue-mathematical-model-2-2048.jpg)
![ ISSN: 2088-8708 Int J Elec & Comp Eng, Vol. 13, No. 4, August 2023: 4535-4546 4538 b. Generate chromosomes randomly [0,1] with the size(𝑛𝑝𝑜𝑝 × 𝑛𝑣𝑎𝑟). c. Count (𝑛𝑝𝑎𝑟𝑒𝑛𝑡 = 𝑛𝑝𝑜𝑝 × 𝑥𝑟𝑎𝑡𝑒), the calculation result to be rounded up. d. Create a rank order of (𝑛𝑝𝑎𝑟𝑒𝑛𝑡). e. Count the cumulative rank: 𝑓 = 𝑛𝑝𝑎𝑟𝑒𝑛𝑡(𝑛𝑝𝑎𝑟𝑒𝑛𝑡+1) 2 . f. Create a cumulative probability matrix of (𝑛𝑝𝑎𝑟𝑒𝑛𝑡) in size which the 𝑘𝑡ℎ element is ∑ 𝑟𝑎𝑛𝑘 𝑥 𝑘 𝑥=1 𝑓 . g. Compute the numerical solution of dengue mathematical model with 𝑜𝑑𝑒45. h. Evaluate the objective function value for each chromosome in the population. The objective function value used is to minimize the average of mean of magnitude relative error (MMRE) is defined 1 𝑛 ∑ (∑ ⌈ 𝑥𝑚𝑖−𝑥𝑚𝑖 𝑜𝑑𝑒45 𝑥𝑚𝑖 ⌉ 𝑘 𝑚=1 ) 𝑛 𝑖=1 with 𝑛 states the number of data and 𝑘 states the number of model compartment. From the number of the compartment model, 𝑥𝑚𝑖 states the number of compartment population to 𝑚 based on real data at a time of 𝑖 and 𝑥𝑚𝑖 𝑜𝑑𝑒45 states the result of 𝑜𝑑𝑒45 compartment calculation to 𝑚 at a time of 𝑖. Equation MMRE is chosen as the formula to determine the objective function to be implemented in the program. i. Rank the population based on the objective function value of each chromosome with MMRE minimum value in the first rank and it continuous on. j. Select the population into a number of (𝑛𝑝𝑎𝑟𝑒𝑛𝑡). k. Select the parent that will do the crossover. l. Cross over between two parents using a linear combination method from both parents. This process will result in two offspring being obtained, then place the offspring from the cross into the chromosome population. m. Perform elitism so that the chromosome with the best objective function value does not undergo mutation. n. Perform mutation to several gens from the chromosome randomly by changing the value of the chosen gen with the random value. o. Create a new population by combining the chromosomes from the elitism process in the step (m) the chromosome from the mutation process in the step (n). p. Choose the chromosome with the minimum objective function value. q. Check the termination criteria to 𝑛𝑔𝑒𝑛. If this is not fulfilled, return to the step (g). If fulfilled, show the results in the step (p). 2.4. Optimal control In this section, we solve the optimal control problem in a dengue model constructed using Pontryagin's minimum principle (PMP) to determine a more optimal control strategy in minimizing infected humans and minimizing the costs. The optimal control problem with PMP can be solved numerically, by designing an algorithm that produces an estimate of the optimal control value. Note that the optimal system consists of a state equation with initial conditions, a co-state equation with a transversality condition, and an optimal control characteristic. This optimal control problem is solved by a backward-forward sweep algorithm as: a. Time interval [0, 𝑡𝑓] divided into ℕ uniform subintervals. Vector form 𝑥 ⃗ = (𝑥1, 𝑥2, … , 𝑥18) and vector 𝜆 ⃗ = (𝜆1, 𝜆2, … , 𝜆18) are a vector approximation for state and co-state. b. Make an initial value for 𝑢 ⃗ 1𝑝, 𝑢 ⃗ 1𝑟, 𝑢 ⃗ 2𝑝, 𝑢 ⃗ 2𝑟, 𝑢 ⃗ 3𝑝, 𝑢 ⃗ 3𝑟 during the time interval, with 𝑢 ⃗ 1𝑝(0) = 0, 𝑢 ⃗ 1𝑟(0) = 0, 𝑢 ⃗ 2𝑝(0) = 0, 𝑢 ⃗ 2𝑟(0) = 0, 𝑢 ⃗ 3𝑝(0) = 0, 𝑢 ⃗ 3𝑟(0) = 0 based on the differential equation of state on the optimal system using the Runge-Kutta 4th method. 𝑢 ⃗ 1𝑝(𝑡), 𝑢 ⃗ 1𝑟, 𝑢 ⃗ 2𝑝, 𝑢 ⃗ 2𝑟, 𝑢 ⃗ 3𝑝, 𝑢 ⃗ 3𝑟 are a control approximation 𝑢 ⃗ 1𝑝, 𝑢 ⃗ 1𝑟, 𝑢 ⃗ 2𝑝, 𝑢 ⃗ 2𝑟, 𝑢 ⃗ 3𝑝, 𝑢 ⃗ 3𝑟 at the time 𝑡. c. With the initial state 𝑥1 = 𝑥(𝑡0) = 𝑥0 and value at 𝑢 ⃗ 1𝑝, 𝑢 ⃗ 1𝑟, 𝑢 ⃗ 2𝑝, 𝑢 ⃗ 2𝑟, 𝑢 ⃗ 3𝑝, 𝑢 ⃗ 3𝑟 doing state solution value (𝑥 ⃗ ) by forward against time t based on the co-state differential equation on the optimal system using the Runge-Kutta method of order 4. d. With the condition of transversality 𝜆ℕ+1 = 𝜆(𝑡𝑓) = 0 and value 𝑢 ⃗ 1𝑝, 𝑢 ⃗ 1𝑟, 𝑢 ⃗ 2𝑝, 𝑢 ⃗ 2𝑟, 𝑢 ⃗ 3𝑝, 𝑢 ⃗ 3𝑟, 𝑥 ⃗ , doing solve 𝜆 ⃗ by backward at the time. e. Update value 𝑢 ⃗ 1𝑝, 𝑢 ⃗ 1𝑟, 𝑢 ⃗ 2𝑝, 𝑢 ⃗ 2𝑟, 𝑢 ⃗ 3𝑝, 𝑢 ⃗ 3𝑟 with value subtitutions 𝑥 ⃗ and 𝜆 ⃗ to the optimal control characteristics. f. Check convergence. If the variable values in the current and previous iterations are close enough, then the current value is the solution. Otherwise, return to step (b).](https://image.slidesharecdn.com/v9030847emf-230621071431-19367605/75/Genetic-algorithm-to-optimization-mobility-based-dengue-mathematical-model-4-2048.jpg)
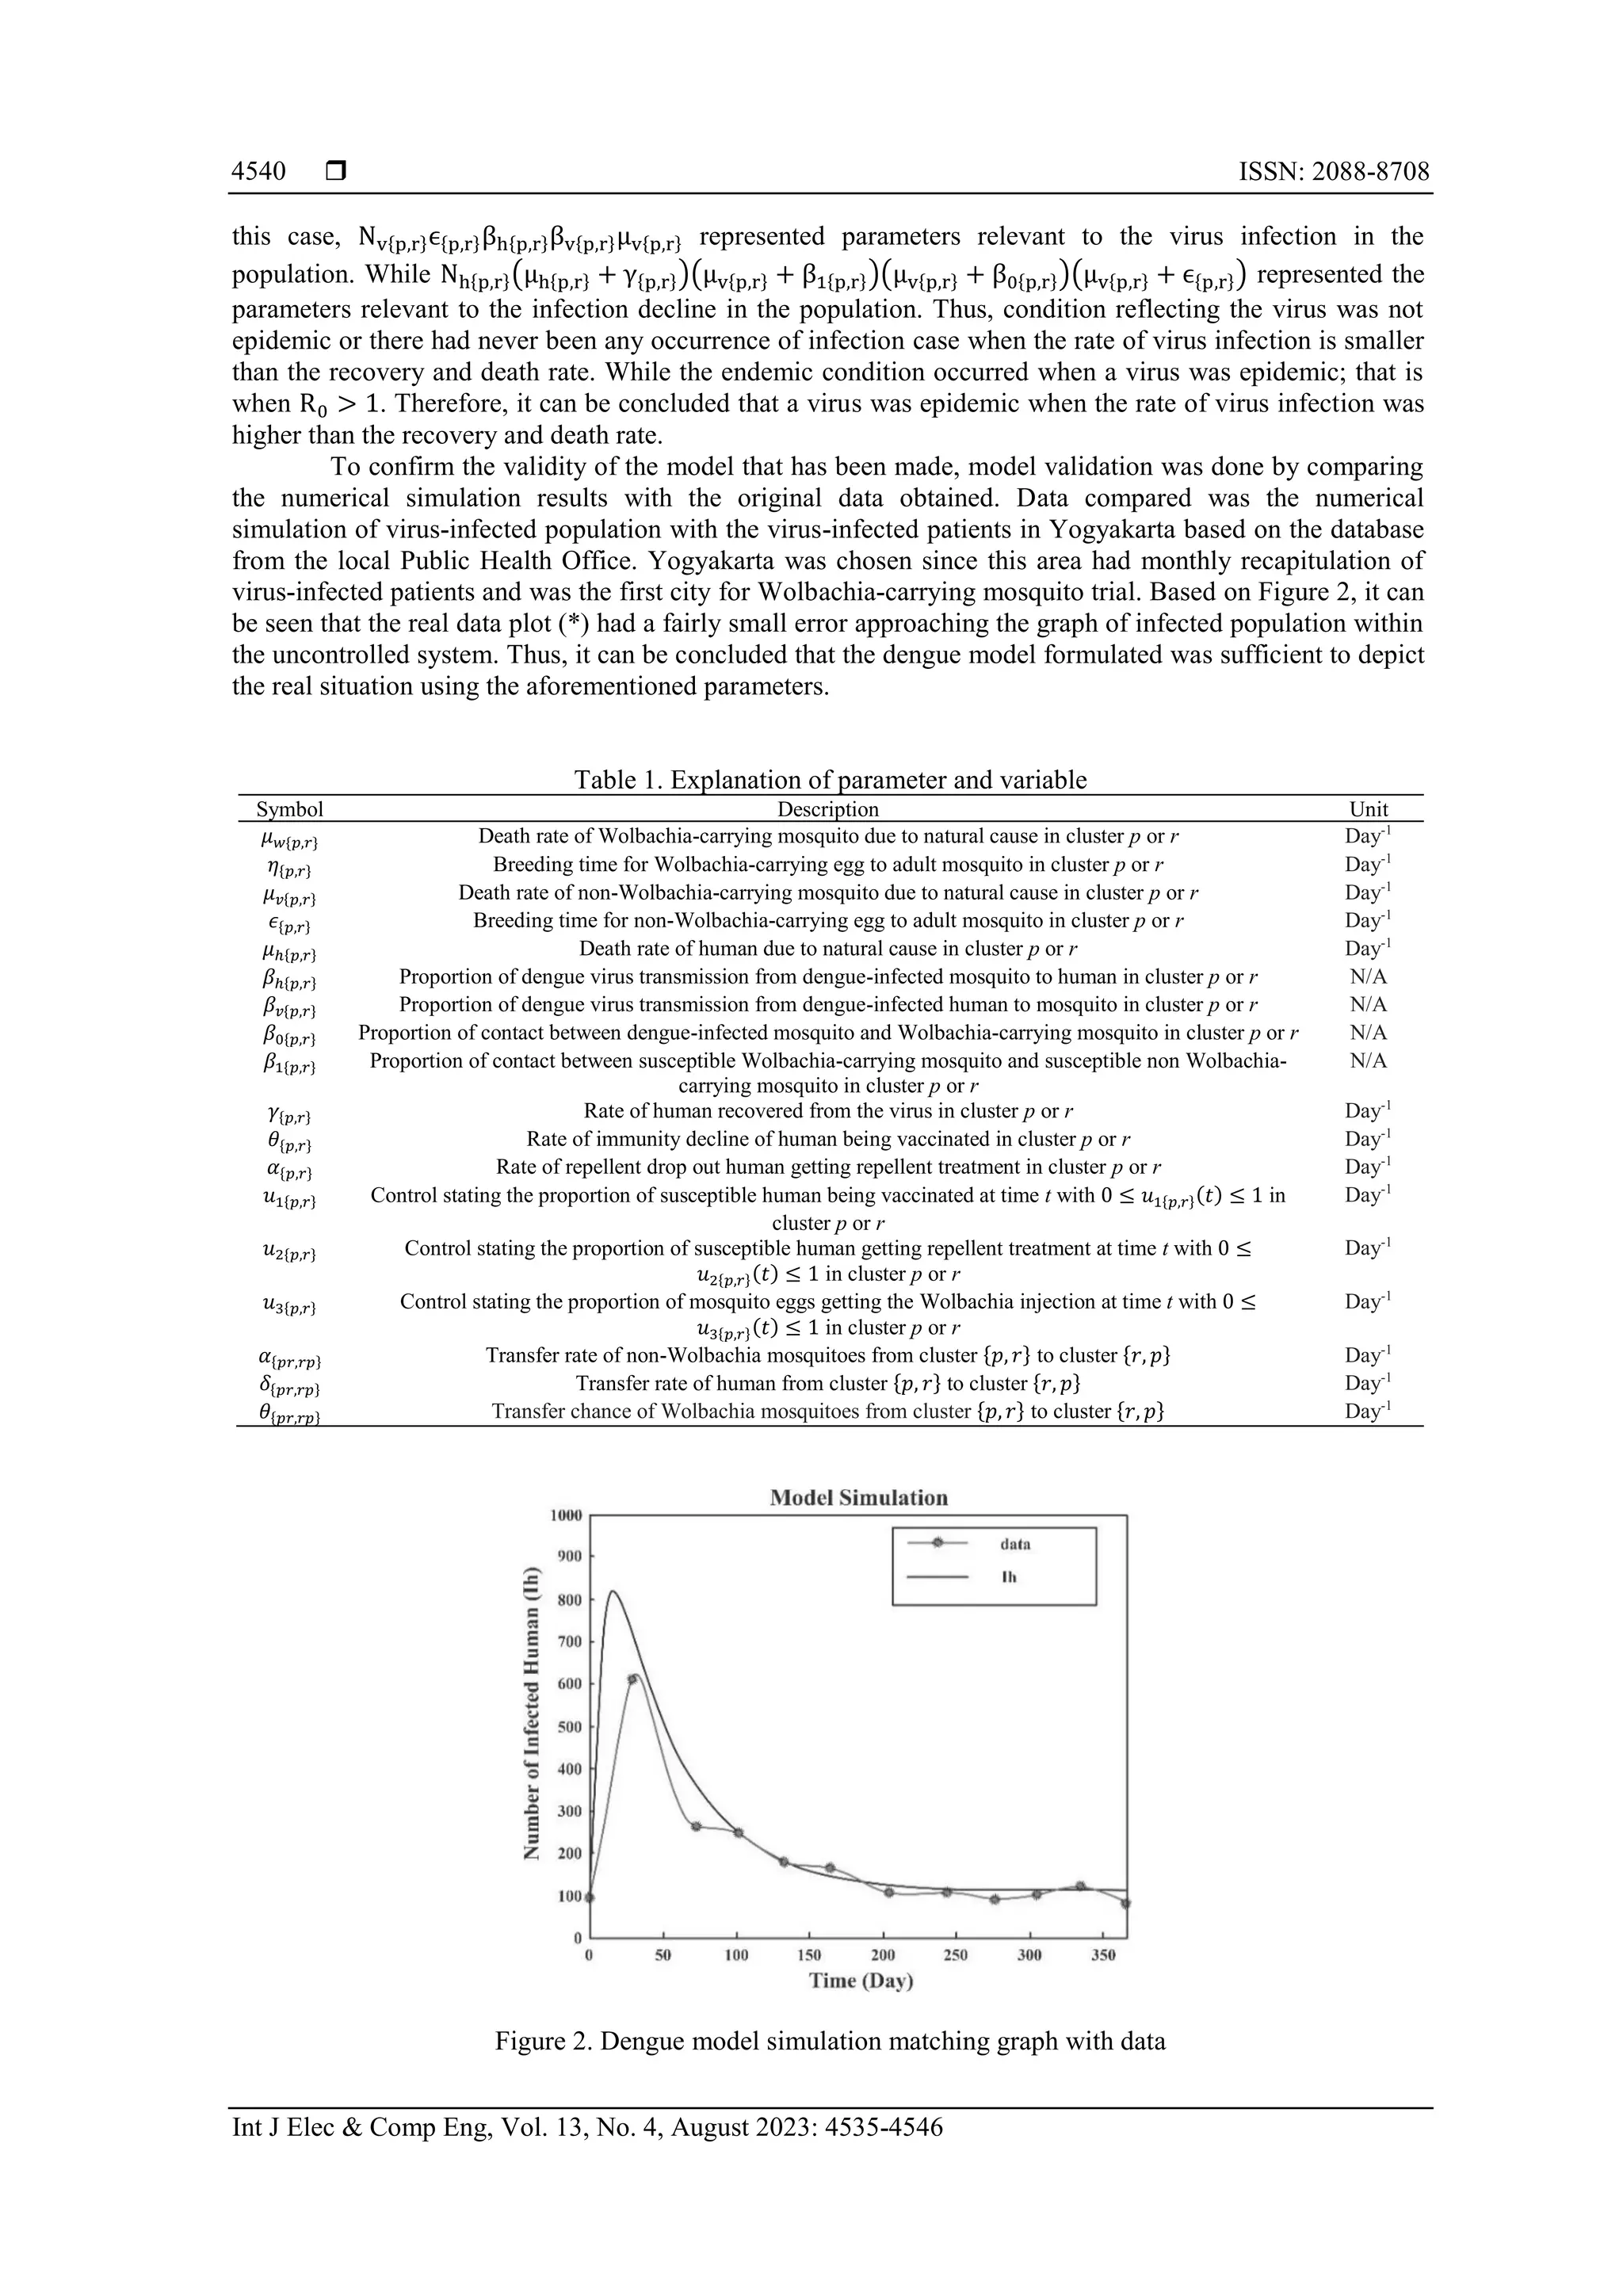
![Int J Elec & Comp Eng ISSN: 2088-8708 Genetic algorithm to optimization mobility-based dengue mathematical model (Tegar Arifin Prasetyo) 4539 3. RESULT AND DISCUSSION 3.1. Result of the mobility dengue mathematical model formulation In the real situation, the mobility aspect significantly influences in the dengue virus transmission, therefore, it is necessary to formulate mobility-based dengue mathematical model. It was assumed that there were two clusters observed: cluster 𝑝 and 𝑟. The human population was divided into susceptible (𝑆ℎ{𝑝,𝑟}), infected (𝐼ℎ{𝑝,𝑟}), and recovered (𝑅ℎ{𝑝,𝑟}). The non Wolbachia-carrying mosquito population was divided into aquatic egg (𝐴𝑣{𝑝,𝑟}), susceptible (𝑆𝑣{𝑝,𝑟}), infected (𝐼𝑣{𝑝,𝑟}), and protected (𝑃𝑣{𝑝,𝑟}). The Wolbachia mosquito population was divided into aquatic egg (𝐴𝑤{𝑝,𝑟}) and susceptible (𝑆𝑤{𝑝,𝑟}). The assumptions used in the model formed have been given previously in the methods section. Beside that in mosquito population, there was no recovered class because the mosquito would remain infectious for its entire life. It was also assumed that Wolbachia-carrying Aedes aegypti mosquitoes would be released and mate the non-Wolbachia- carrying Aedes aegypti. In this case, the Wolbachia bacteria in the Wolbachia-carrying Aedes aegypti would be transmitted to the other Aedes aegypti and killed the dengue virus in the mosquito. As a result, the mosquito would not be able to transmit the dengue virus to human. Therefore, the researchers assumed that mosquitoes mating the Wolbachia-carrying Aedes aegypti would also be infected with the bacteria causing the mosquito population changing to the protected human population compartment. Based on these assumptions, the researchers also modeled the Wolbachia mosquito compartment, although the model has less effect on the human and non-Wolbachia-carrying mosquito compartments, but the researchers assumed that it was important to model the Wolbachia mosquito compartment so that the contact rate of Wolbachia- carrying and non-Wolbachia-carrying mosquitoes could be realized and became plausible. As the aim of this research is to gain general insight into the possible effectiveness of using vaccines, repellents and Wolbachia, the use of a combination of three strategies is more effective in reducing dengue cases than implementing only one strategy. Thus, the formulated model can be seen in system (1) and explanations on the parameters and variables are given in Table 1. 𝑑𝑆ℎ{𝑝,𝑟} 𝑑𝑡 = 𝜇ℎ{𝑝,𝑟}𝑁ℎ{𝑝,𝑟} + (𝜃{𝑝,𝑟}𝑢1{𝑝,𝑟} + 𝛼{𝑝,𝑟}𝑢2{𝑝,𝑟})𝑅ℎ{𝑝,𝑟} + 𝛿{𝑟𝑝,𝑝𝑟}𝑆ℎ{𝑟,𝑝} − 𝑆{𝑝,𝑟}1, 𝑑𝐼ℎ{𝑝,𝑟} 𝑑𝑡 = 𝛽ℎ{𝑝,𝑟}𝐼𝑣{𝑝,𝑟}𝑆ℎ{𝑝,𝑟} 𝑁ℎ{𝑝,𝑟} + 𝛿{𝑟𝑝,𝑝𝑟}𝐼ℎ{𝑟,𝑝} − (𝜇ℎ{𝑝,𝑟} + 𝛾{𝑝,𝑟} + 𝛿{𝑝𝑟,𝑟𝑝})𝐼ℎ{𝑝,𝑟}, 𝑑𝑅ℎ{𝑝,𝑟} 𝑑𝑡 = 𝛾{𝑝,𝑟}𝐼ℎ{𝑝,𝑟} + (𝑢1{𝑝,𝑟} + 𝑢2{𝑝,𝑟})𝑆ℎ{𝑝,𝑟} + 𝛿{𝑟𝑝,𝑝𝑟}𝑅ℎ{𝑟,𝑝} − 𝑅{𝑝,𝑟}1, 𝑑𝐴𝑣{𝑝,𝑟} 𝑑𝑡 = 𝜇𝑣{𝑝,𝑟}𝑁𝑣{𝑝,𝑟} + 𝛼{𝑟𝑝,𝑝𝑟}𝐴𝑣{𝑟,𝑝} − (𝜇𝑣{𝑝,𝑟} + 𝜖{𝑝,𝑟} + 𝑢3{𝑝,𝑟} + 𝛼{𝑝𝑟,𝑟𝑝})𝐴𝑣{𝑝,𝑟}, 𝑑𝑆𝑣{𝑝,𝑟} 𝑑𝑡 = 𝜖{𝑝,𝑟}𝐴𝑣{𝑝,𝑟} + 𝛼{𝑟𝑝,𝑝𝑟}𝑆𝑣{𝑟,𝑝} − (𝜇𝑣{𝑝,𝑟} + 𝛽1{𝑝,𝑟} + 𝛽𝑣{𝑝,𝑟}𝐼ℎ{𝑝,𝑟} 𝑁ℎ{𝑝,𝑟} + 𝛼{𝑝𝑟,𝑟𝑝}) 𝑆𝑣{𝑝,𝑟}, 𝑑𝐼𝑣{𝑝,𝑟} 𝑑𝑡 = 𝛽𝑣{𝑝,𝑟}𝐼ℎ{𝑝,𝑟}𝑆𝑣{𝑝,𝑟} 𝑁ℎ{𝑝,𝑟} + 𝛼{𝑟𝑝,𝑝𝑟}𝐼𝑣{𝑟,𝑝} − (𝜇𝑣{𝑝,𝑟} + 𝛽0{𝑝,𝑟} + 𝛼{𝑝𝑟,𝑟𝑝})𝐼𝑣{𝑝,𝑟}, 𝑑𝑃𝑣{𝑝,𝑟} 𝑑𝑡 = 𝛽0{𝑝,𝑟}𝐼𝑣{𝑝,𝑟} + 𝛽1{𝑝,𝑟}𝑆𝑣{𝑝,𝑟} + 𝑢3{𝑝,𝑟}𝐴𝑣{𝑝,𝑟} + 𝛼{𝑟𝑝,𝑝𝑟}𝑃𝑣{𝑟,𝑝} − (𝜇𝑣{𝑝,𝑟} + 𝛼{𝑝𝑟,𝑟𝑝})𝑃𝑣{𝑝,𝑟}, 𝑑𝐴𝑤{𝑝,𝑟} 𝑑𝑡 = 𝜇𝑤{𝑝,𝑟}𝑁𝑤{𝑝,𝑟} + 𝜃{𝑟𝑝,𝑝𝑟}𝐴𝑤{𝑟,𝑝} − (𝜇𝑤{𝑝,𝑟} + 𝜂{𝑝,𝑟} + 𝜃{𝑝𝑟,𝑟𝑝})𝐴𝑤{𝑝,𝑟}, 𝑑𝑆𝑤{𝑝,𝑟} 𝑑𝑡 = 𝜂{𝑝,𝑟}𝐴𝑤{𝑝,𝑟} + 𝜃{𝑟𝑝,𝑝𝑟}𝑆𝑤{𝑟,𝑝} − (𝜇𝑤{𝑝,𝑟} + 𝜃{𝑝𝑟,𝑟𝑝})𝑆𝑤{𝑝,𝑟}. (1) with 𝑆{𝑝,𝑟}1 = (𝑢1{𝑝,𝑟} + 𝑢2{𝑝,𝑟} + 𝜇ℎ{𝑝,𝑟} + 𝛽ℎ{𝑝,𝑟}𝐼𝑣{𝑝,𝑟} 𝑁ℎ{𝑝,𝑟} + 𝛿{𝑝𝑟,𝑟𝑝}) 𝑆ℎ{𝑝,𝑟}, 𝑅{𝑝,𝑟}1 = (𝜇ℎ{𝑝,𝑟} + 𝛼{𝑝,𝑟}𝑢2{𝑝,𝑟} + 𝜃{𝑝,𝑟}𝑢1{𝑝,𝑟} + 𝛿{𝑝𝑟,𝑟𝑝})𝑅ℎ{𝑝,𝑟}. Basic reproduction number (𝑅0) stating the average of secondary cases per primary cases when the dengue infection was given to susceptible population [27]. In this research, (𝑅0) was formulated using the next generation matrix (NGM) method in correspondence to the virus-free equilibrium point. Therefore, (𝑅0) is obtained as (2): 𝑅0 = √ 𝑁𝑣{𝑝,𝑟}𝜖{𝑝,𝑟}𝛽ℎ{𝑝,𝑟}𝛽𝑣{𝑝,𝑟}𝜇𝑣{𝑝,𝑟} 𝑁ℎ{𝑝,𝑟}(𝜇ℎ{𝑝,𝑟}+𝛾{𝑝,𝑟})(𝜇𝑣{𝑝,𝑟}+𝛽1{𝑝,𝑟})(𝜇𝑣{𝑝,𝑟}+𝛽0{𝑝,𝑟})(𝜇𝑣{𝑝,𝑟}+𝜖{𝑝,𝑟}) (2) based on the value of 𝑅0 in the uncontrolled model (1), it can be concluded that a virus-free condition occured when the virus was not epidemic or there had never been any infection case; that is when R0 < 1. In](https://image.slidesharecdn.com/v9030847emf-230621071431-19367605/75/Genetic-algorithm-to-optimization-mobility-based-dengue-mathematical-model-5-2048.jpg)
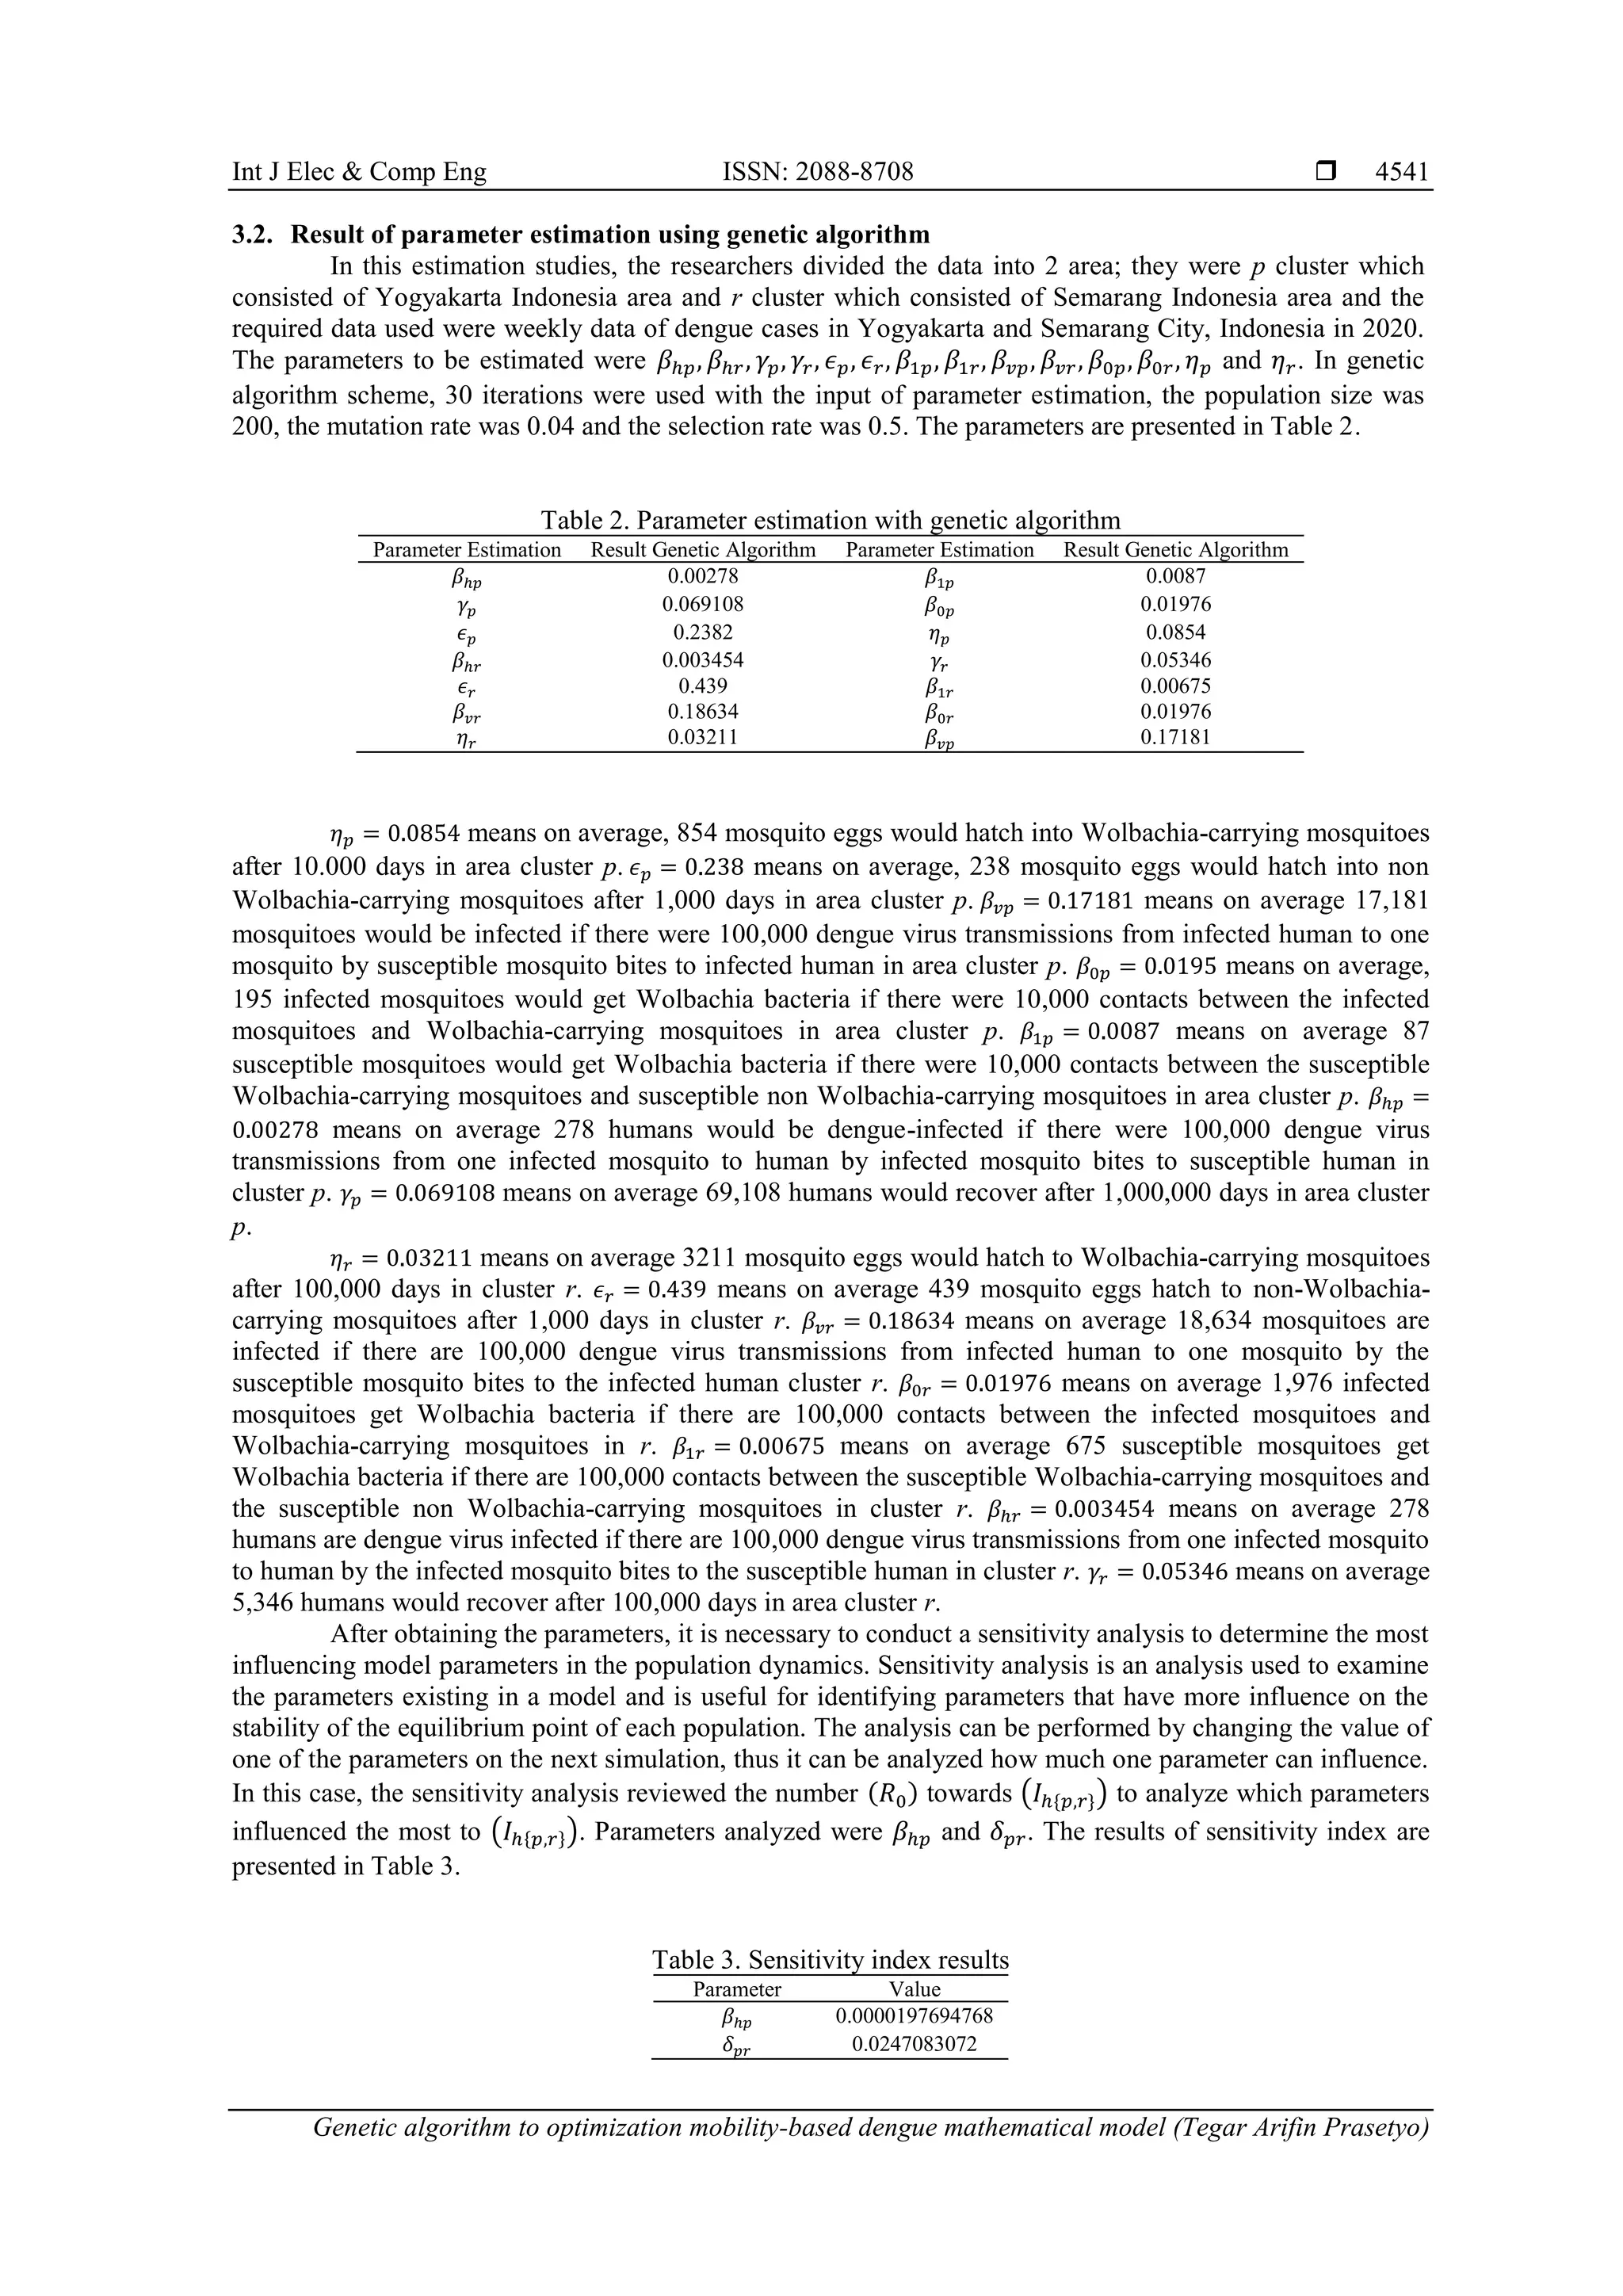
![ ISSN: 2088-8708 Int J Elec & Comp Eng, Vol. 13, No. 4, August 2023: 4535-4546 4542 Based on the results above, it is clear that the most influencing parameter of endemic occurrence was the rate of human mobility 𝛿𝑝𝑟. In other words, if one area has high risk of dengue transmission, the migration level in the area was to be reduced to avoid the dengue transmission to other areas. 3.3. Result of optimal control At this stage, the researchers analyzed the implementation of optimal control on mobility dengue model with the aim of minimizing the infected human population. Thus, the objective function formula is as (3): 𝐽 = min 𝑢1{𝑝,𝑟},𝑢2{𝑝,𝑟},𝑢3{𝑝,𝑟} ∫ (𝐼ℎ{𝑝,𝑟} + 𝐵1{𝑝,𝑟}𝑢1{𝑝,𝑟} 2 + 𝐵2{𝑝,𝑟}𝑢2{𝑝,𝑟} 2 + 𝐵3{𝑝,𝑟} 2 𝑢3{𝑝,𝑟} 2 )𝑑𝑡 𝑡𝑓 0 (3) where 0 ≤ 𝑡 ≤ 𝑡𝑓, 0 ≤ 𝑢1{𝑝,𝑟}(𝑡), 𝑢2{𝑝,𝑟}(𝑡), 𝑢3{𝑝,𝑟}(𝑡) ≤ 1, 𝑡𝑓 is the final time 𝐼ℎ{𝑝,𝑟} is the number of dengue infected human in area cluster p or r. 𝐵1{𝑝,𝑟}, 𝐵2{𝑝,𝑟}, and 𝐵3{𝑝,𝑟} are positive constants which represent the vaccination, repellent and Wolbachia bacteria weight in area cluster p and r. To solve the system (1) and minimize the objective function (3), the Pontryagin's minimum principle was used. Thus, the Hamiltonian function can easily be obtained as: 𝐻 = 𝐼ℎ{𝑝,𝑟} + 𝐵1{𝑝,𝑟}𝑢1{𝑝,𝑟} 2 + 𝐵2{𝑝,𝑟}𝑢2{𝑝,𝑟} 2 + 𝐵3{𝑝,𝑟} 2 𝑢3{𝑝,𝑟} 2 + 𝜆1[𝜇𝑤{𝑝,𝑟}𝑁𝑤{𝑝,𝑟} + 𝜃{𝑟𝑝,𝑝𝑟}𝐴𝑤{𝑟,𝑝} + 𝜆2 [[𝜇𝑤{𝑝,𝑟}𝑁𝑤{𝑝,𝑟} + 𝜃{𝑟𝑝,𝑝𝑟}𝐴𝑤{𝑟,𝑝} − (𝜇𝑤{𝑝,𝑟} + 𝜂{𝑝,𝑟} + 𝜃{𝑝𝑟,𝑟𝑝})𝐴𝑤{𝑝,𝑟}] + 𝜆3[𝜇𝑣{𝑝,𝑟}𝑁𝑣{𝑝,𝑟} + 𝛼{𝑟𝑝,𝑝𝑟}𝐴𝑣{𝑟,𝑝} − (𝜇𝑣{𝑝,𝑟} + 𝜖{𝑝,𝑟} + 𝑢3{𝑝,𝑟} + 𝛼{𝑝𝑟,𝑟𝑝})𝐴𝑣{𝑝,𝑟}] + 𝜆4[𝜖{𝑝,𝑟}𝐴𝑣{𝑝,𝑟} + 𝛼{𝑟𝑝,𝑝𝑟}𝑆𝑣{𝑟,𝑝} − (𝜇𝑣{𝑝,𝑟} + 𝛽1{𝑝,𝑟} + 𝛽𝑣{𝑝,𝑟}𝐼ℎ{𝑝,𝑟} 𝑁ℎ{𝑝,𝑟} + 𝛼{𝑝𝑟,𝑟𝑝}) 𝑆𝑣{𝑝,𝑟}] + 𝜆5 [ 𝛽𝑣{𝑝,𝑟}𝐼ℎ{𝑝,𝑟}𝑆𝑣{𝑝,𝑟} 𝑁ℎ{𝑝,𝑟} + 𝛼{𝑟𝑝,𝑝𝑟}𝑆𝑣{𝑟,𝑝} − (𝜇𝑣{𝑝,𝑟} + 𝛽1{𝑝,𝑟} + 𝛽𝑣{𝑝,𝑟}𝐼ℎ{𝑝,𝑟} 𝑁ℎ{𝑝,𝑟} + 𝛼{𝑝𝑟,𝑟𝑝}) 𝑆𝑣{𝑝,𝑟}] + 𝜆5 [ 𝛽𝑣{𝑝,𝑟}𝐼ℎ{𝑝,𝑟}𝑆𝑣{𝑝,𝑟} 𝑁ℎ{𝑝,𝑟} + 𝛼{𝑟𝑝,𝑝𝑟}𝐼𝑣{𝑟,𝑝} − (𝜇𝑣{𝑝,𝑟} + 𝛽0{𝑝,𝑟} + 𝛼{𝑝𝑟,𝑟𝑝})𝐼𝑣{𝑝,𝑟}] +𝜆6 [𝛽0{𝑝,𝑟}𝐼𝑣{𝑝,𝑟} + 𝛽1{𝑝,𝑟}𝑆𝑣{𝑝,𝑟} + 𝑢3{𝑝,𝑟}𝐴𝑣{𝑝,𝑟}+𝛼{𝑟𝑝,𝑝𝑟}𝑃𝑣{𝑟,𝑝} − (𝜇𝑣{𝑝,𝑟} + 𝛼{𝑝𝑟,𝑟𝑝})𝑃𝑣{𝑝,𝑟}] + 𝜆7[𝜇ℎ{𝑝,𝑟}𝑁ℎ{𝑝,𝑟} + (𝜃{𝑝,𝑟}𝑢1{𝑝,𝑟} + 𝛼{𝑝,𝑟}𝑢2{𝑝,𝑟})𝑅ℎ{𝑝,𝑟}+𝛿{𝑟𝑝,𝑝𝑟}𝑆ℎ{𝑟,𝑝} − 𝑆{𝑝,𝑟}1] + 𝜆8 [ 𝛽ℎ{𝑝,𝑟}𝐼𝑣{𝑝,𝑟}𝑆ℎ{𝑝,𝑟} 𝑁ℎ{𝑝,𝑟} + 𝛿{𝑟𝑝,𝑝𝑟}𝐼ℎ{𝑟,𝑝} − (𝜇ℎ{𝑝,𝑟} + 𝛾{𝑝,𝑟} + 𝛿{𝑝𝑟,𝑟𝑝})𝐼ℎ{𝑝,𝑟}] + 𝜆9[𝛾{𝑝,𝑟}𝐼ℎ{𝑝,𝑟} + (𝑢1{𝑝,𝑟} + 𝑢2{𝑝,𝑟})𝑆ℎ{𝑝,𝑟} + 𝛿{𝑟𝑝,𝑝𝑟}𝑅ℎ{𝑟,𝑝} − 𝑅{𝑝,𝑟}1]. The state equation, co-state equation and stationery condition can be solved by completing: 𝑥̇ = 𝜕𝐻 𝜕𝜆𝑝 , 𝑝 = 1,2, … ,9; −𝜆̇ = 𝜕𝐻 𝜕𝑥 ; and 𝜕𝐻 𝜕𝑢𝑘{𝑝,𝑟} = 0, 𝑘 = 1,2,3. with 𝑥 = (𝑆ℎ{𝑝,𝑟}, 𝐼ℎ{𝑝,𝑟}, 𝑅ℎ{𝑝,𝑟}, 𝐴𝑣{𝑝,𝑟}, 𝑆𝑣{𝑝,𝑟}, 𝐼𝑣{𝑝,𝑟}, 𝑃𝑣{𝑝,𝑟}, 𝐴𝑤{𝑝,𝑟}, 𝑆𝑤{𝑝,𝑟}). The solutions obtained are: 𝑢1{𝑝,𝑟} ∗ (𝑡) = min (1, max (0, (𝜆1 − 𝜆3)𝑆ℎ{𝑝,𝑟} + (𝜆3 − 𝜆1)𝜃{𝑝,𝑟}𝑅ℎ{𝑝,𝑟} 2𝐵1{𝑝,𝑟} )) 𝑢2{𝑝,𝑟} ∗ (𝑡) = min (1, max (0, (𝜆1−𝜆3)𝑆ℎ{𝑝,𝑟}+(𝜆3−𝜆1)𝛼{𝑝,𝑟}𝑅ℎ{𝑝,𝑟} 2𝐵2{𝑝,𝑟} )) 𝑢3{𝑝,𝑟} ∗ (𝑡) = min (1, max (0, (𝜆4−𝜆7)𝐴𝑣{𝑝,𝑟} 2𝐵3{𝑝,𝑟} )) (5)](https://image.slidesharecdn.com/v9030847emf-230621071431-19367605/75/Genetic-algorithm-to-optimization-mobility-based-dengue-mathematical-model-8-2048.jpg)
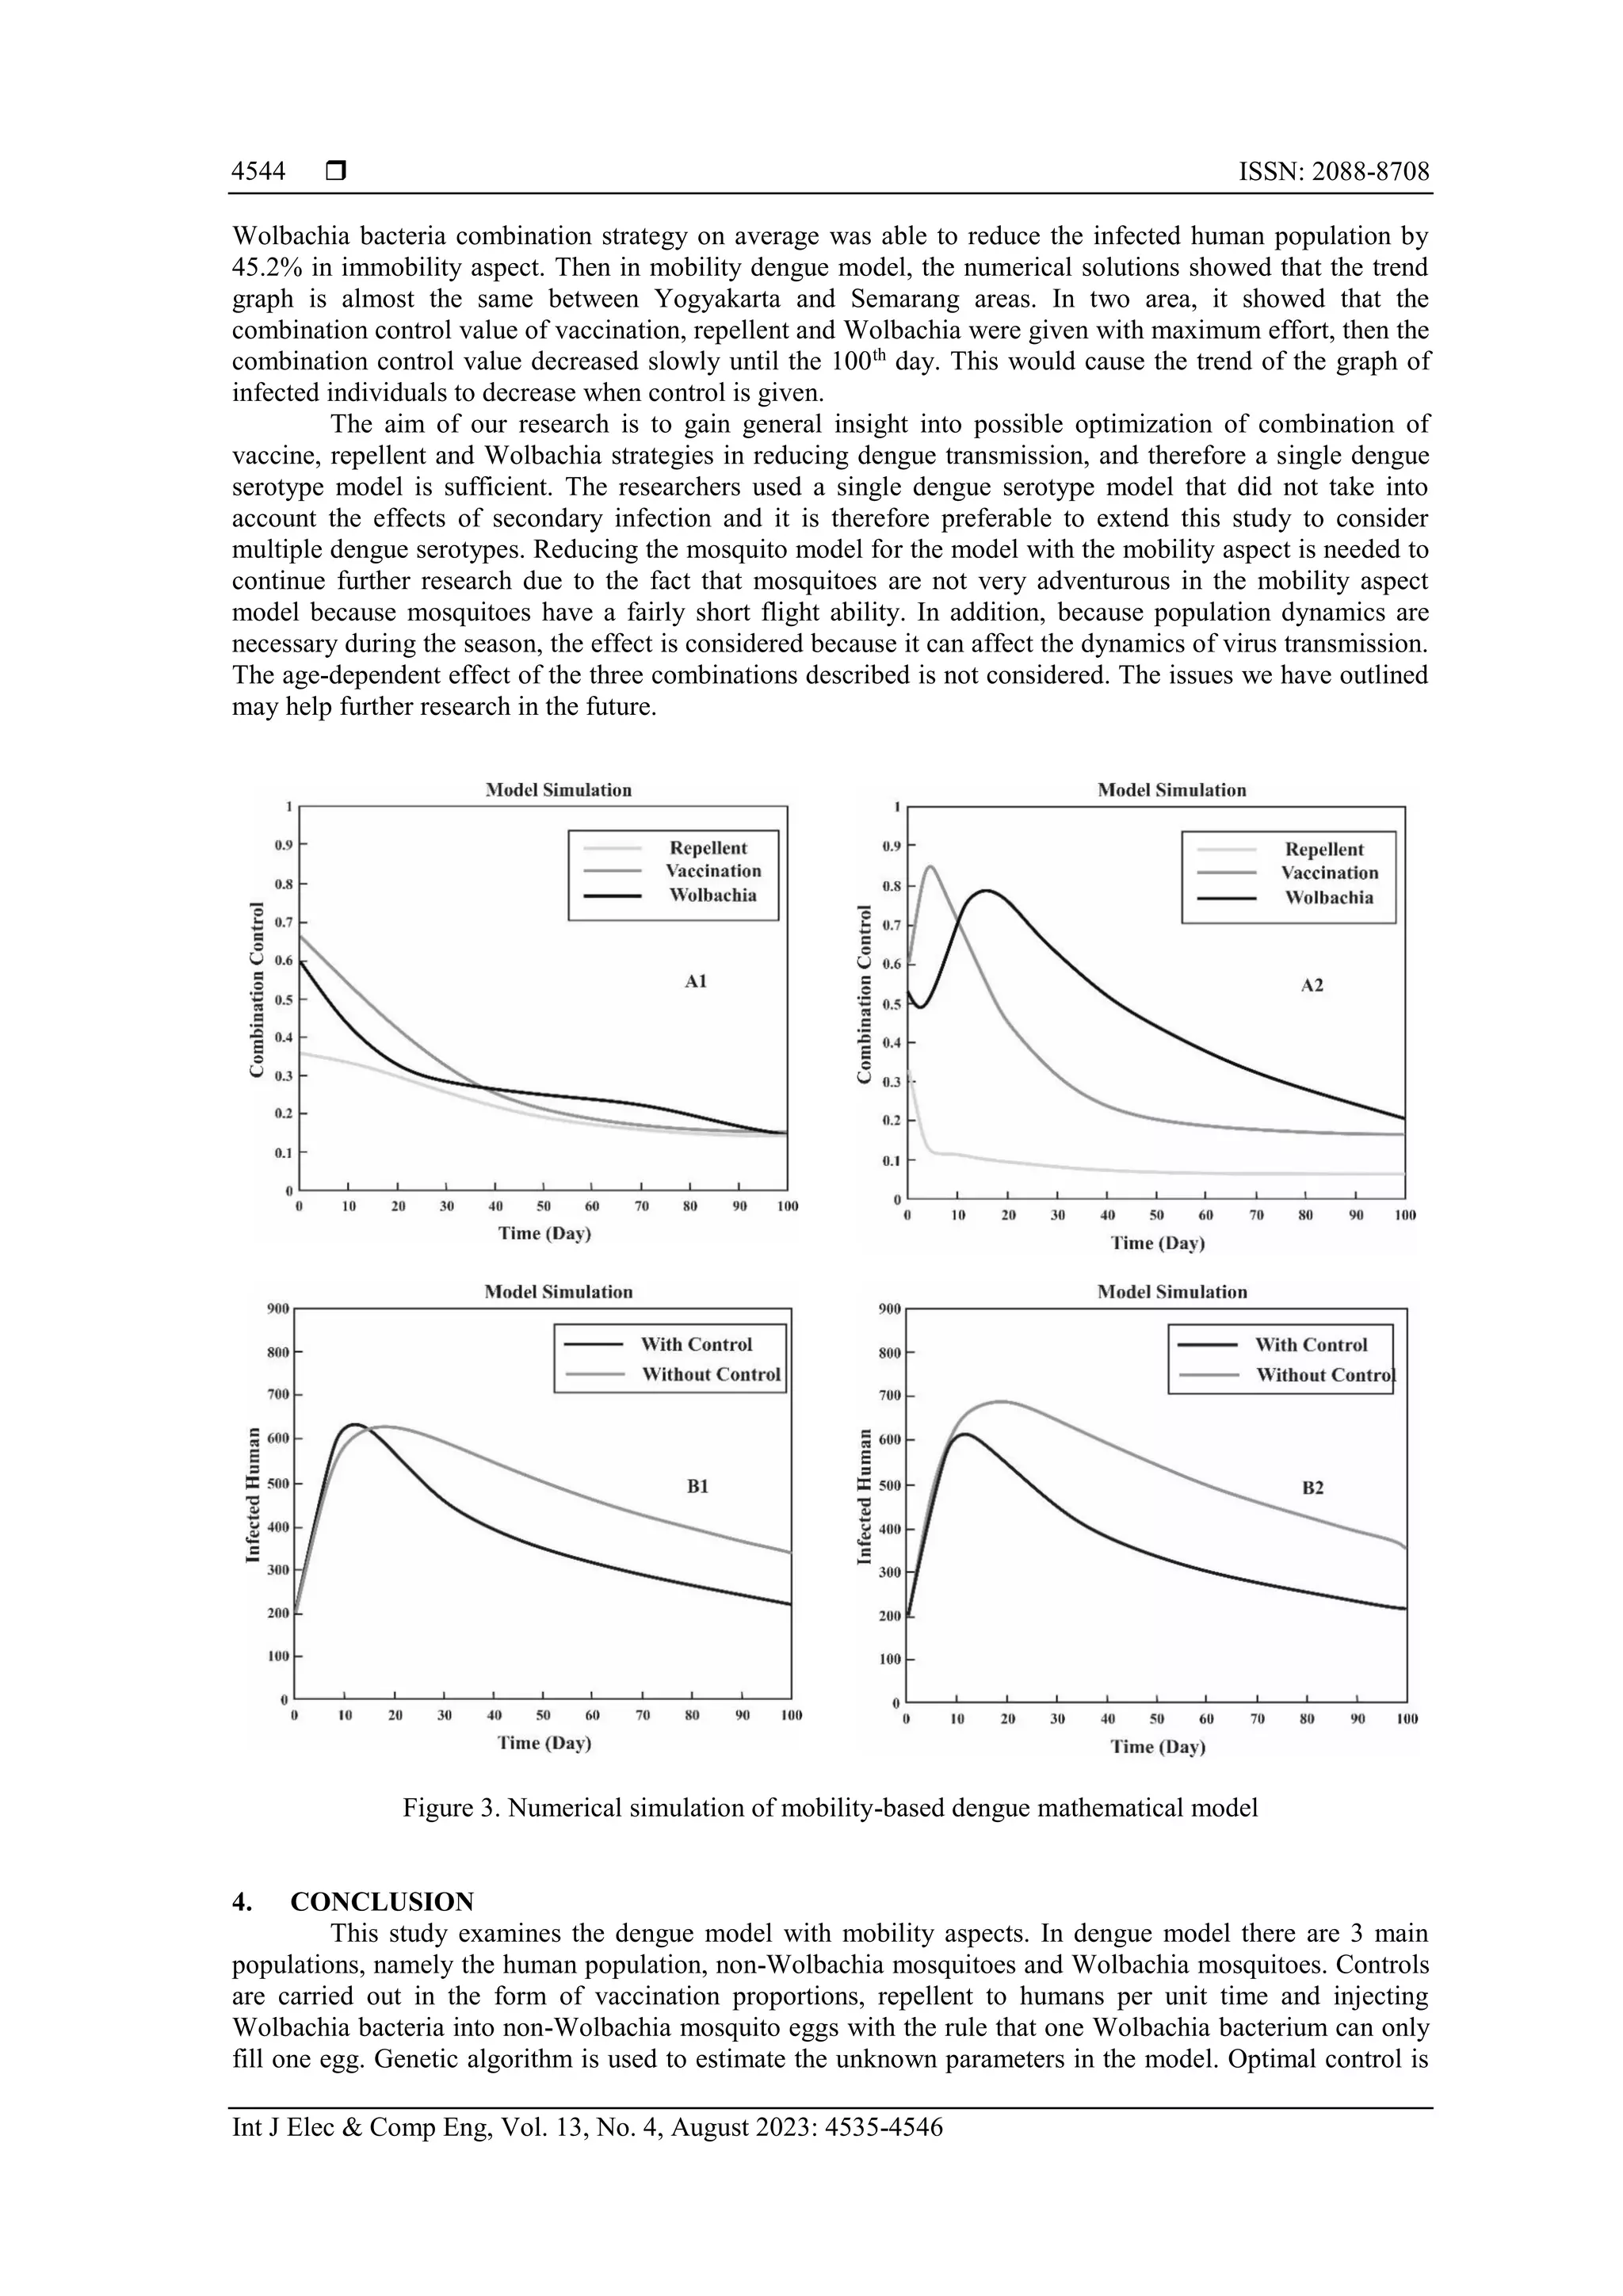
![Int J Elec & Comp Eng ISSN: 2088-8708 Genetic algorithm to optimization mobility-based dengue mathematical model (Tegar Arifin Prasetyo) 4543 Table 4 show the results that during the observation time, the dynamics of the human population due to vaccination control was able to reduce the infected human population by 24.2% on average. The dynamics of the human population with repellent control was able to reduce the infected human population by 19.2% on average. The dynamics of the human population with Wolbachia control was able to reduce the infected human population by 30.4% on average. The dynamics of the human population with vaccination and repellent control on average was able to reduce the infected human population by 31.9%. The dynamics of the human population with vaccination and Wolbachia control on average was able to reduce the infected human population by 40%. The dynamics of the human population with repellent and Wolbachia control on average was able to reduce the infected human population by 34.7%. The dynamics of the human population with vaccination, repellent and Wolbachia bacteria control on average was able to reduce the infected human population by 45.2%. Table 4. Comparison of infected human population on day 100 Condition Number of Infected Human Population Without control 420 Vaccination control 318 Repellent control 338 Wolbachia control 292 Vaccination and repellent control 286 Vaccination and Wolbachia control 252 Repellent and Wolbachia control 272 Vaccination, repellent, and Wolbachia control 230 Figure 3 presents the results of the numerical solution in three combination strategies model where it shows that the trend graph is almost similar between Yogyakarta and Semarang areas. At first the combination control value of vaccination, repellent and Wolbachia were given with maximum effort, then the combination control value decreased slowly until the 100th day. It means that at first the combination control of vaccination, repellent and Wolbachia were carried out optimally, then the value of combination control of vaccination, repellent and Wolbachia decreased slowly as the number of infected individuals decreased. Figure 3 also explains that Yogyakarta area and the Semarang area had similar trend graph in the cases of the infected human population. It can be seen that at first the size of the infected human population increased, this was due to the increase in the population of humans susceptible to dengue virus, and the increase in displacement between the two regions. Then the graph of the size of the human population that has decreased, this is due to the reduction in humans caused by natural deaths or caused by humans recovered from infection after the treatment process, natural deaths, and reductions occurred due to displacement between regions. The dynamics of the human population with vaccination, repellent and Wolbachia bacteria combination on average was able to reduce the infected human population by 45.2%. In Figure 3, plot (A1) is controlling simulation for Yogyakarta area, plot (A2): control simulation for Semarang area, Plot (B1) is the dynamics of the infected human population in Yogyakarta area, and plot (B2) is the dynamics of the infected human population in Semarang area. 3.4. Discussion Mathematical models of dengue transmission using the strategy of vaccinations, repellent and Wolbachia have been developed and the sensitivity analysis have been conducted to determine the most influencing model parameter. The results of the sensitivity index showed that the most influencing parameter in the occurrence of endemic was the rate of human mobility δpr. In other words, if there is an area that is at high risk of dengue, the migration rate in that area can be reduced in order to avoid the dengue transmission to other areas. Not only will it reduce the mobility of the dengue transmission, the migration rate reduction also will impact the suppressing number of COVID-19 transmission to prevent the COVID-19 epidemic. In addition, high self-efficacy and decision to take action are good practices to dengue prevention during the COVID-19 pandemic [28]. The results showed that the use of vaccination, repellent and vector control such as Wolbachia was necessary to reduce dengue cases. Even thought if the effectiveness of vaccination and repellent is higher, the performance of this strategy in reducing the number of dengue cases will be more effective than using only Wolbachia mosquitoes. However, the results of our study suggest that the use of vaccination, vector control and vector control such as Wolbachia carried out together is very important in order to reduce dengue fever cases very significantly. In fact, higher vaccine and repellent efficacy can be obtained when 9–45 years of age seropositive individuals are vaccinated [4], [15] and vector control such as using Wolbachia is needed to suppress dengue cases [16]. The dynamics of the human population with vaccination, repellent and](https://image.slidesharecdn.com/v9030847emf-230621071431-19367605/75/Genetic-algorithm-to-optimization-mobility-based-dengue-mathematical-model-9-2048.jpg)
![Int J Elec & Comp Eng ISSN: 2088-8708 Genetic algorithm to optimization mobility-based dengue mathematical model (Tegar Arifin Prasetyo) 4545 solved by Pontryagin's minimum principle. Backward-forward sweep algorithm was used to simulate the optimal control. The simulation results were then compared with the time without control. Based on the simulation results during the observation time, the dynamics of the human population with a combination of vaccination control, repellent and Wolbachia bacteria were able to reduce the infected human population by an average of 45.2%. ACKNOWLEDGEMENTS We thank for the support financial assistance provided for journal payments by LPPM Institut Teknologi Del, we thank for of Department of Information Technology, Faculty of Vocational Studies, Del Institute of Technology, Indonesia, and Department of Mathematics, Bandung Institute of Technology, Indonesia. REFERENCES [1] N. Anggriani, H. Tasman, M. Z. Ndii, A. K. Supriatna, E. Soewono, and E. Siregar, “The effect of reinfection with the same serotype on dengue transmission dynamics,” Applied Mathematics and Computation, vol. 349, pp. 62–80, May 2019, doi: 10.1016/j.amc.2018.12.022. [2] T. A. Prasetyo, R. Saragih, and D. Handayani, “Optimal control on the mathematical models of dengue epidemic by giving vaccination and repellent strategies,” Journal of Physics: Conference Series, vol. 1490, Mar. 2020, doi: 10.1088/1742- 6596/1490/1/012034. [3] T. Pratheeba, V. Taranath, D. Sai Gopal, and D. Natarajan, “Antidengue potential of leaf extracts of Pavetta tomentosa and Tarenna asiatica (Rubiaceae) against dengue virus and its vector Aedes aegypti (Diptera: Culicidae),” Heliyon, vol. 5, no. 11, Nov. 2019, doi: 10.1016/j.heliyon.2019.e02732. [4] I. Dorigatti, C. McCormack, G. Nedjati-Gilani, and N. M. Ferguson, “Using Wolbachia for dengue control: insights from modelling,” Trends in Parasitology, vol. 34, no. 2, pp. 102–113, Feb. 2018, doi: 10.1016/j.pt.2017.11.002. [5] S. D. Rodriguez et al., “Efficacy of some wearable devices compared with spray-on insect repellents for the yellow fever Mosquito, Aedes aegypti (L.) (Diptera: Culicidae),” Journal of Insect Science, vol. 17, no. 1, Jan. 2017, doi: 10.1093/jisesa/iew117. [6] S. Balasubramani, G. Sabapathi, A. K. Moola, R. V. Solomon, P. Venuvanalingam, and R. K. Bollipo Diana, “Evaluation of the leaf essential oil from Artemisia vulgaris and its Larvicidal and repellent activity against dengue fever vector Aedes aegypti —an experimental and molecular docking investigation,” ACS Omega, vol. 3, no. 11, pp. 15657–15665, Nov. 2018, doi: 10.1021/acsomega.8b01597. [7] M. Aguiar, N. Stollenwerk, and S. B. Halstead, “The impact of the newly licensed dengue vaccine in endemic countries,” PLOS Neglected Tropical Diseases, vol. 10, no. 12, Dec. 2016, doi: 10.1371/journal.pntd.0005179. [8] T. Ranathunge, J. Harishchandra, H. Maiga, J. Bouyer, Y. I. N. S. Gunawardena, and M. Hapugoda, “Developmentof the sterile insect technique to control the dengue vector Aedes Aegypti (Linnaeus) in Sri Lanka,” PLOS ONE, vol. 17, no. 4, Apr. 2022, doi: 10.1371/journal.pone.0265244. [9] R. R. S. Manoj, M. S. Latrofa, S. Epis, and D. Otranto, “Wolbachia: endosymbiont of onchocercid nematodes and their vectors,” Parasites and Vectors, vol. 14, no. 1, May 2021, doi: 10.1186/s13071-021-04742-1. [10] A. C. Fredericks, T. A. Russell, L. E. Wallace, A. D. Davidson, A. Fernandez-Sesma, and K. Maringer, “Aedes aegypti (Aag2)- derived clonal mosquito cell lines reveal the effects of pre-existing persistent infection with the insect-specific bunyavirus Phasi Charoen-like virus on arbovirus replication,” PLOS Neglected Tropical Diseases, vol. 13, no. 11, Nov. 2019, doi: 10.1371/journal.pntd.0007346. [11] E. Lee et al., “Transient introgression of Wolbachia into Aedes aegypti populations does not elicit an antibody response to Wolbachia surface protein in community members,” Pathogens, vol. 11, no. 5, May 2022, doi: 10.3390/pathogens11050535. [12] M. S. Sarwar, N. Jahan, A. Ali, H. K. Yousaf, and I. Munzoor, “Establishment of Wolbachia infection in Aedes aegypti from Pakistan via embryonic microinjection and semi-field evaluation of general fitness of resultant mosquito population,” Parasites and Vectors, vol. 15, no. 1, Dec. 2022, doi: 10.1186/s13071-022-05317-4. [13] P. A. Hancock, S. P. Sinkins, and H. C. J. Godfray, “Strategies for introducing Wolbachia to reduce transmission of Mosquito- borne diseases,” PLoS Neglected Tropical Diseases, vol. 5, no. 4, Apr. 2011, doi: 10.1371/journal.pntd.0001024. [14] Z. Qu, L. Xue, and J. M. Hyman, “Modeling the transmission of Wolbachia in mosquitoes for Controlling Mosquito-Borne Diseases,” SIAM Journal on Applied Mathematics, vol. 78, no. 2, pp. 826–852, Jan. 2018, doi: 10.1137/17M1130800. [15] K. M. O’Reilly et al., “Estimating the burden of dengue and the impact of release of wMel Wolbachia-infected mosquitoes in Indonesia: a modelling study,” BMC Medicine, vol. 17, no. 1, Dec. 2019, doi: 10.1186/s12916-019-1396-4. [16] W. Tantowijoyo et al., “Spatial and temporal variation in Aedes aegypti and Aedes albopictus (Diptera: Culicidae) numbers in the Yogyakarta Area of Java, Indonesia, with implications for Wolbachia releases,” Journal of Medical Entomology, vol. 53, no. 1, pp. 188–198, Jan. 2016, doi: 10.1093/jme/tjv180. [17] M. H. T. Chan and P. S. Kim, “Modelling a Wolbachia invasion using a slow–fast dispersal reaction–diffusion approach,” Bulletin of Mathematical Biology, vol. 75, no. 9, pp. 1501–1523, Sep. 2013, doi: 10.1007/s11538-013-9857-y. [18] M. Z. Ndii and A. K. Supriatna, “Stochastic dengue mathematical model in the presence of Wolbachia: exploring the disease extinction,” Nonlinear Dynamics and Systems Theory, vol. 20, no. 2, pp. 1–14, 2020. [19] M. Z. Ndii, E. Carnia, and A. K. Supriatna, “Mathematical models for the spread of rumors: a review,” in Issues and Trends in Interdisciplinary Behavior and Social Science, CRC Press, 2018, pp. 65–73. [20] T. Pang, T. K. Mak, and D. J. Gubler, “Prevention and control of dengue—the light at the end of the tunnel,” The Lancet Infectious Diseases, vol. 17, no. 3, pp. 79–87, Mar. 2017, doi: 10.1016/S1473-3099(16)30471-6. [21] A. Abidemi and N. A. B. Aziz, “Analysis of deterministic models for dengue disease transmission dynamics with vaccination perspective in Johor, Malaysia,” International Journal of Applied and Computational Mathematics, vol. 8, no. 1, Feb. 2022, doi: 10.1007/s40819-022-01250-3. [22] A. Abidemi and N. A. B. Aziz, “Optimal control strategies for dengue fever spread in Johor, Malaysia,” Computer Methods and Programs in Biomedicine, vol. 196, Nov. 2020, doi: 10.1016/j.cmpb.2020.105585.](https://image.slidesharecdn.com/v9030847emf-230621071431-19367605/75/Genetic-algorithm-to-optimization-mobility-based-dengue-mathematical-model-11-2048.jpg)
![ ISSN: 2088-8708 Int J Elec & Comp Eng, Vol. 13, No. 4, August 2023: 4535-4546 4546 [23] W. Sanusi et al., “Analysis and simulation of SIRS model for dengue fever transmission in South Sulawesi, Indonesia,” Journal of Applied Mathematics, vol. 2021, pp. 1–8, Jan. 2021, doi: 10.1155/2021/2918080. [24] D. Aldila, T. Götz, and E. Soewono, “An optimal control problem arising from a dengue disease transmission model,” Mathematical Biosciences, vol. 242, no. 1, pp. 9–16, Mar. 2013, doi: 10.1016/j.mbs.2012.11.014. [25] L. Zou, J. Chen, X. Feng, and S. Ruan, “Analysis of a dengue model with vertical transmission and application to the 2014 dengue outbreak in Guangdong Province, China,” Bulletin of Mathematical Biology, vol. 80, no. 10, pp. 2633–2651, Oct. 2018, doi: 10.1007/s11538-018-0480-9. [26] D. Cardona-Salgado, D. E. Campo-Duarte, L. S. Sepulveda-Salcedo, and O. Vasilieva, “Wolbachia-based biocontrol for dengue reduction using dynamic optimization approach,” Applied Mathematical Modelling, vol. 82, pp. 125–149, Jun. 2020, doi: 10.1016/j.apm.2020.01.032. [27] P. L. Delamater, E. J. Street, T. F. Leslie, Y. T. Yang, and K. H. Jacobsen, “Complexity of the basic reproduction number (R 0),” Emerging Infectious Diseases, vol. 25, no. 1, pp. 1–4, Jan. 2019, doi: 10.3201/eid2501.171901. [28] D. N. Mashudi, N. Ahmad, and S. Mohd Said, “Level of dengue preventive practices and associated factors in a Malaysian residential area during the COVID-19 pandemic: A cross-sectional study,” PLOS ONE, vol. 17, no. 4, Apr. 2022, doi: 10.1371/journal.pone.0267899. BIOGRAPHIES OF AUTHORS Tegar Arifin Prasetyo current Lecturer and Researcher member in Information Technology Department at Institut Teknologi Del since 2020. Have experience at specializing in building mathematical model, machine learning model, analytical android tools development, control system, and computer programming. He dedicates himself to university teaching and conducting research. His research interests include artificial intelligence, machine learning and algorithm computational, optimal control, mathematical model in epidemiology and bioinformatics. He can be contacted at email: tegar.prasetyo@del.ac.id or arifintegar12@gmail.com. Roberd Saragih received his B.S. degree in mathematics and a Magister’s degree in instrumentation and control from Institut Teknologi Bandung, Indonesia, in 1986, and 1993, respectively. He received a Ph.D. degree in mechanical engineering from Keio University, Japan, in 1998. From 1989, he joined the Department of Mathematics, Institut Teknologi Bandung, where he is currently a professor of mathematics. His general area of interest is robust control, system theory, and stochastic control. He can be contacted at email: roberd@math.ac.id or roberdsaragih58@gmail.com. Dewi Handayani received the B.S. degree, magister degree, and doctor degree in mathematics from Bandung Institute of Technology. She is current Lecturer and Researcher member in Department of Mathematics at Institut Teknologi Bandung. Her general area of interest is biomathematical model, robust control, stochastic control and system theory. She can be contacted at email: dewi.handayani@math.itb.ac.id.](https://image.slidesharecdn.com/v9030847emf-230621071431-19367605/75/Genetic-algorithm-to-optimization-mobility-based-dengue-mathematical-model-12-2048.jpg)