Downloaded 61 times
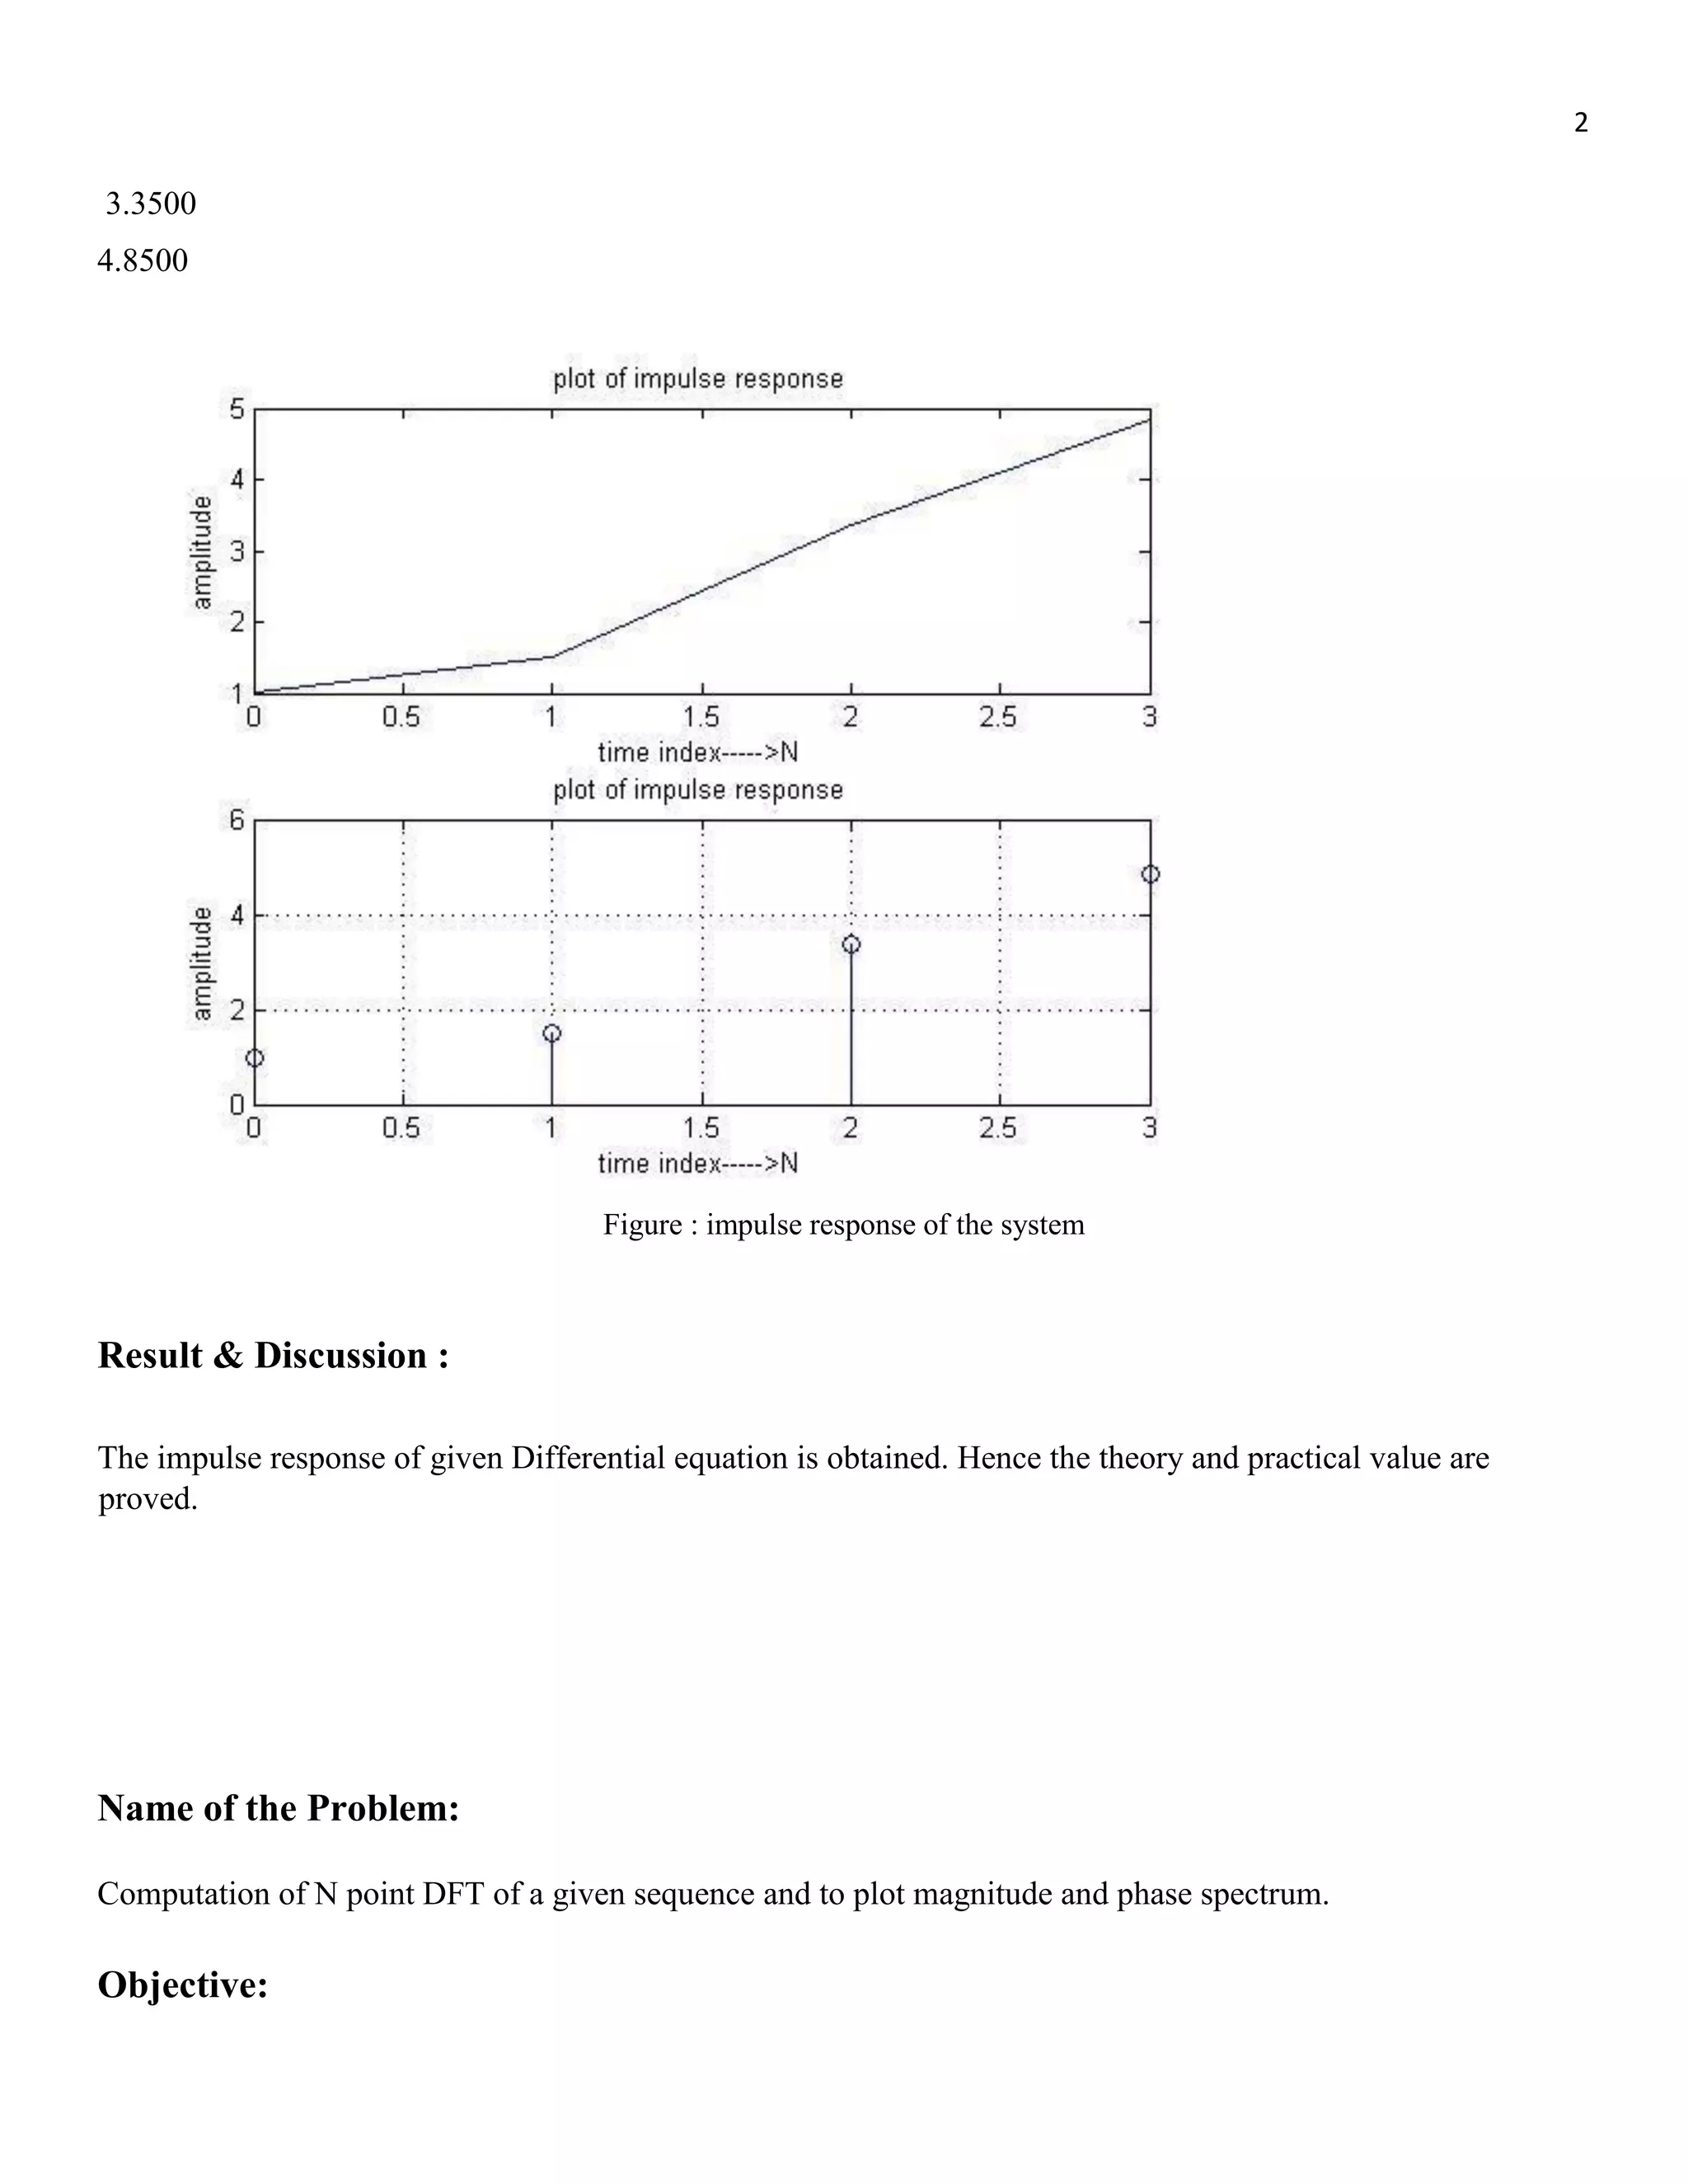
![1 Alamgir Hossain, CSE, JUST Name of the Problem: To write a Matlab program to evaluate the impulse response of the system. Objective: To write a MATLAB program to evaluate the impulse response of the system using MATlab. Requirements: Operating System - Windows XP Constructor - Simulator Software - CCStudio 3 & MATLAB 7.5 Source Program : % Difference equation of a second order system % y(n) = x(n)+0.5x(n-1)+0.85x(n-2)+y(n-1)+y(n-2) b=input('enter the coefficients of x(n),x(n-1)-----'); a=input('enter the coefficients of y(n),y(n-1)----'); N=input('enter the number of samples of imp response '); [h,t]=impz(b,a,N); subplot(2,1,1); % figure(1); plot(t,h); title('plot of impulse response'); ylabel('amplitude'); xlabel('time index----->N'); subplot(2,1,2); % figure(2); stem(t,h); title('plot of impulse response'); ylabel('amplitude'); xlabel('time index----->N'); disp(h); grid on; Input and Output : Enter the coefficients of x(n),x(n-1)-----[1 0.5 0.85] enter the coefficients of y(n),y(n-1)-----[1 -1 -1] enter the number of samples of imp respons 4 1.0000 1.5000](https://image.slidesharecdn.com/dsplabfinal-180131195132/75/Digital-signal-Processing-all-matlab-code-with-Lab-report-1-2048.jpg)
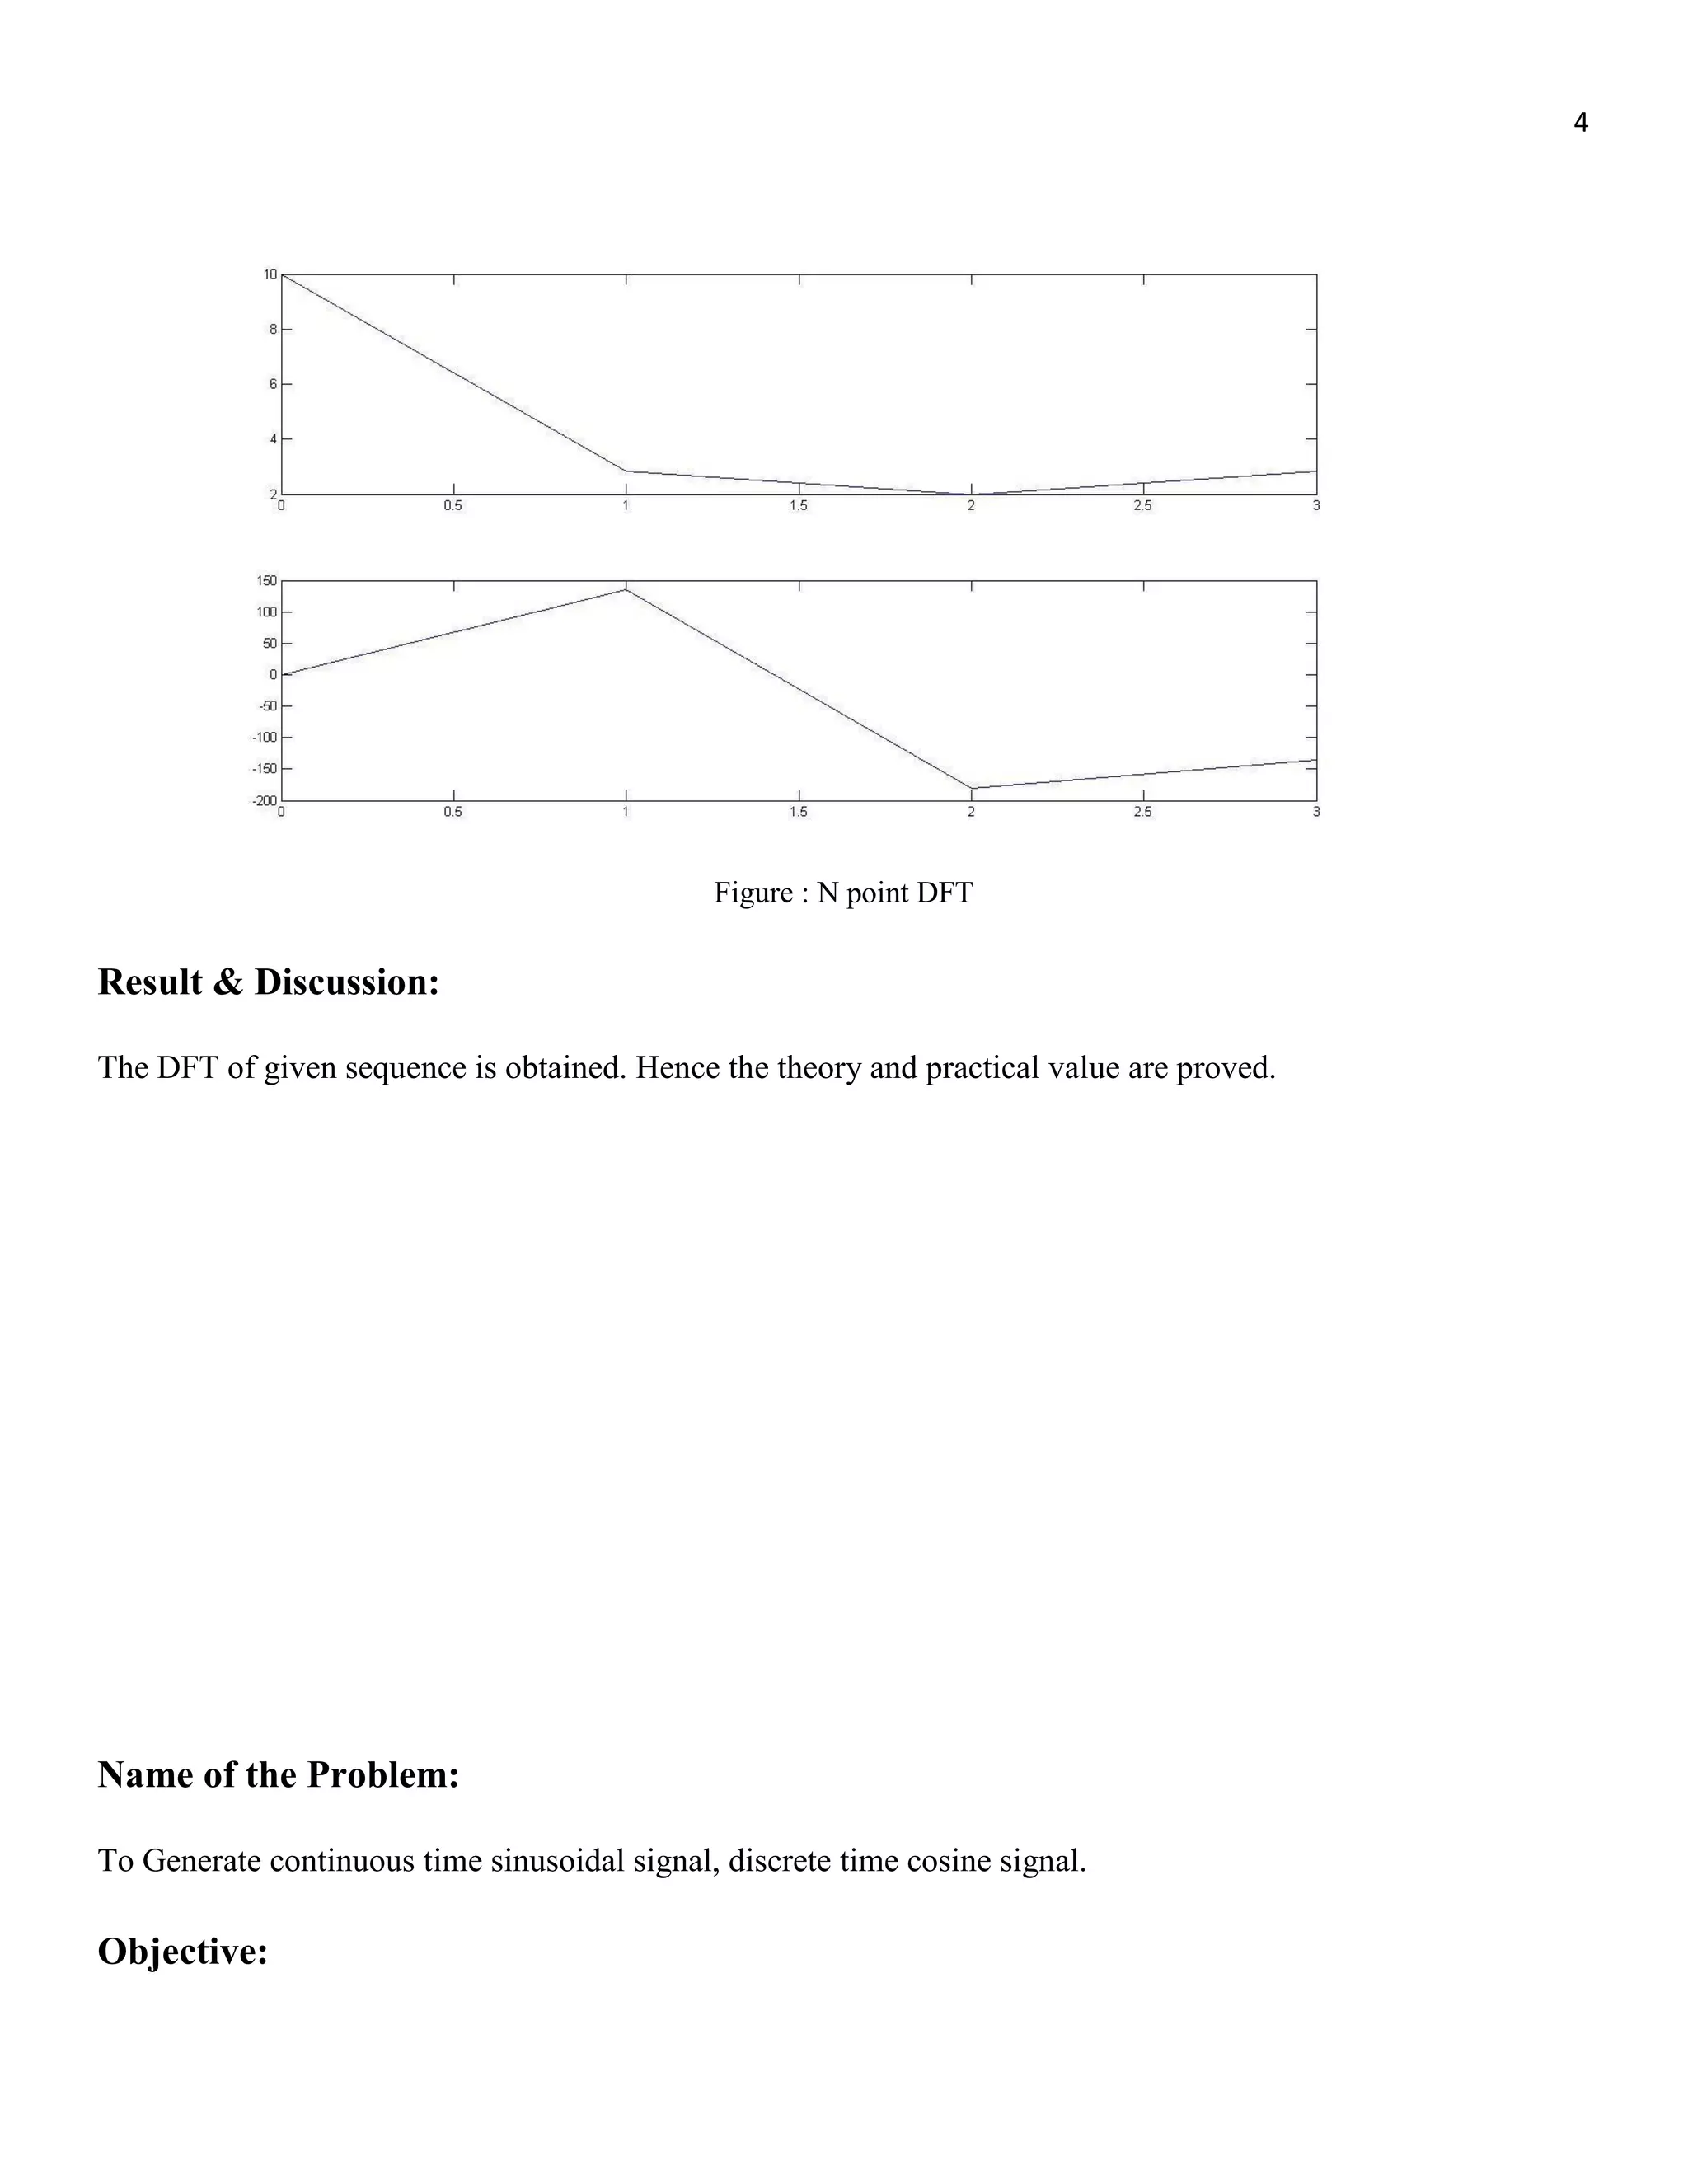
![3 To Computation of N point DFT of a given sequence and to plot magnitude and phase spectrum. Requirements: Operating System - Windows XP Constructor - Simulator Software - CCStudio 3 & MATLAB 7.5 Source Program: N = input('Enter the the value of N(Value of N in N-Point DFT)'); x = input('Enter the sequence for which DFT is to be calculated'); n=[0:1:N-1]; k=[0:1:N-1]; WN=exp(-1j*2*pi/N); % twiddle factor nk=n'*k; WNnk=WN.^nk; Xk=x*WNnk; MagX=abs(Xk) % Magnitude of calculated DFT PhaseX=angle(Xk)*180/pi % Phase of the calculated DFT figure(1); subplot(2,1,1); plot(k,MagX); subplot(2,1,2); plot(k,PhaseX); Input and Output : Enter the the value of N(Value of N in N-Point DFT)4 Enter the sequence for which DFT is to be calculated [1 2 3 4] MagX = 10.0000 2.8284 2.0000 2.8284 PhaseX = 0 135.0000 -180.0000 -135.0000 DFT of the given sequence is 10.0000 -2.0000 + 2.0000i -2.0000 - 0.0000i -2.0000 - 2.0000i](https://image.slidesharecdn.com/dsplabfinal-180131195132/75/Digital-signal-Processing-all-matlab-code-with-Lab-report-3-2048.jpg)
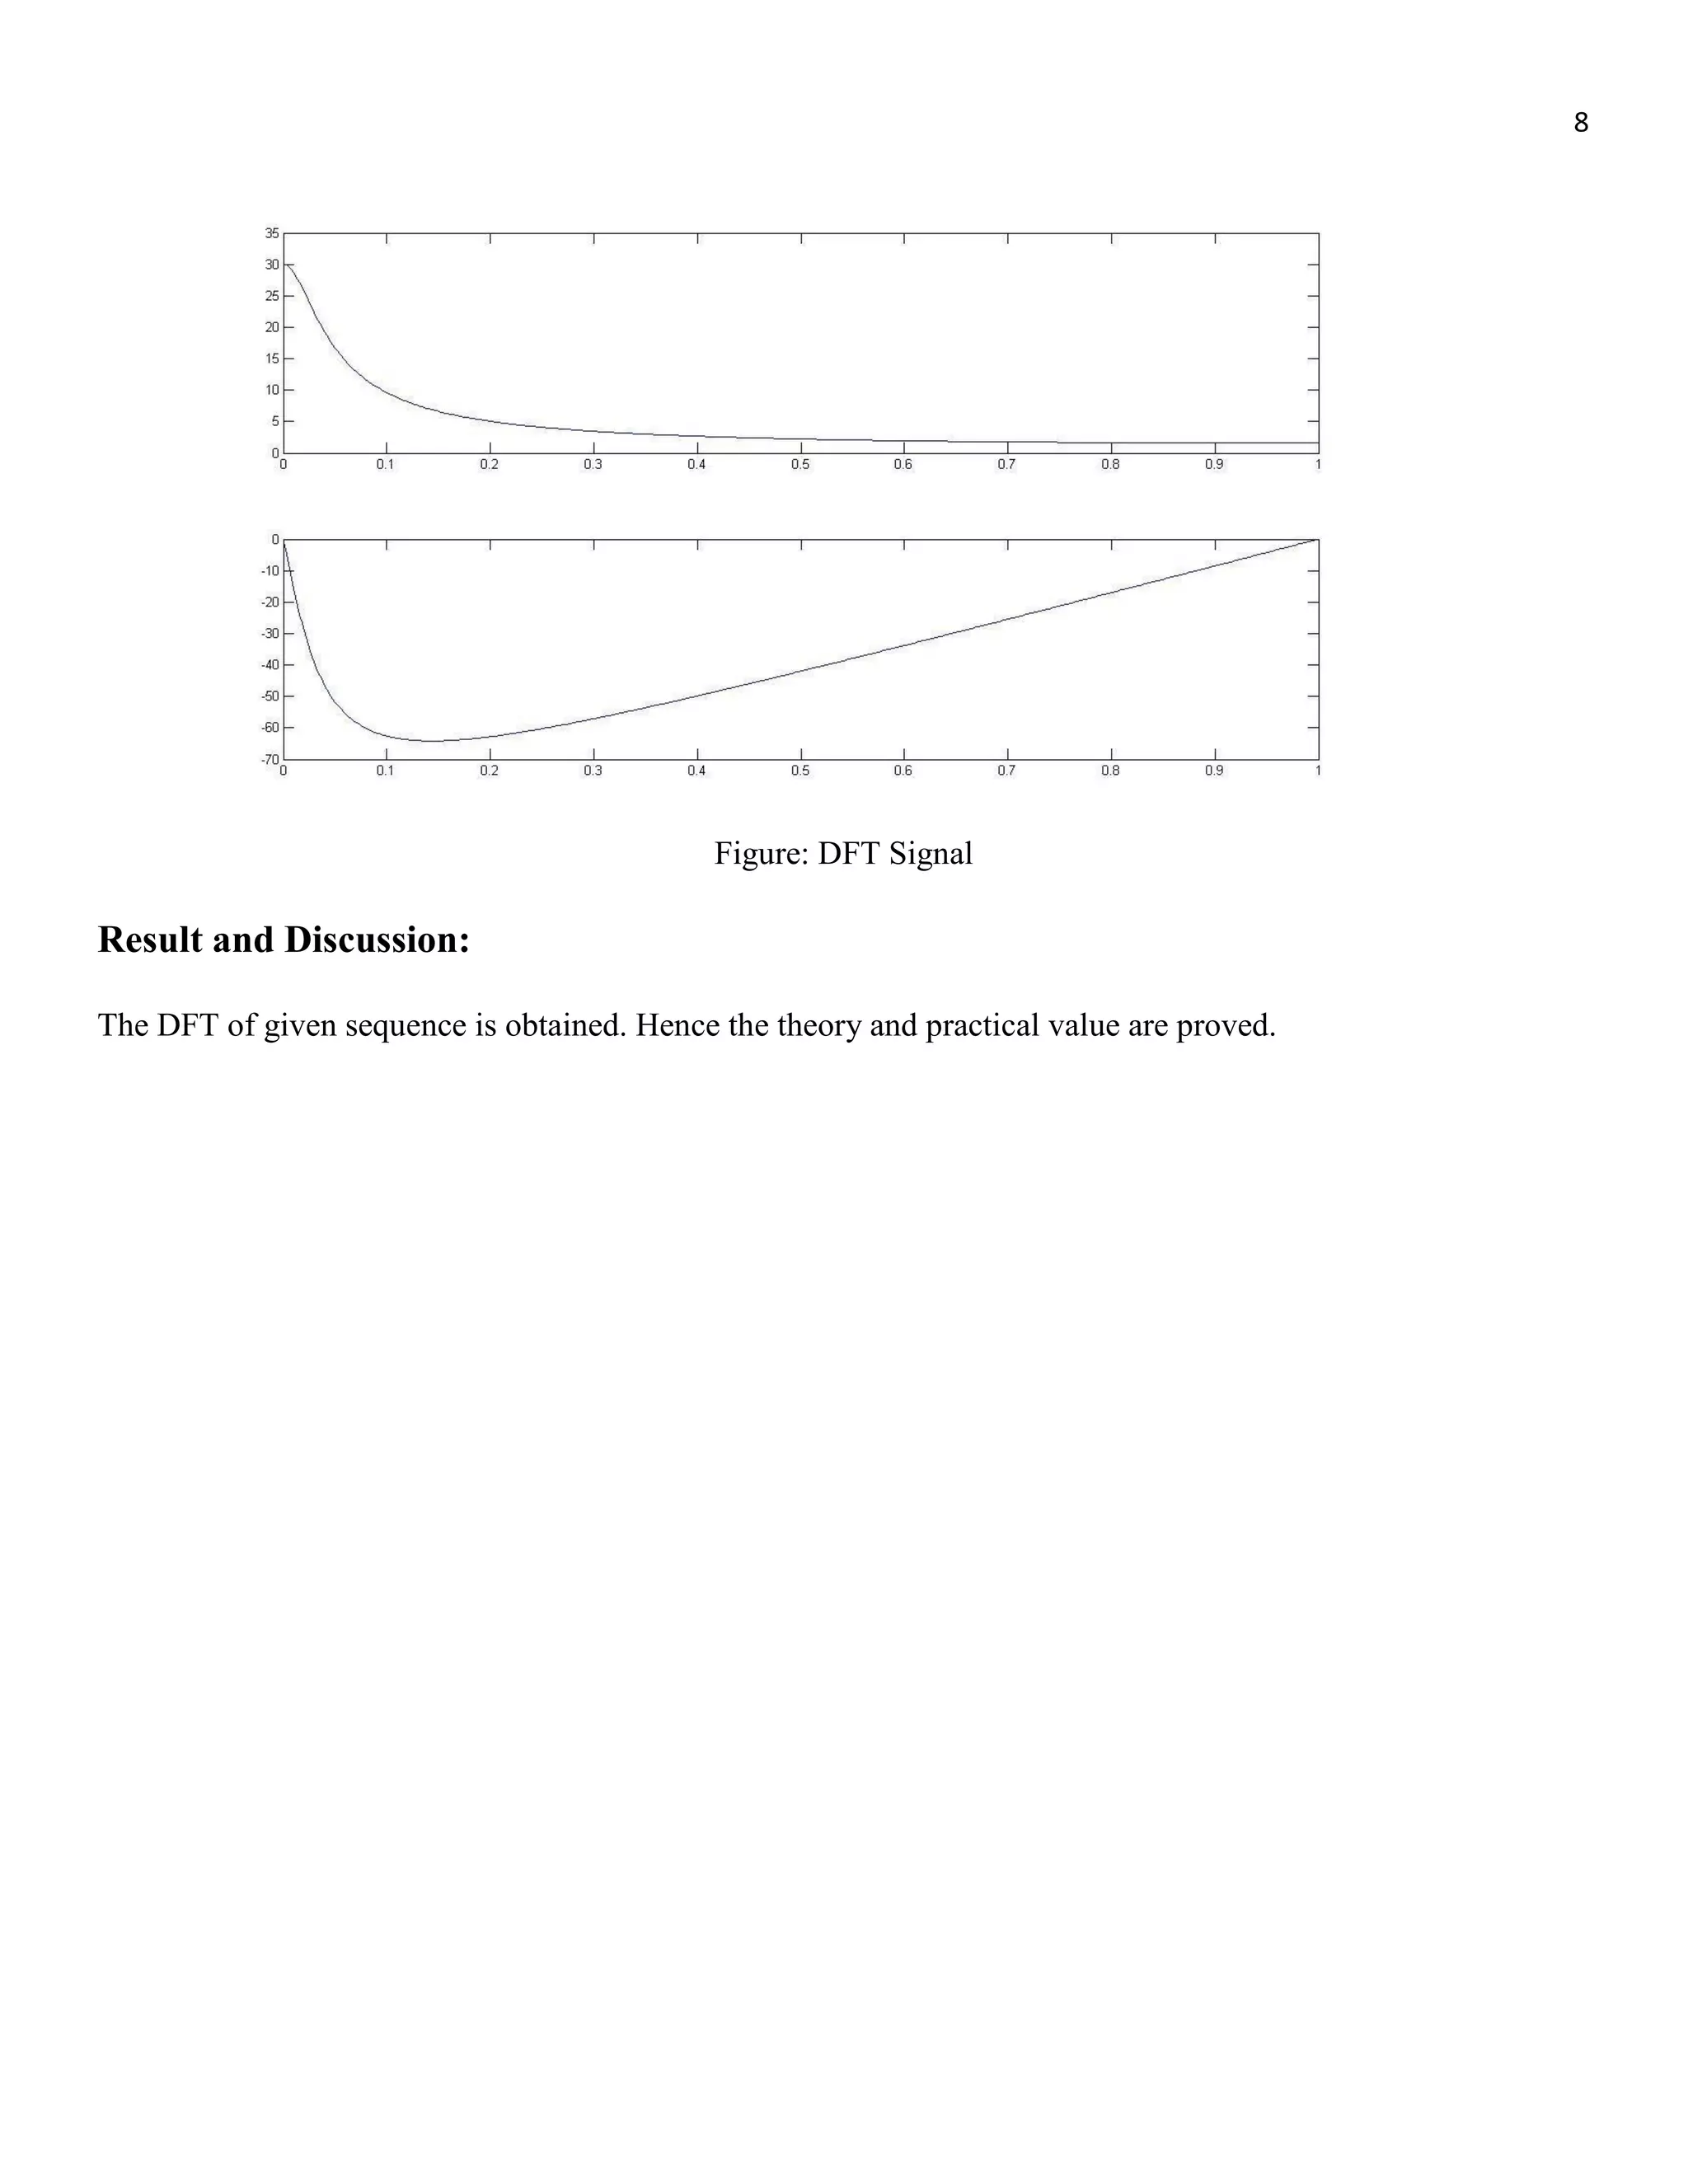
![7 Name of the Problem: To find the DFT / IDFT of given signal. Objective: To find the DFT / IDFT of given signal using Matlab. Requirements: Operating System - Windows XP Constructor - Simulator Software - CCStudio 3 & MATLAB 7.5 Source Program: %DFT of a given Signal--------- w = [0:500]*pi/500; z = exp(- j*w); x = 3*(1-0.9*z).^(-1); a = abs(x); b = angle(x)*180/pi; subplot(2,1,1); plot(w/pi,a); subplot(2,1,2); plot(w/pi,b); Input and Output :](https://image.slidesharecdn.com/dsplabfinal-180131195132/75/Digital-signal-Processing-all-matlab-code-with-Lab-report-7-2048.jpg)
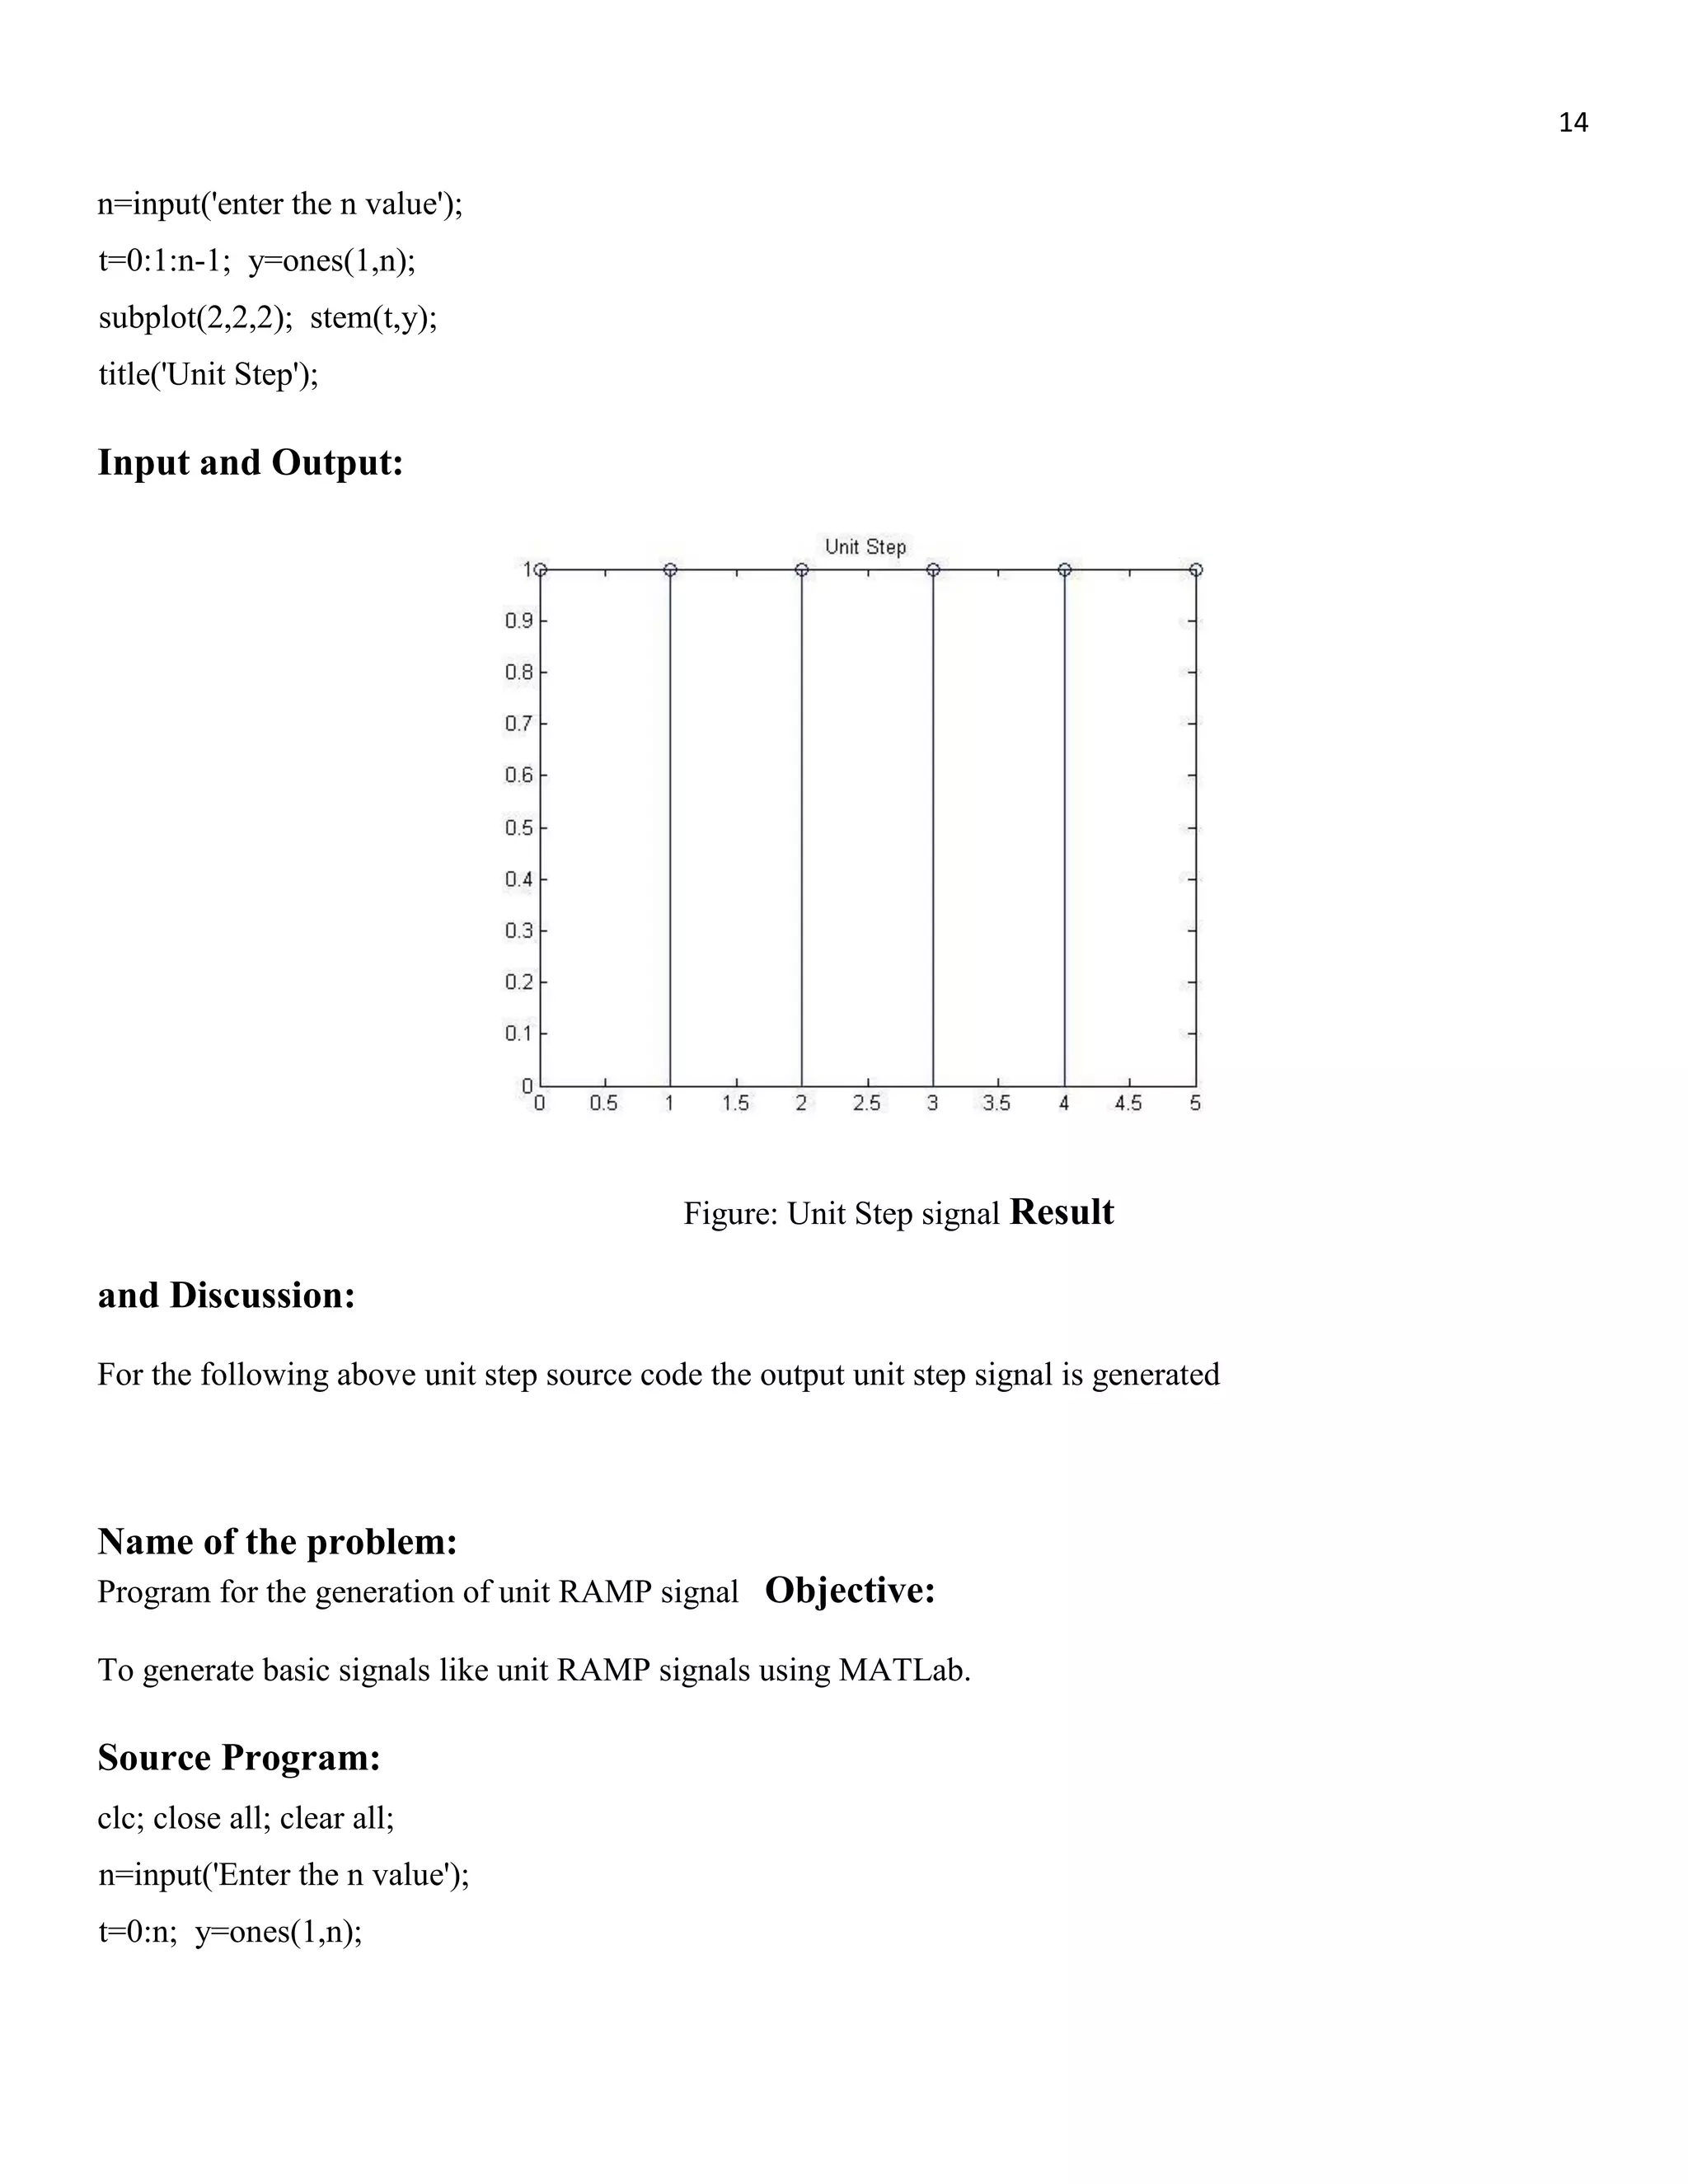
![13 To generate basic signals like unit impulse signals using MATLab. Source Program: t=-2:1:2; y=[zeros(1,2),ones(1,1),zeros(1,2)]; subplot(2,2,1); stem(t,y); title('Unit Impulse'); Input and Output: Figure: Unit Impulse Signals Result and Discussion: For the following above unit impulse signal code the output picture is generated. Name of the Problem: Program for the generation of UNIT step signal Objective: To generate basic signals like unit step signals using MATLab. Source Program:](https://image.slidesharecdn.com/dsplabfinal-180131195132/75/Digital-signal-Processing-all-matlab-code-with-Lab-report-13-2048.jpg)

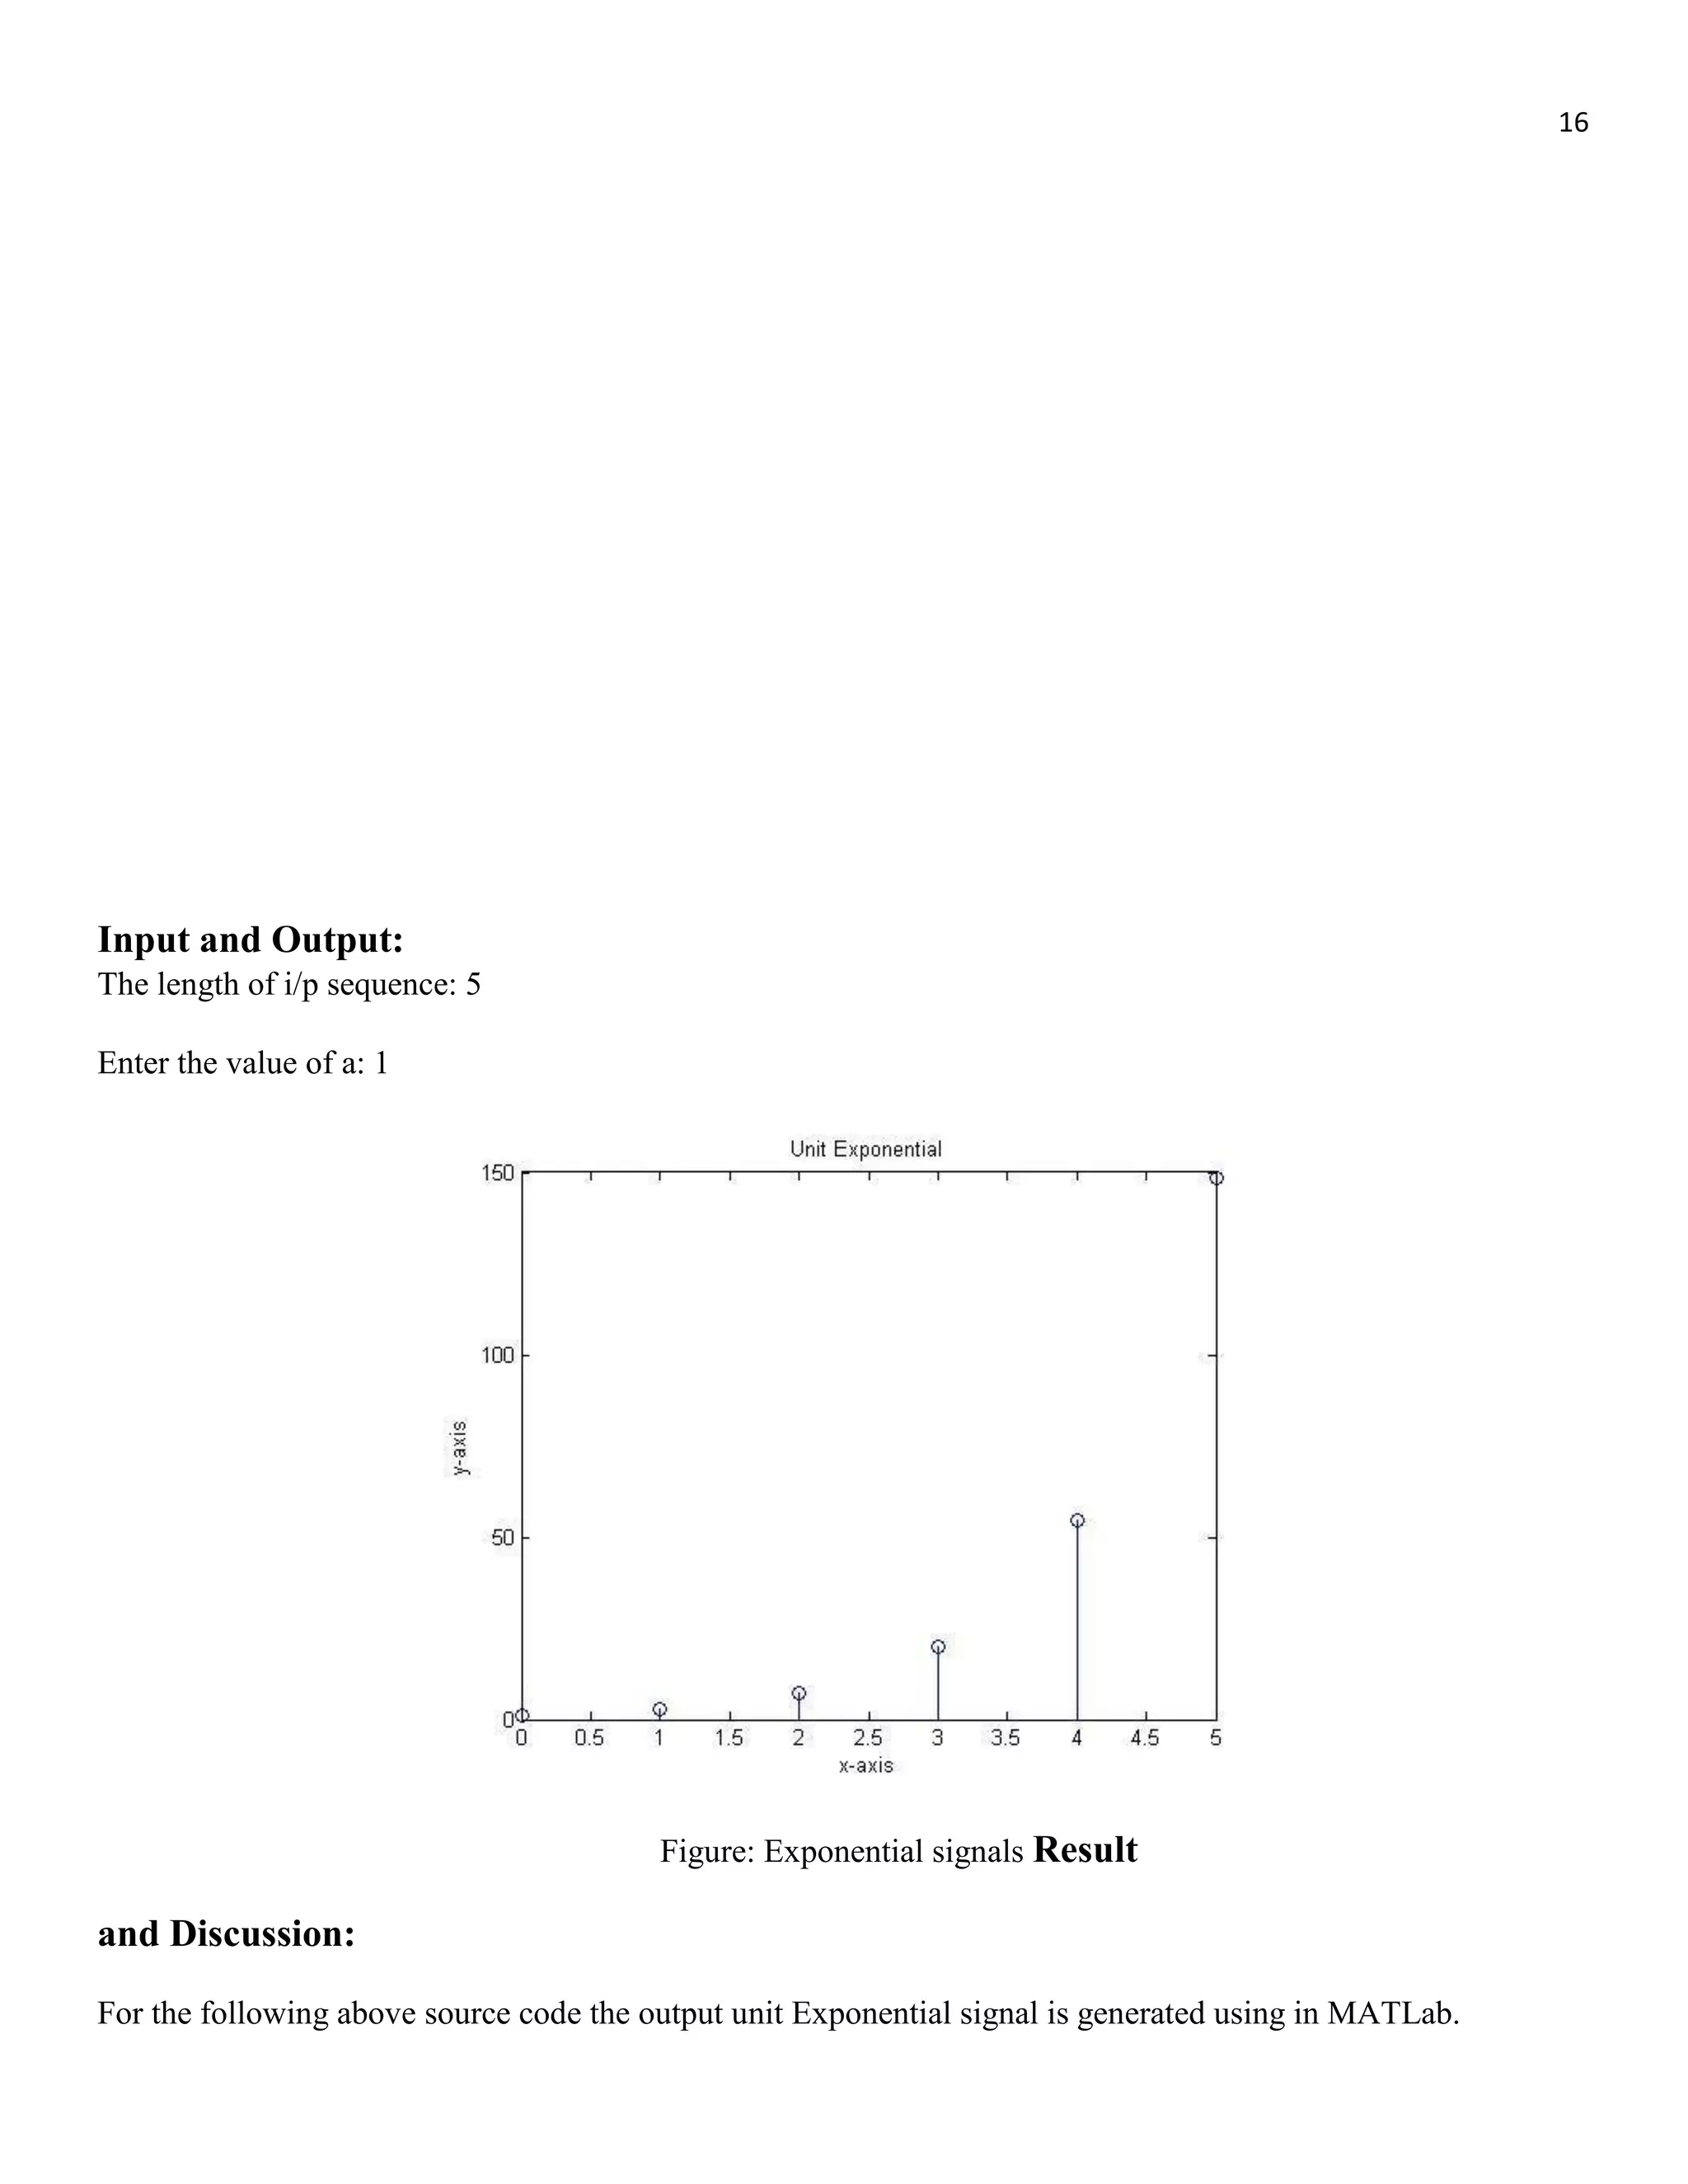


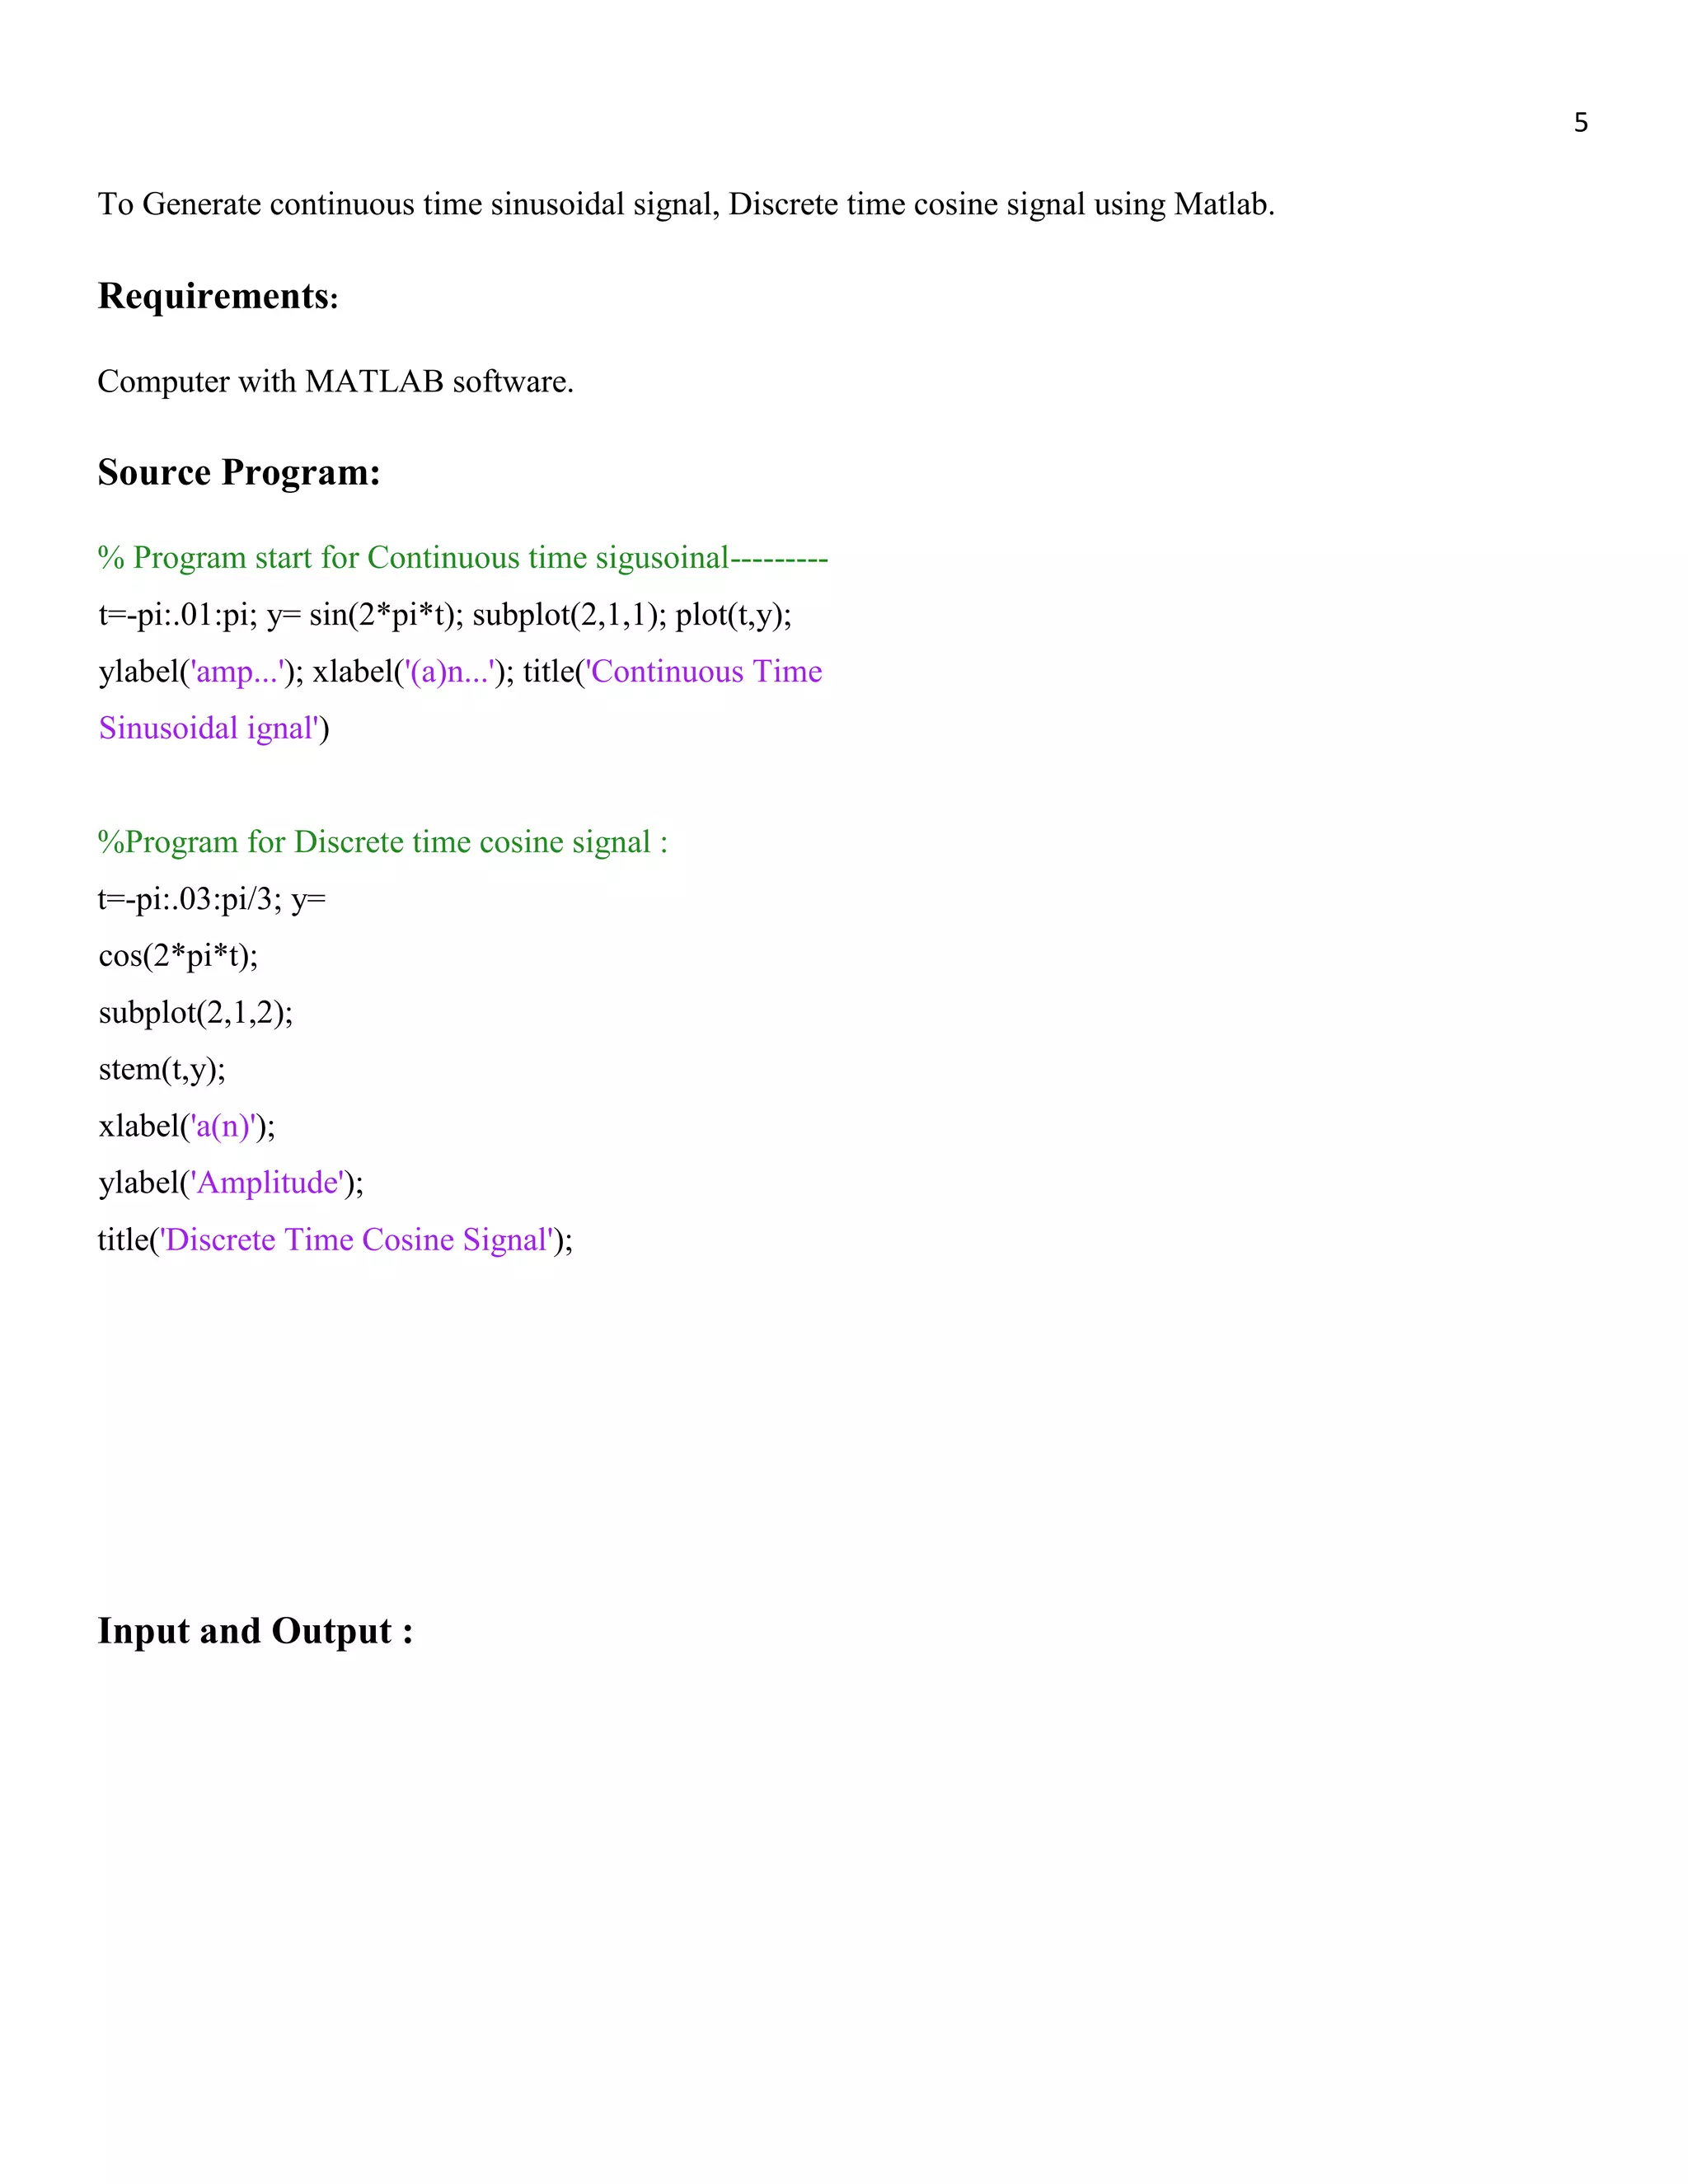
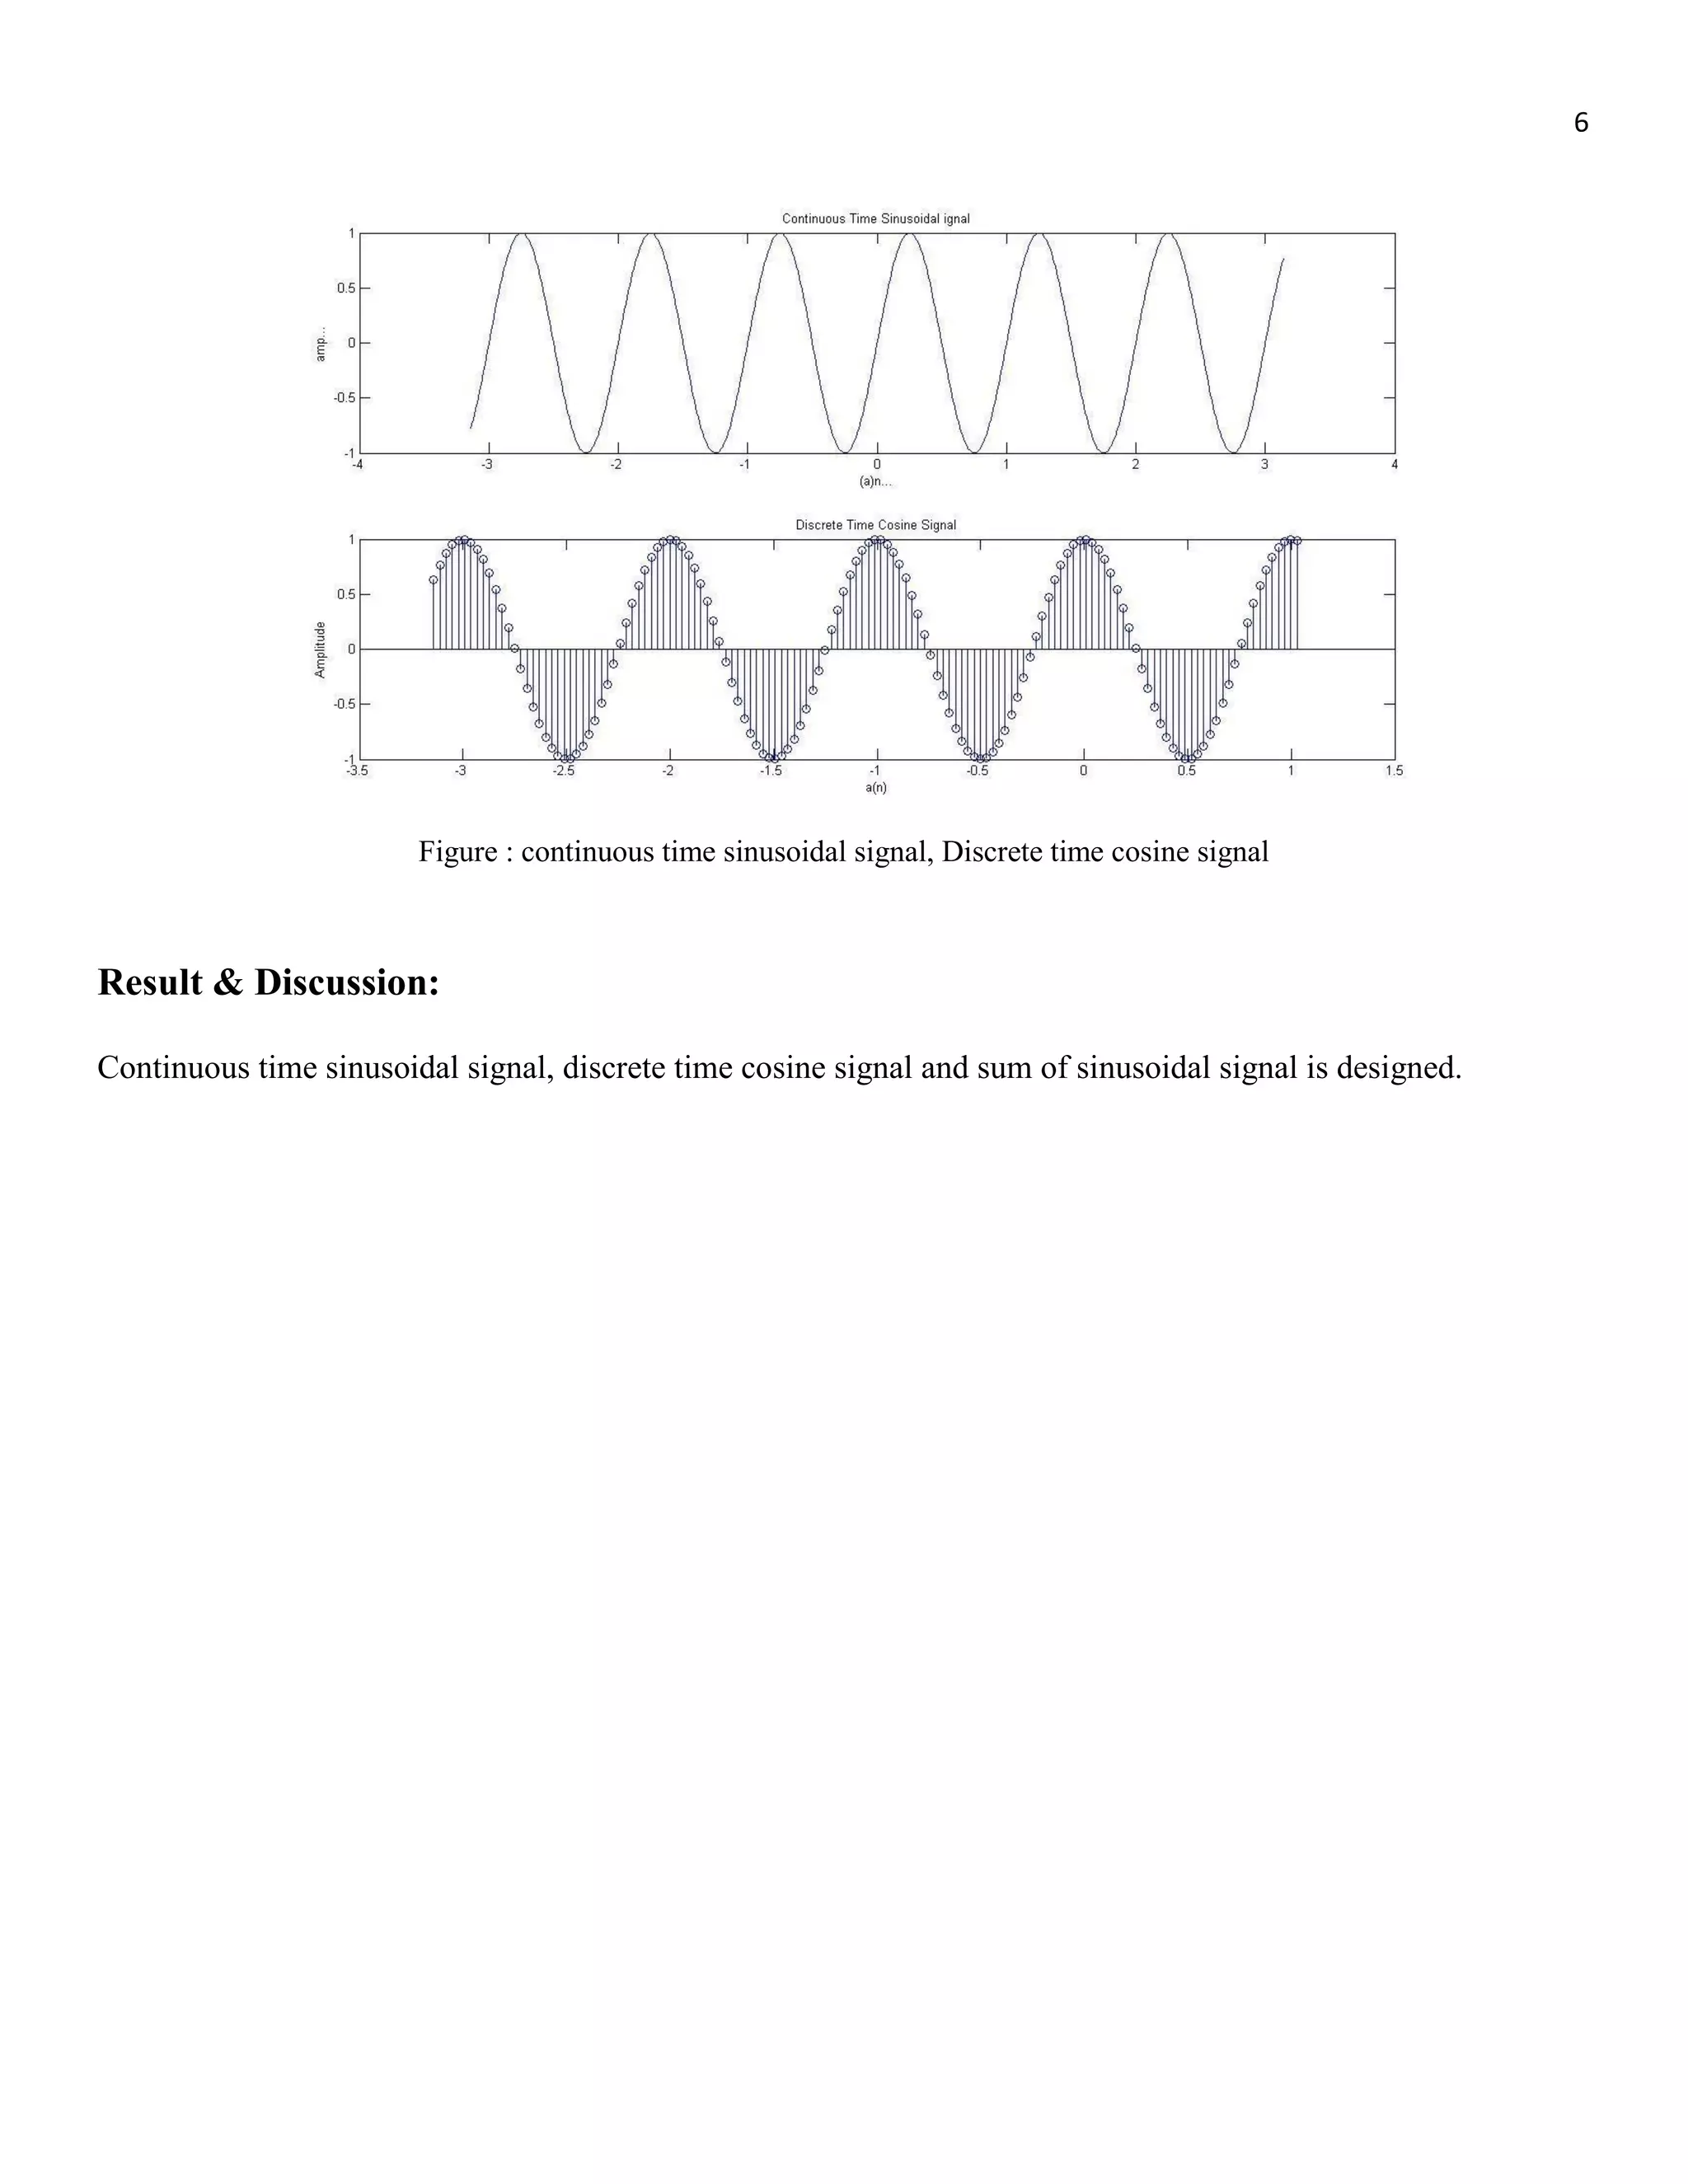
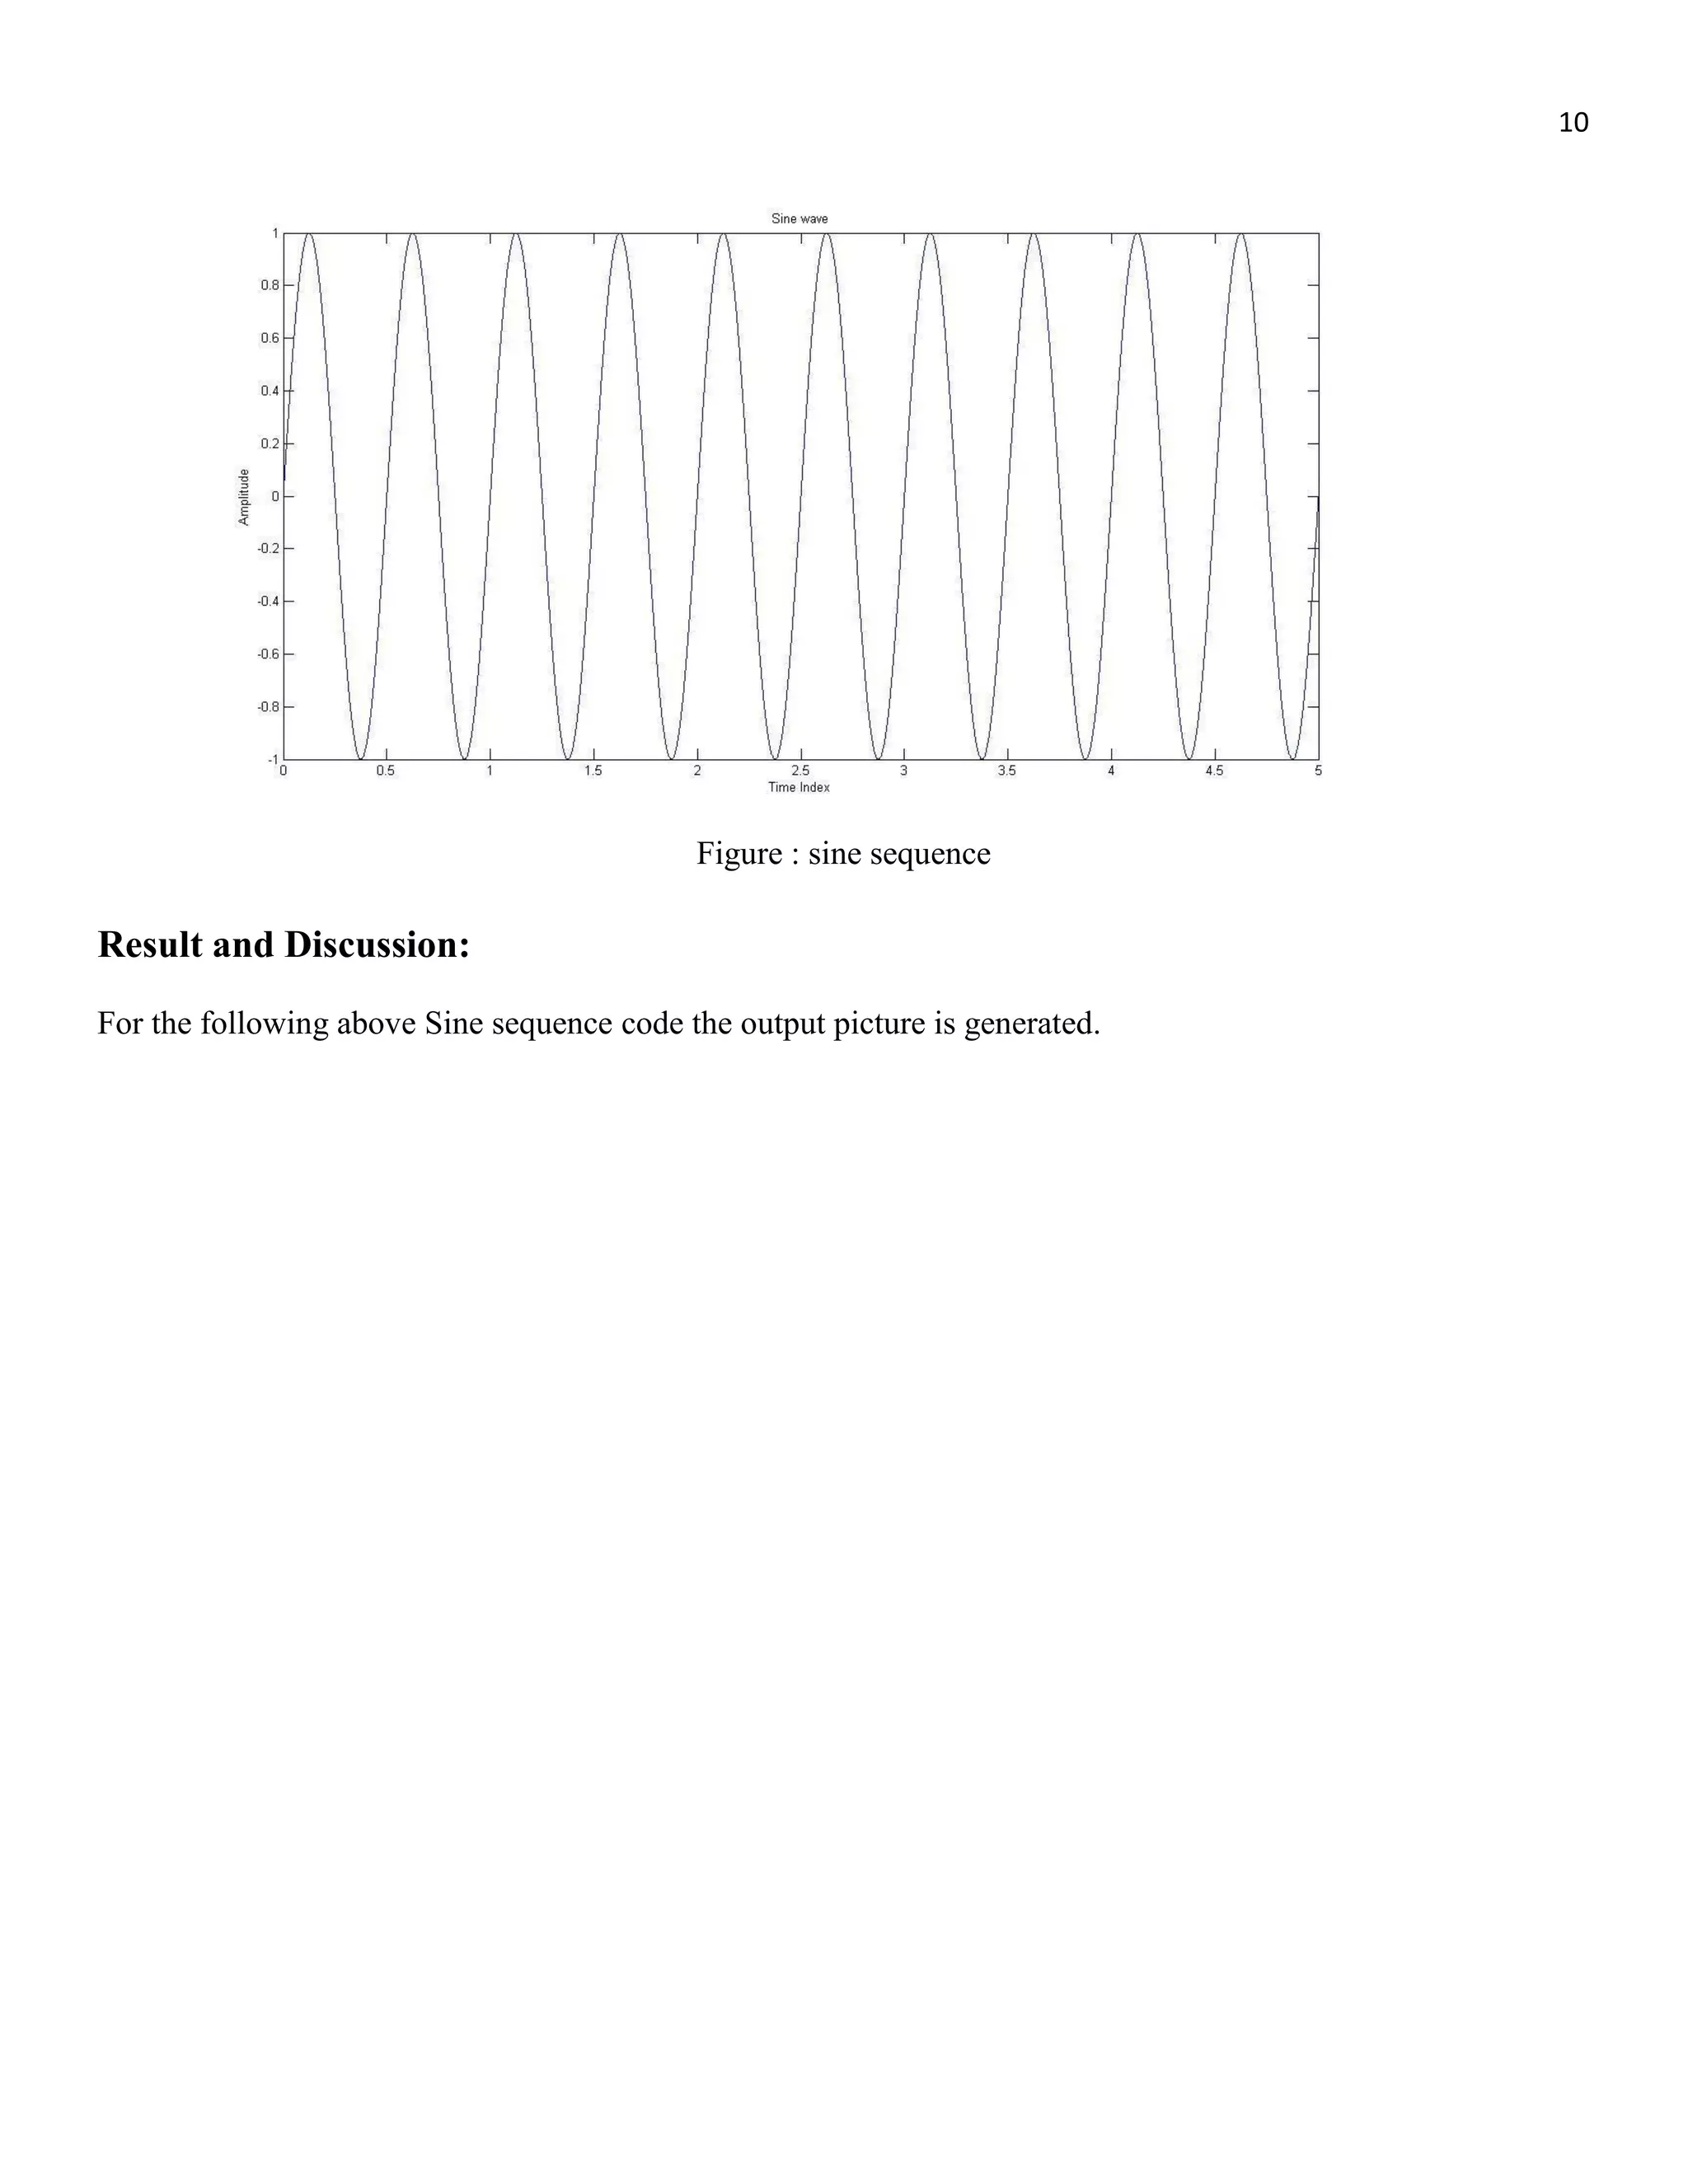
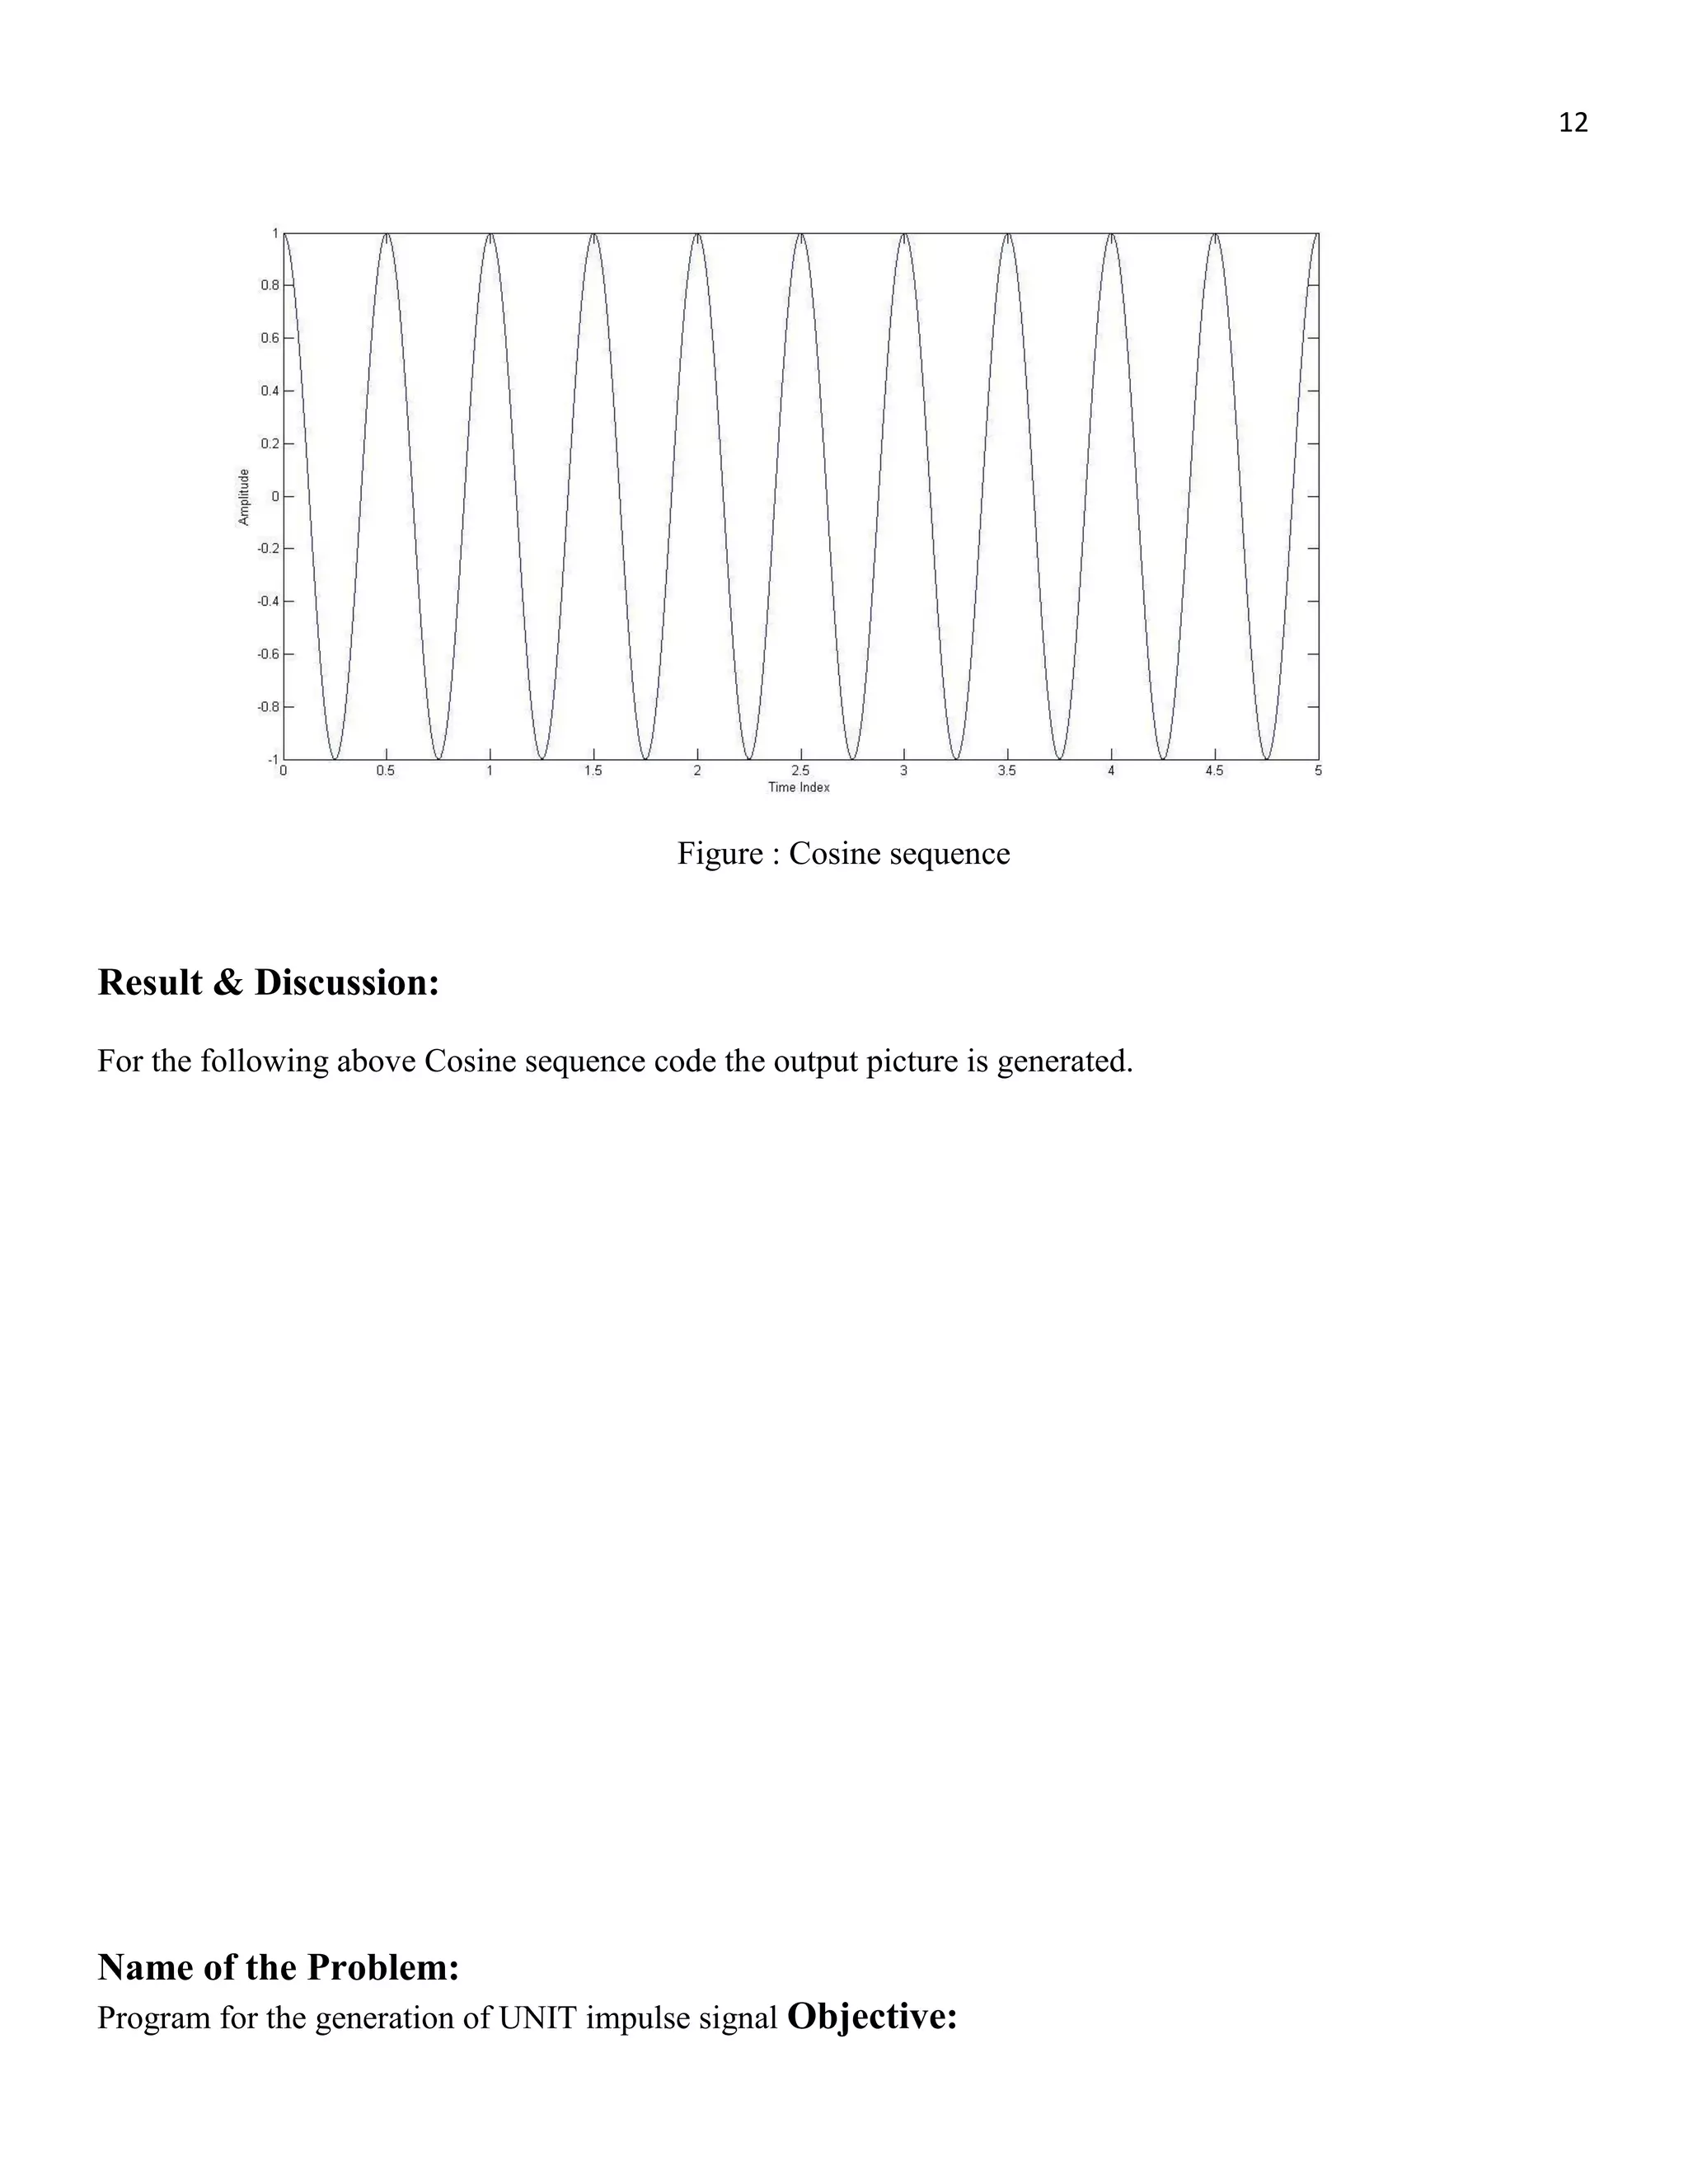
The document outlines various MATLAB programs developed by Alamgir Hossain to evaluate the impulse response of systems, compute Discrete Fourier Transforms (DFT), and generate different basic signals, including sine, cosine, unit impulse, unit step, unit ramp, and exponential signals. Each program includes objectives, requirements, source code, and discussions on the results obtained. The overall aim is to demonstrate the practical applications and theoretical understanding of signal processing using MATLAB.