Download to read offline


![ES Query DSL (cont.) ● Basic ES response format { # the results hits: { total: # total number of matched documents hits: [ _id: # id of the document max_score: # search index score (relevance with the search query) _source: {} # the actual JSON document which was indexed ], }, facets: {} }](https://image.slidesharecdn.com/unifiedlogginglayer-201109160934/75/Building-a-Unified-Logging-Layer-with-Fluentd-Elasticsearch-and-Kibana-37-2048.jpg)

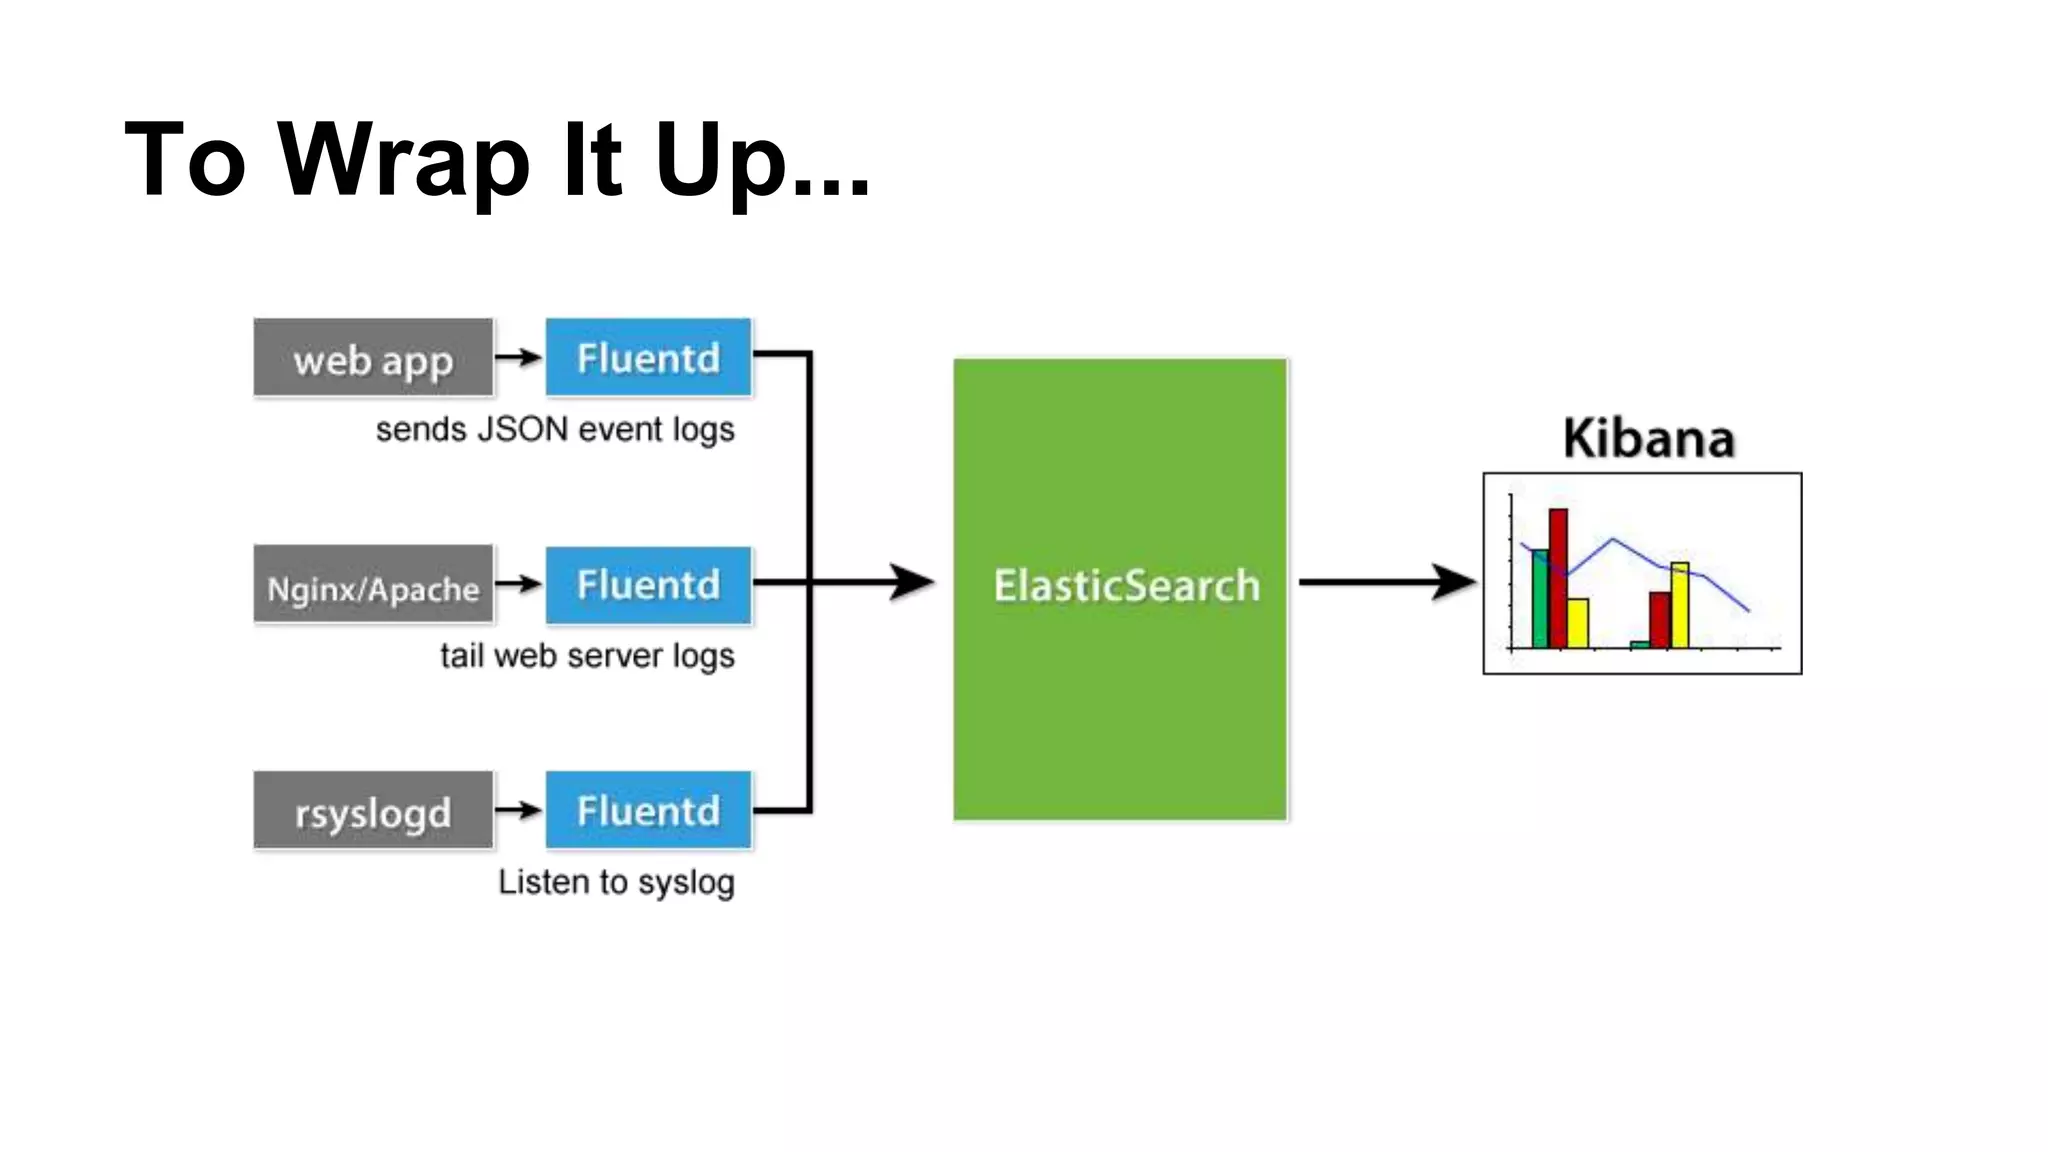


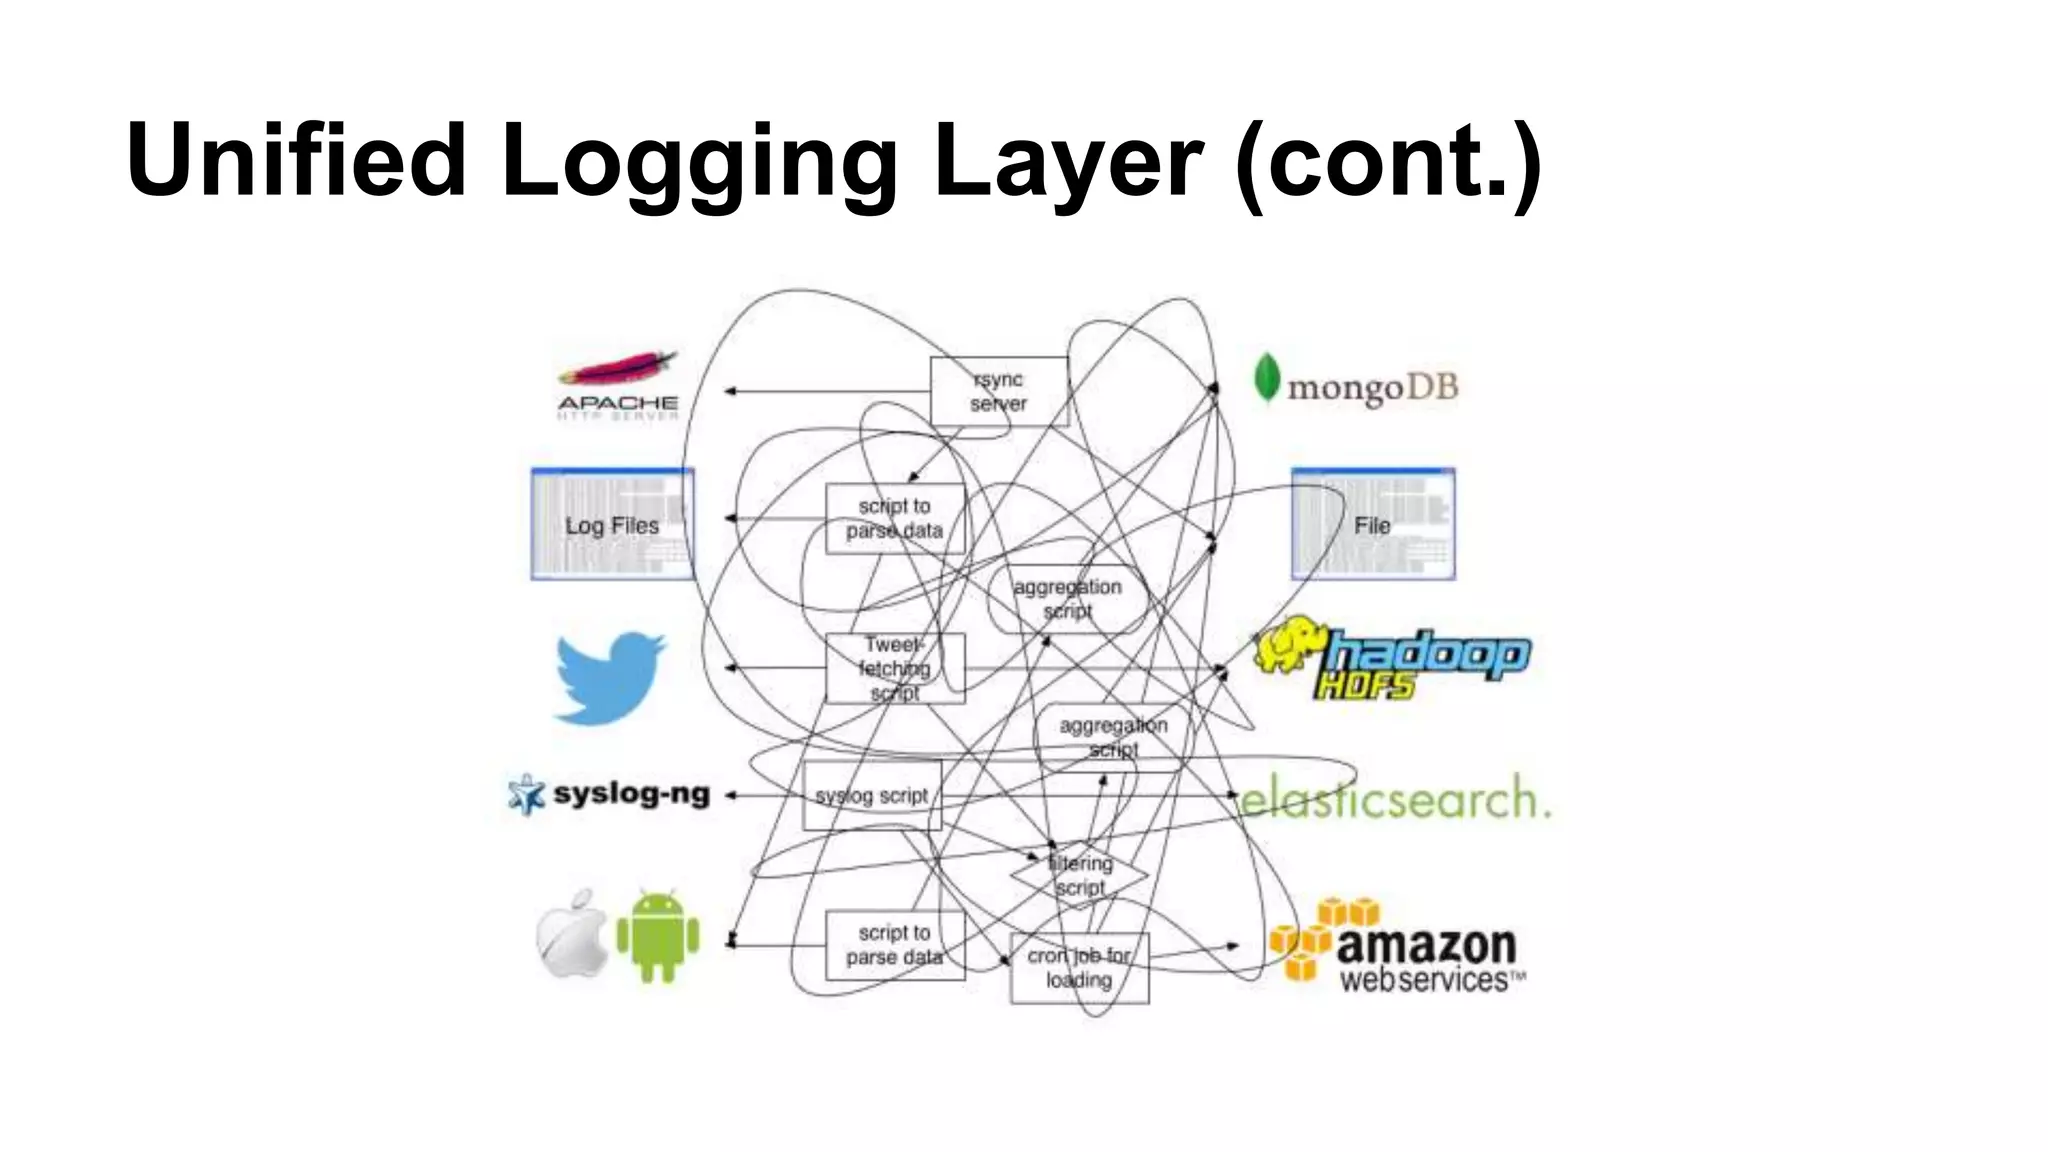
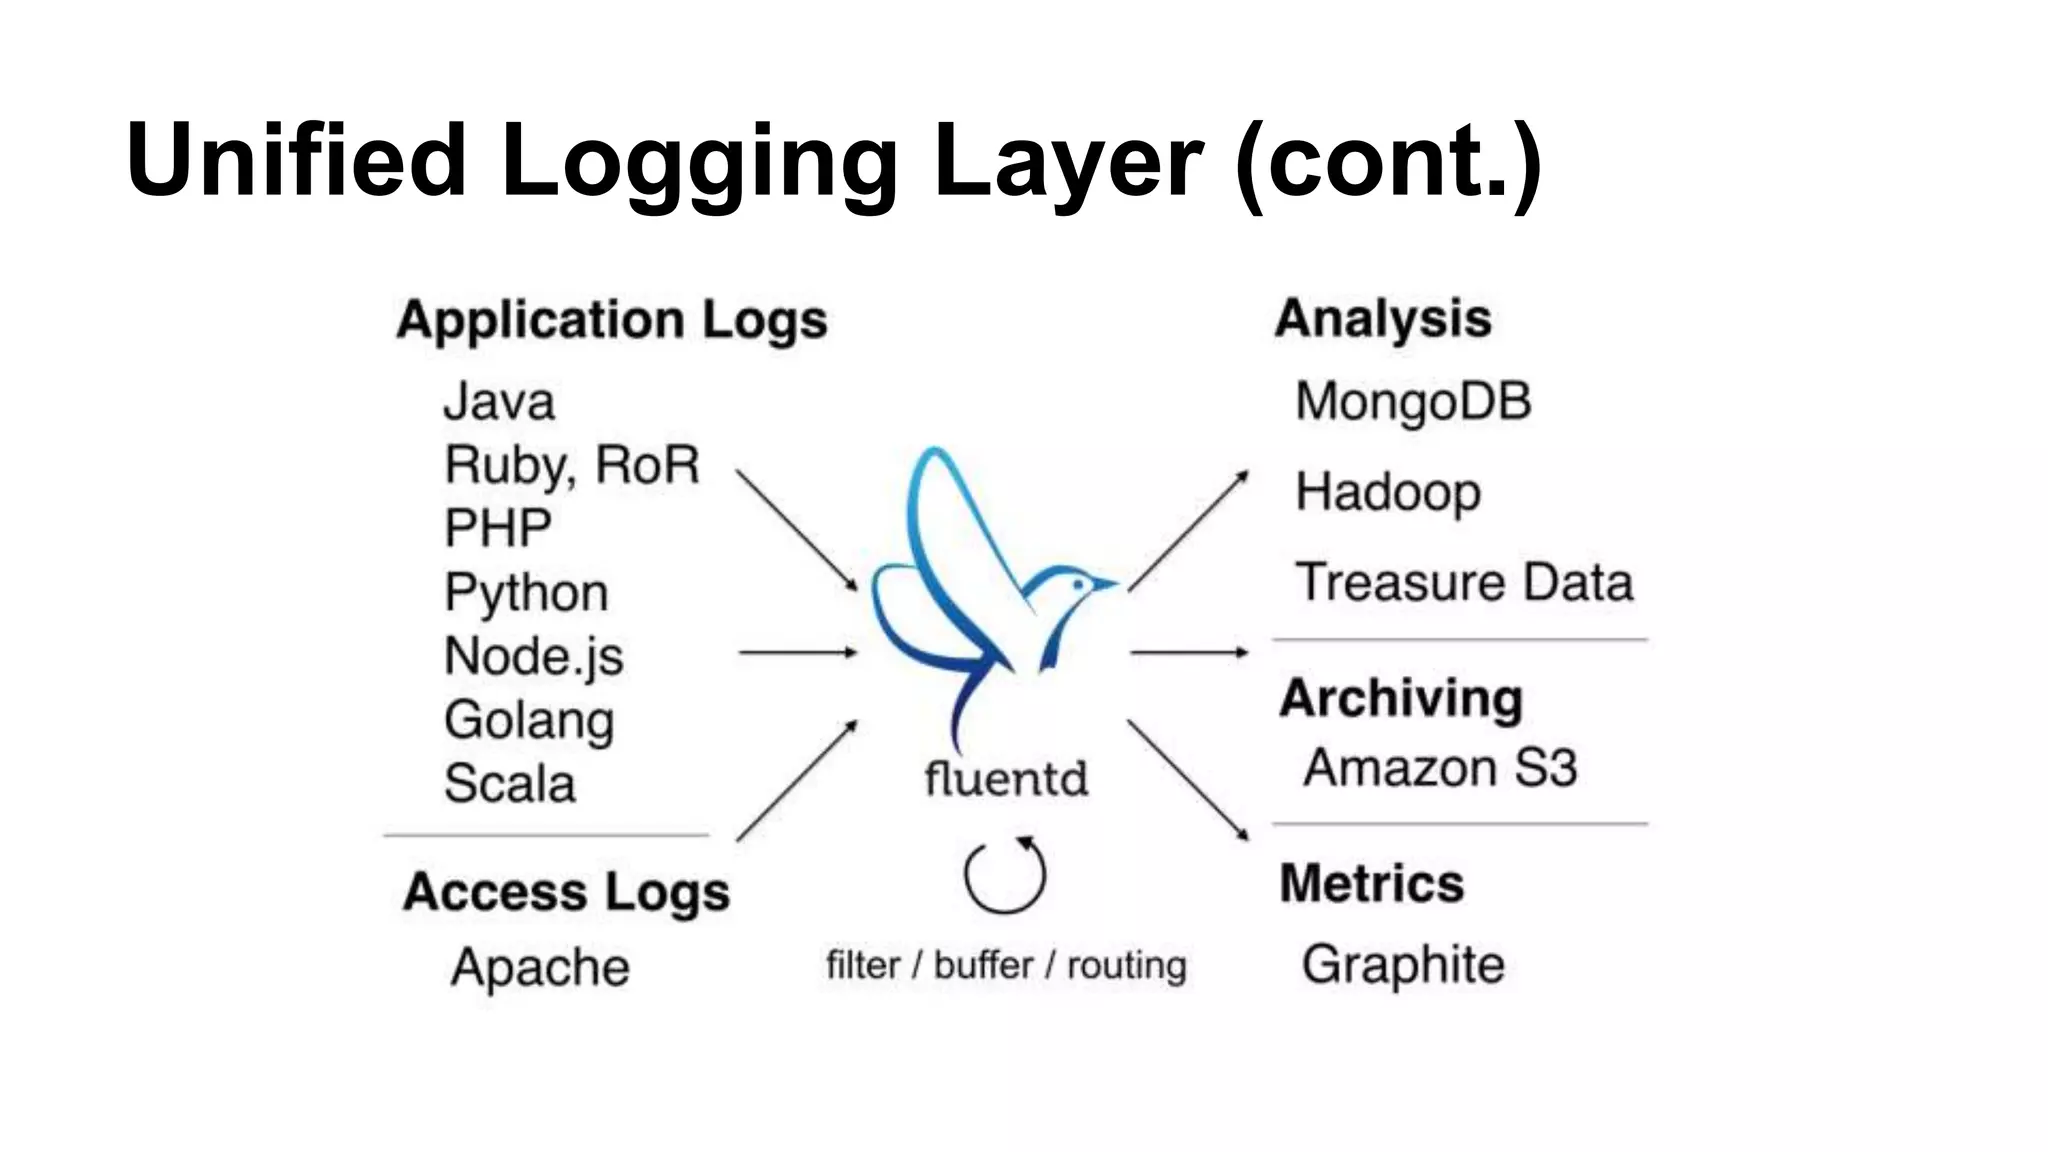
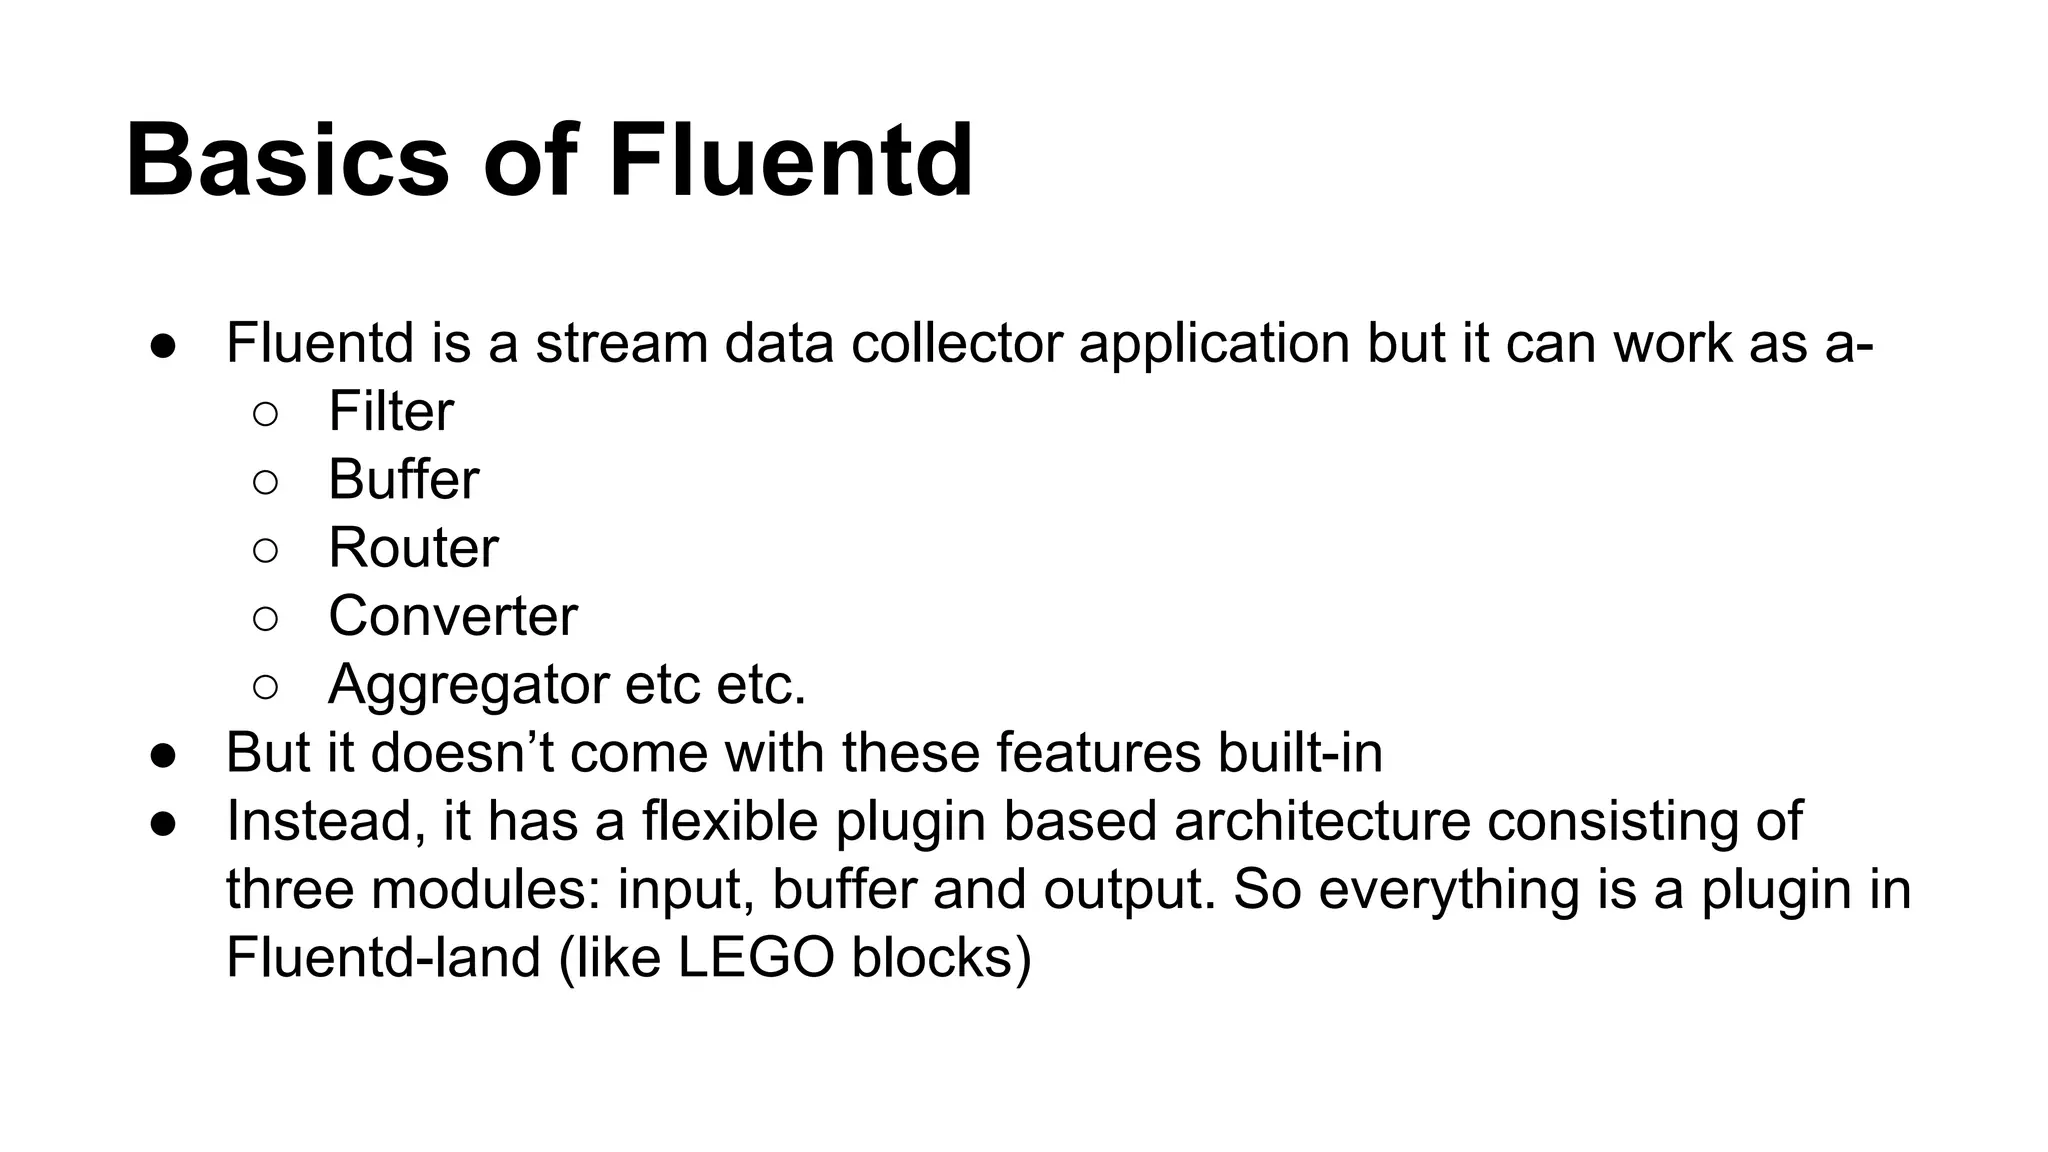
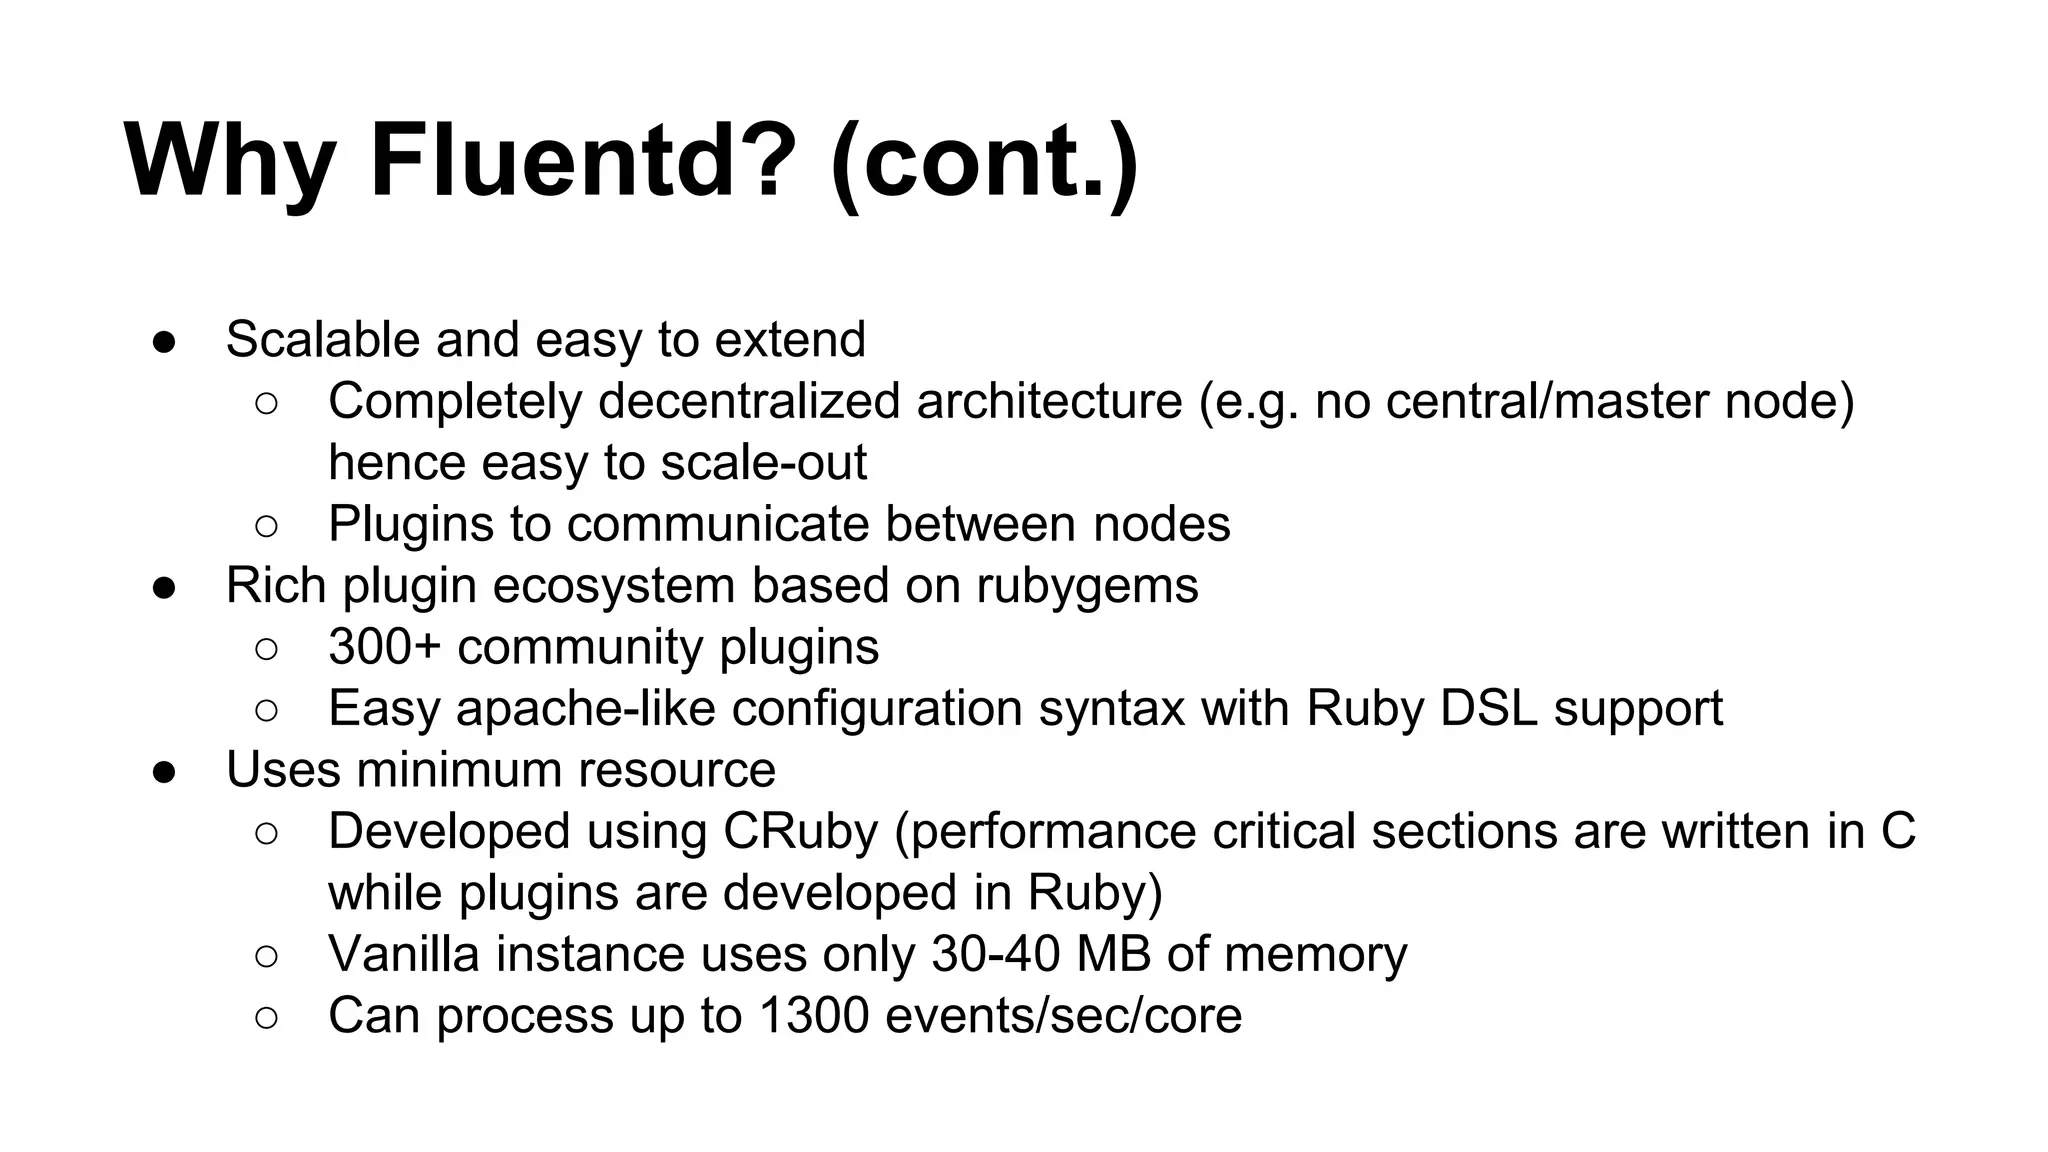
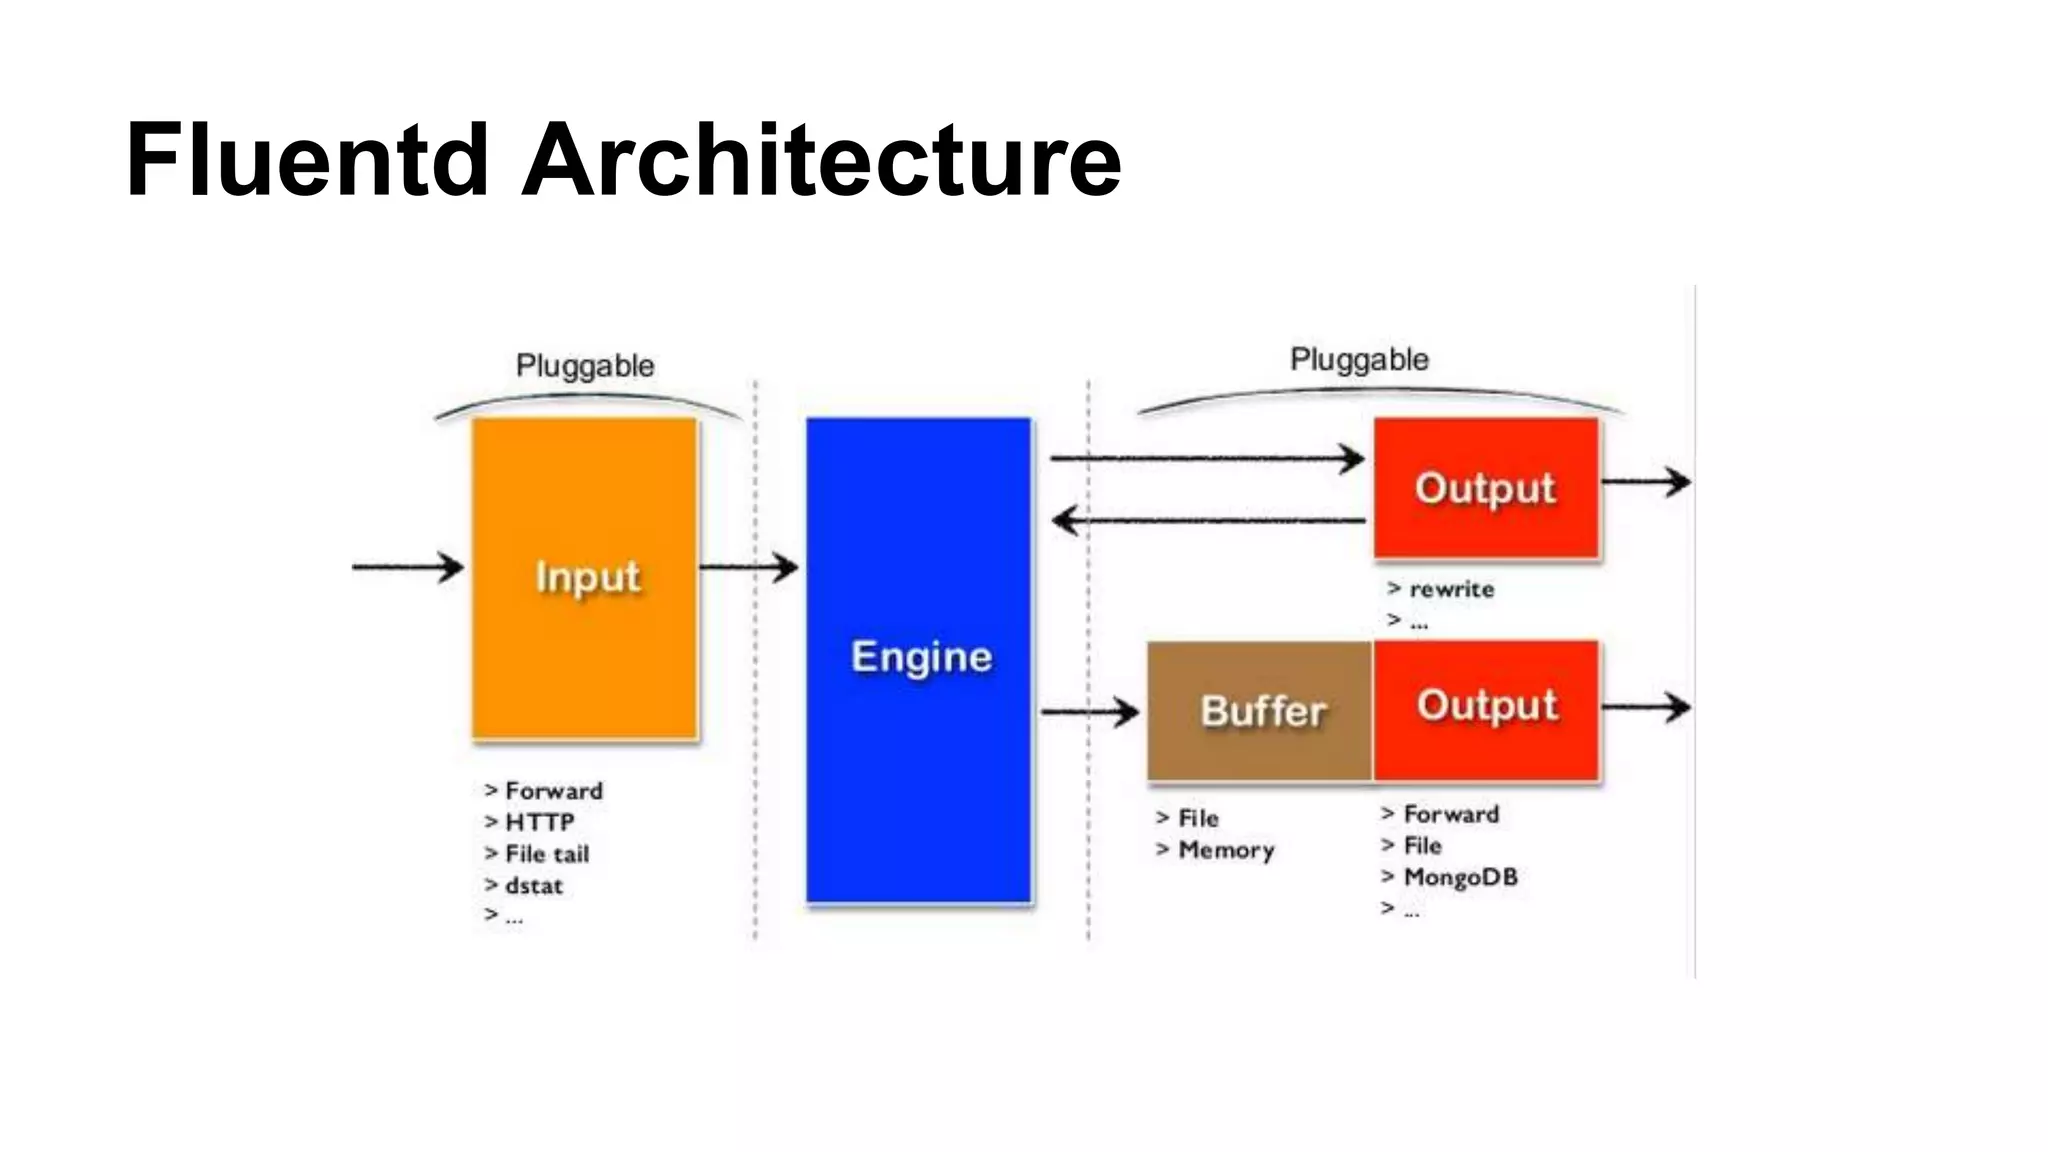
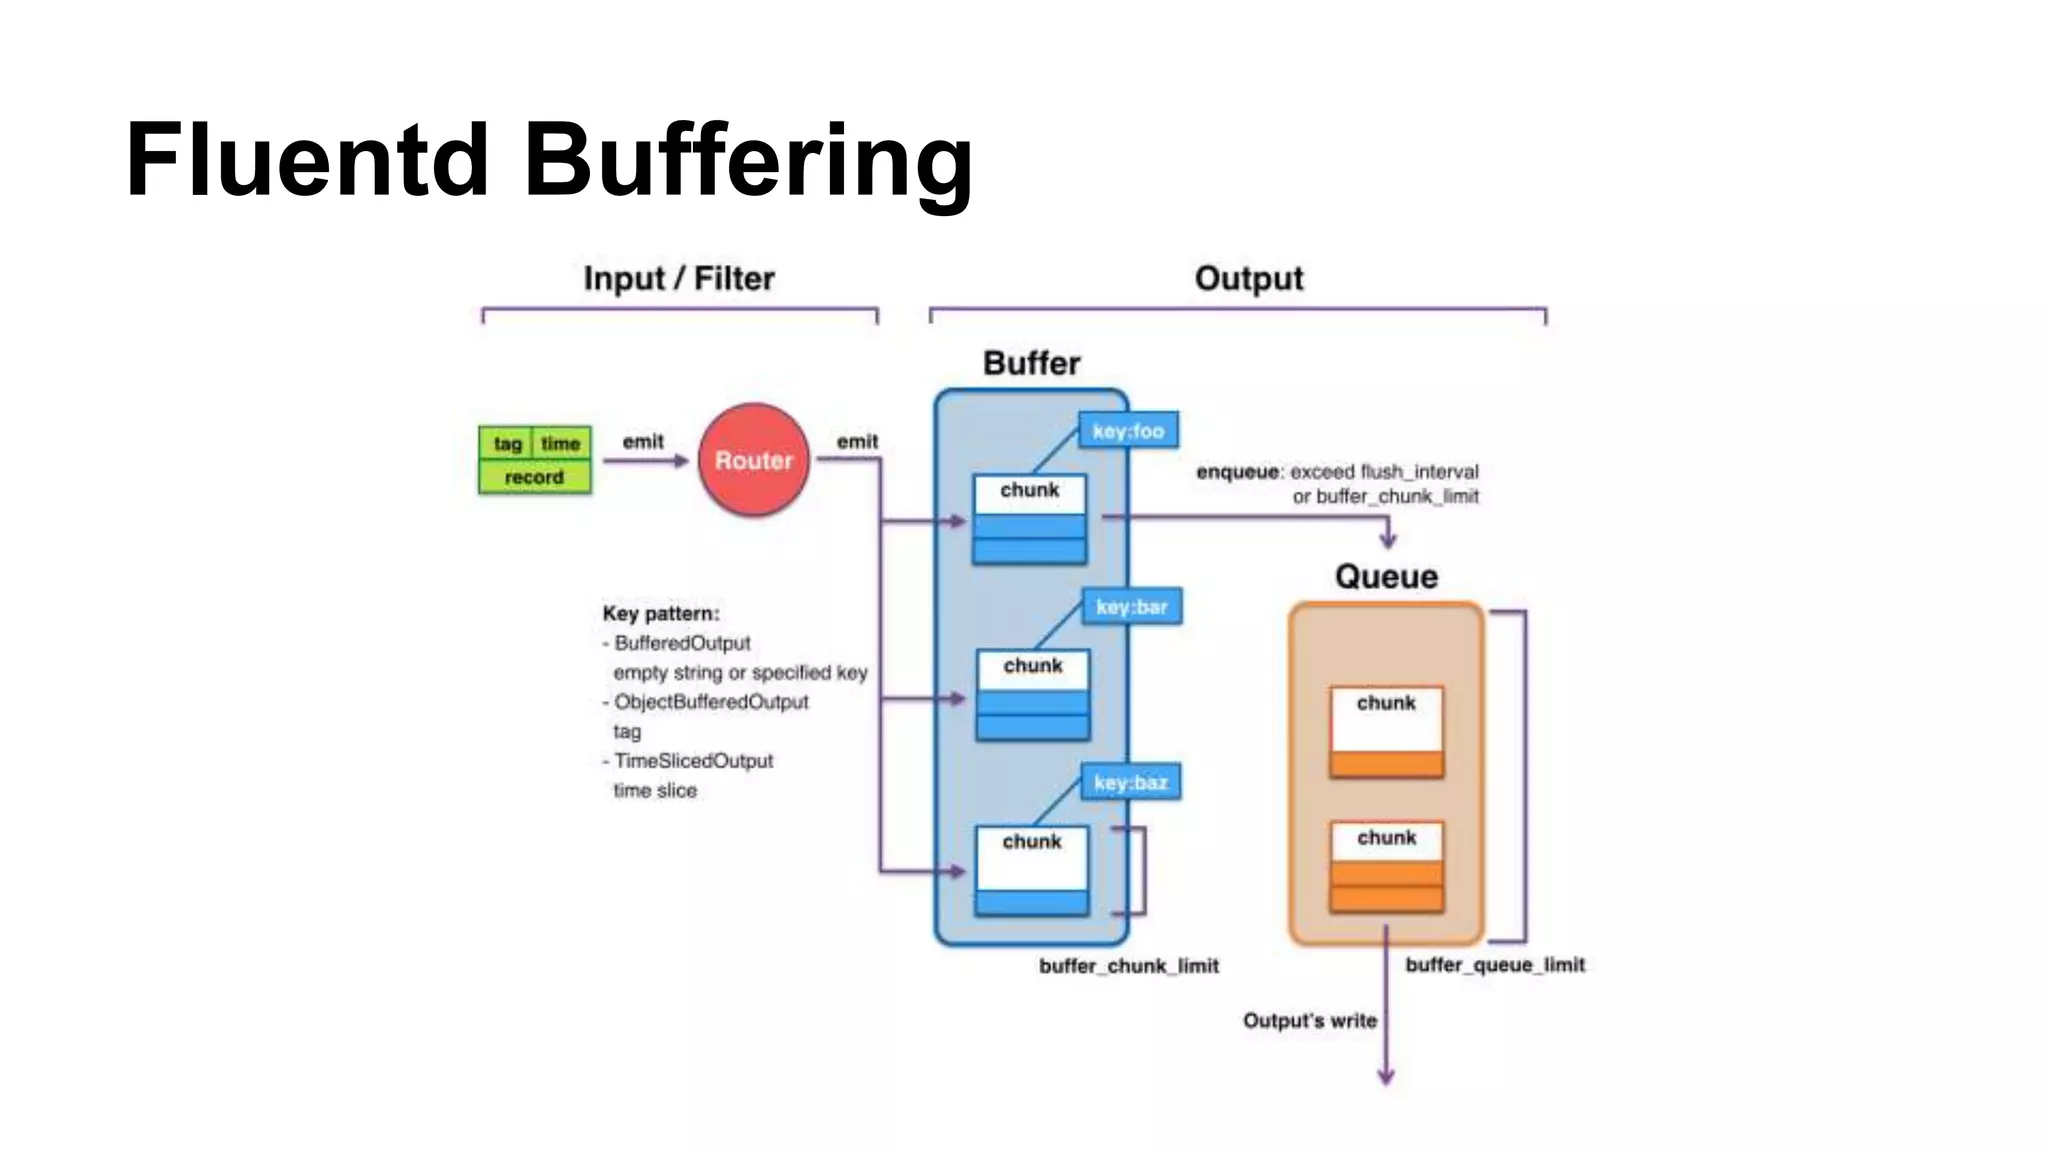
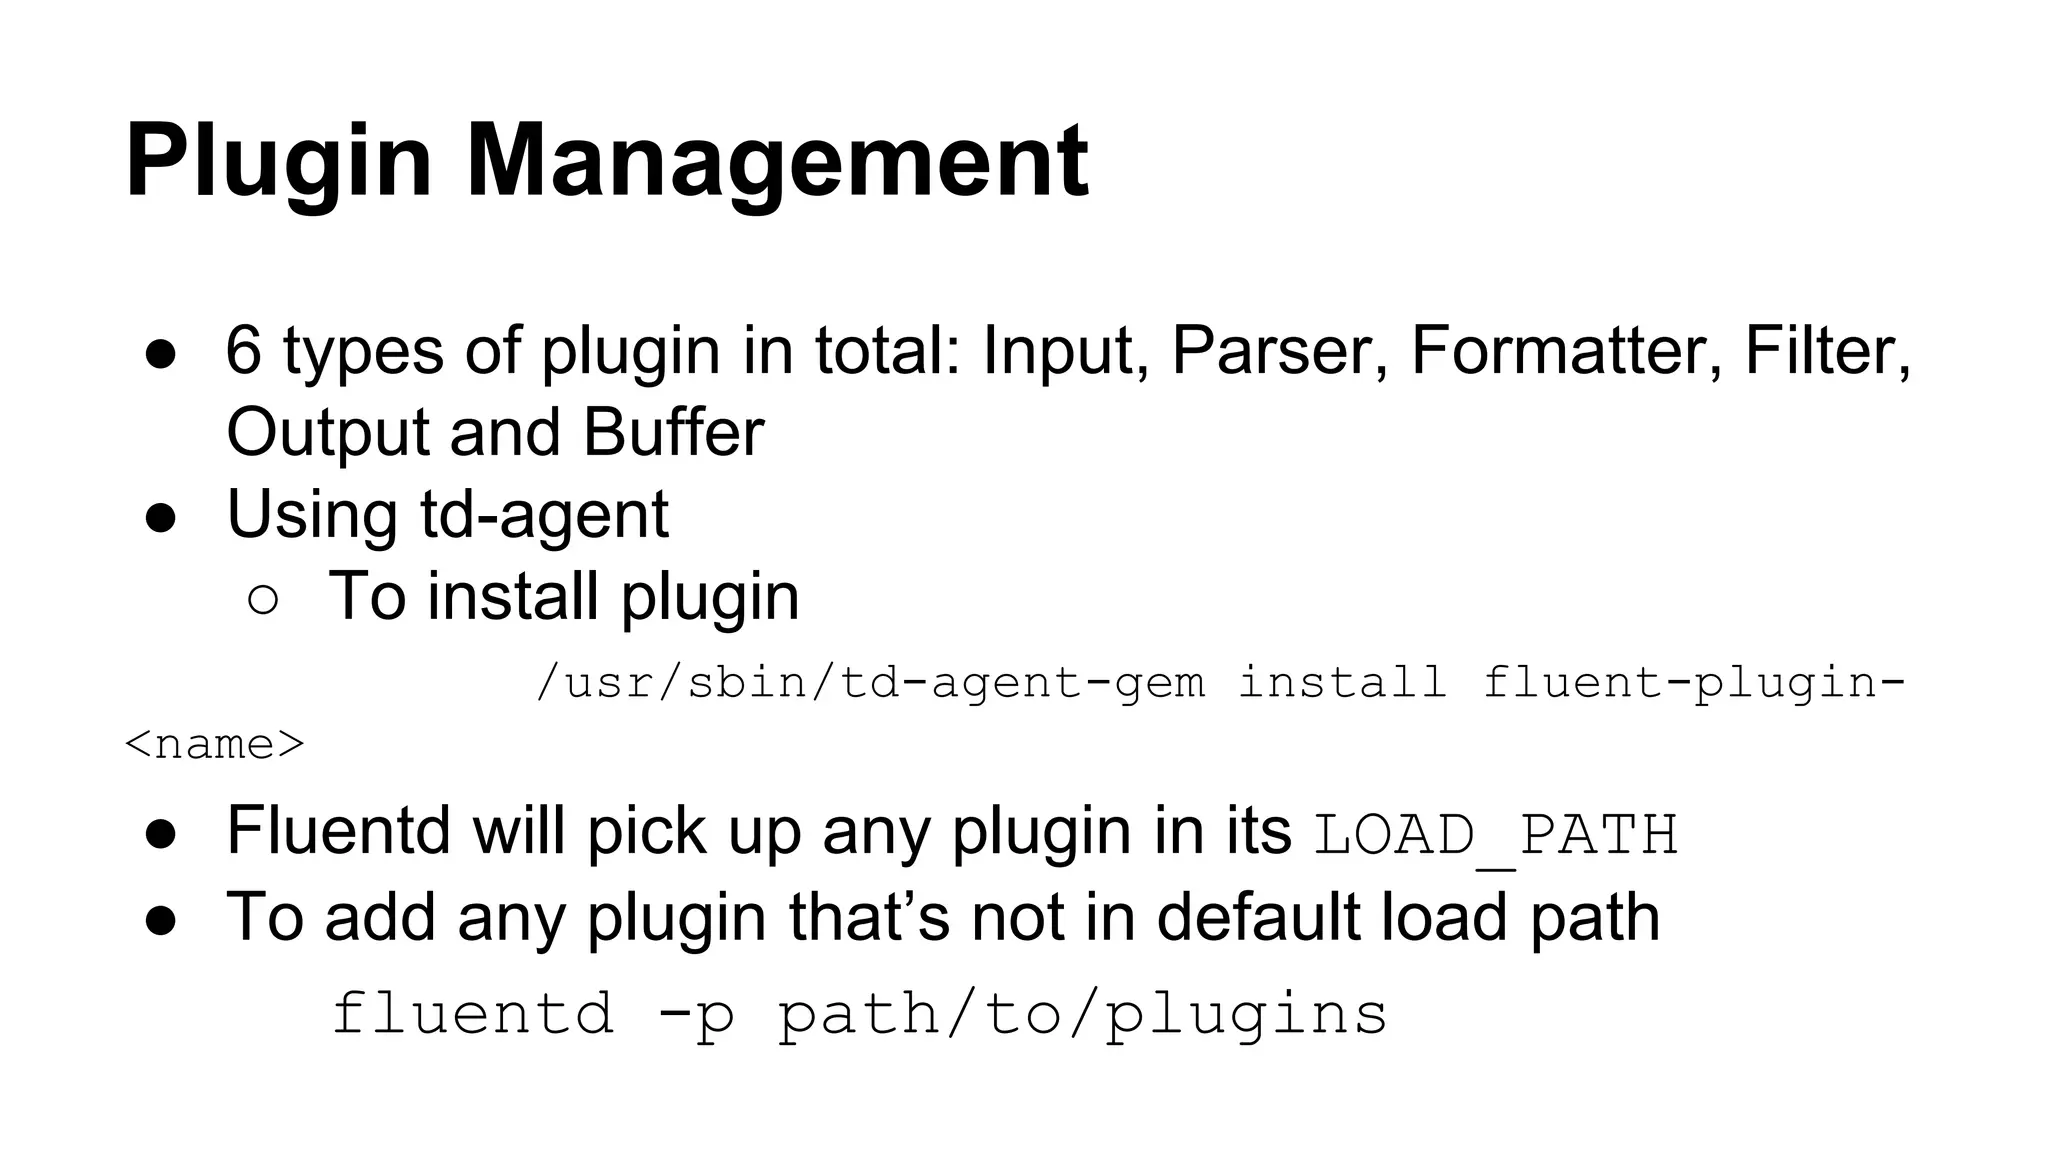
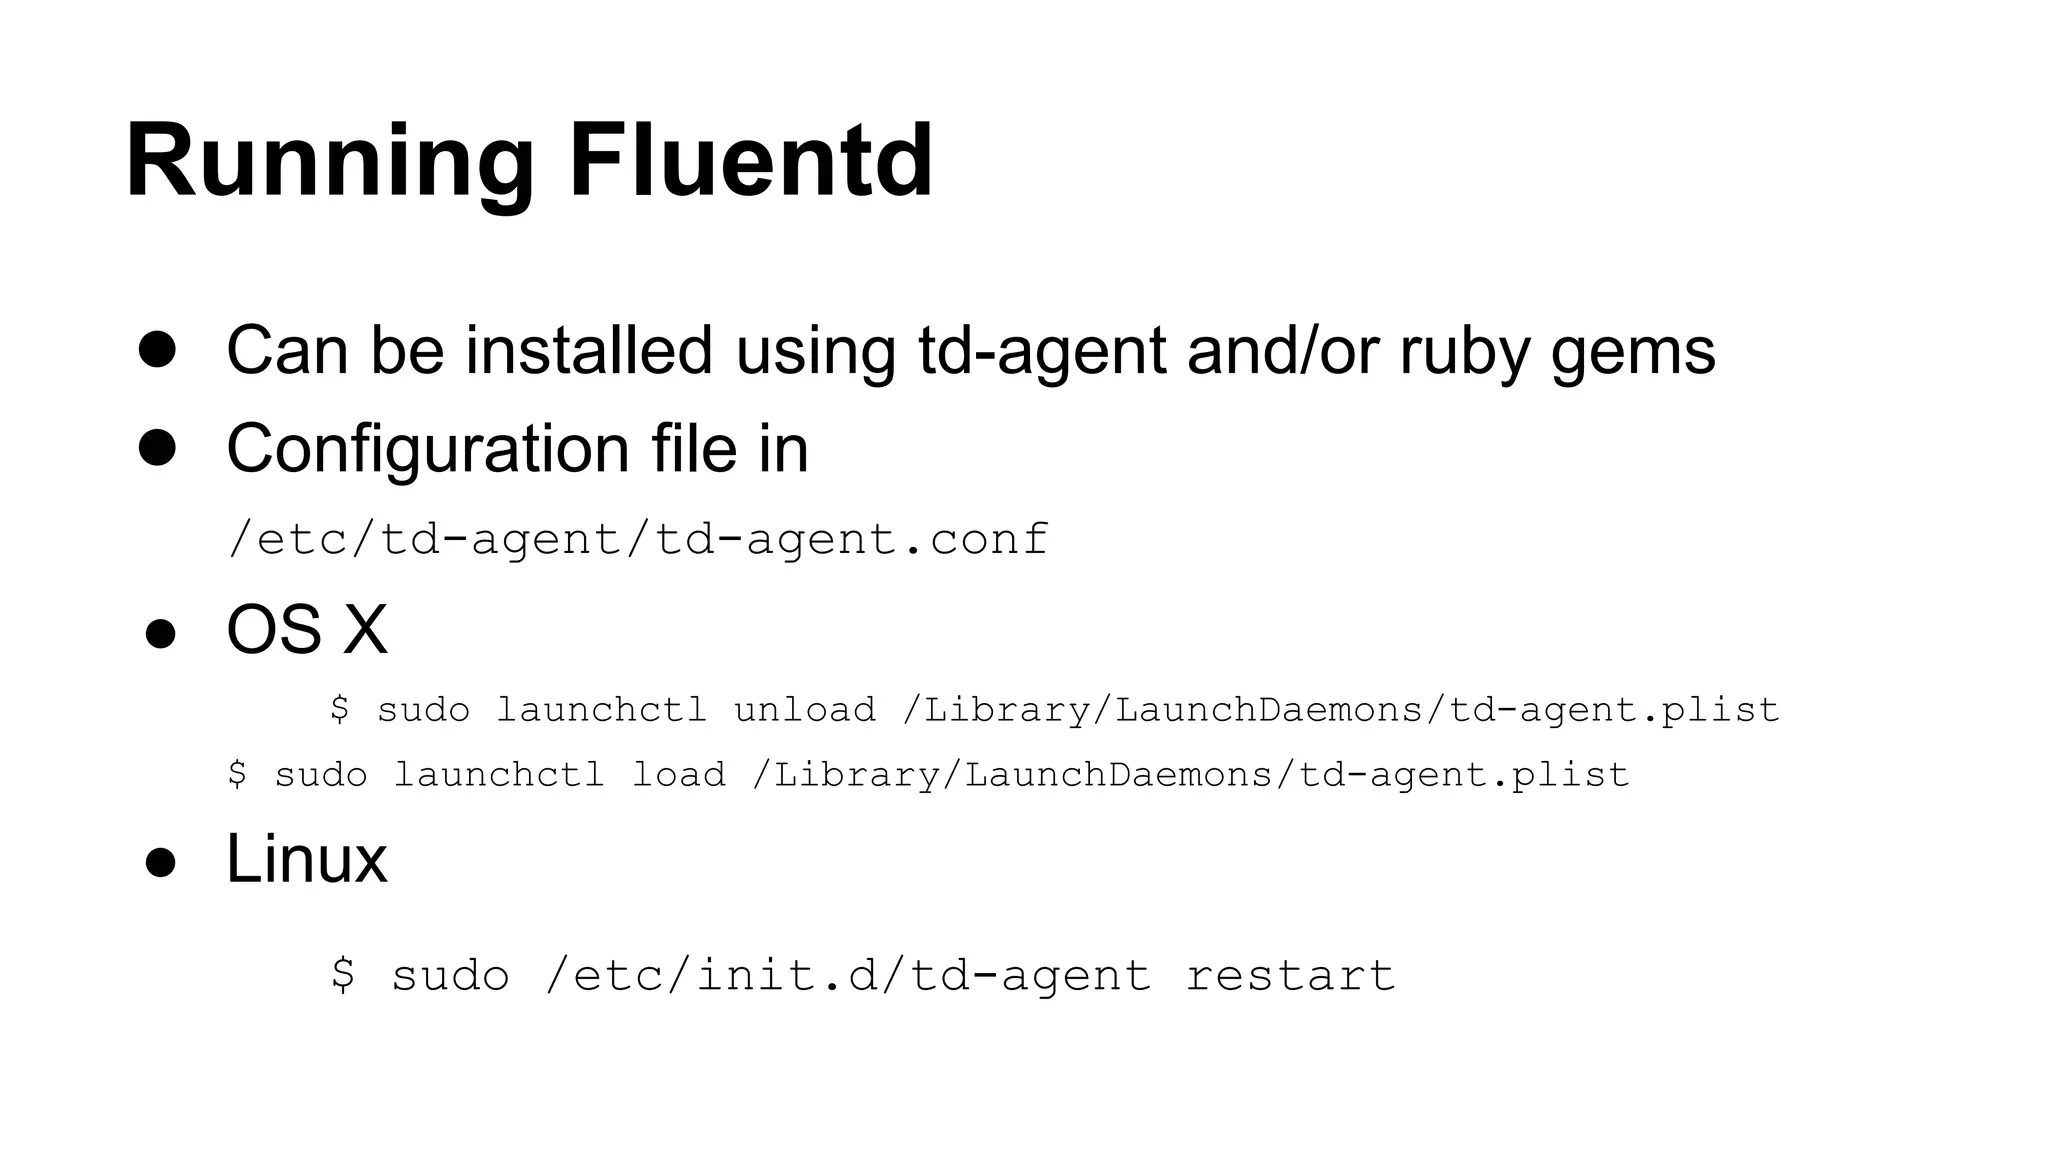
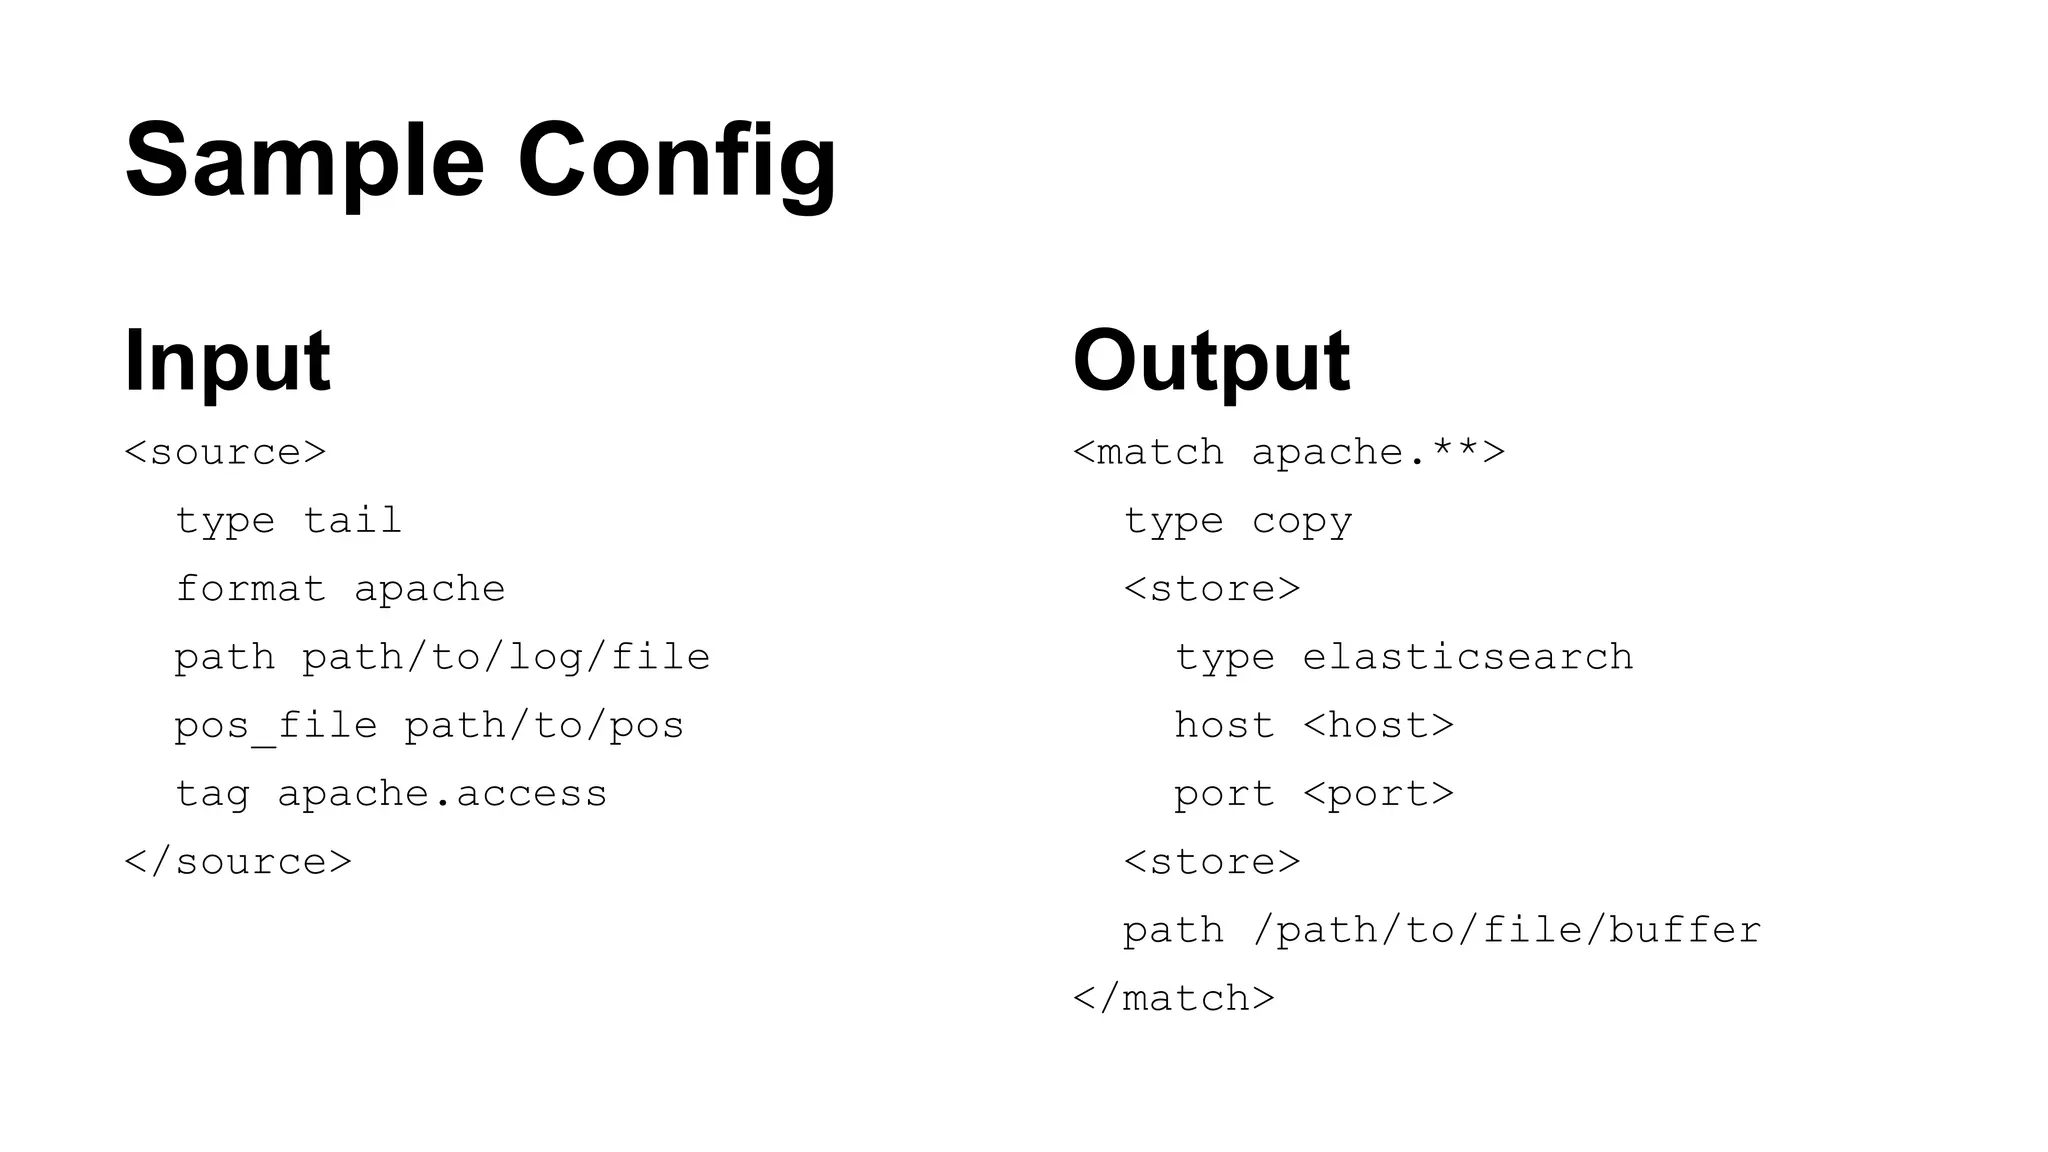
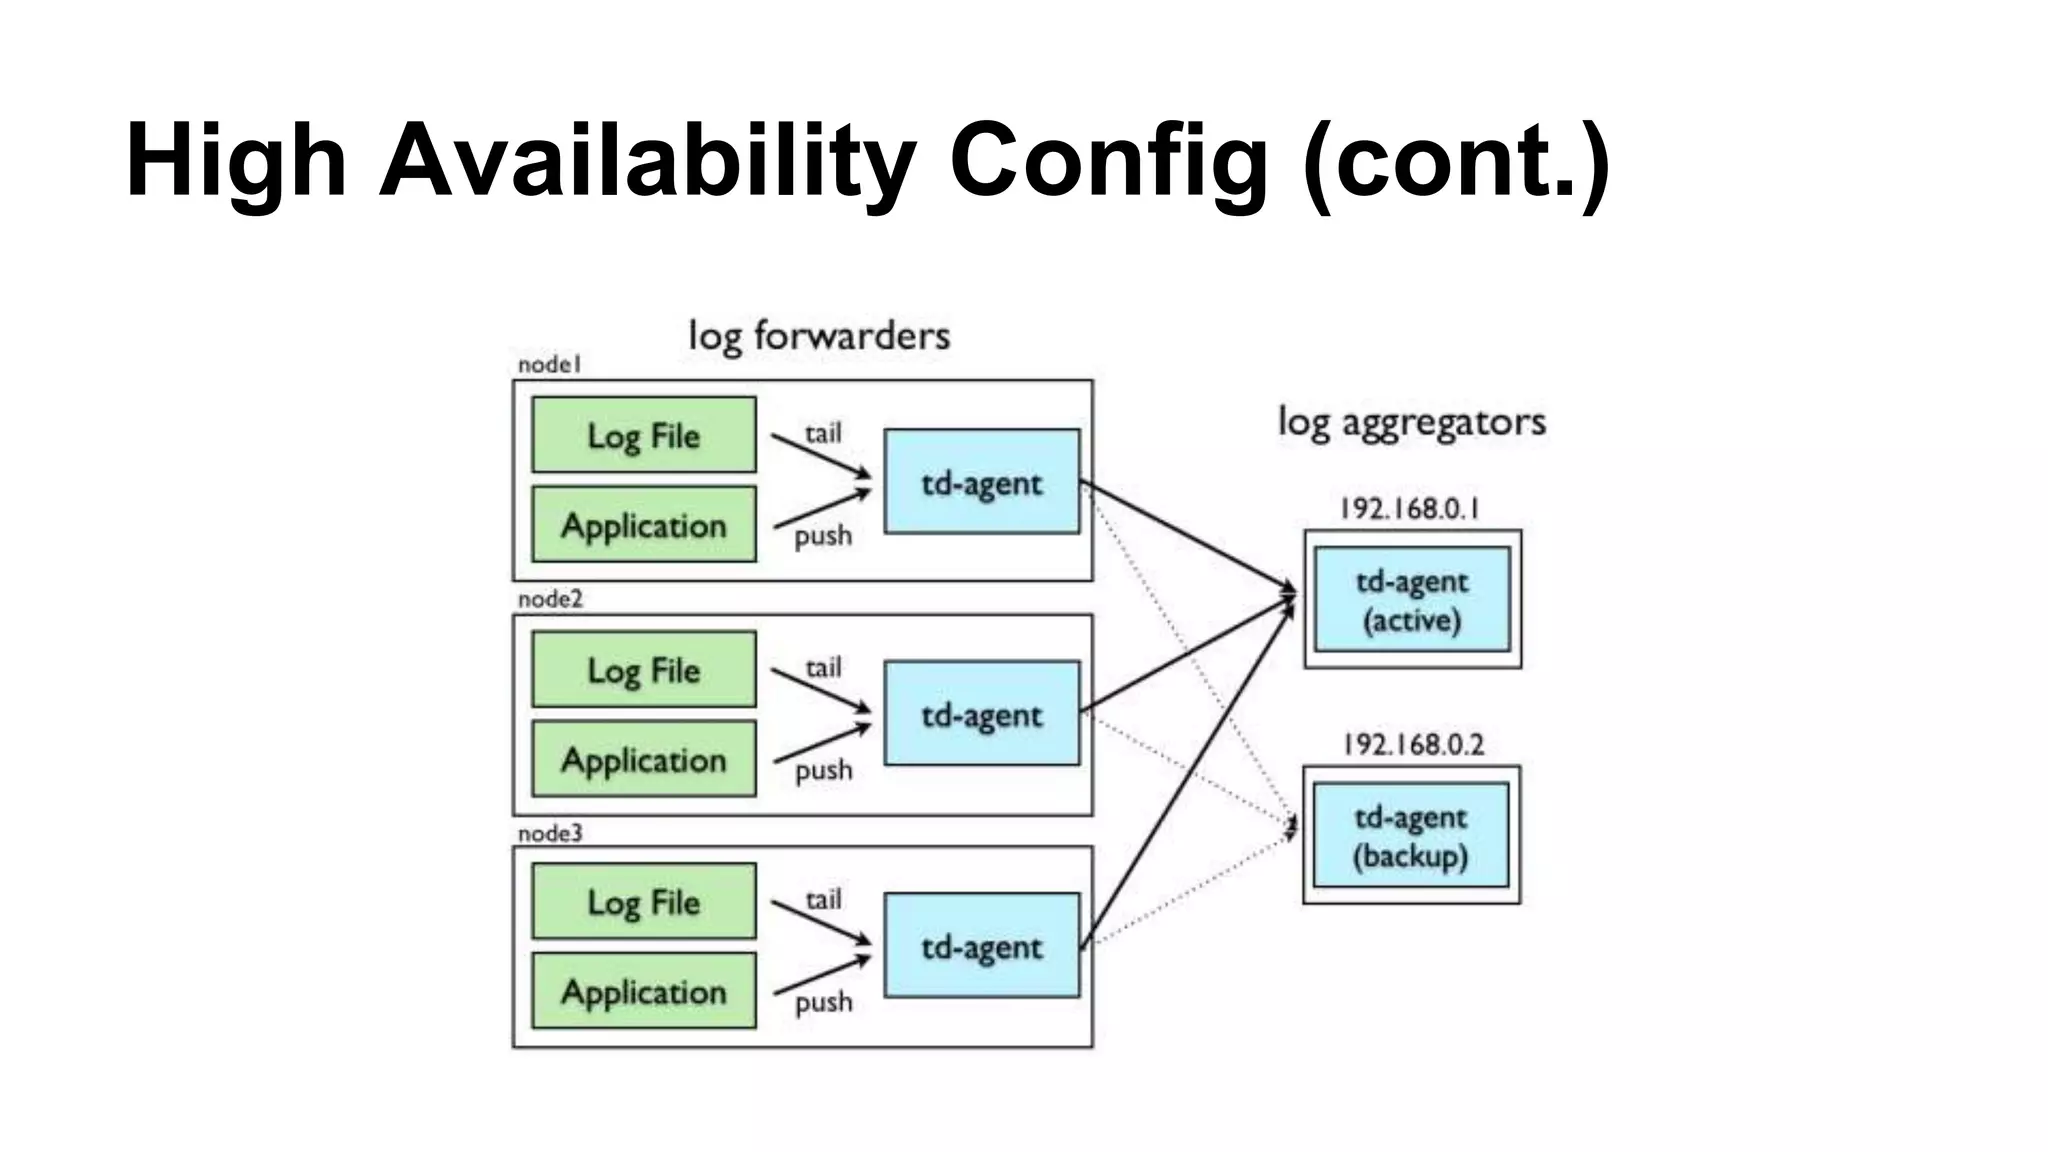
This document discusses building a unified logging layer using Fluentd, Elasticsearch, and Kibana. It describes what a unified logging layer is and why it is needed to collect, format, filter, and forward logs from multiple sources to storage. It then provides overviews of Fluentd for log collection, Elasticsearch for storage and querying, and Kibana for real-time visualization. Details are given on the architectures, plugins, and configurations of each tool and how they can work together in a scalable and highly available logging system.