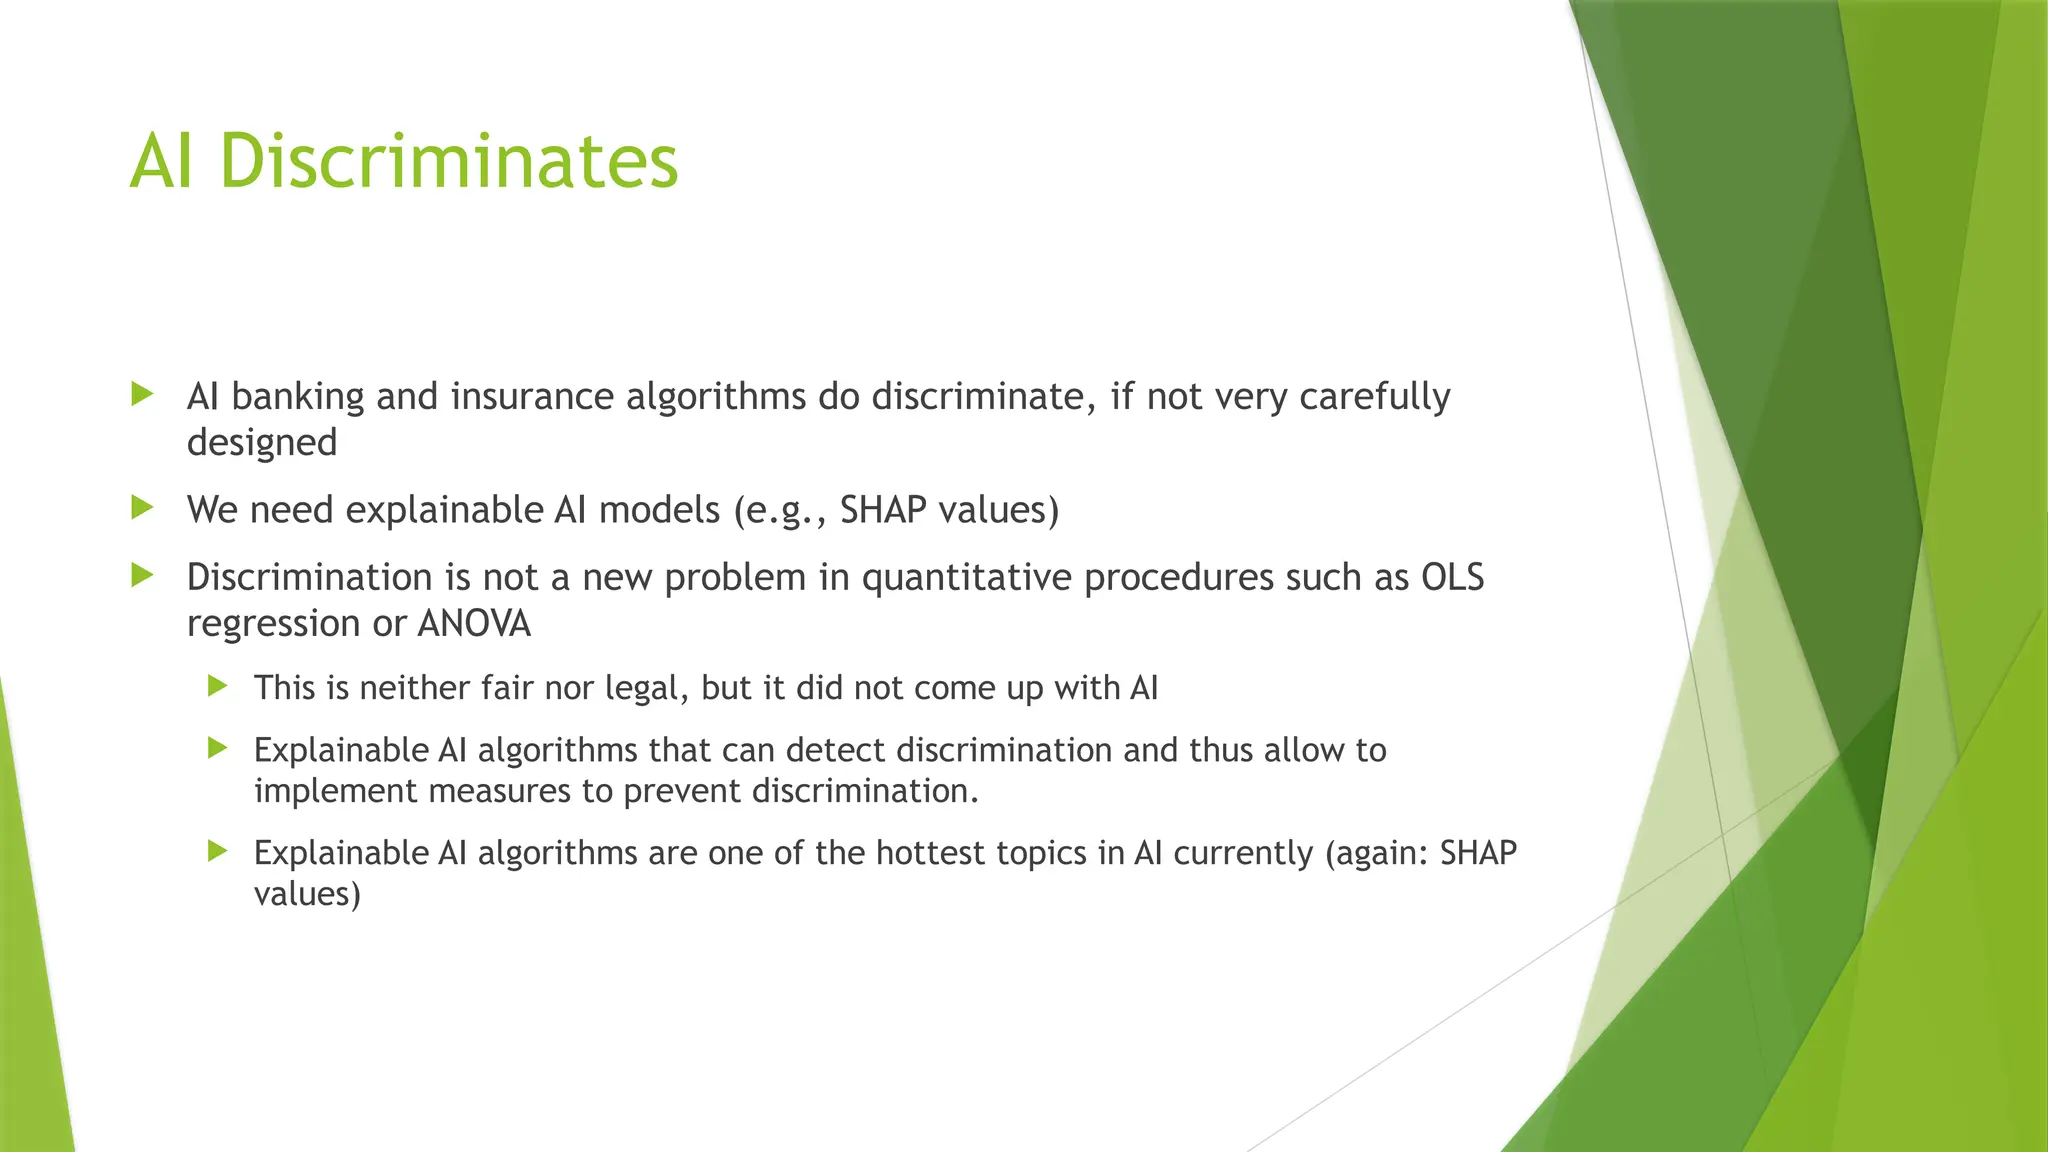
AI Discriminates AIbanking and insurance algorithms do discriminate, if not very carefully designed We need explainable AI models (e.g., SHAP values) Discrimination is not a new problem in quantitative procedures such as OLS regression or ANOVA This is neither fair nor legal, but it did not come up with AI Explainable AI algorithms that can detect discrimination and thus allow to implement measures to prevent discrimination. Explainable AI algorithms are one of the hottest topics in AI currently (again: SHAP values)
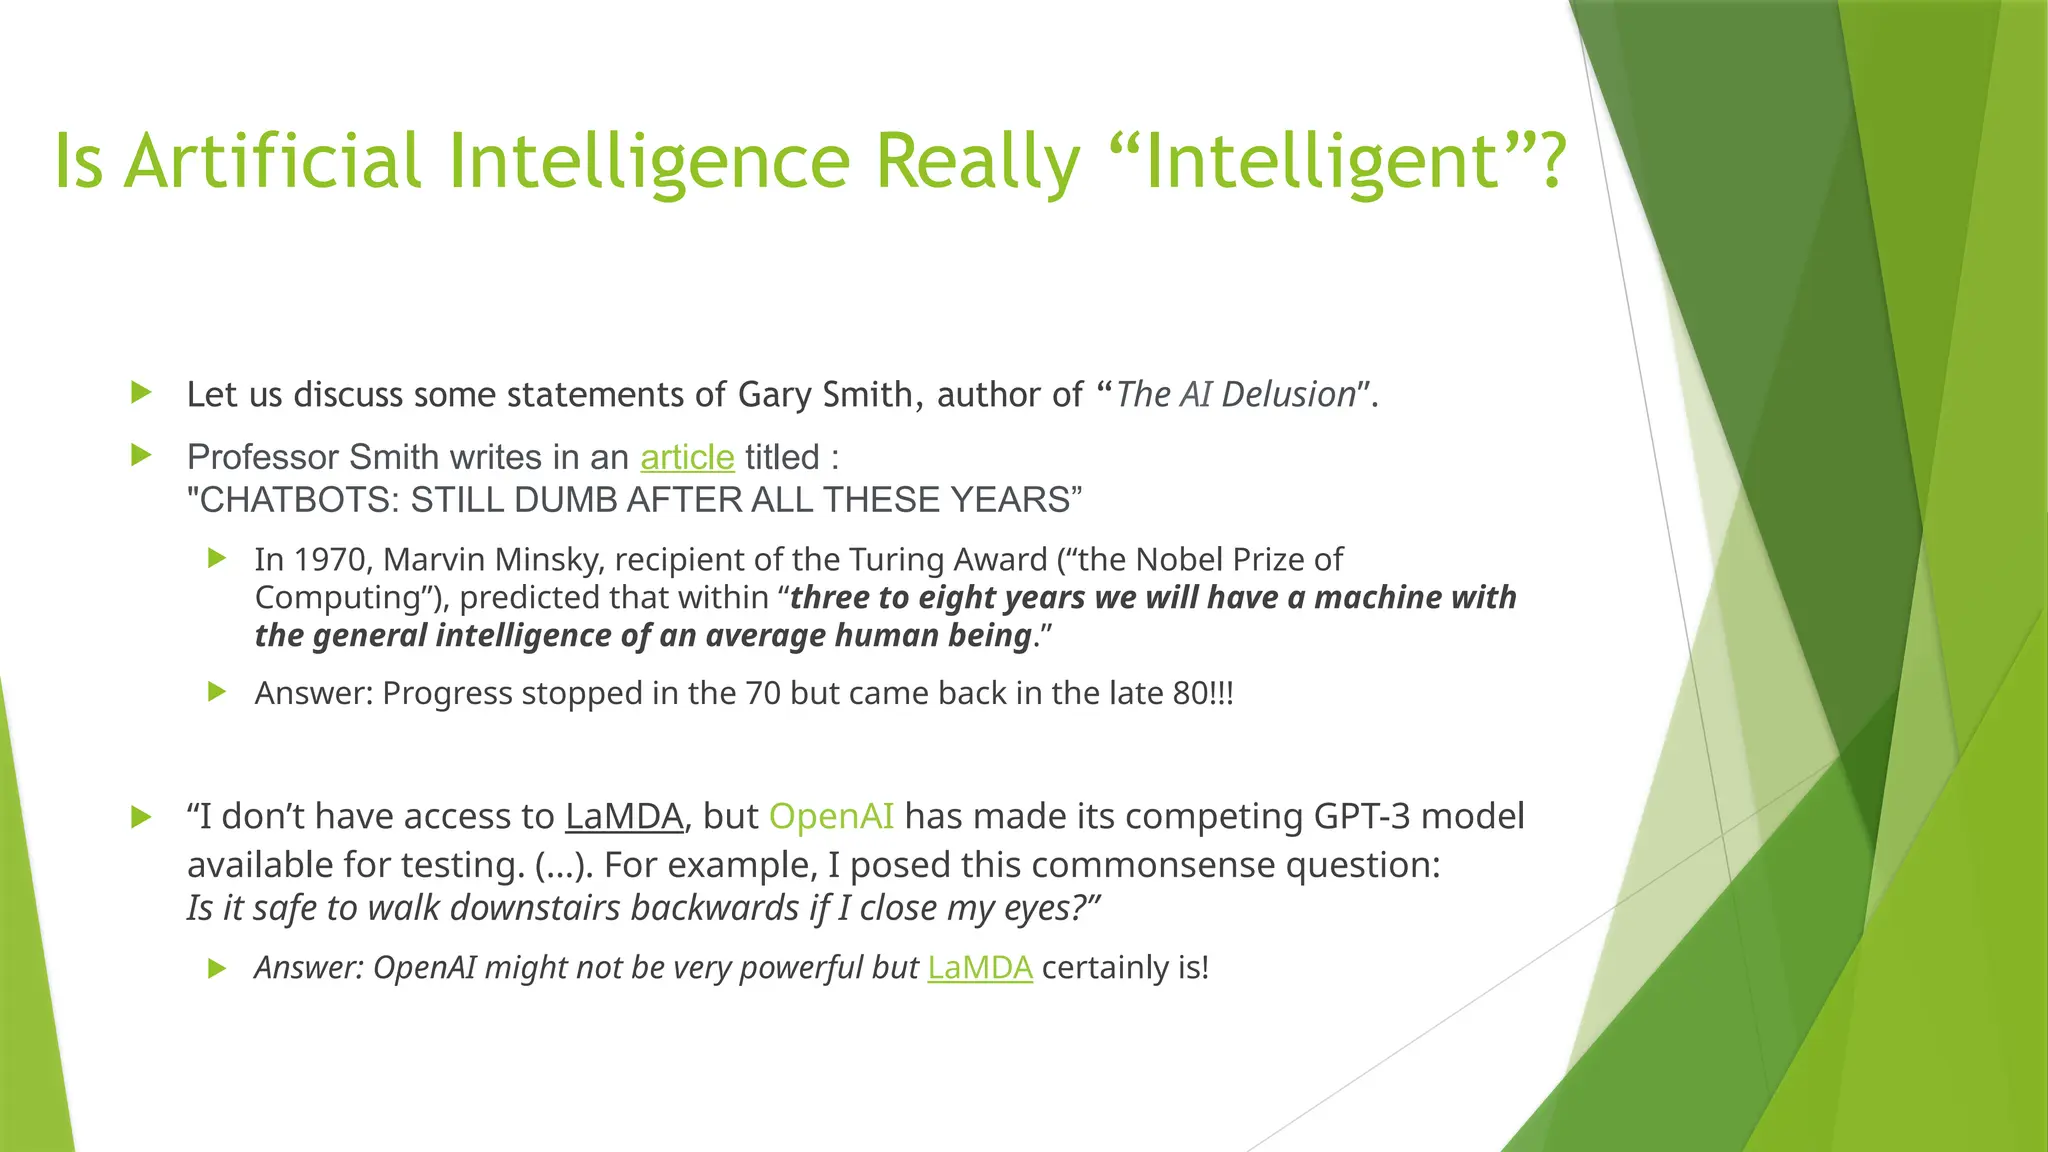
Is Artificial IntelligenceReally “Intelligent”? Let us discuss some statements of Gary Smith, author of “The AI Delusion”. Professor Smith writes in an article titled : "CHATBOTS: STILL DUMB AFTER ALL THESE YEARS” In 1970, Marvin Minsky, recipient of the Turing Award (“the Nobel Prize of Computing”), predicted that within “three to eight years we will have a machine with the general intelligence of an average human being.” Answer: Progress stopped in the 70 but came back in the late 80!!! “I don’t have access to LaMDA, but OpenAI has made its competing GPT-3 model available for testing. (...). For example, I posed this commonsense question: Is it safe to walk downstairs backwards if I close my eyes?” Answer: OpenAI might not be very powerful but LaMDA certainly is!
6.
Definition of ArtificialIntelligence vs. Machine Learning Turing Test (developed by Alan Turing in 1950): “If the evaluator cannot reliably tell the machine from the human, the machine is said to have passed the test. ” Google Demo In what follows I use the term Machine Learning in its broadest definition.
7.
What will Ishow you Learn a little about tidymodels, a very powerful and easy to use machine learning tool in R Recognize handwritten numbers with k-Nearest Neighbors Estimate housing prices with Random Forest Using SHAP values to interpret machine learning models Your questions!
8.
Types of MachineLearning Regression (supervised learning) Estimate a number. e.g., estimate the price of a house or estimate a firm’s profit. Classification (supervised learning) Estimate a category. e.g., estimate if a credit card transaction is fraudulent (=1) or not fraudulent (=0), identify handwritten notes as 1,2,3, ... Clustering (unsupervised learning) Create a predefined number of groups with similar properties. e.g., using 1 Mio. balance sheets to determine 6 groups of similar balance sheets. After groups have been determined find what these groups have in common, e.g., industry, size, region, etc.
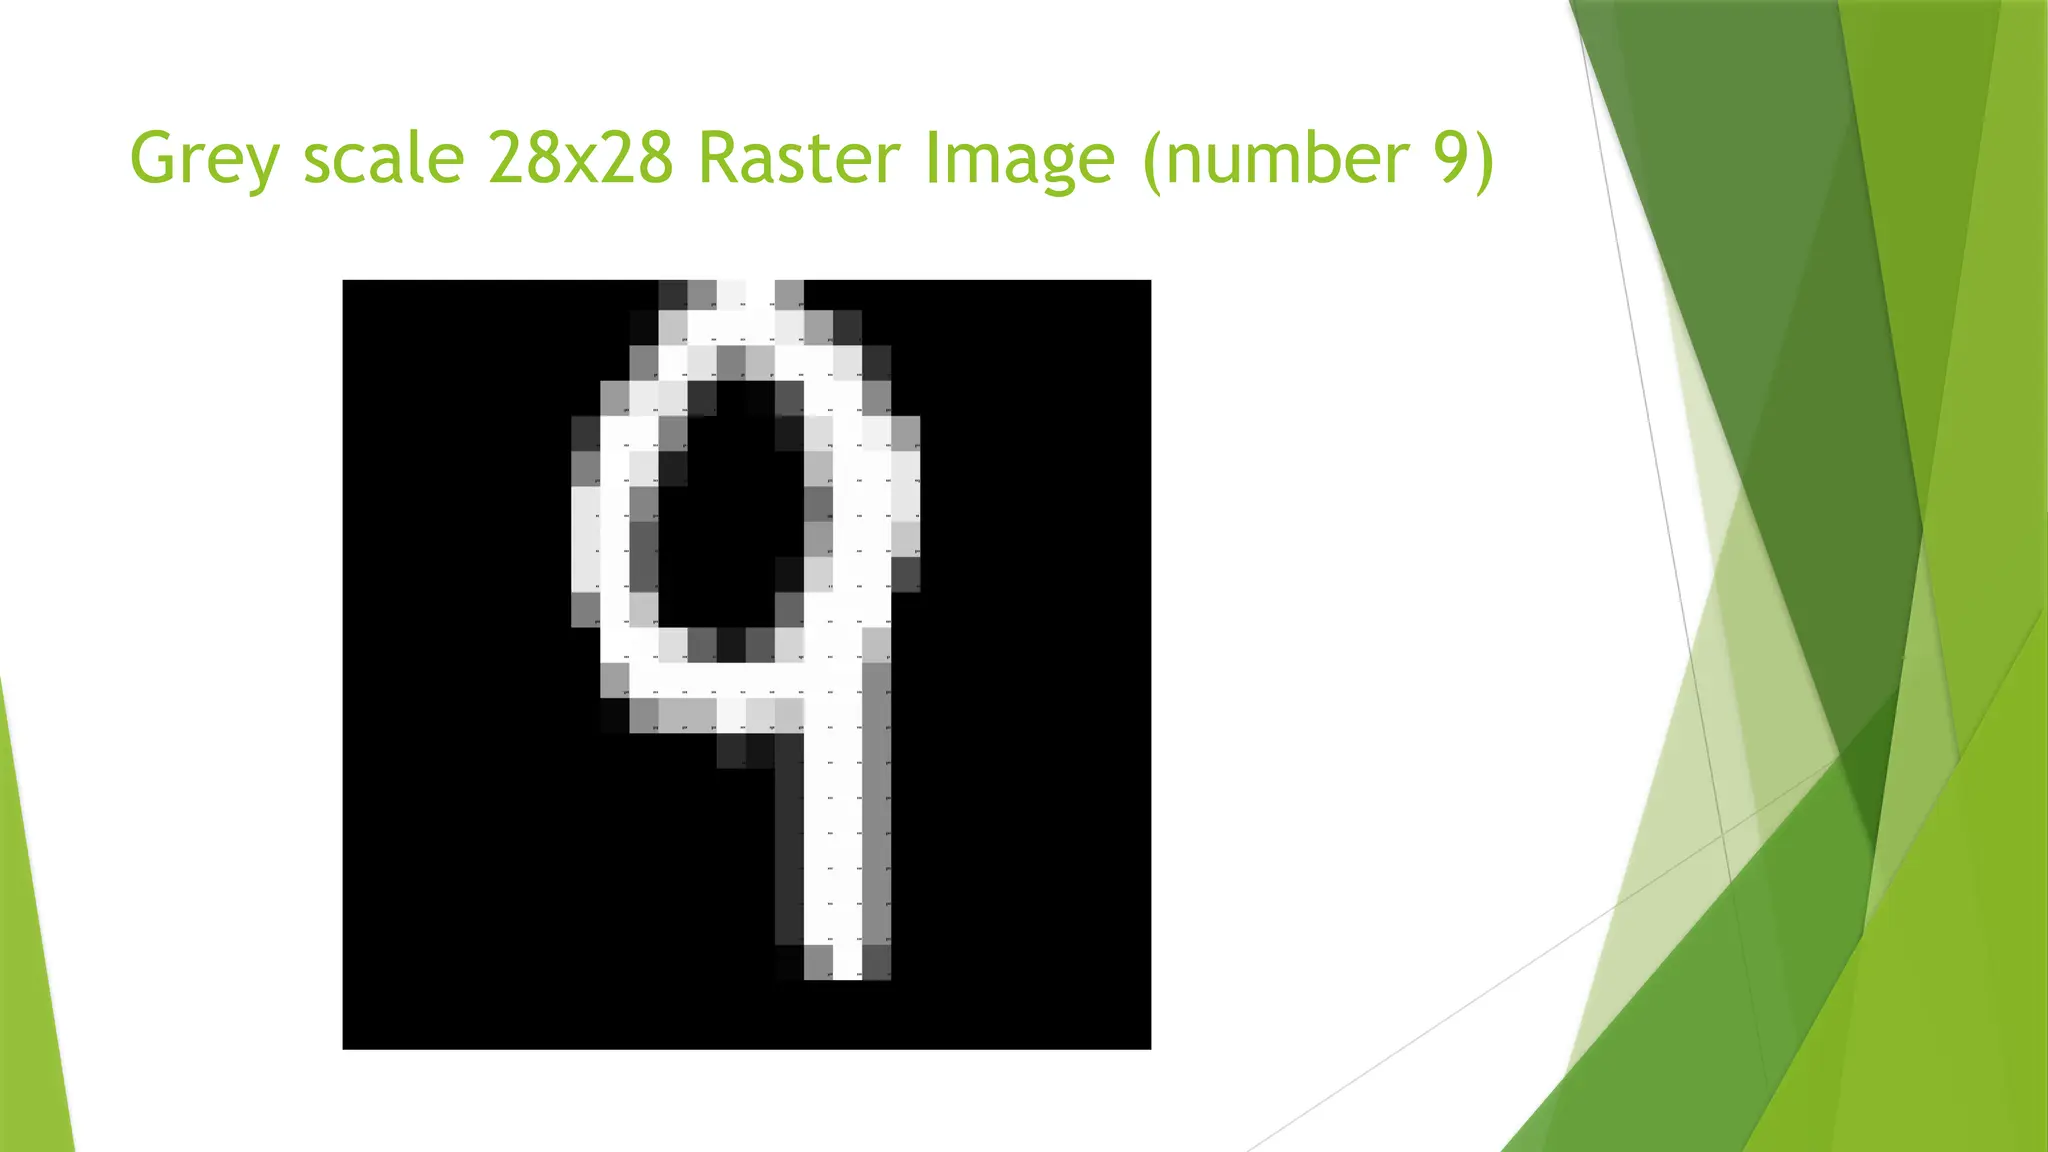
The MNIST Datase `MNIST`is a classic dataset in machine learning, consisting of 28x28 gray-scale images of handwritten digits. The original training set contains 60,000 examples and the test set contains 10,000 examples. Here we will be working with a subset of this data: a training set of 8,500 examples and a test set of 1,500 examples.
11.
Training Data, TestData, and Cross Validation Training Data Are used to optimize/train the ML procedure The input data are known for each record (here: the 784 element lists for the 7,800 images). The targets are known for each record (here: the correct labels (0, 1, 2, 3 … 9) for each of the 7800 images) The ML procedure is trained to best predict the known target data Test Data Test data are never used for training. They are only used to test the performance of the trained ML procedure. 1. The input data of the test data set are fed into the trained ML procedure (here: the 784 element lists for the 1,000 images).. 2. The ML procedure predicts a label (here: 0,1,2, … or 9). 3. The prediction is compared to the true label. 4. The average error is calculated.
12.
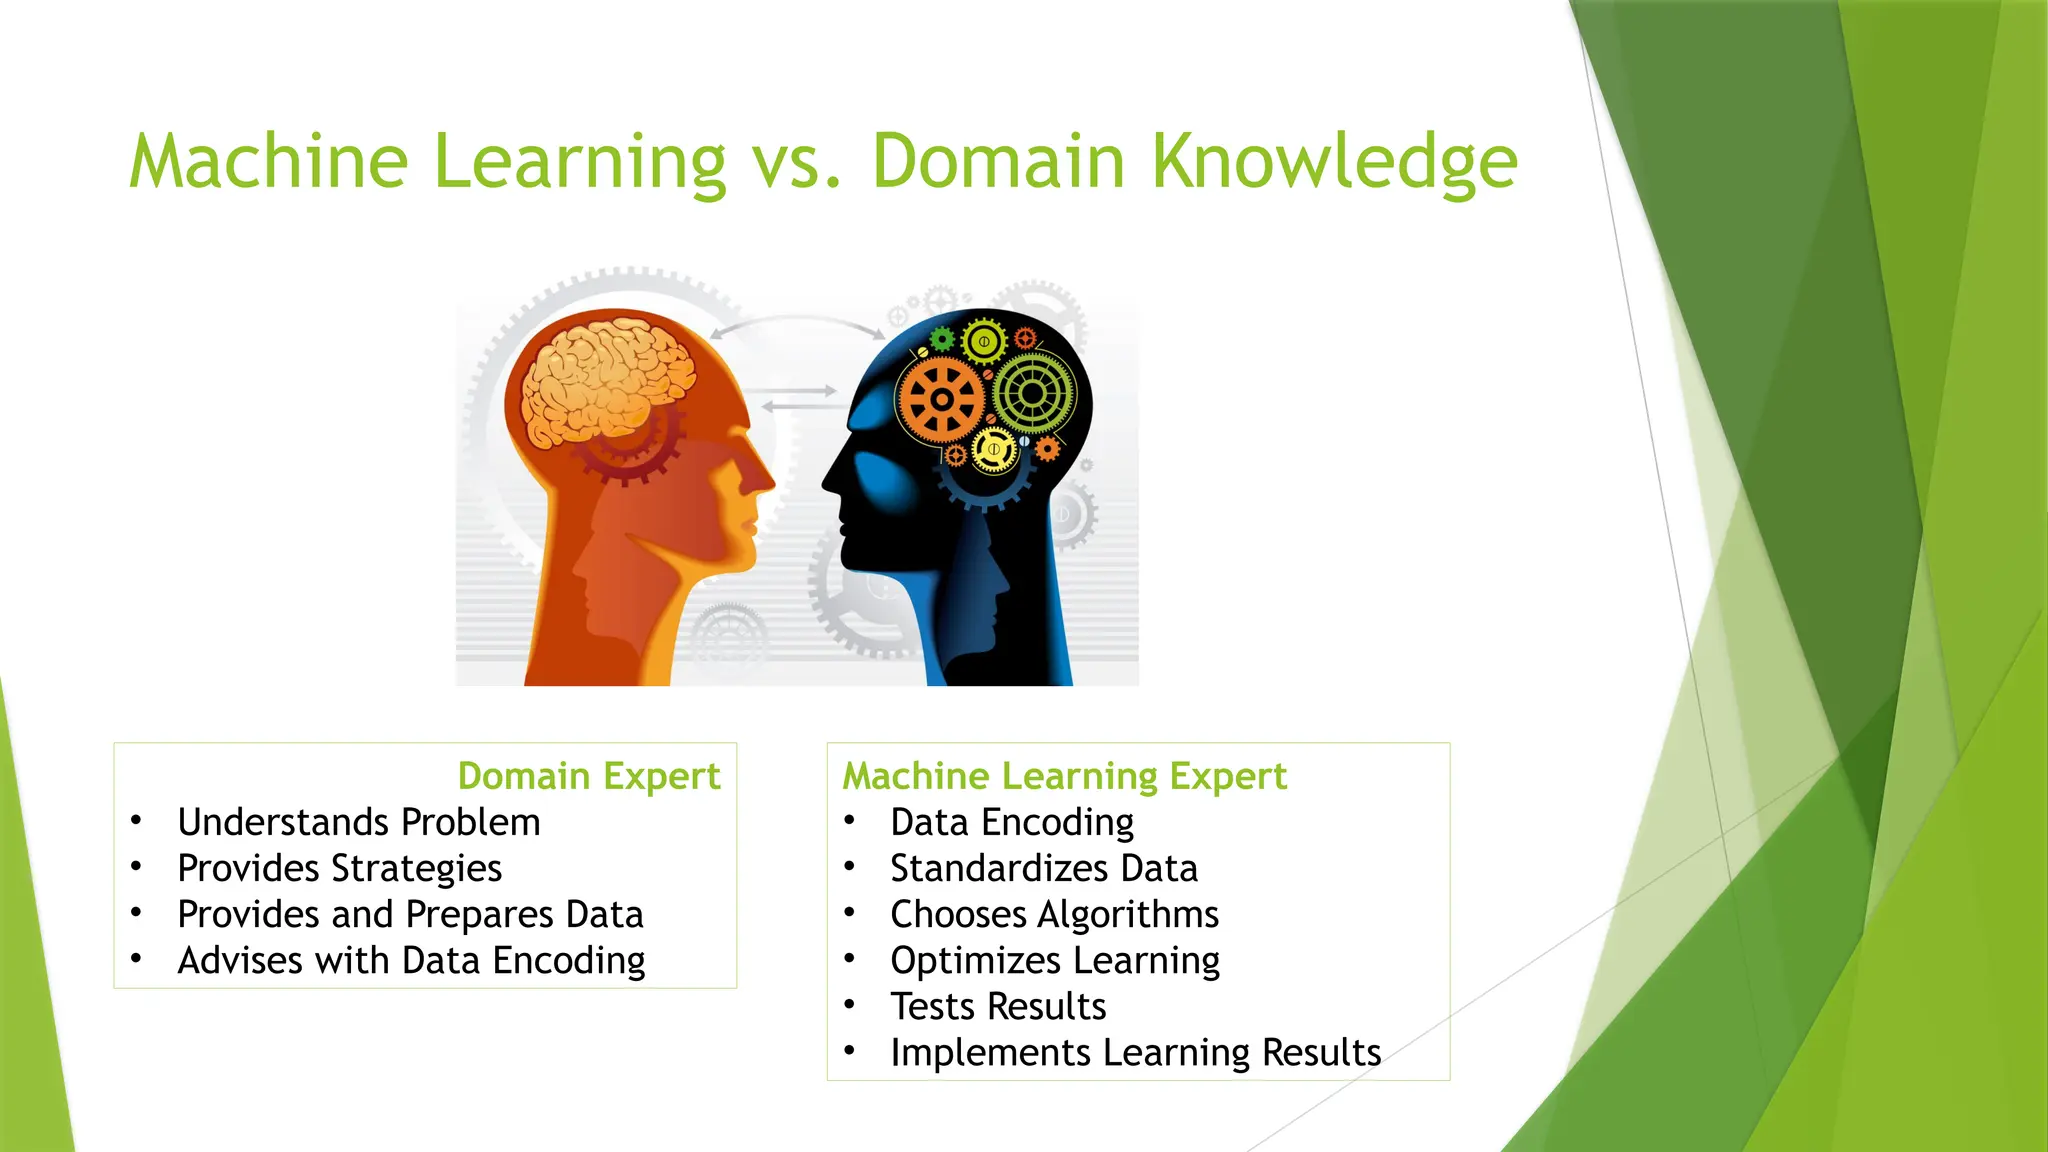
Machine Learning vs.Domain Knowledge Domain Expert • Understands Problem • Provides Strategies • Provides and Prepares Data • Advises with Data Encoding Machine Learning Expert • Data Encoding • Standardizes Data • Chooses Algorithms • Optimizes Learning • Tests Results • Implements Learning Results
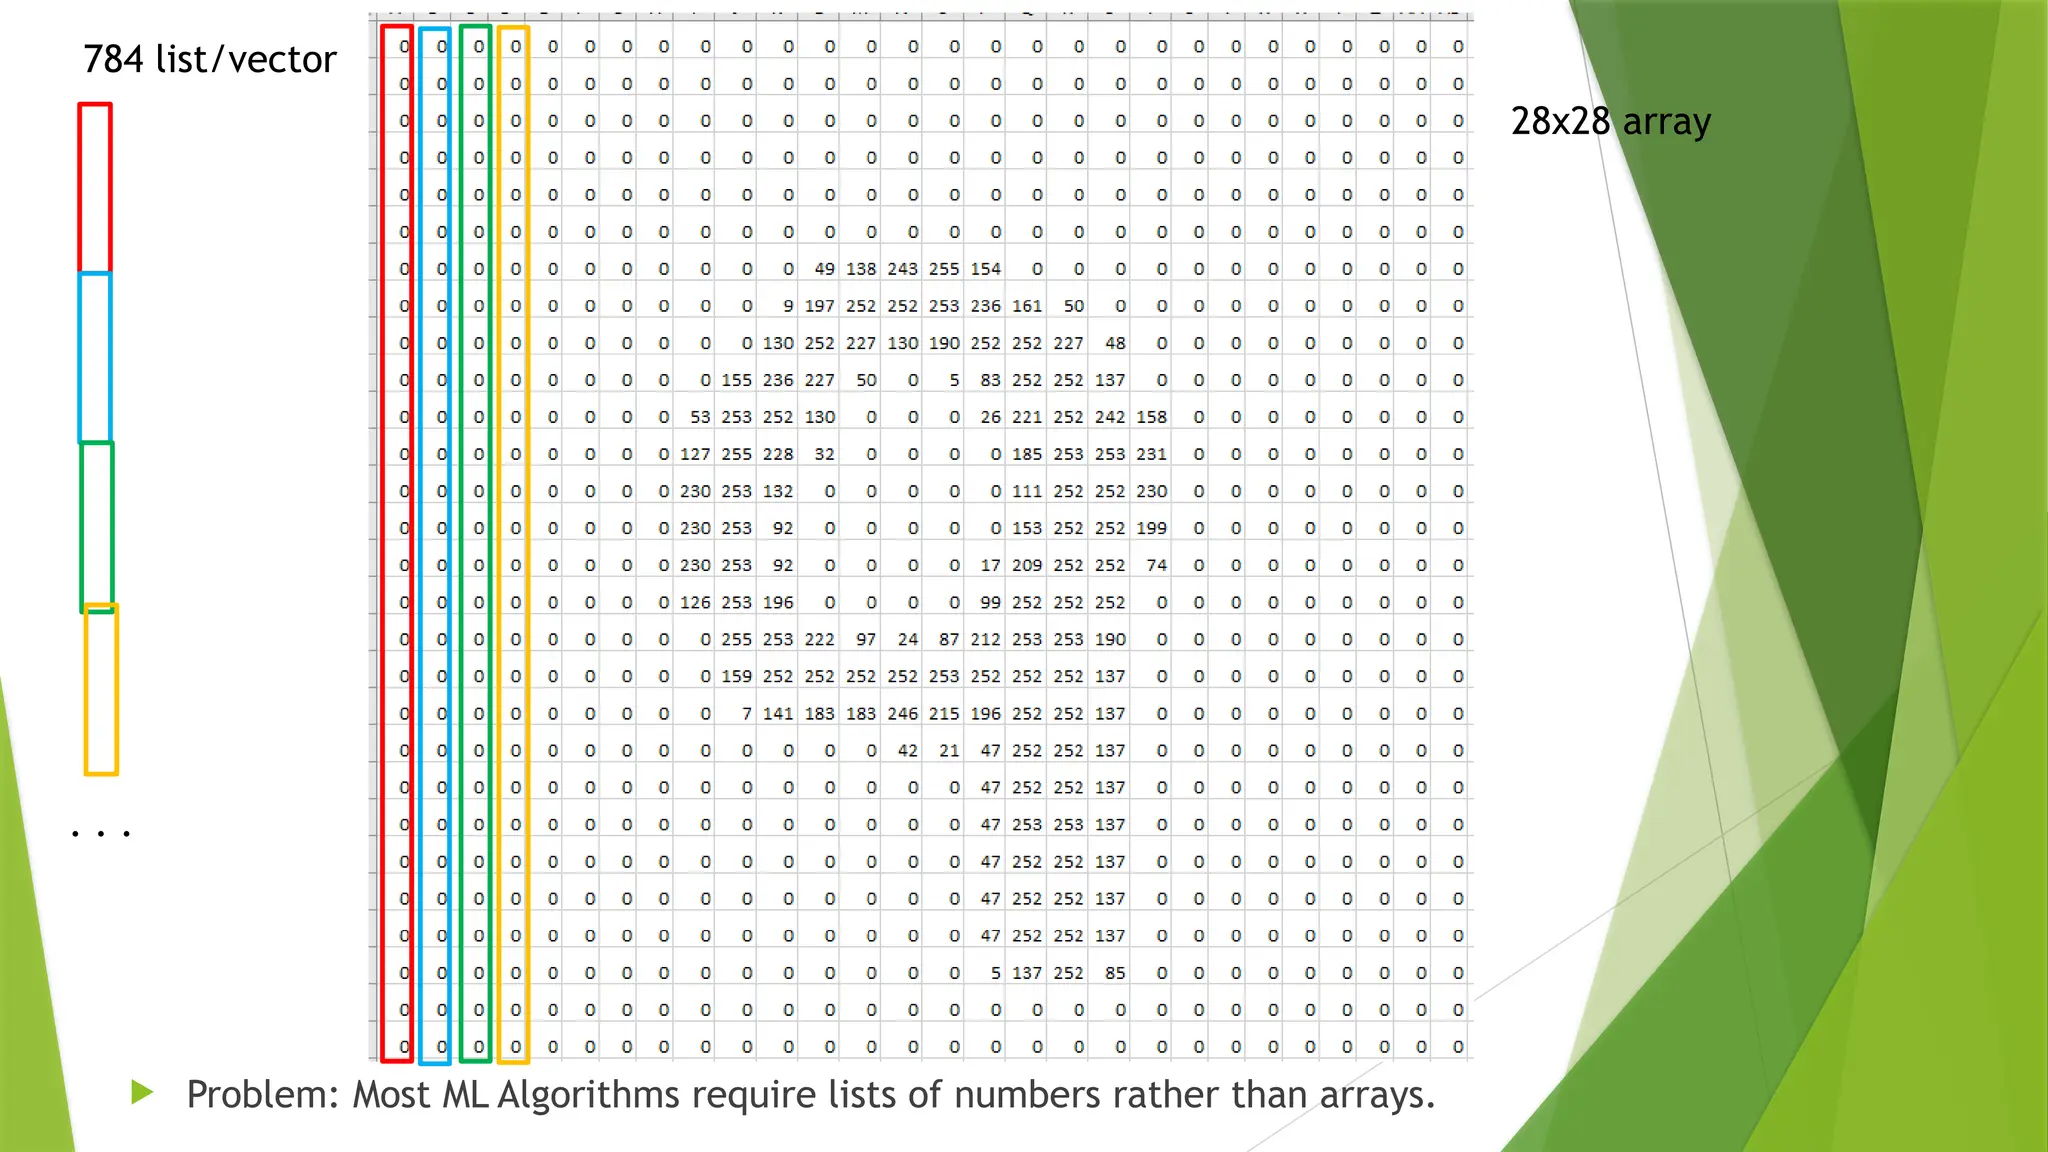
Problem: MostML Algorithms require lists of numbers rather than arrays. 784 list/vector 28x28 array . . .
16.
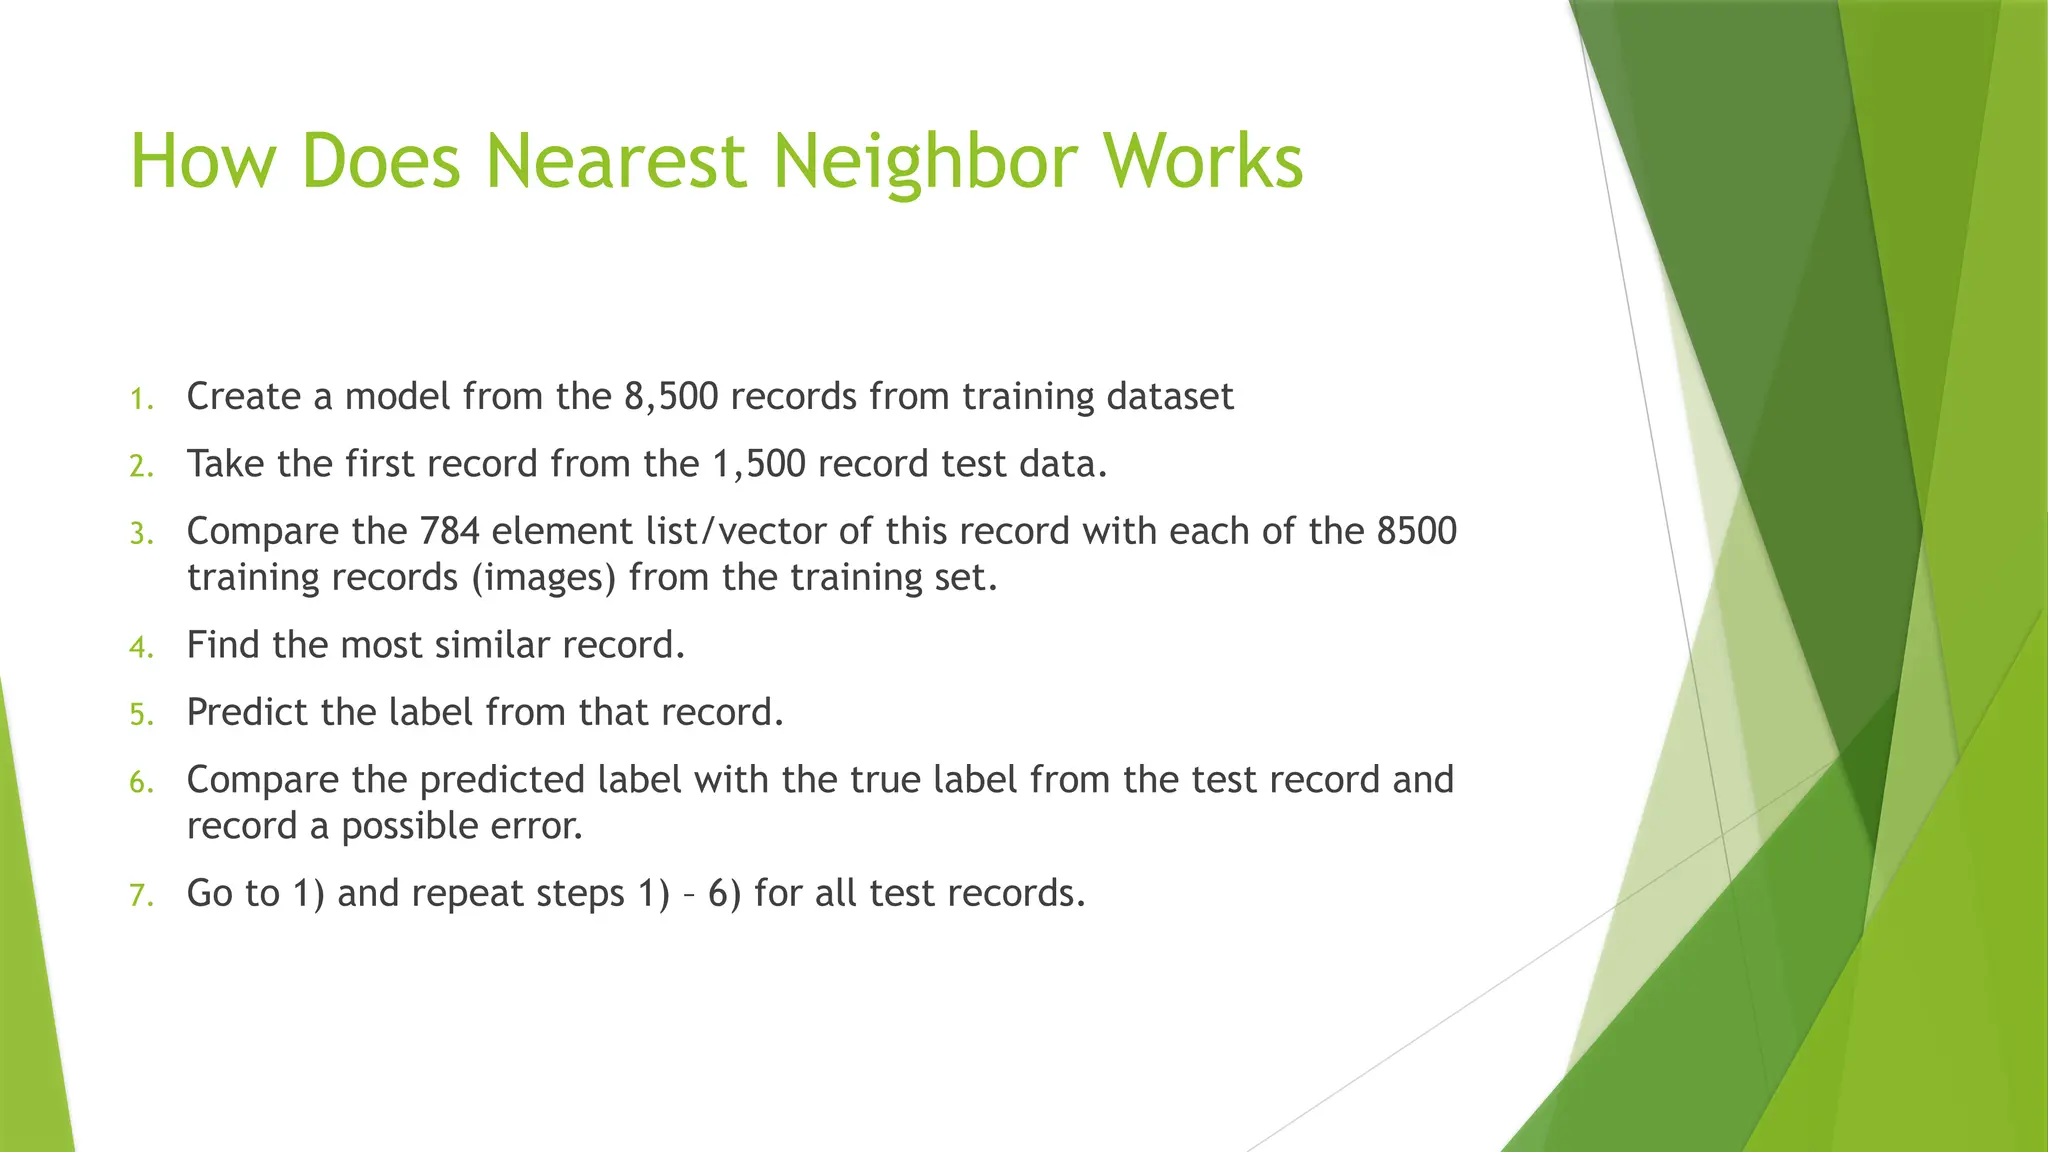
How Does NearestNeighbor Works 1. Create a model from the 8,500 records from training dataset 2. Take the first record from the 1,500 record test data. 3. Compare the 784 element list/vector of this record with each of the 8500 training records (images) from the training set. 4. Find the most similar record. 5. Predict the label from that record. 6. Compare the predicted label with the true label from the test record and record a possible error. 7. Go to 1) and repeat steps 1) – 6) for all test records.
17.
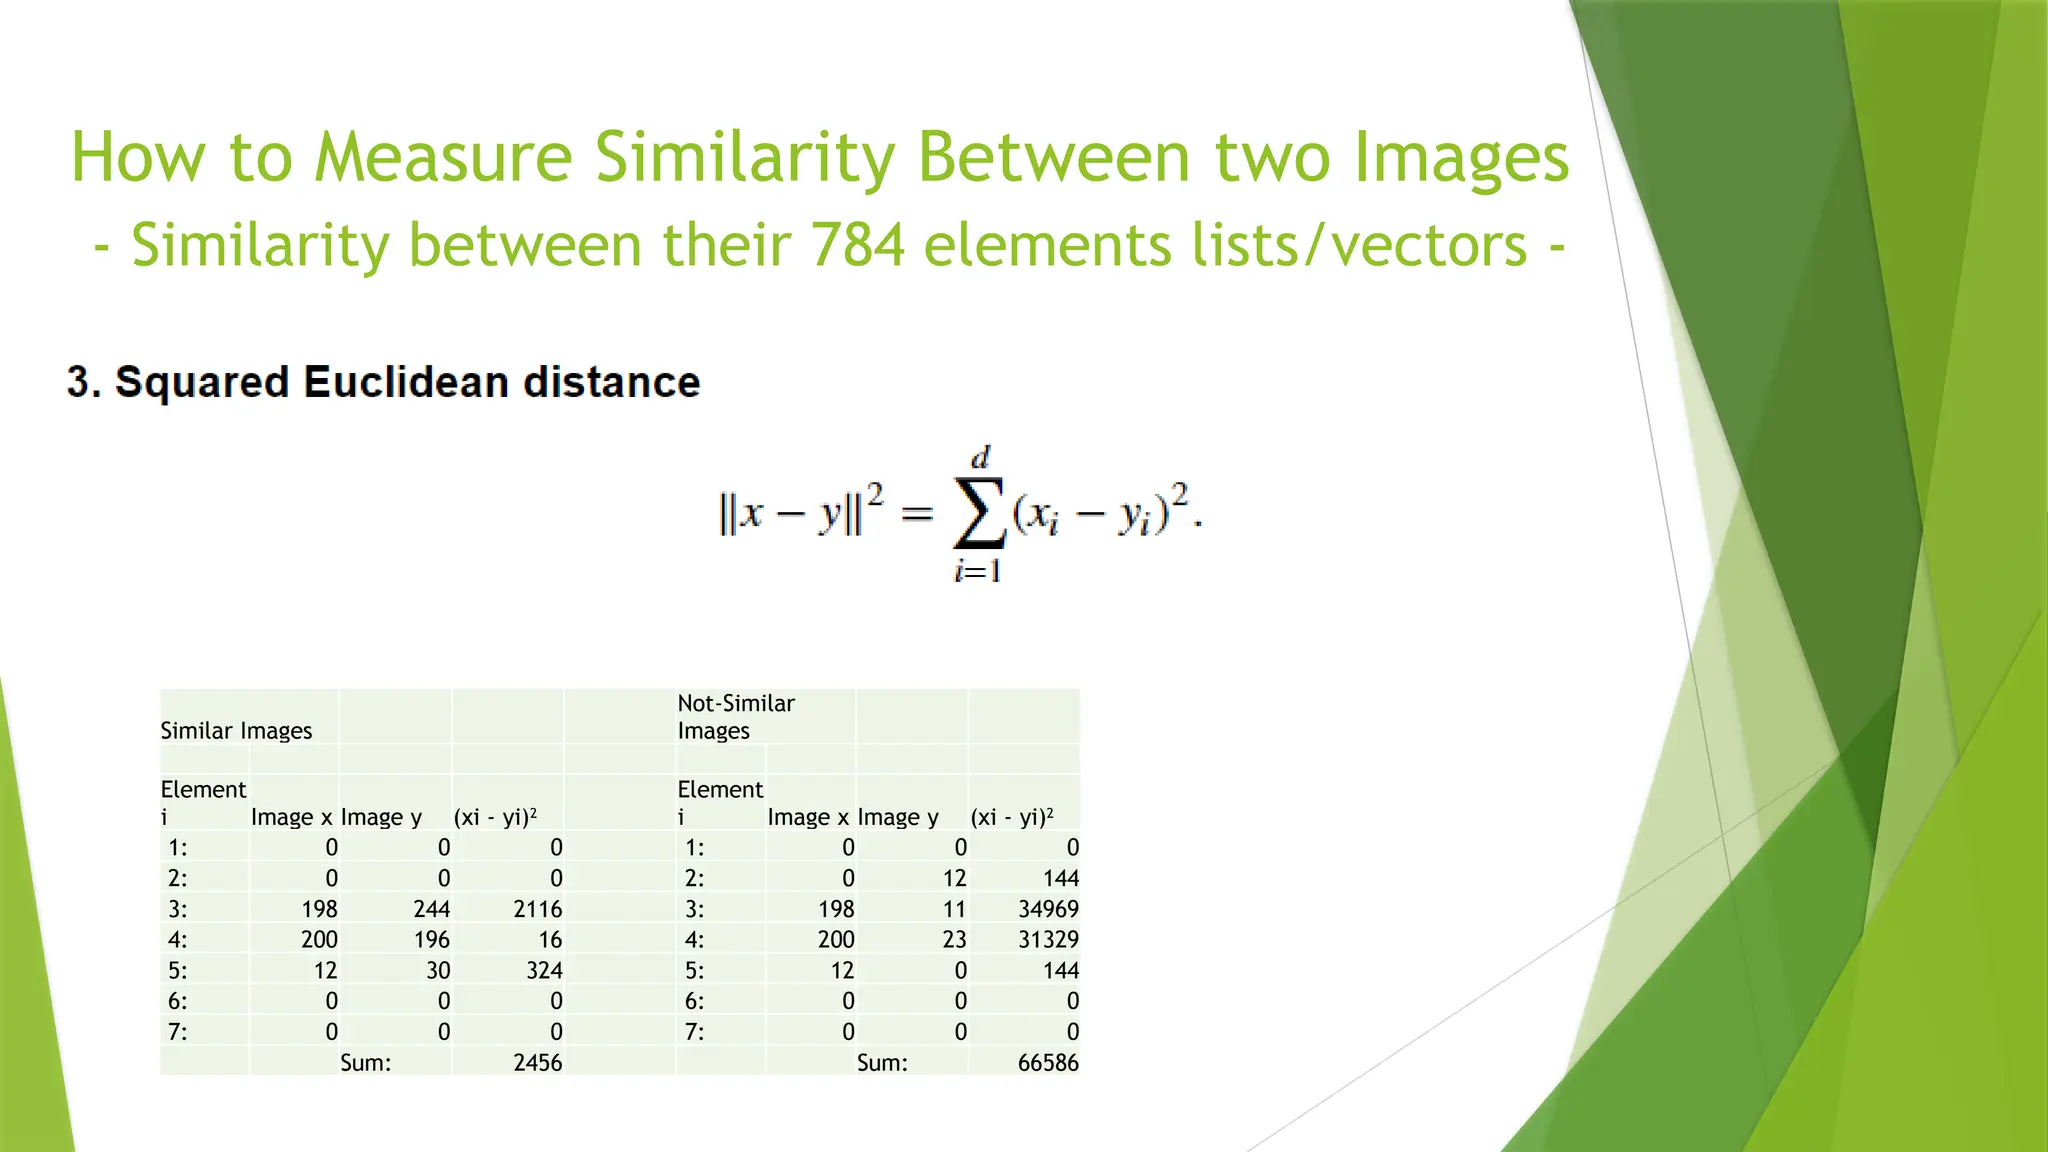
How to MeasureSimilarity Between two Images - Similarity between their 784 elements lists/vectors - Similar Images Not-Similar Images Element i Image x Image y (xi - yi)2 Element i Image x Image y (xi - yi)2 1: 0 0 0 1: 0 0 0 2: 0 0 0 2: 0 12 144 3: 198 244 2116 3: 198 11 34969 4: 200 196 16 4: 200 23 31329 5: 12 30 324 5: 12 0 144 6: 0 0 0 6: 0 0 0 7: 0 0 0 7: 0 0 0 Sum: 2456 Sum: 66586