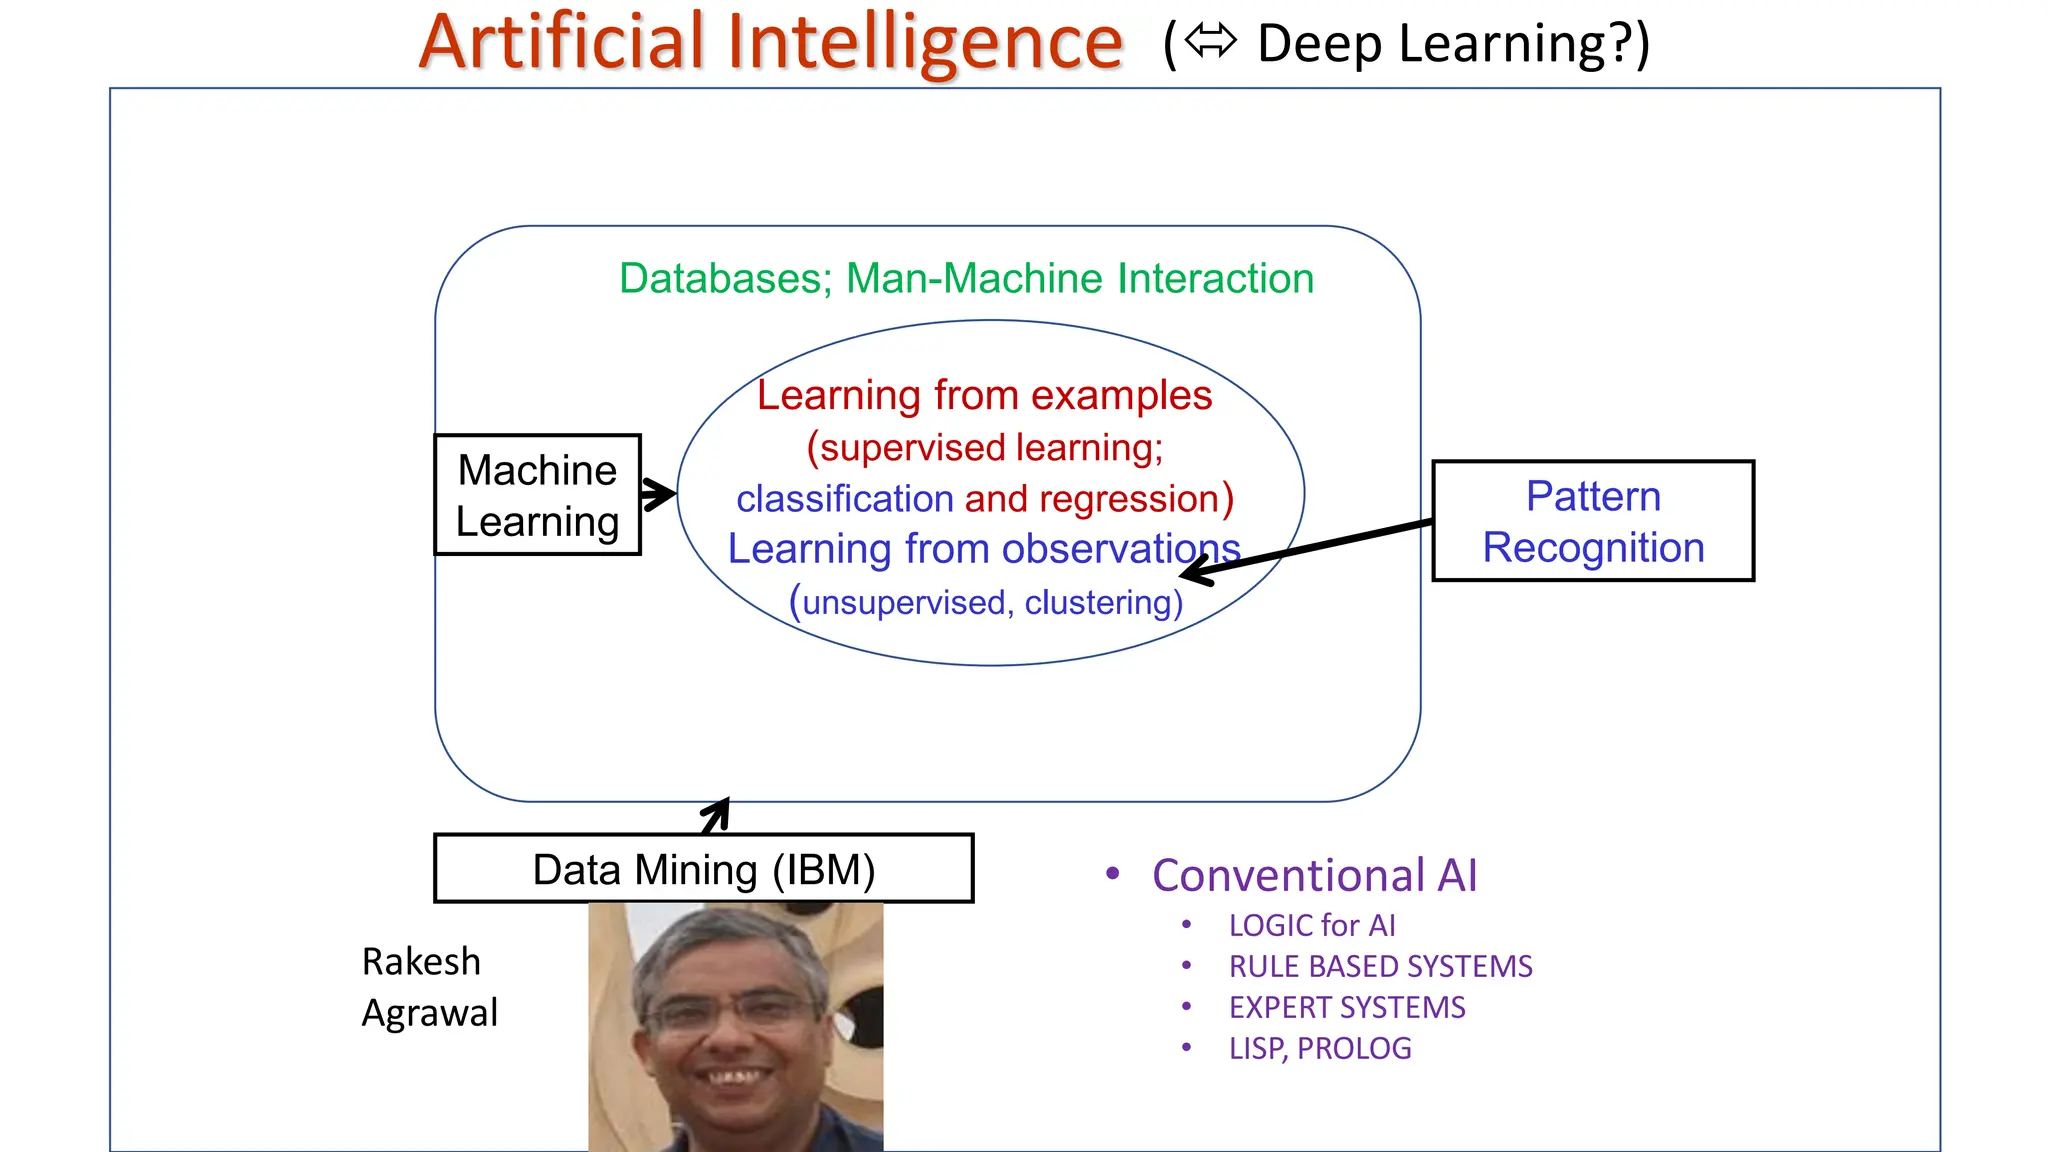
Learning from examples (supervisedlearning; classification and regression) Learning from observations (unsupervised, clustering) Databases; Man-Machine Interaction Data Mining (IBM) Machine Learning Pattern Recognition Artificial Intelligence • Conventional AI • LOGIC for AI • RULE BASED SYSTEMS • EXPERT SYSTEMS • LISP, PROLOG Rakesh Agrawal ( Deep Learning?)
3.
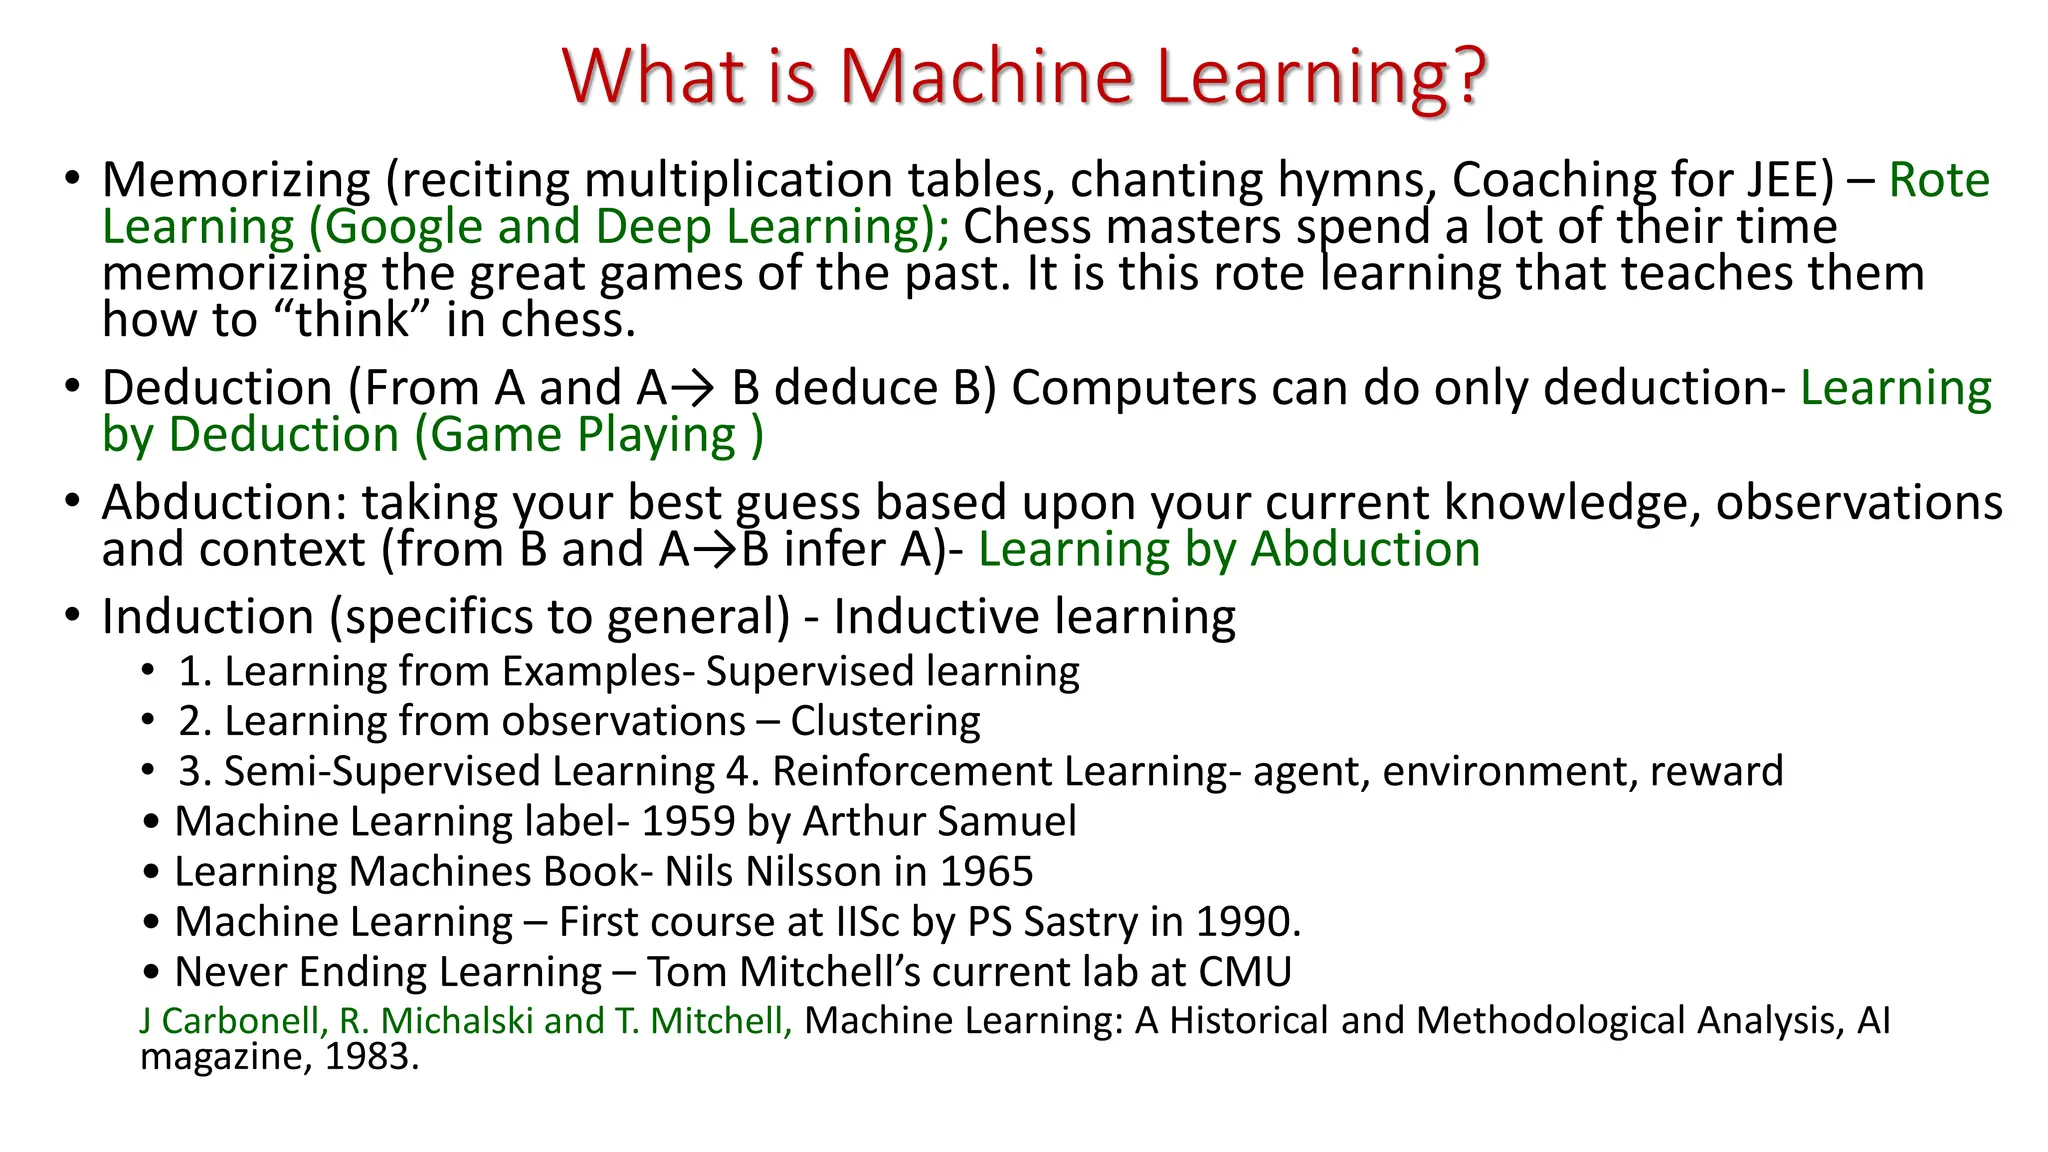
What is MachineLearning? • Memorizing (reciting multiplication tables, chanting hymns, Coaching for JEE) – Rote Learning (Google and Deep Learning); Chess masters spend a lot of their time memorizing the great games of the past. It is this rote learning that teaches them how to “think” in chess. • Deduction (From A and A→ B deduce B) Computers can do only deduction- Learning by Deduction (Game Playing ) • Abduction: taking your best guess based upon your current knowledge, observations and context (from B and A→B infer A)- Learning by Abduction • Induction (specifics to general) - Inductive learning • 1. Learning from Examples- Supervised learning • 2. Learning from observations – Clustering • 3. Semi-Supervised Learning 4. Reinforcement Learning- agent, environment, reward • Machine Learning label- 1959 by Arthur Samuel • Learning Machines Book- Nils Nilsson in 1965 • Machine Learning – First course at IISc by PS Sastry in 1990. • Never Ending Learning – Tom Mitchell’s current lab at CMU J Carbonell, R. Michalski and T. Mitchell, Machine Learning: A Historical and Methodological Analysis, AI magazine, 1983.
4.
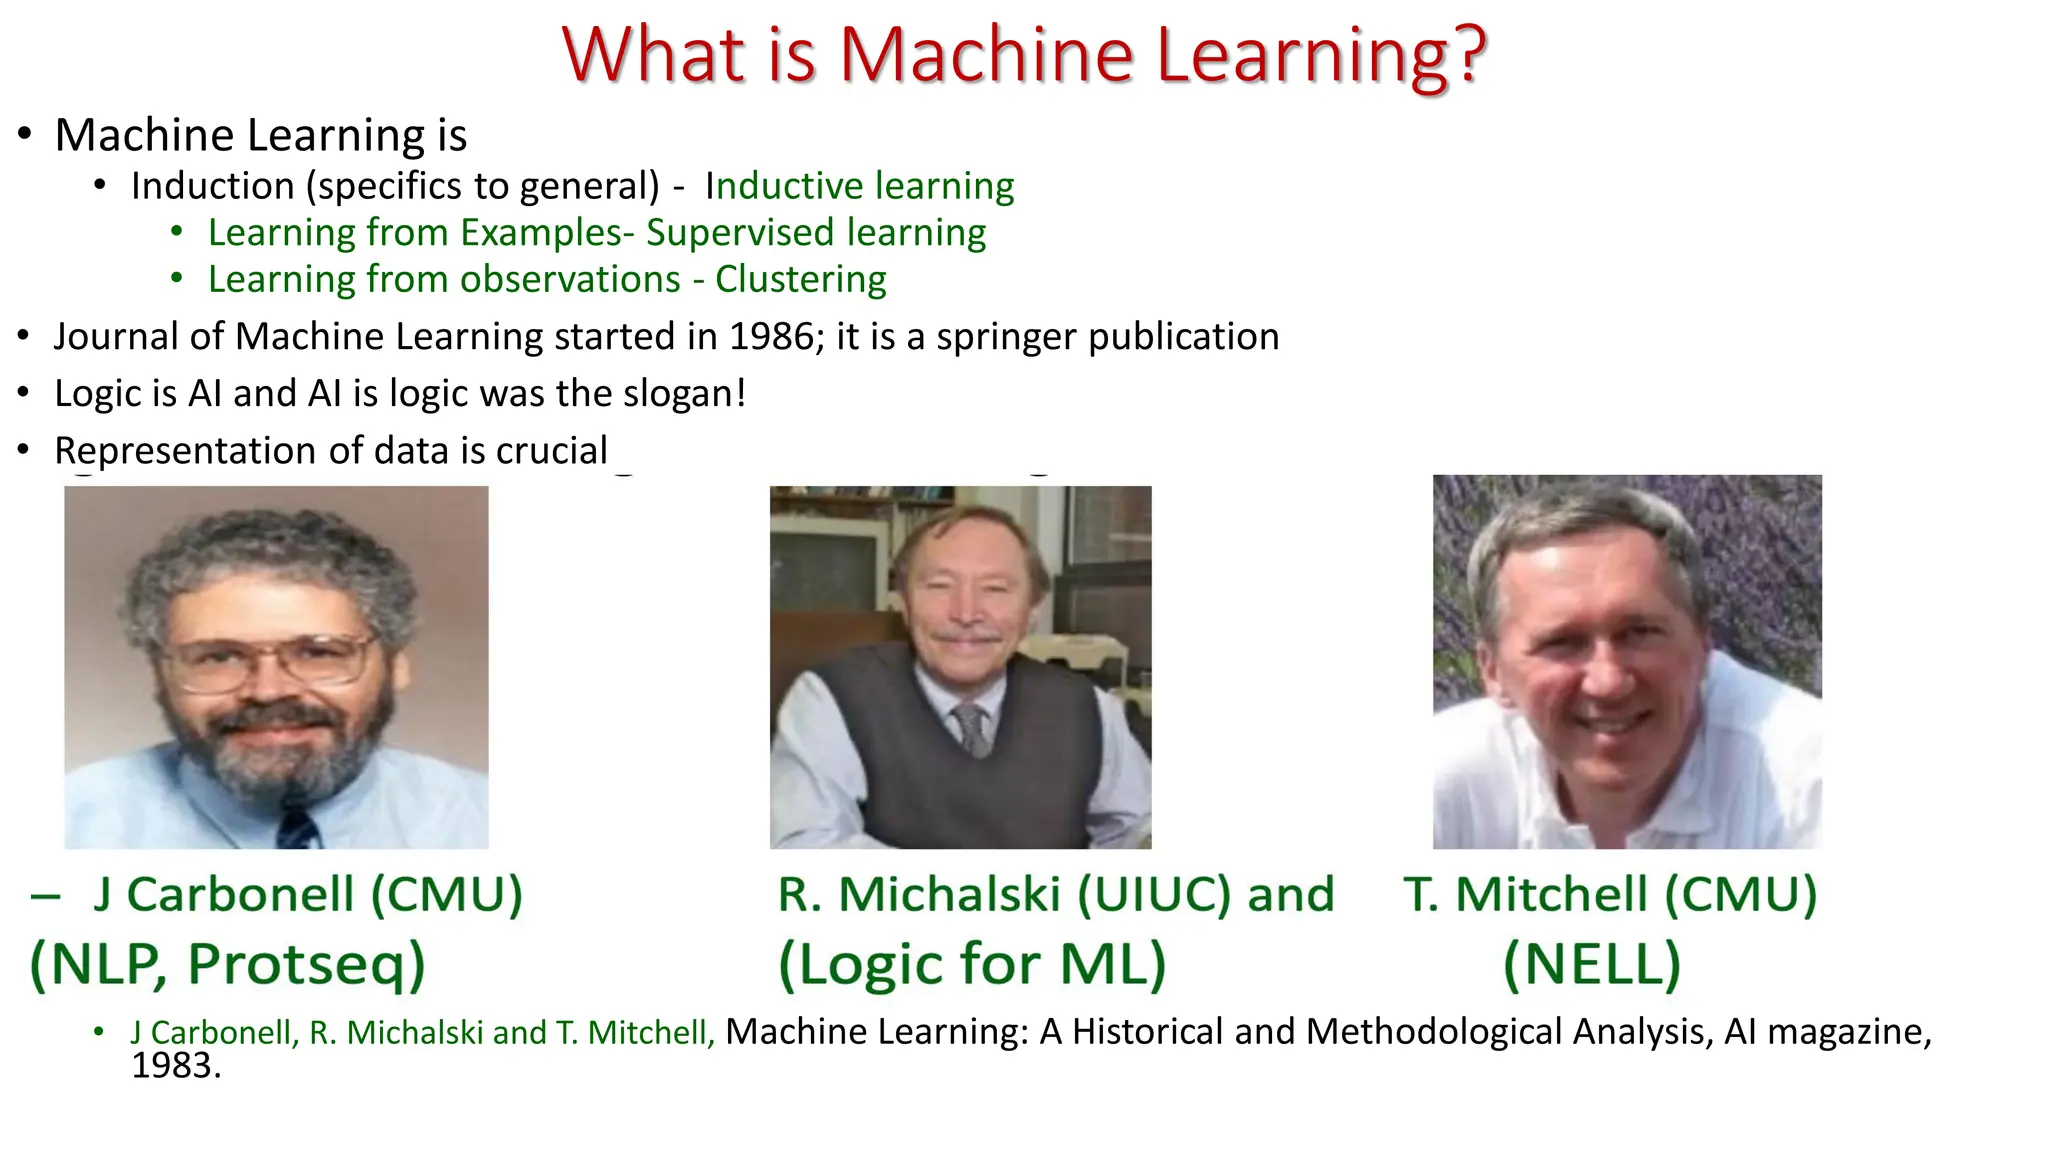
What is MachineLearning? • Machine Learning is • Induction (specifics to general) - Inductive learning • Learning from Examples- Supervised learning • Learning from observations - Clustering • Journal of Machine Learning started in 1986; it is a springer publication • Logic is AI and AI is logic was the slogan! • Representation of data is crucial • J Carbonell, R. Michalski and T. Mitchell, Machine Learning: A Historical and Methodological Analysis, AI magazine, 1983.
5.
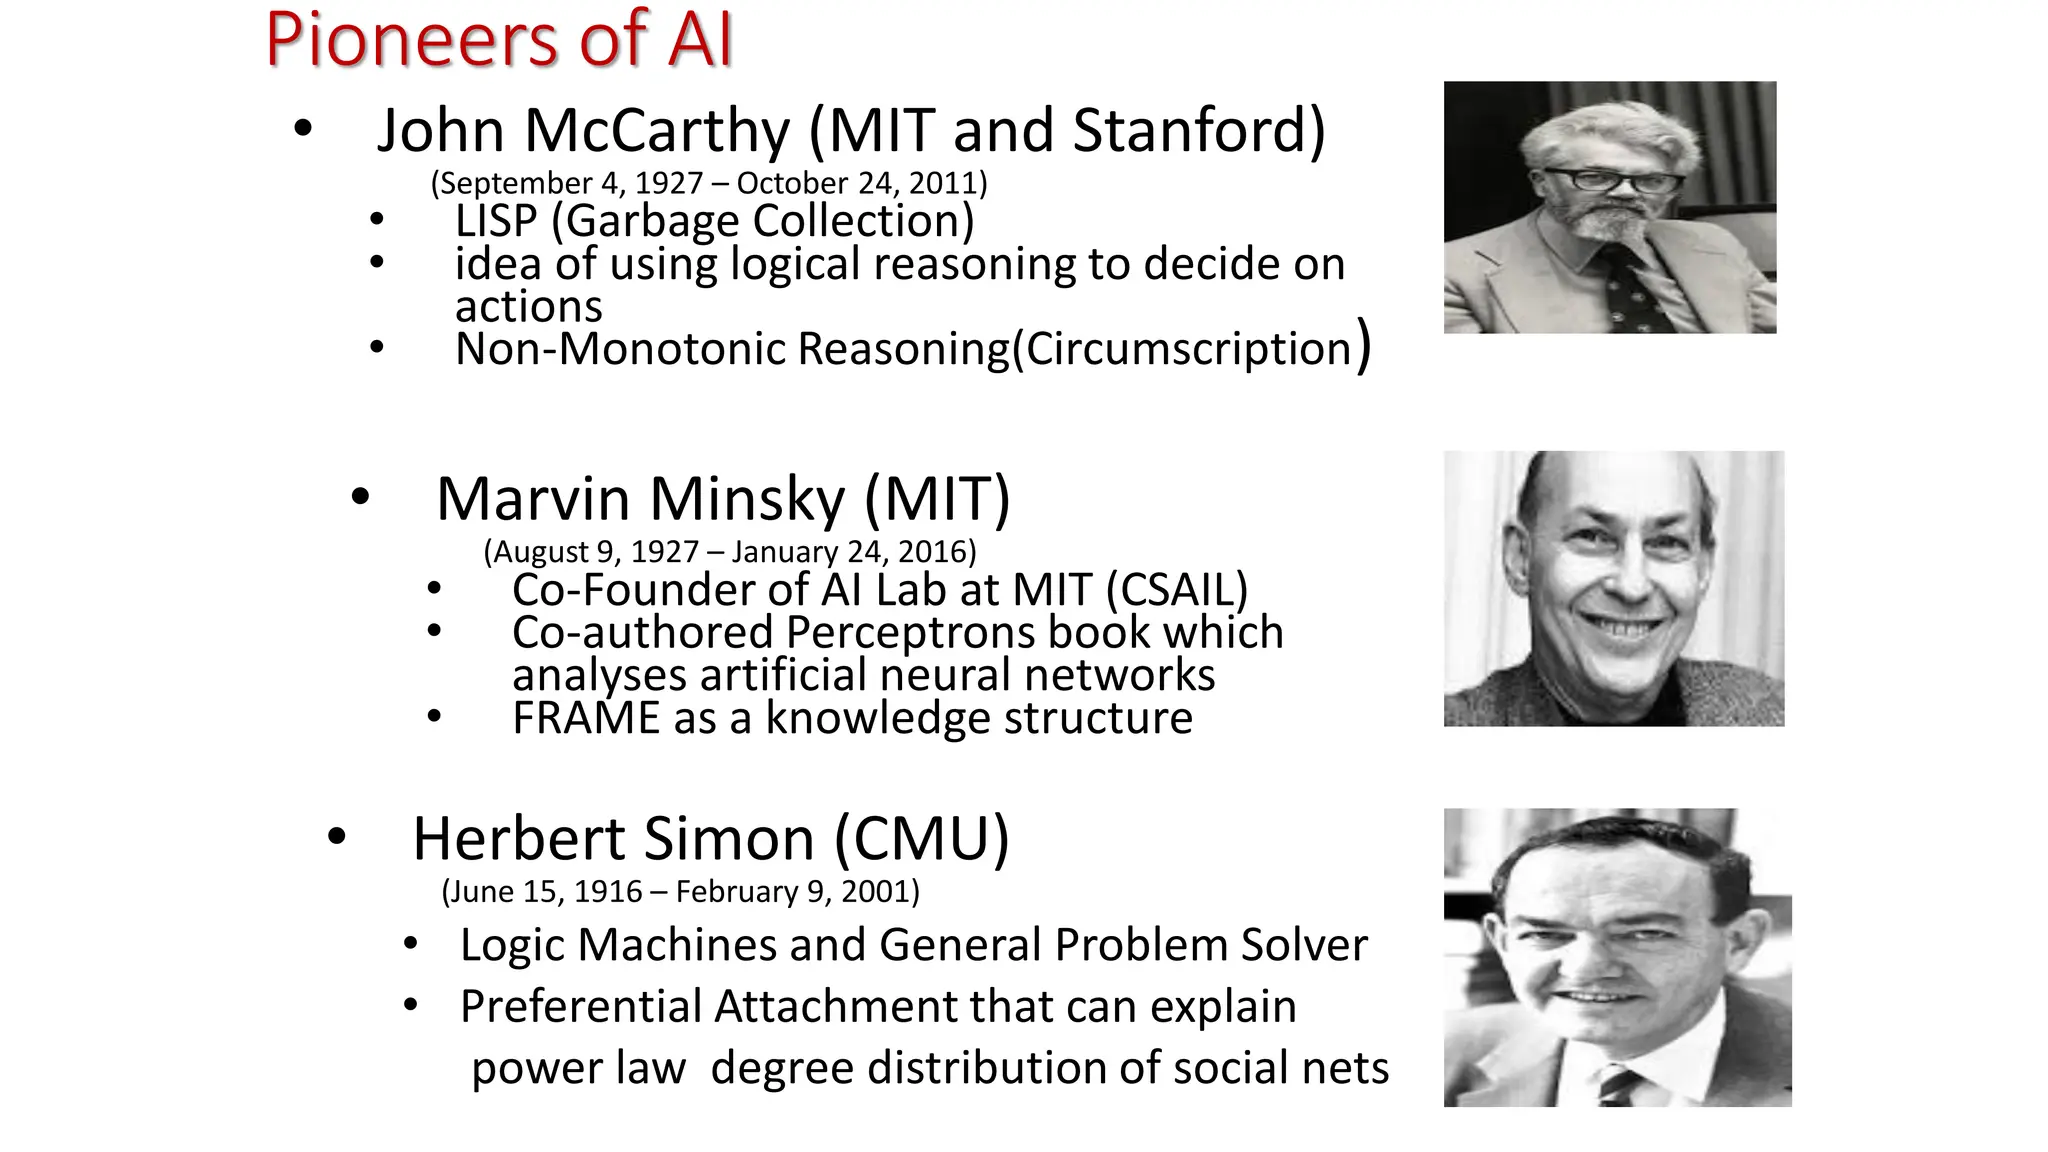
Pioneers of AI •John McCarthy (MIT and Stanford) (September 4, 1927 – October 24, 2011) • LISP (Garbage Collection) • idea of using logical reasoning to decide on actions • Non-Monotonic Reasoning(Circumscription) • Marvin Minsky (MIT) (August 9, 1927 – January 24, 2016) • Co-Founder of AI Lab at MIT (CSAIL) • Co-authored Perceptrons book which analyses artificial neural networks • FRAME as a knowledge structure • Herbert Simon (CMU) (June 15, 1916 – February 9, 2001) • Logic Machines and General Problem Solver • Preferential Attachment that can explain power law degree distribution of social nets
6.
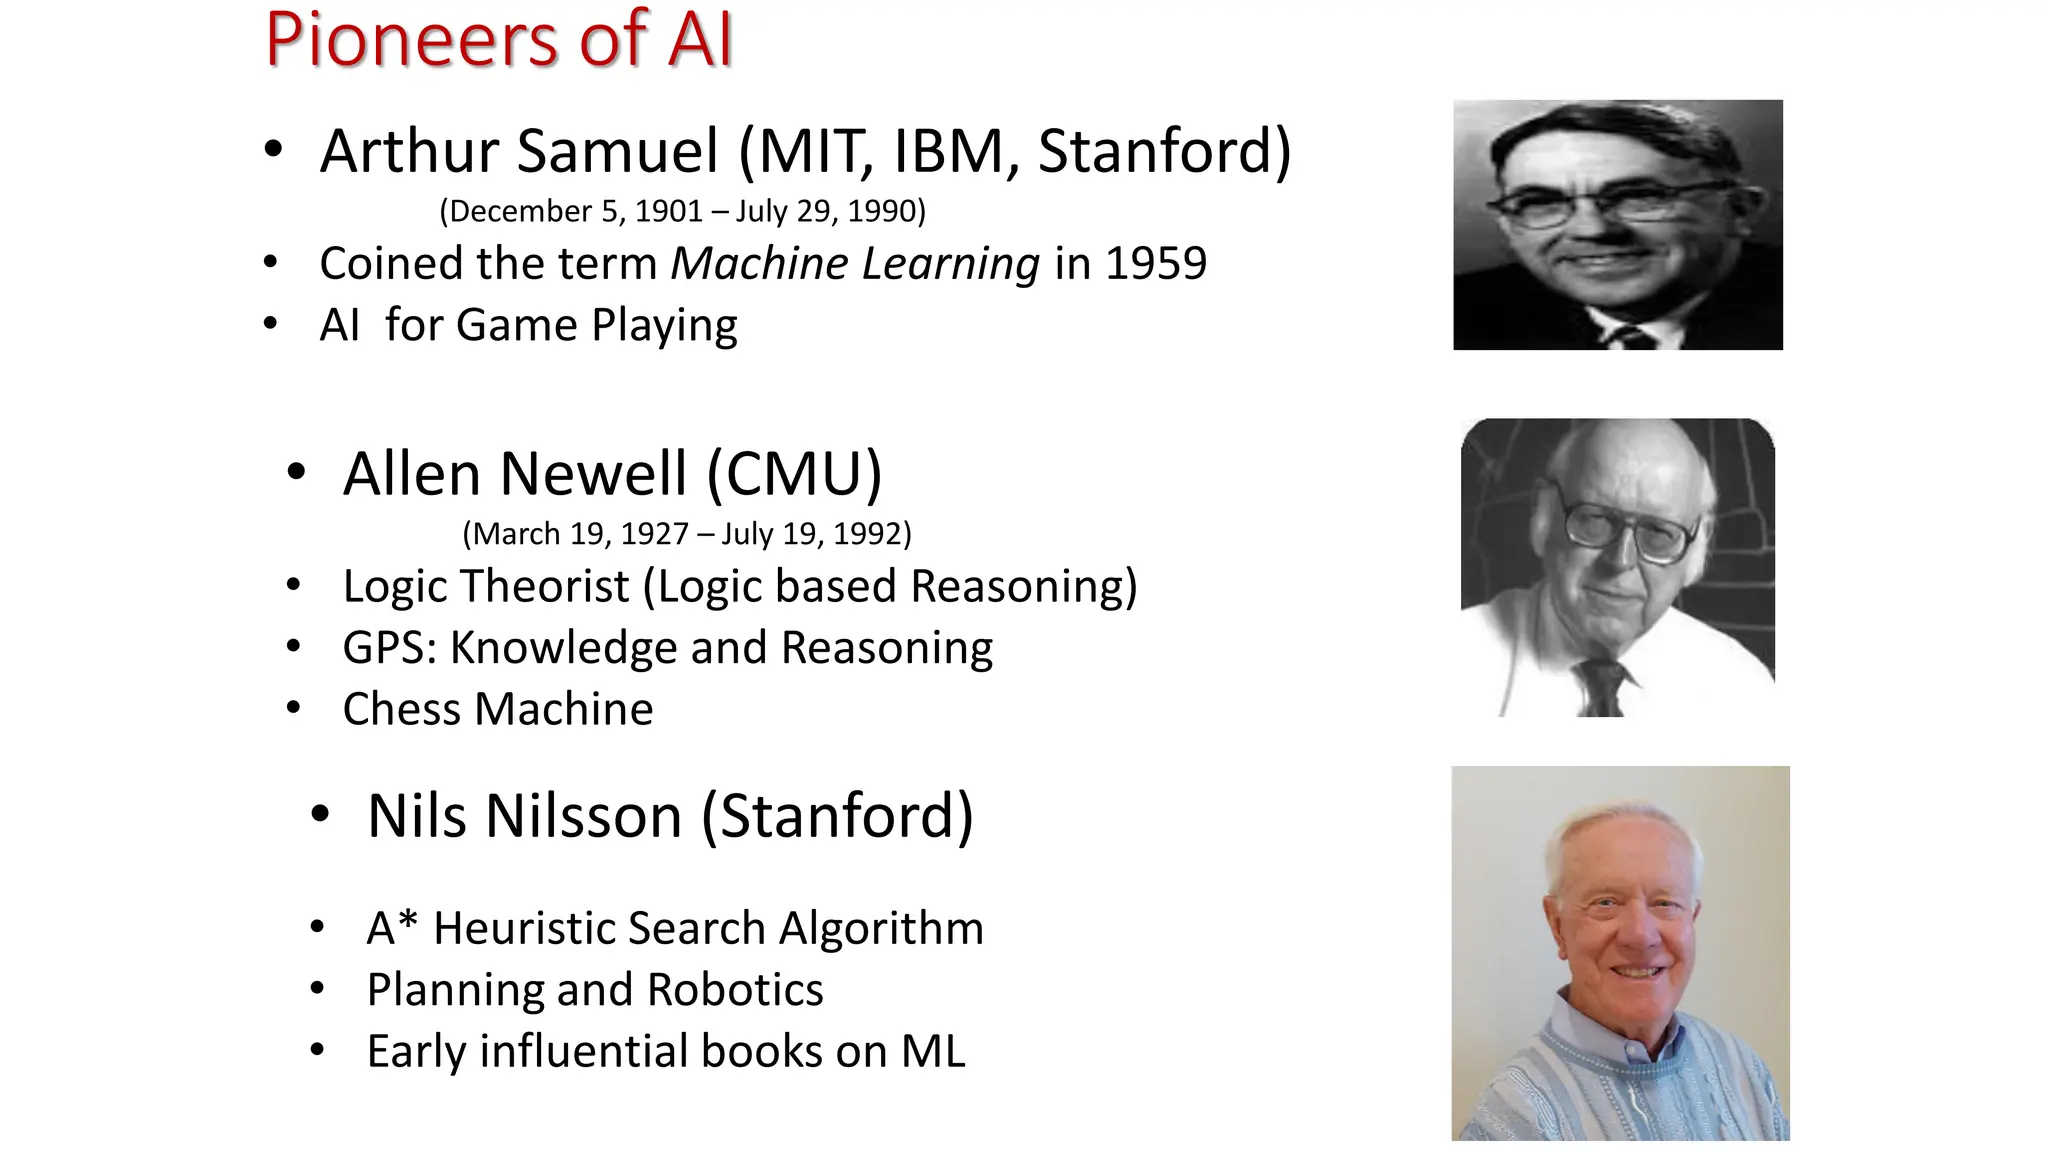
Pioneers of AI •Arthur Samuel (MIT, IBM, Stanford) (December 5, 1901 – July 29, 1990) • Coined the term Machine Learning in 1959 • AI for Game Playing • Allen Newell (CMU) (March 19, 1927 – July 19, 1992) • Logic Theorist (Logic based Reasoning) • GPS: Knowledge and Reasoning • Chess Machine • Nils Nilsson (Stanford) • A* Heuristic Search Algorithm • Planning and Robotics • Early influential books on ML
7.
Recent Developments In theearly days of ML, data fits in the main memory is the basis! • More data is generated: – Web, text, images ... – Business transactions, calls, ... – Scientific data: astronomy, biology, etc • More data is captured: – Storage technology faster and cheaper – DBMS can handle bigger DB • Data generation is faster than its Consumption! • Better Computing power • Big Data!
8.
Machine Learning: Literature •International Conference on Machine Learning (ICML) is the leading conference; the first one in 1980. Need to submit code also. • Recent one in July 2021 • Journal of Machine Learning Research (JMLR) was established in 2000; the first issue came out in Oct 2000. – The journal was established as an open-access alternative to the journal Machine Learning; this was started in 1986. – In 2000, forty editorial board members of Machine Learning resigned, saying that in the era of the Internet, it was detrimental to publish in expensive journals with pay-access. • International Conference on Learning Representations (ICLR), recent one in May 2021: Open Review – There is a challenge to investigate reproducibility of empirical results submitted to the conference. Selected reproducibility efforts will be published as a special journal issue.
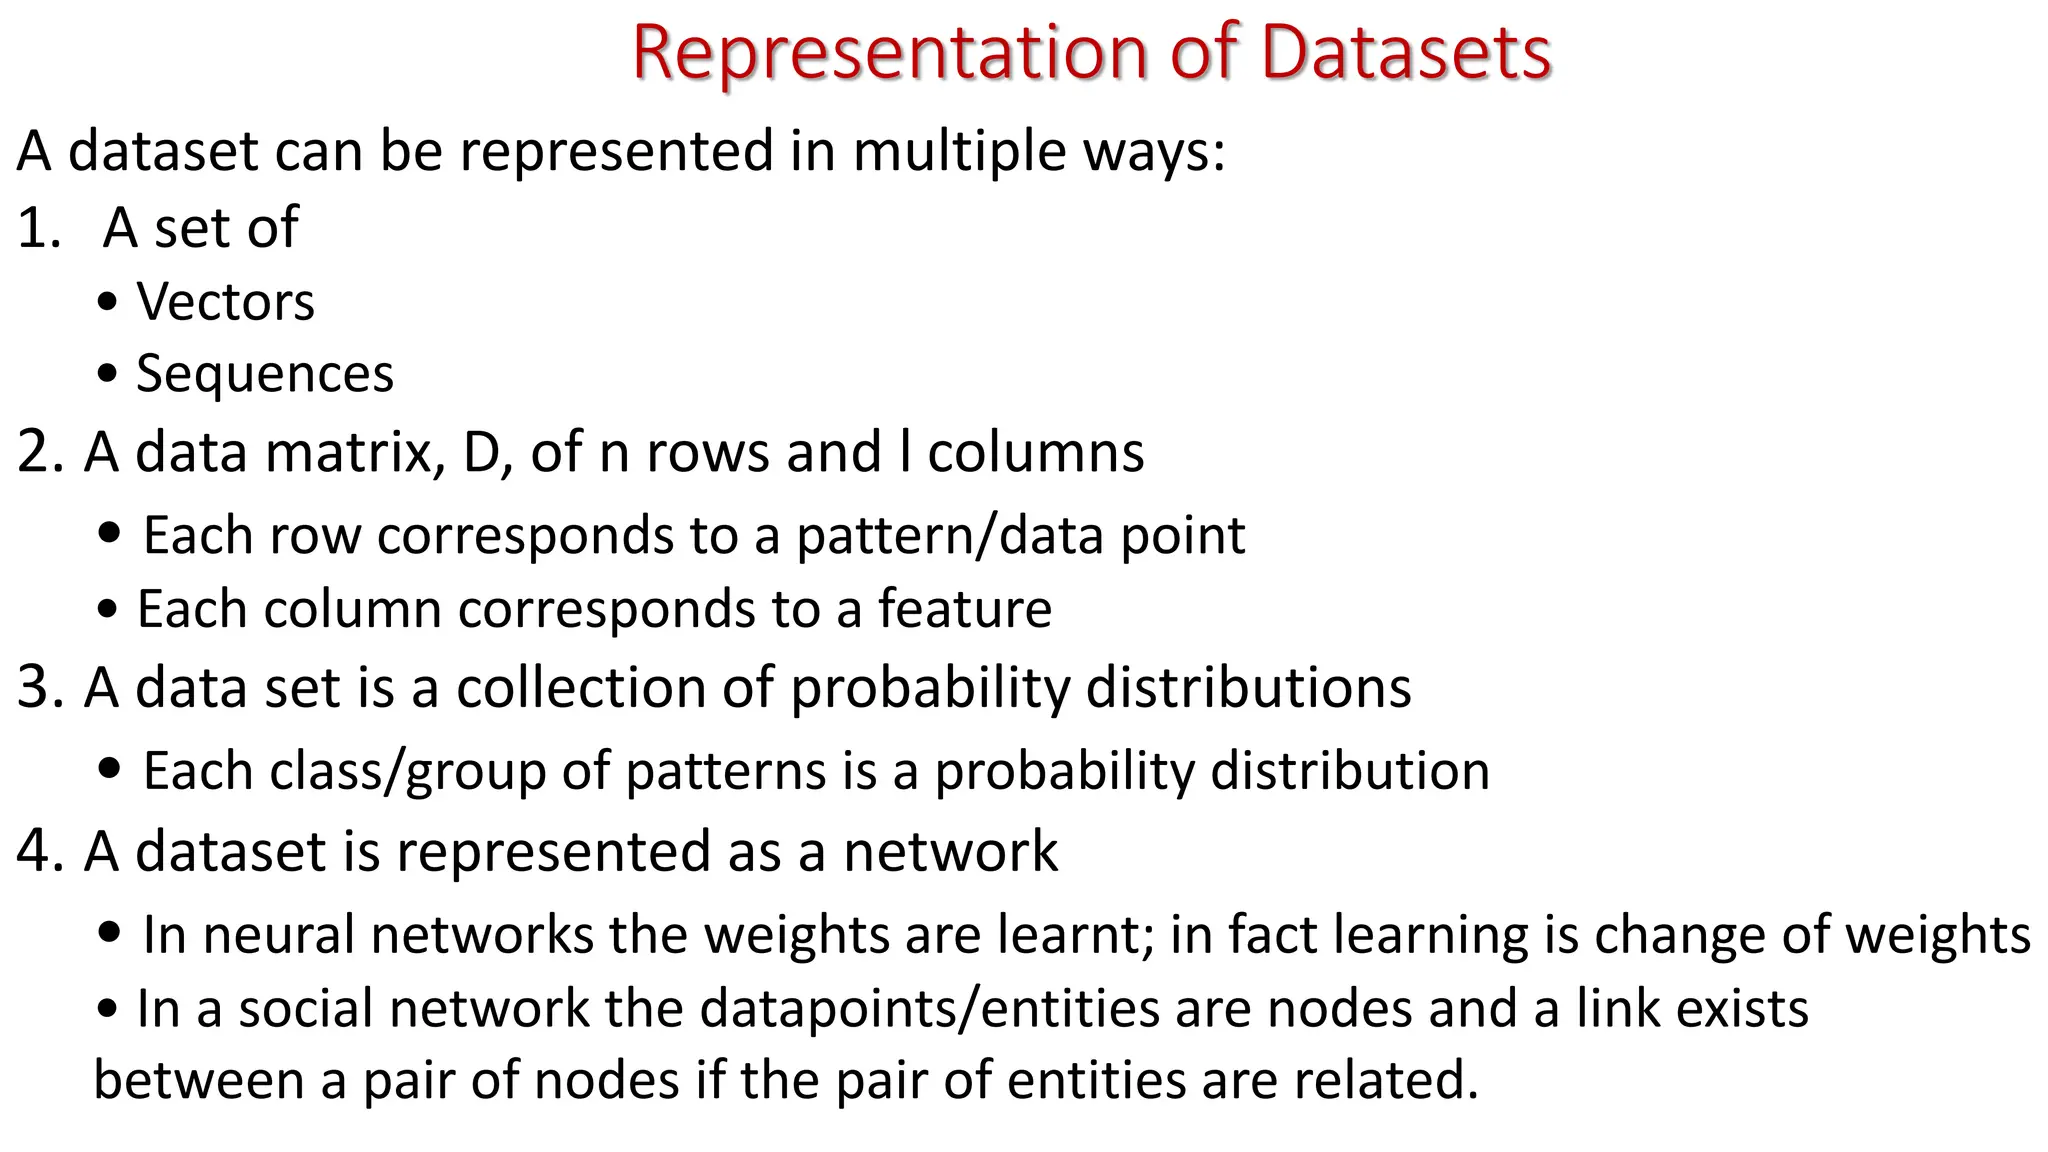
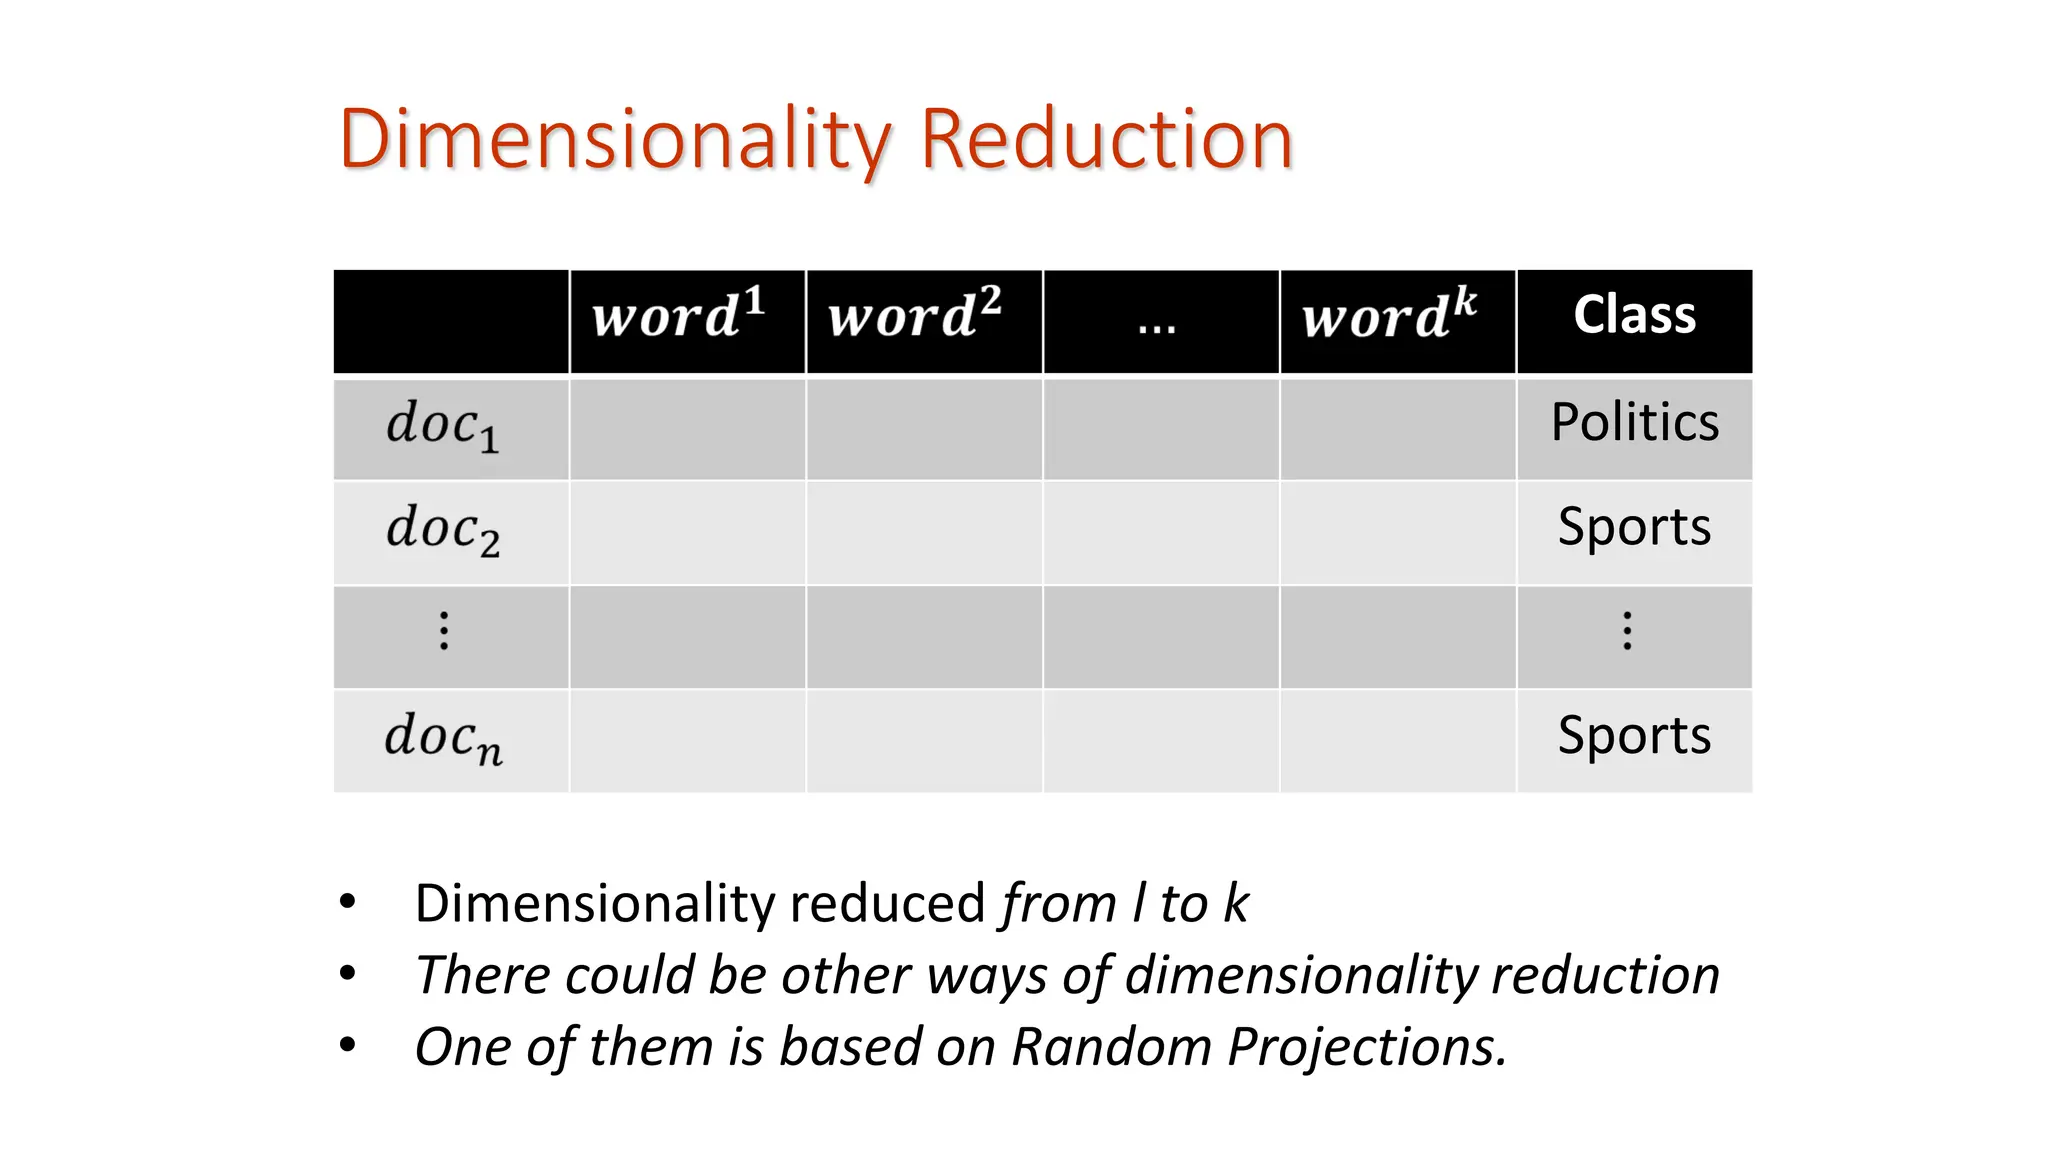
Representation of Datasets Adataset can be represented in multiple ways: 1. A set of • Vectors • Sequences 2. A data matrix, D, of n rows and l columns • Each row corresponds to a pattern/data point • Each column corresponds to a feature 3. A data set is a collection of probability distributions • Each class/group of patterns is a probability distribution 4. A dataset is represented as a network • In neural networks the weights are learnt; in fact learning is change of weights • In a social network the datapoints/entities are nodes and a link exists between a pair of nodes if the pair of entities are related.
11.
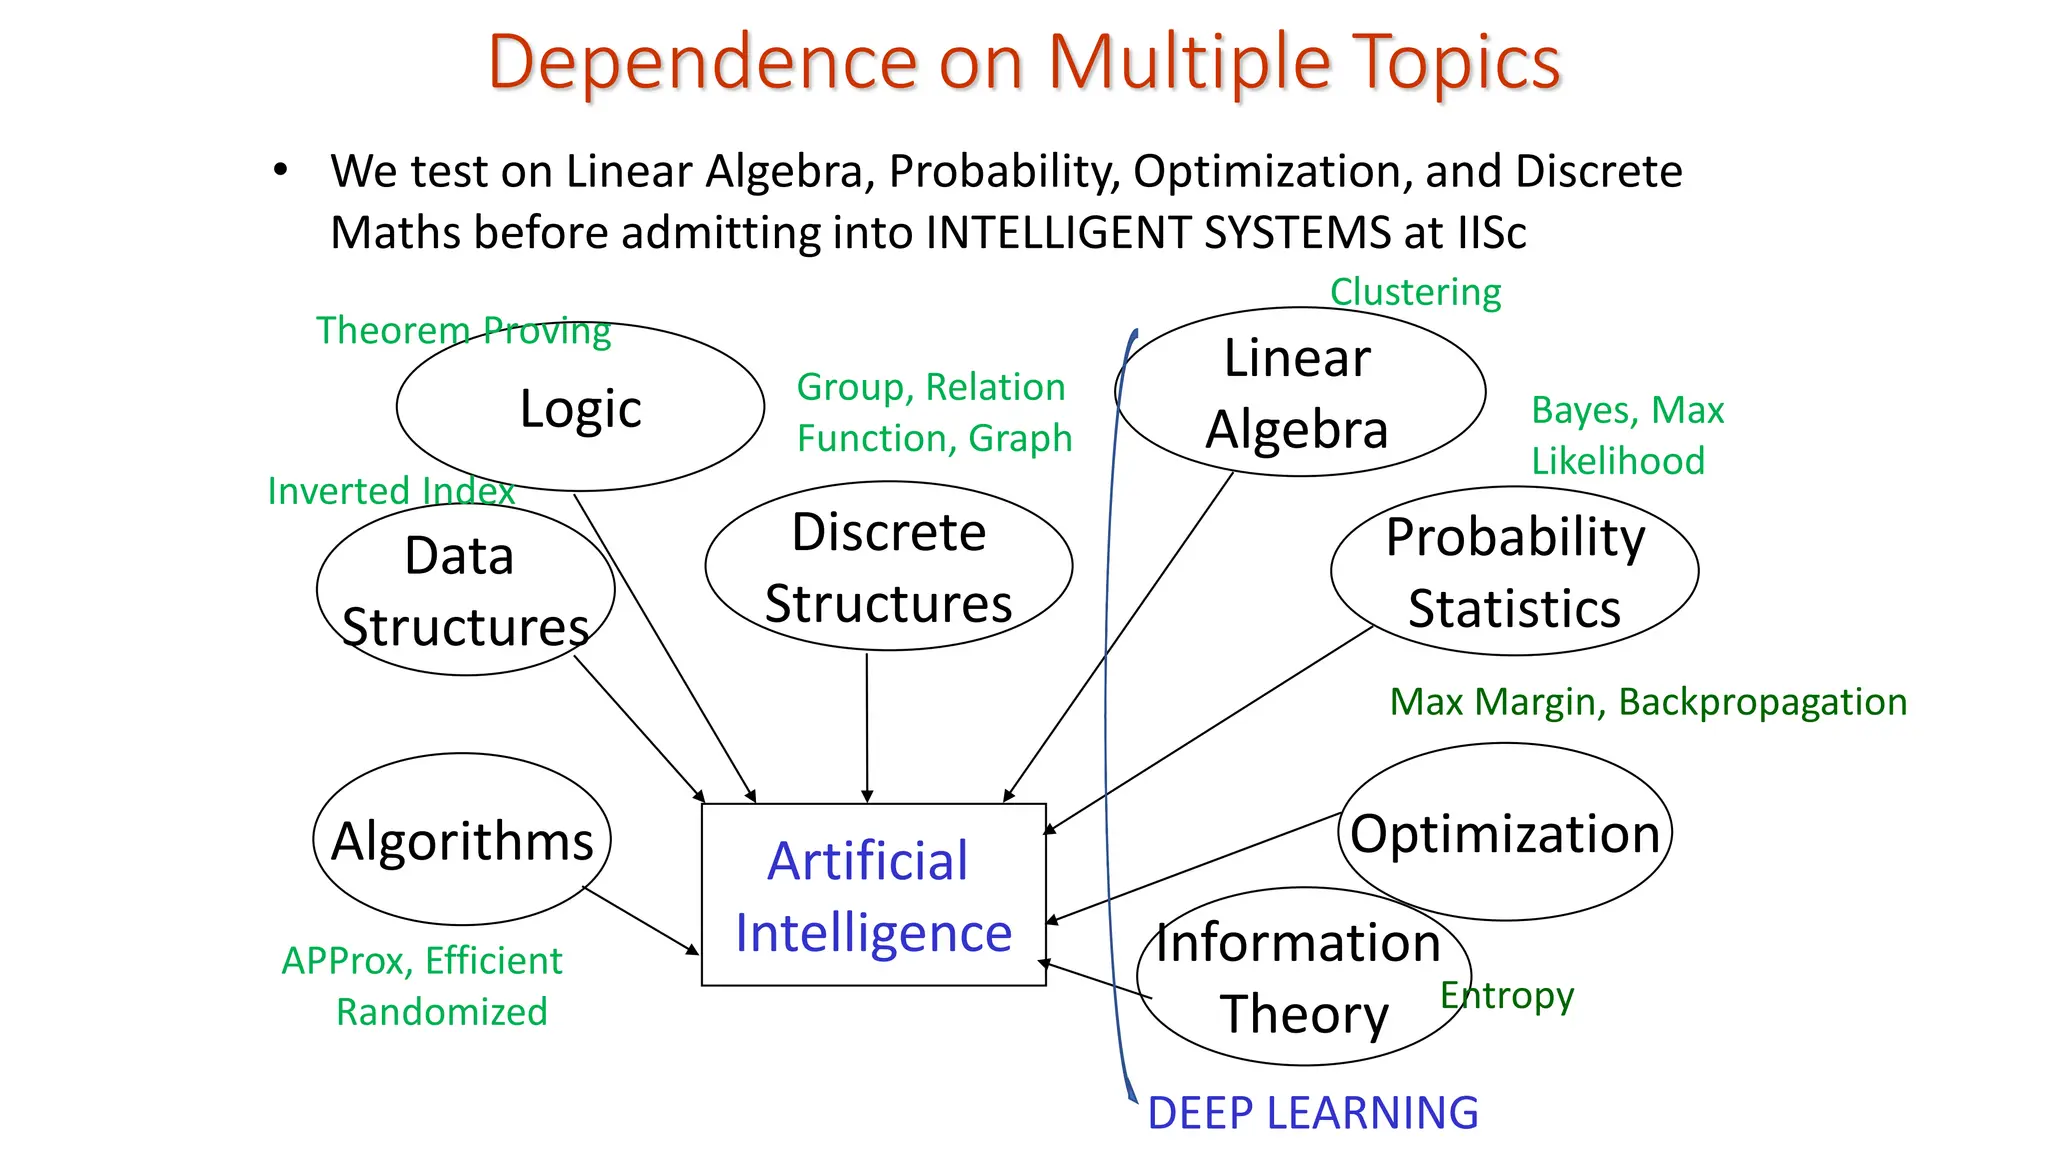
DEEP LEARNING Dependence onMultiple Topics Logic Discrete Structures Artificial Intelligence Optimization Data Structures Linear Algebra Probability Statistics Information Theory Algorithms • We test on Linear Algebra, Probability, Optimization, and Discrete Maths before admitting into INTELLIGENT SYSTEMS at IISc APProx, Efficient Randomized Inverted Index Clustering Group, Relation Function, Graph Bayes, Max Likelihood Max Margin, Backpropagation Entropy Theorem Proving
12.
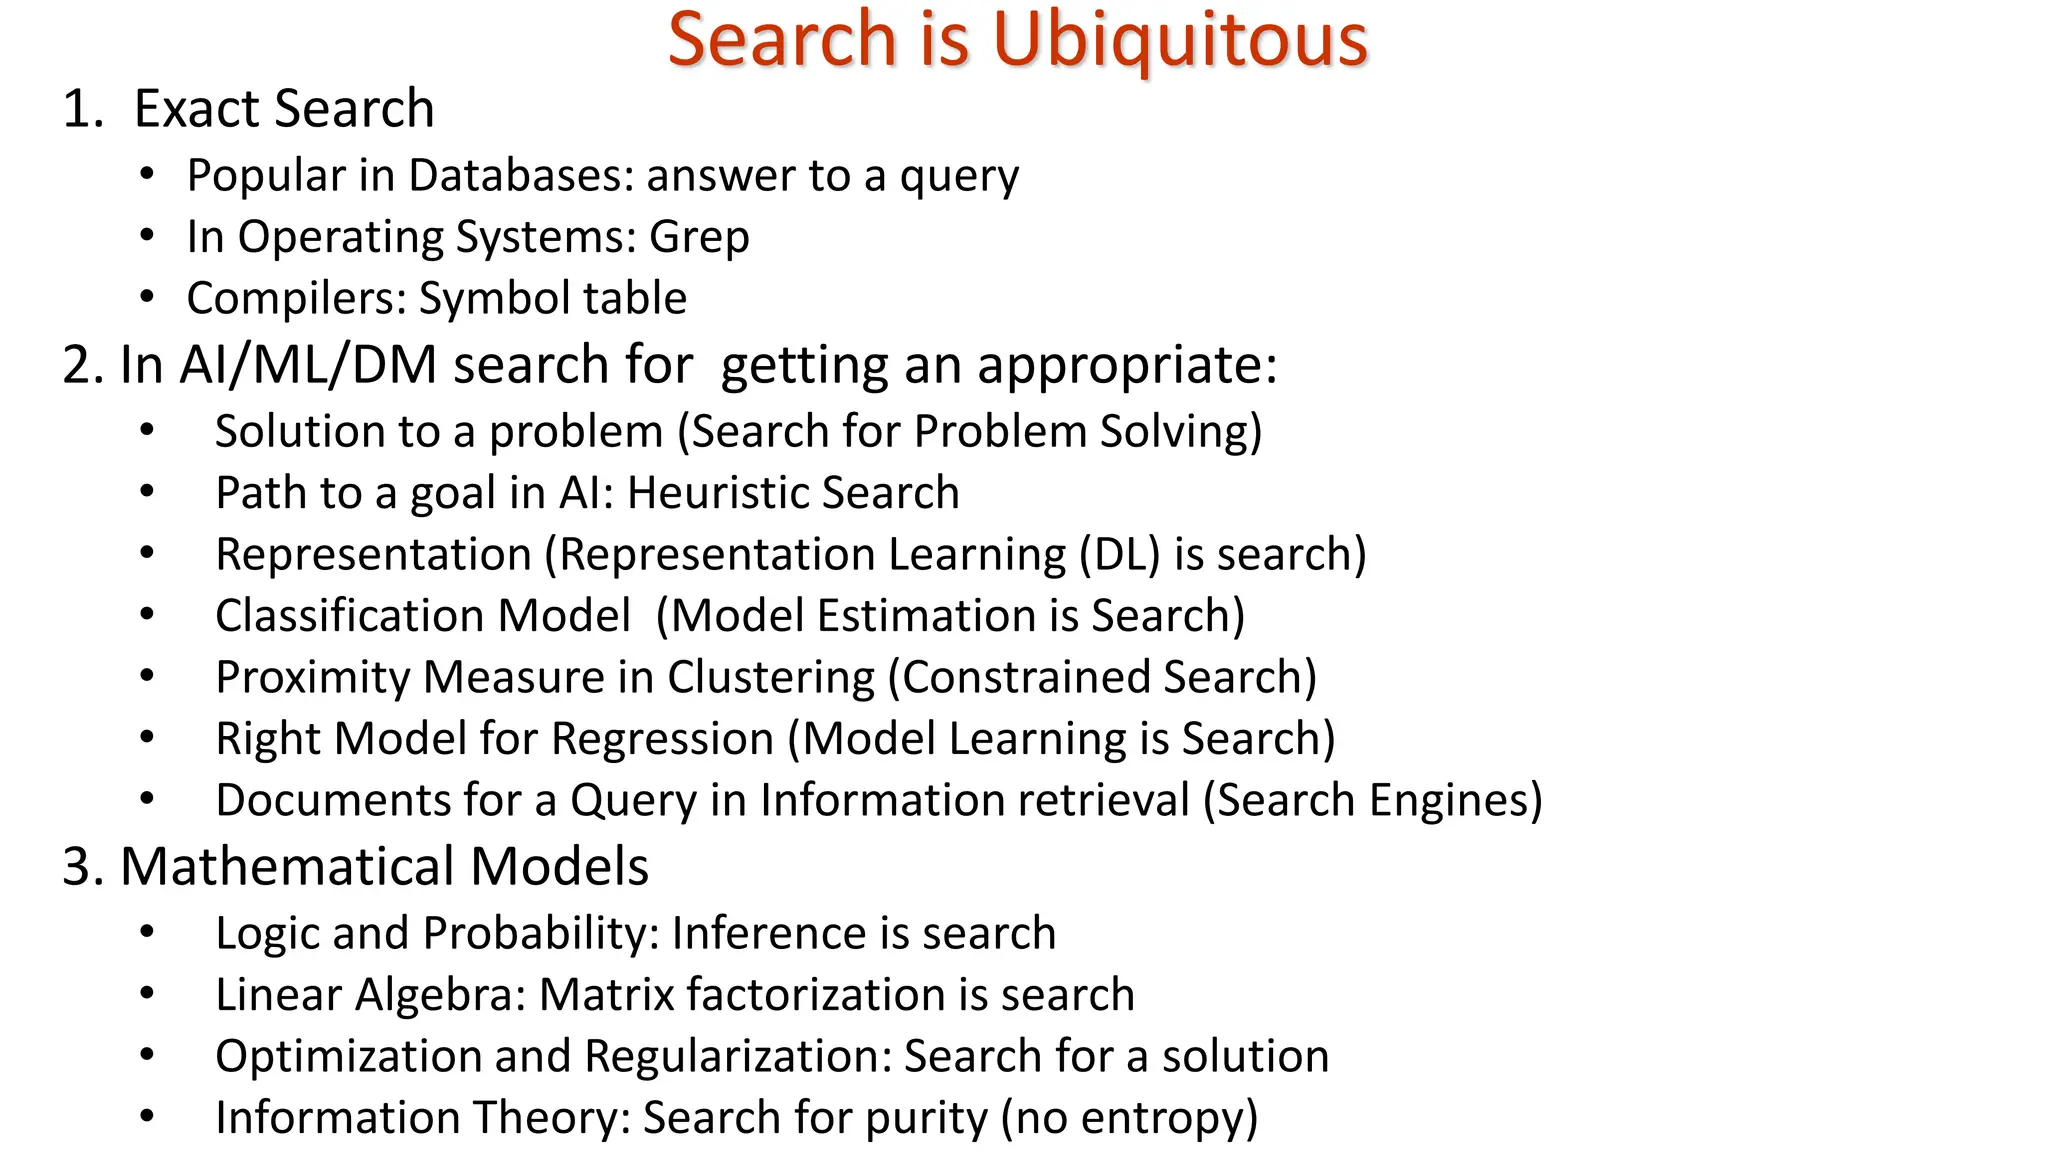
Search is Ubiquitous 1.Exact Search • Popular in Databases: answer to a query • In Operating Systems: Grep • Compilers: Symbol table 2. In AI/ML/DM search for getting an appropriate: • Solution to a problem (Search for Problem Solving) • Path to a goal in AI: Heuristic Search • Representation (Representation Learning (DL) is search) • Classification Model (Model Estimation is Search) • Proximity Measure in Clustering (Constrained Search) • Right Model for Regression (Model Learning is Search) • Documents for a Query in Information retrieval (Search Engines) 3. Mathematical Models • Logic and Probability: Inference is search • Linear Algebra: Matrix factorization is search • Optimization and Regularization: Search for a solution • Information Theory: Search for purity (no entropy)
13.
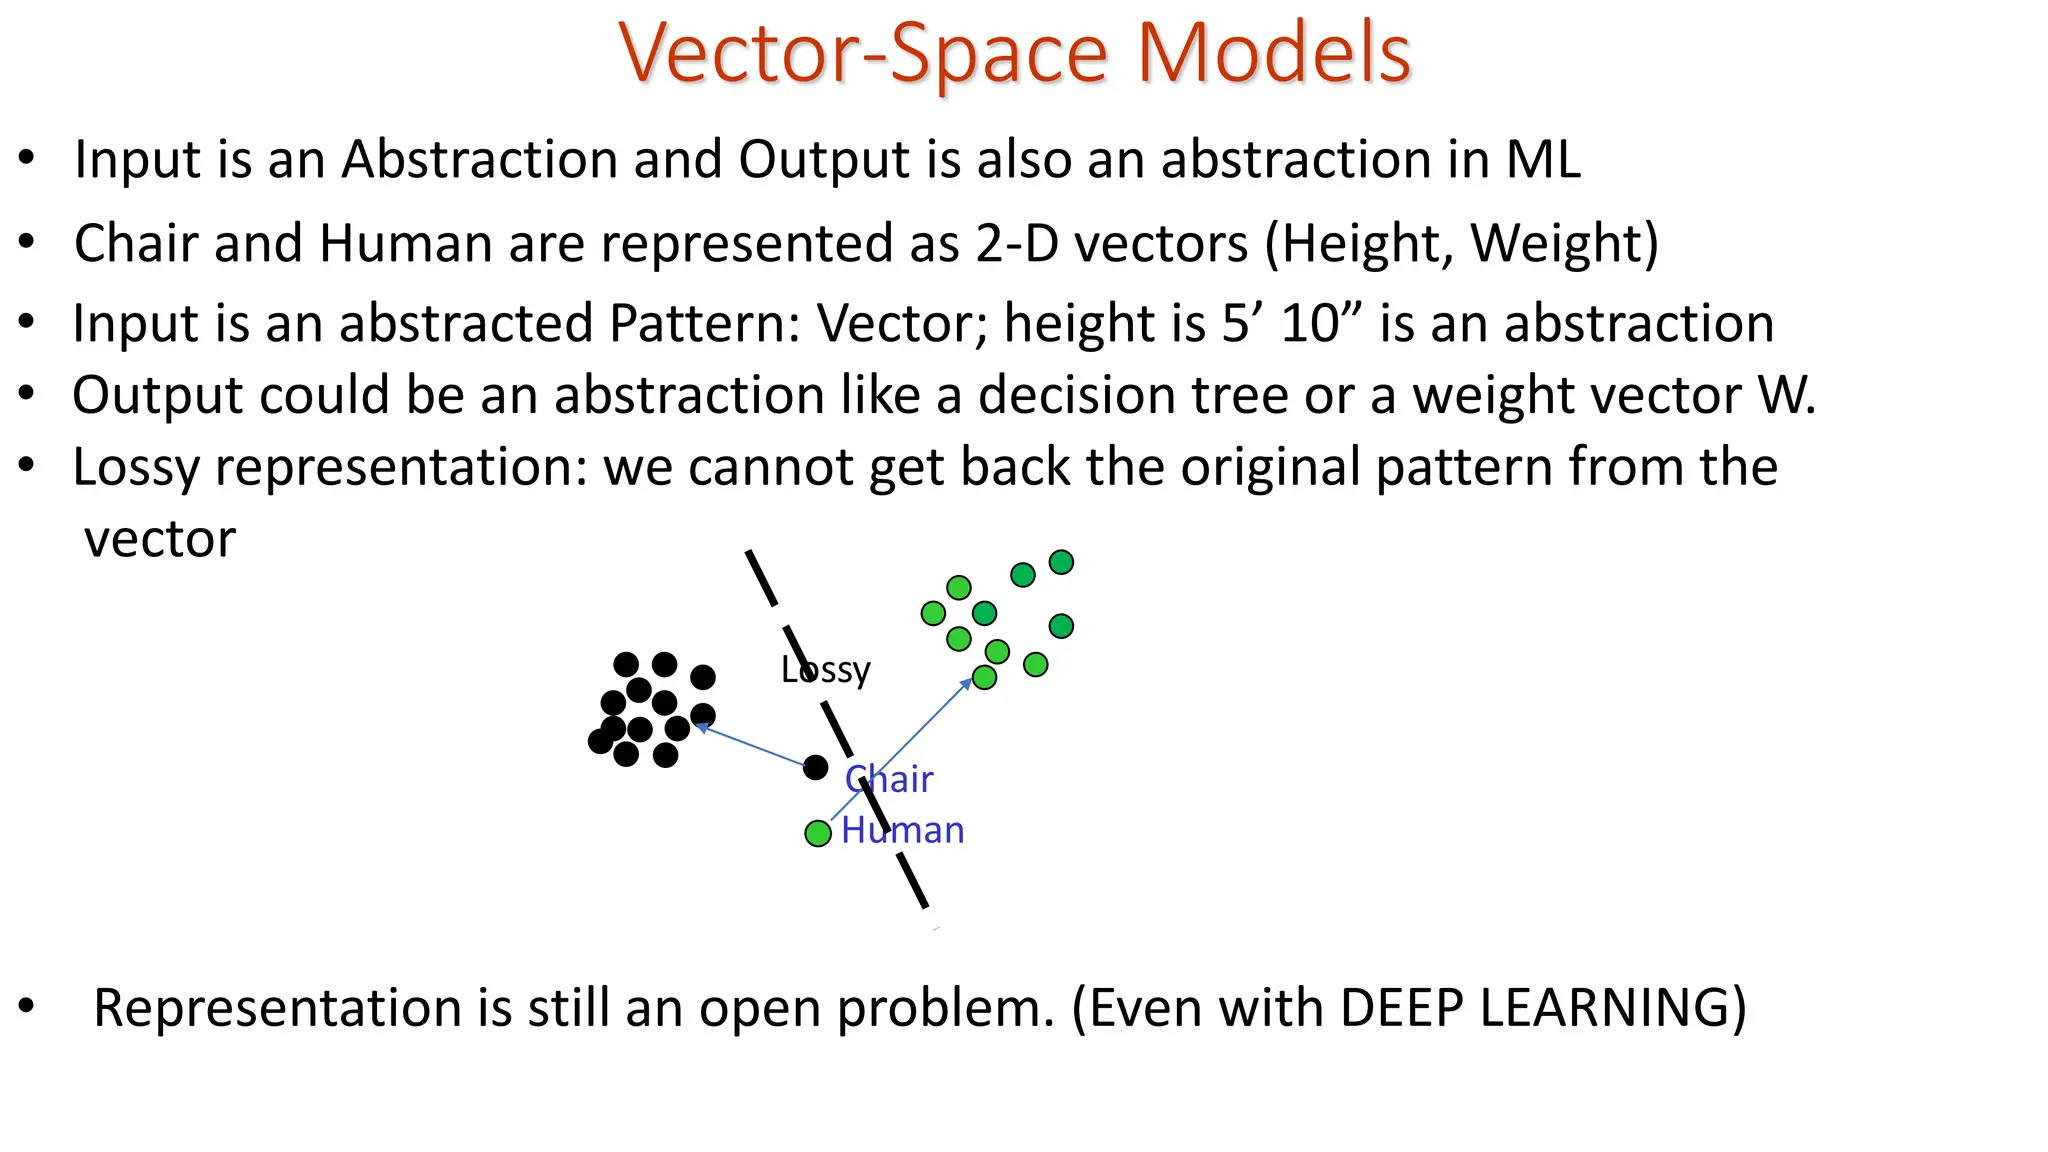
Vector-Space Models • Inputis an Abstraction and Output is also an abstraction in ML • Chair and Human are represented as 2-D vectors (Height, Weight) Chair Human Lossy • Input is an abstracted Pattern: Vector; height is 5’ 10” is an abstraction • Output could be an abstraction like a decision tree or a weight vector W. • Lossy representation: we cannot get back the original pattern from the vector • Representation is still an open problem. (Even with DEEP LEARNING)
14.
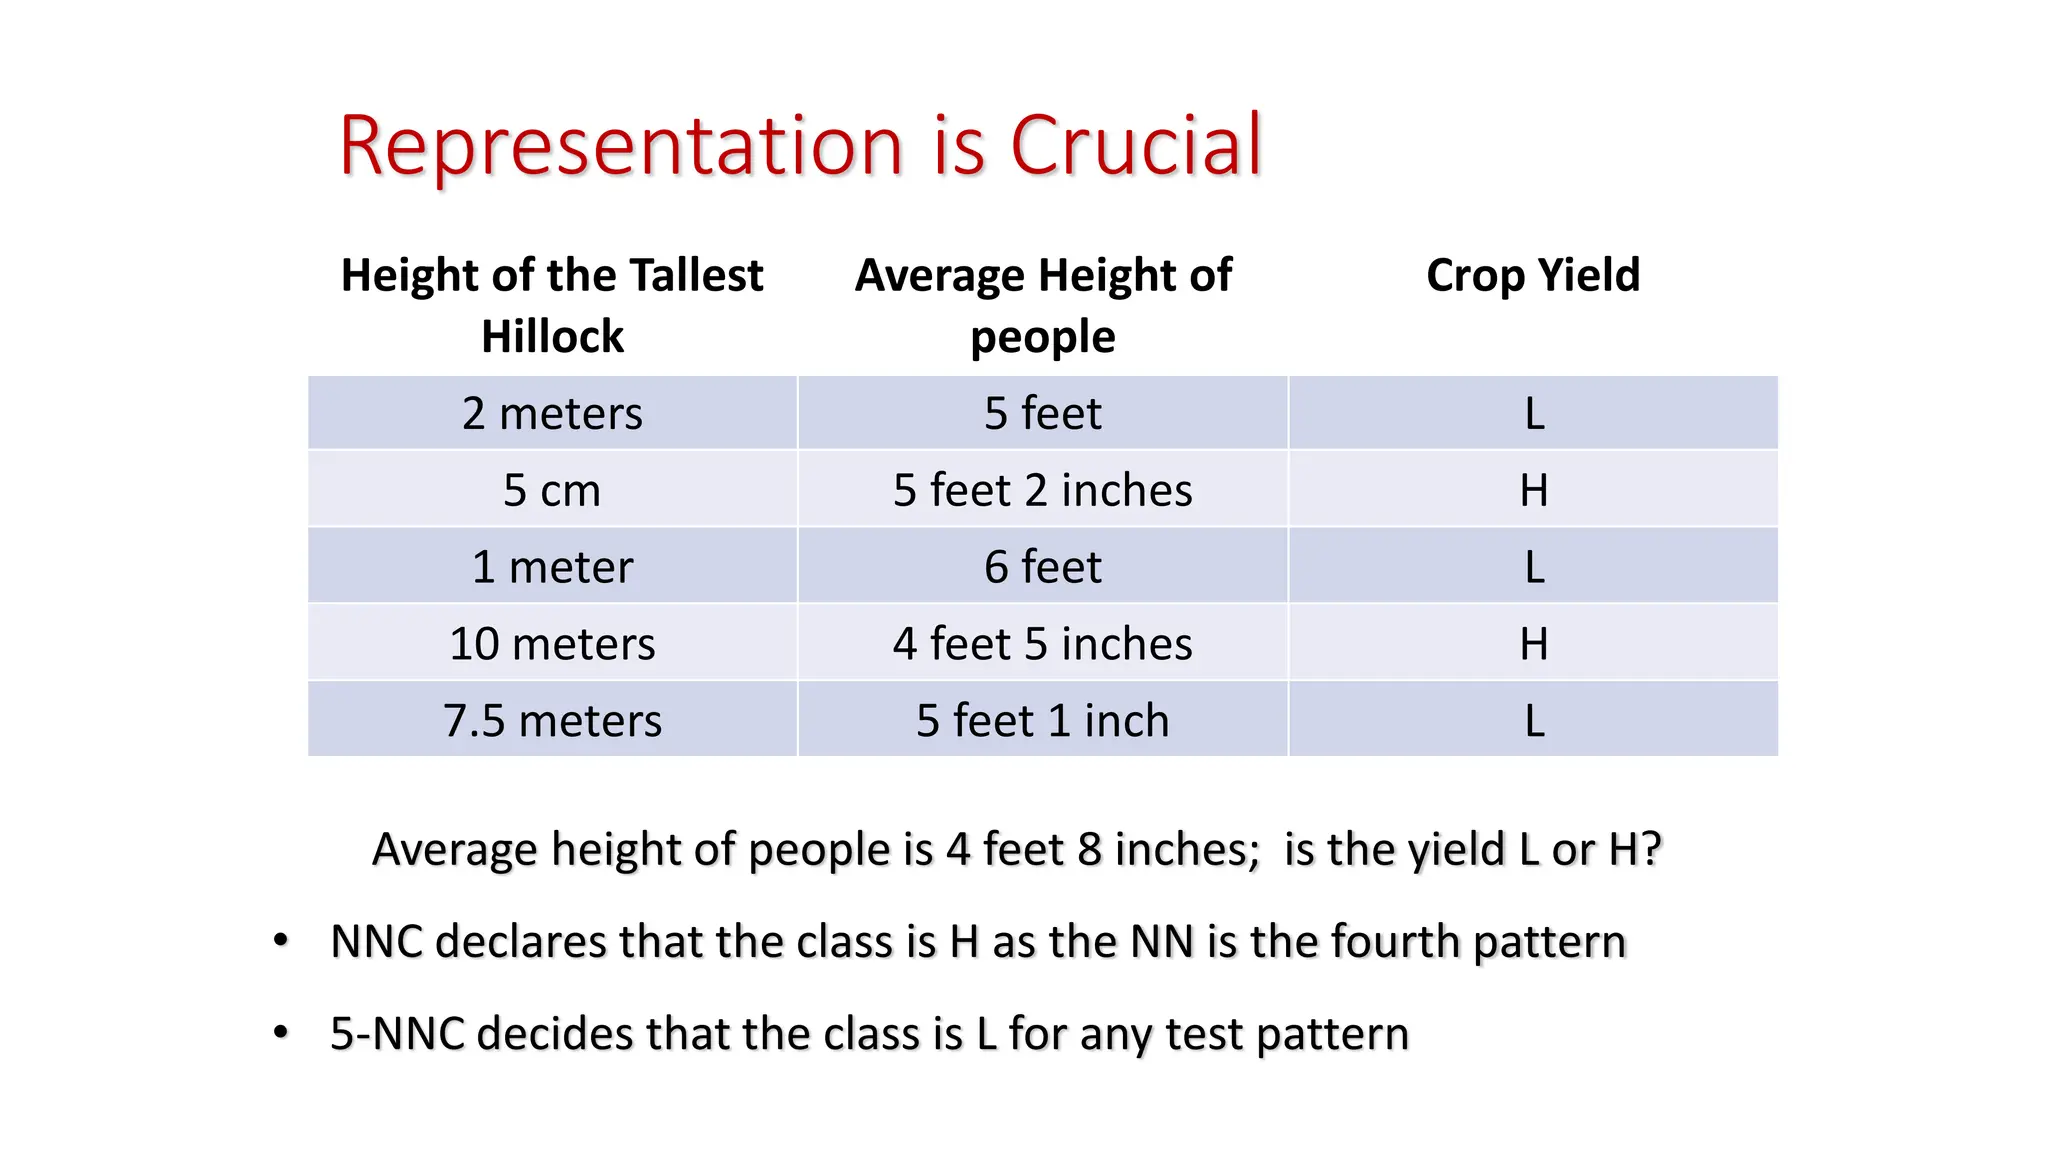
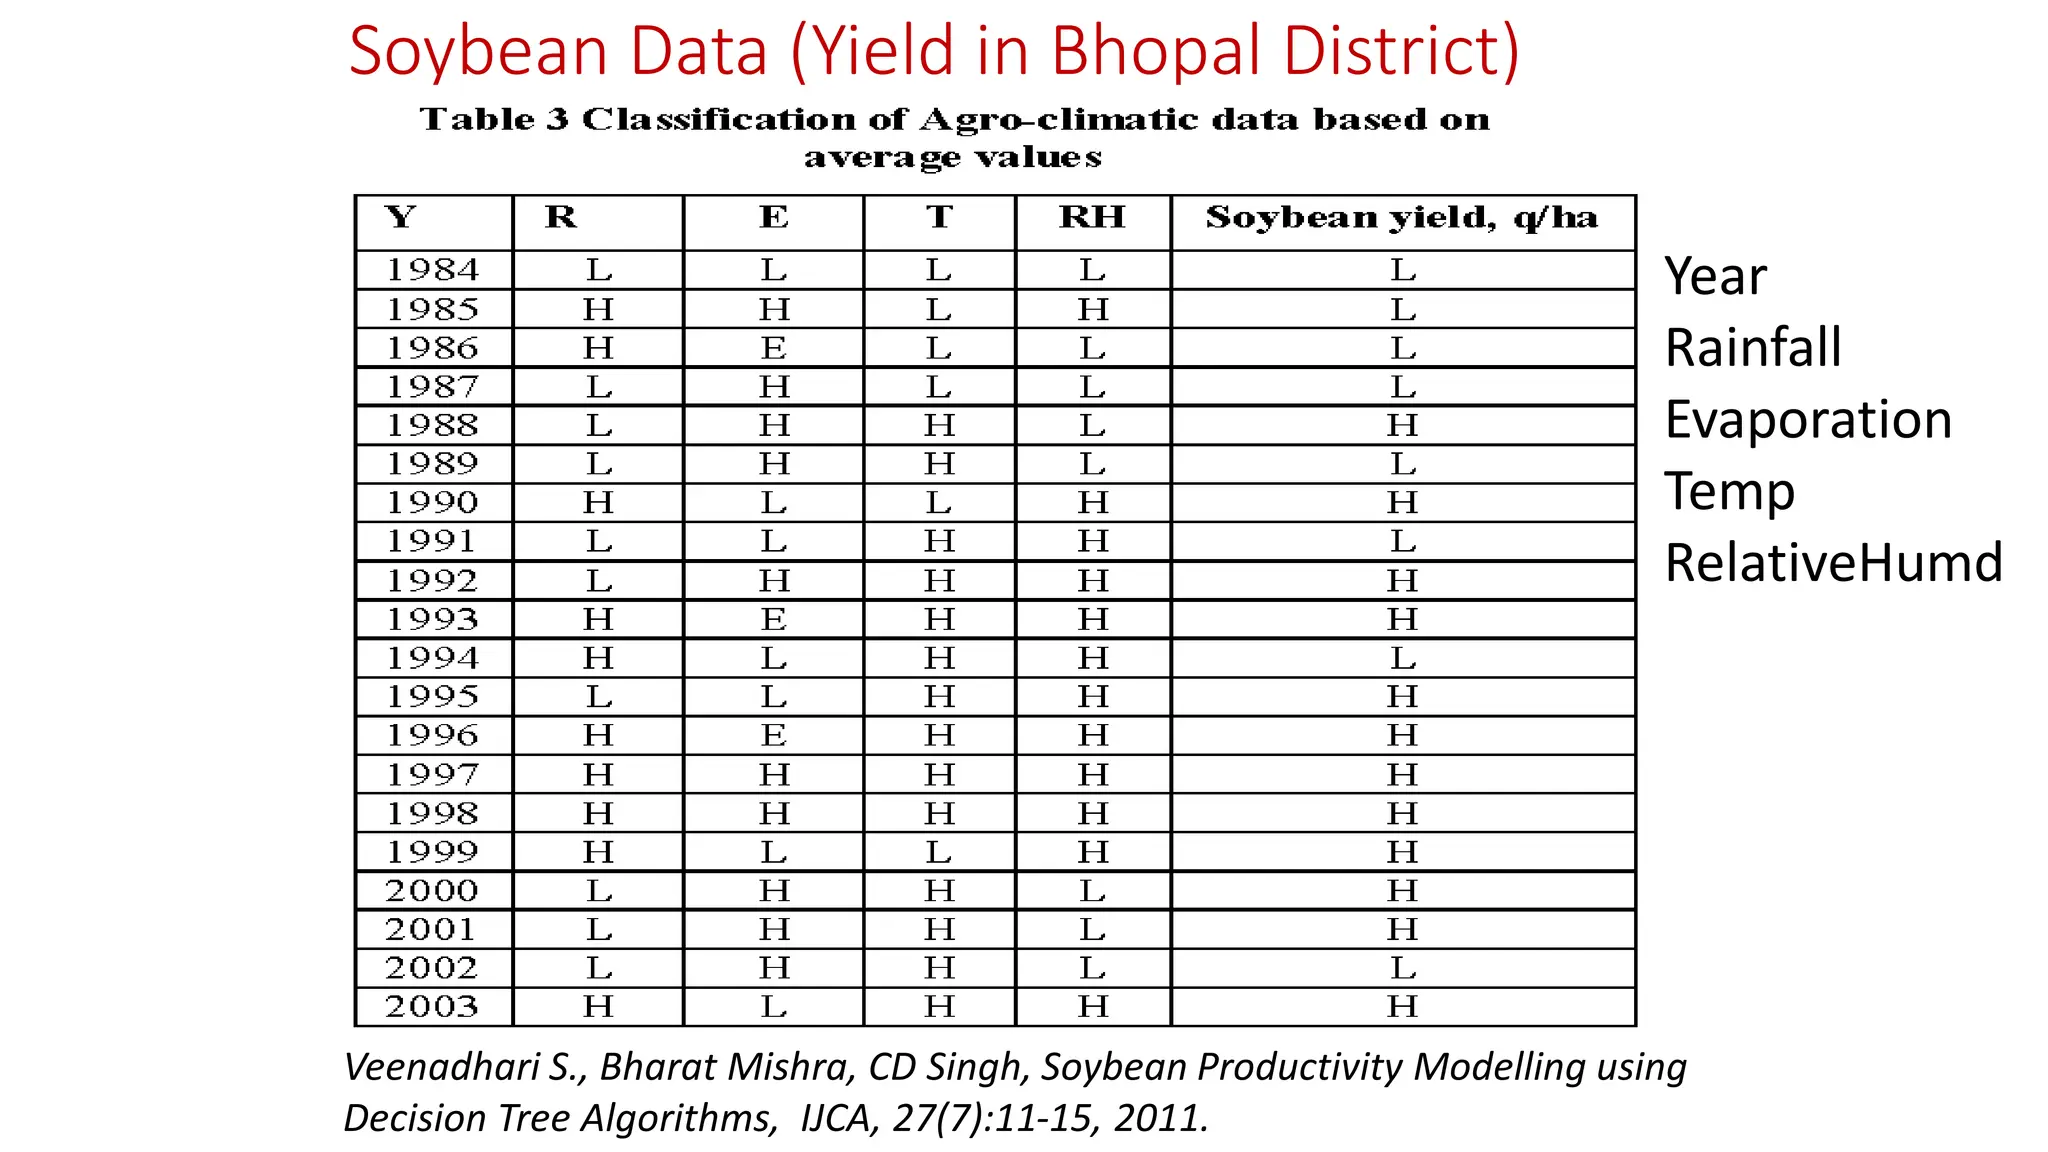
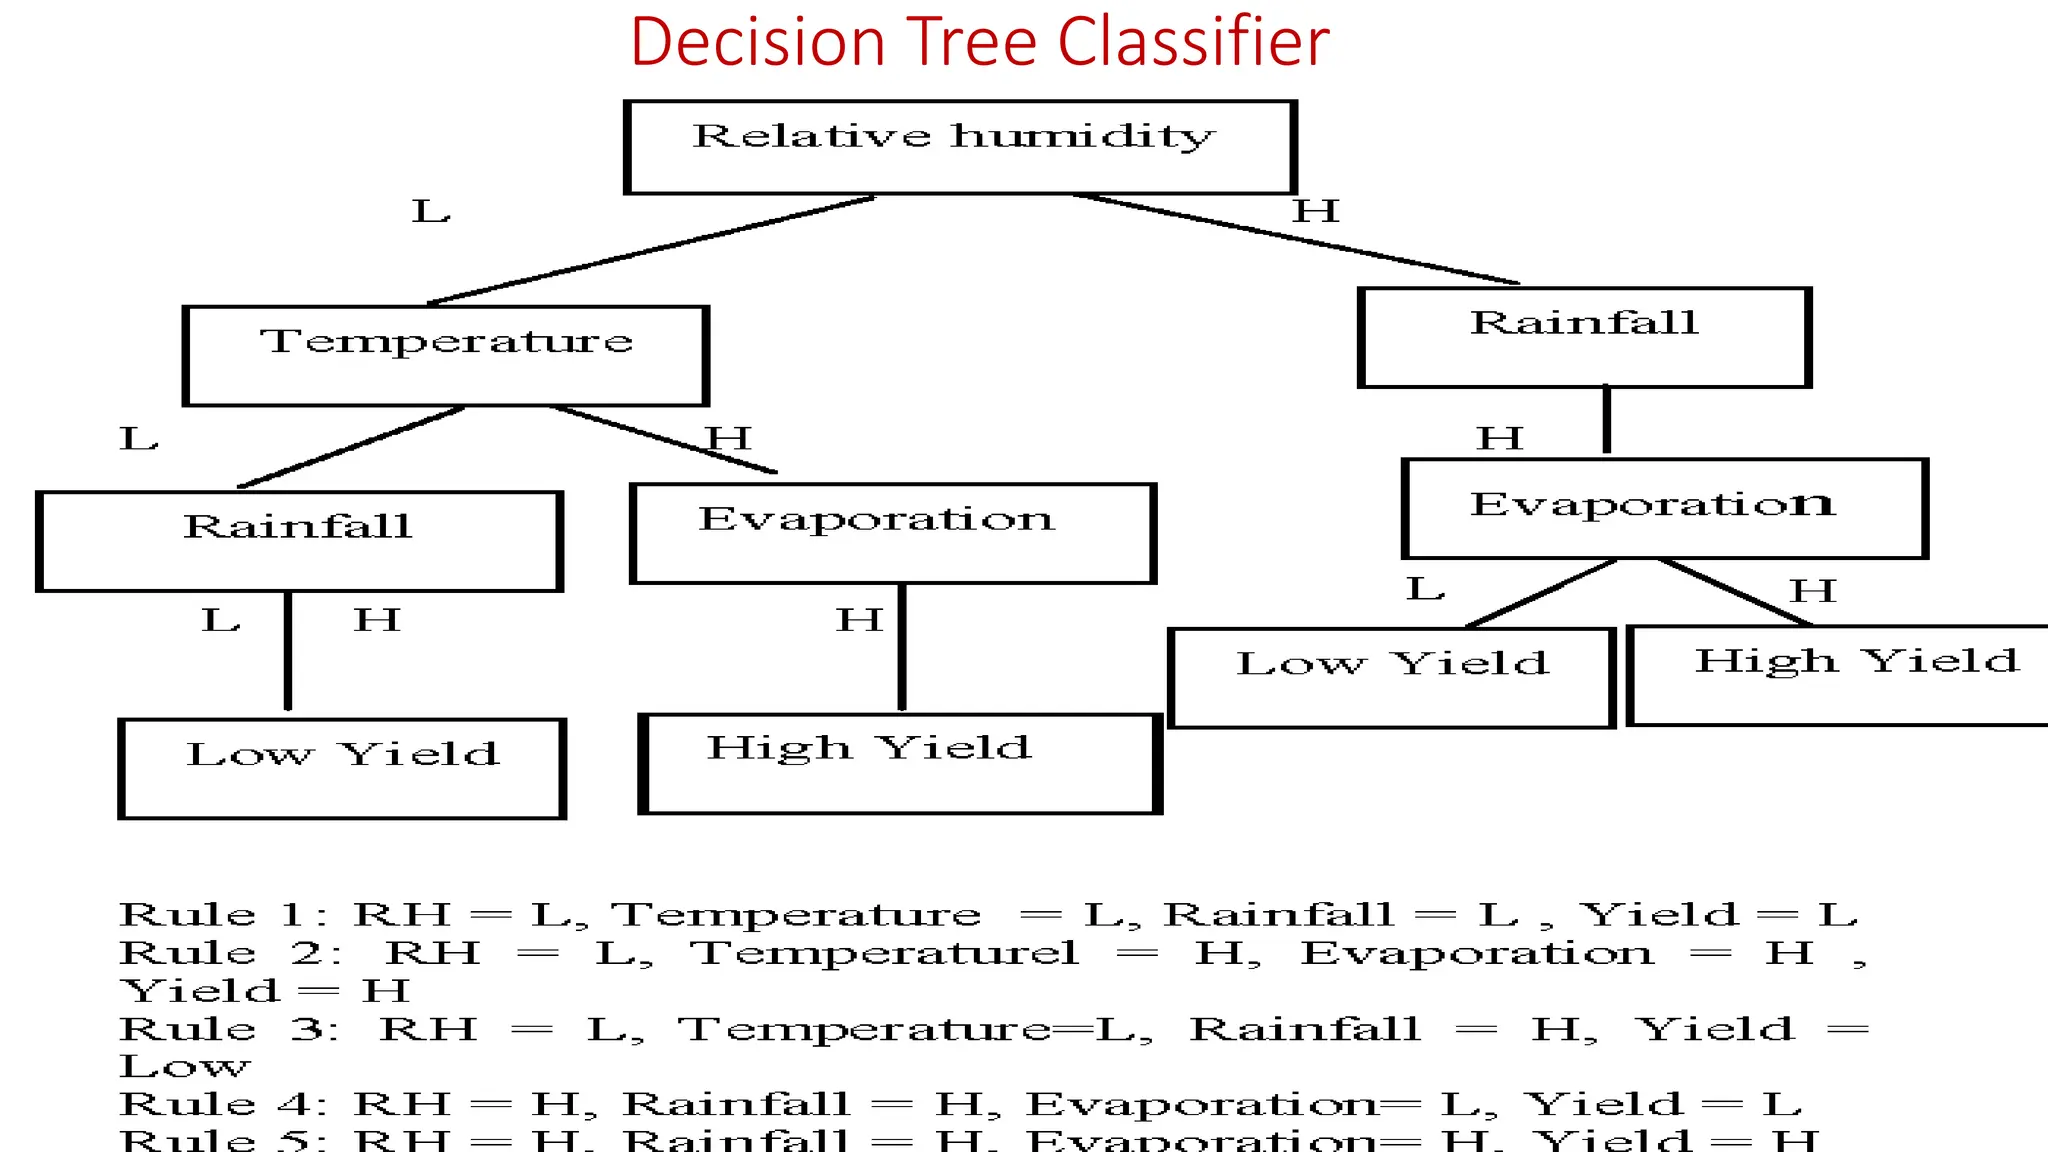
Representation is Crucial Averageheight of people is 4 feet 8 inches; is the yield L or H? • NNC declares that the class is H as the NN is the fourth pattern • 5-NNC decides that the class is L for any test pattern Height of the Tallest Hillock Average Height of people Crop Yield 2 meters 5 feet L 5 cm 5 feet 2 inches H 1 meter 6 feet L 10 meters 4 feet 5 inches H 7.5 meters 5 feet 1 inch L
17.
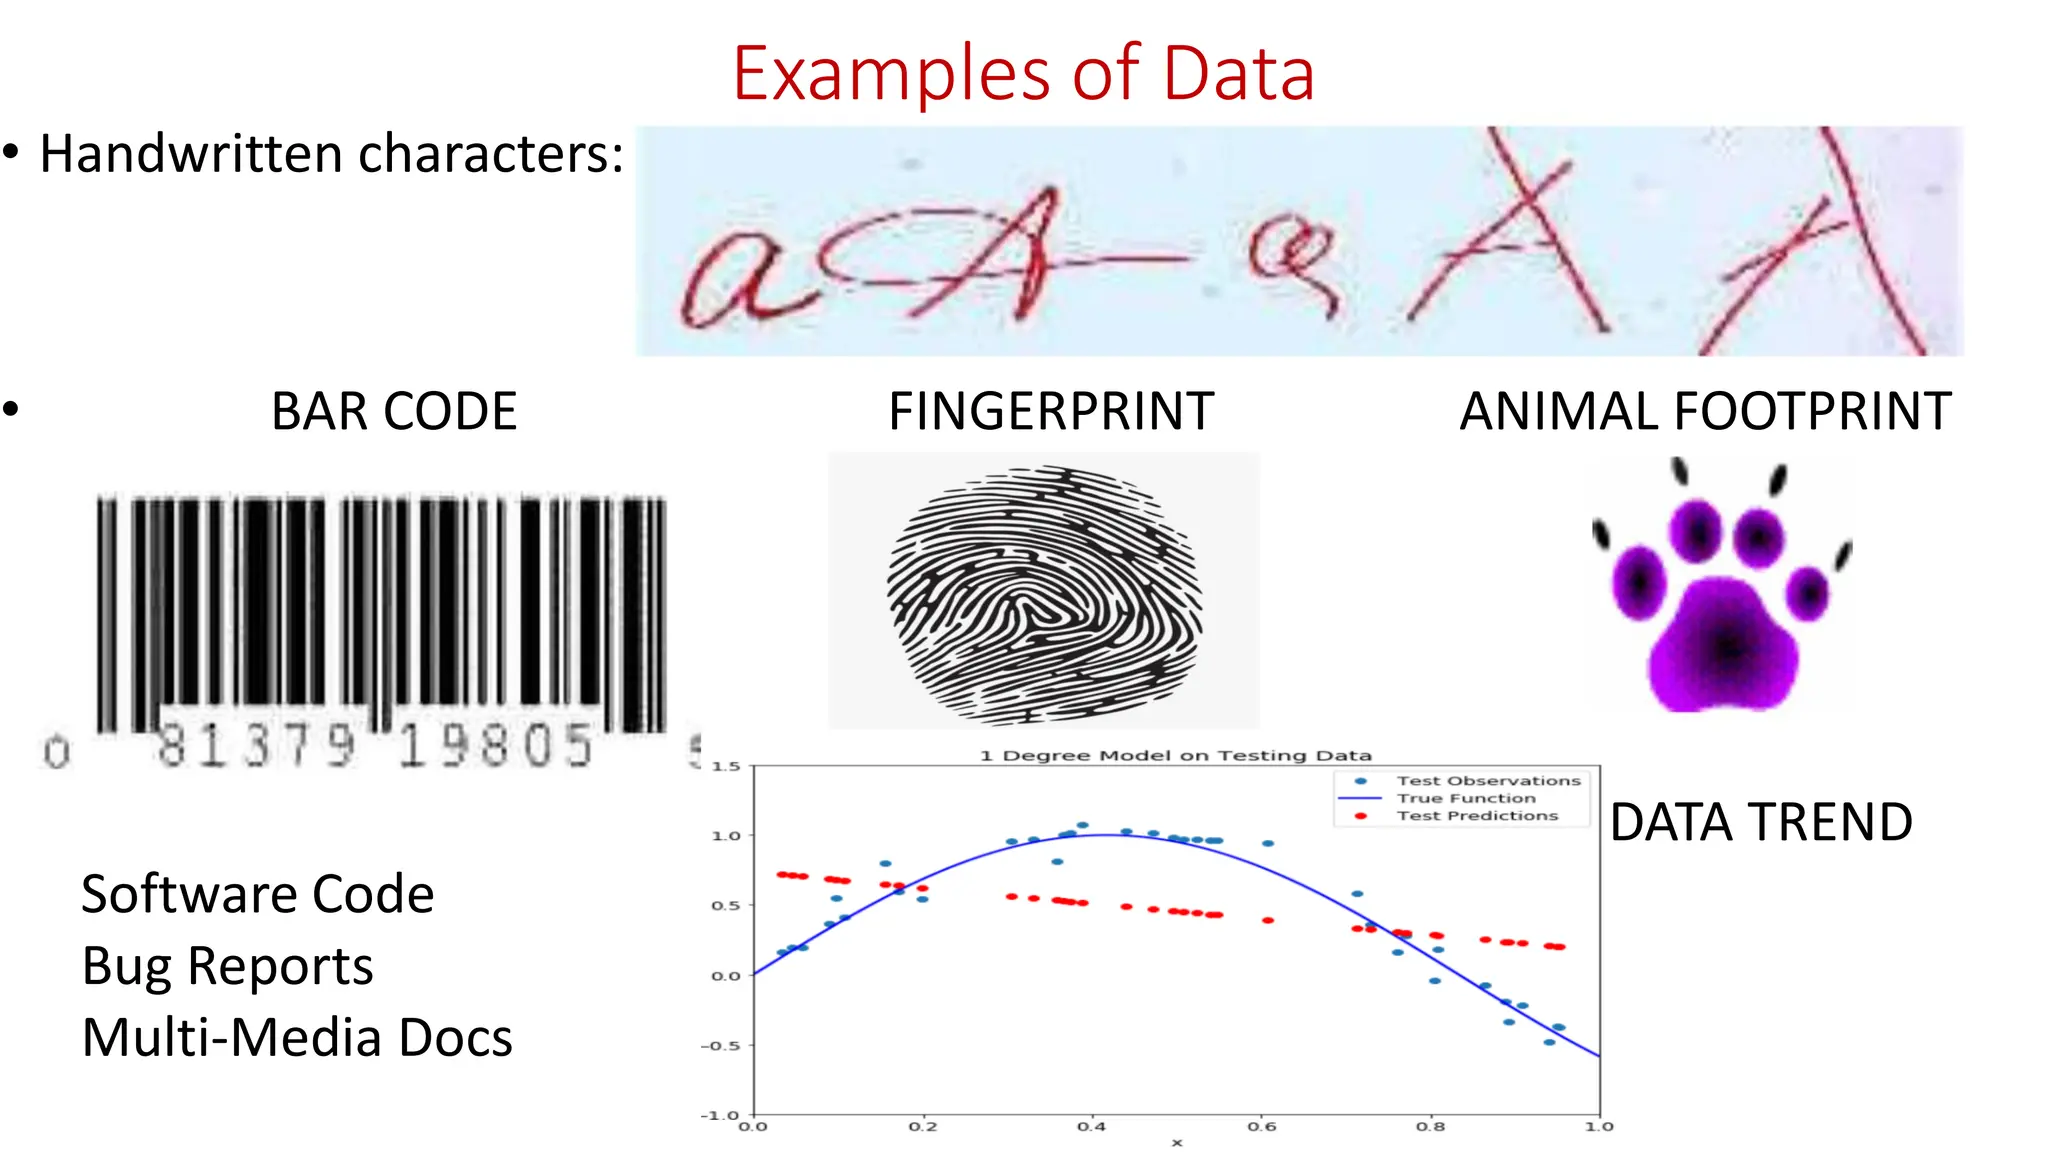
Examples of Data •Handwritten characters: • BAR CODE FINGERPRINT ANIMAL FOOTPRINT Software Code Bug Reports Multi-Media Docs DATA TREND
18.
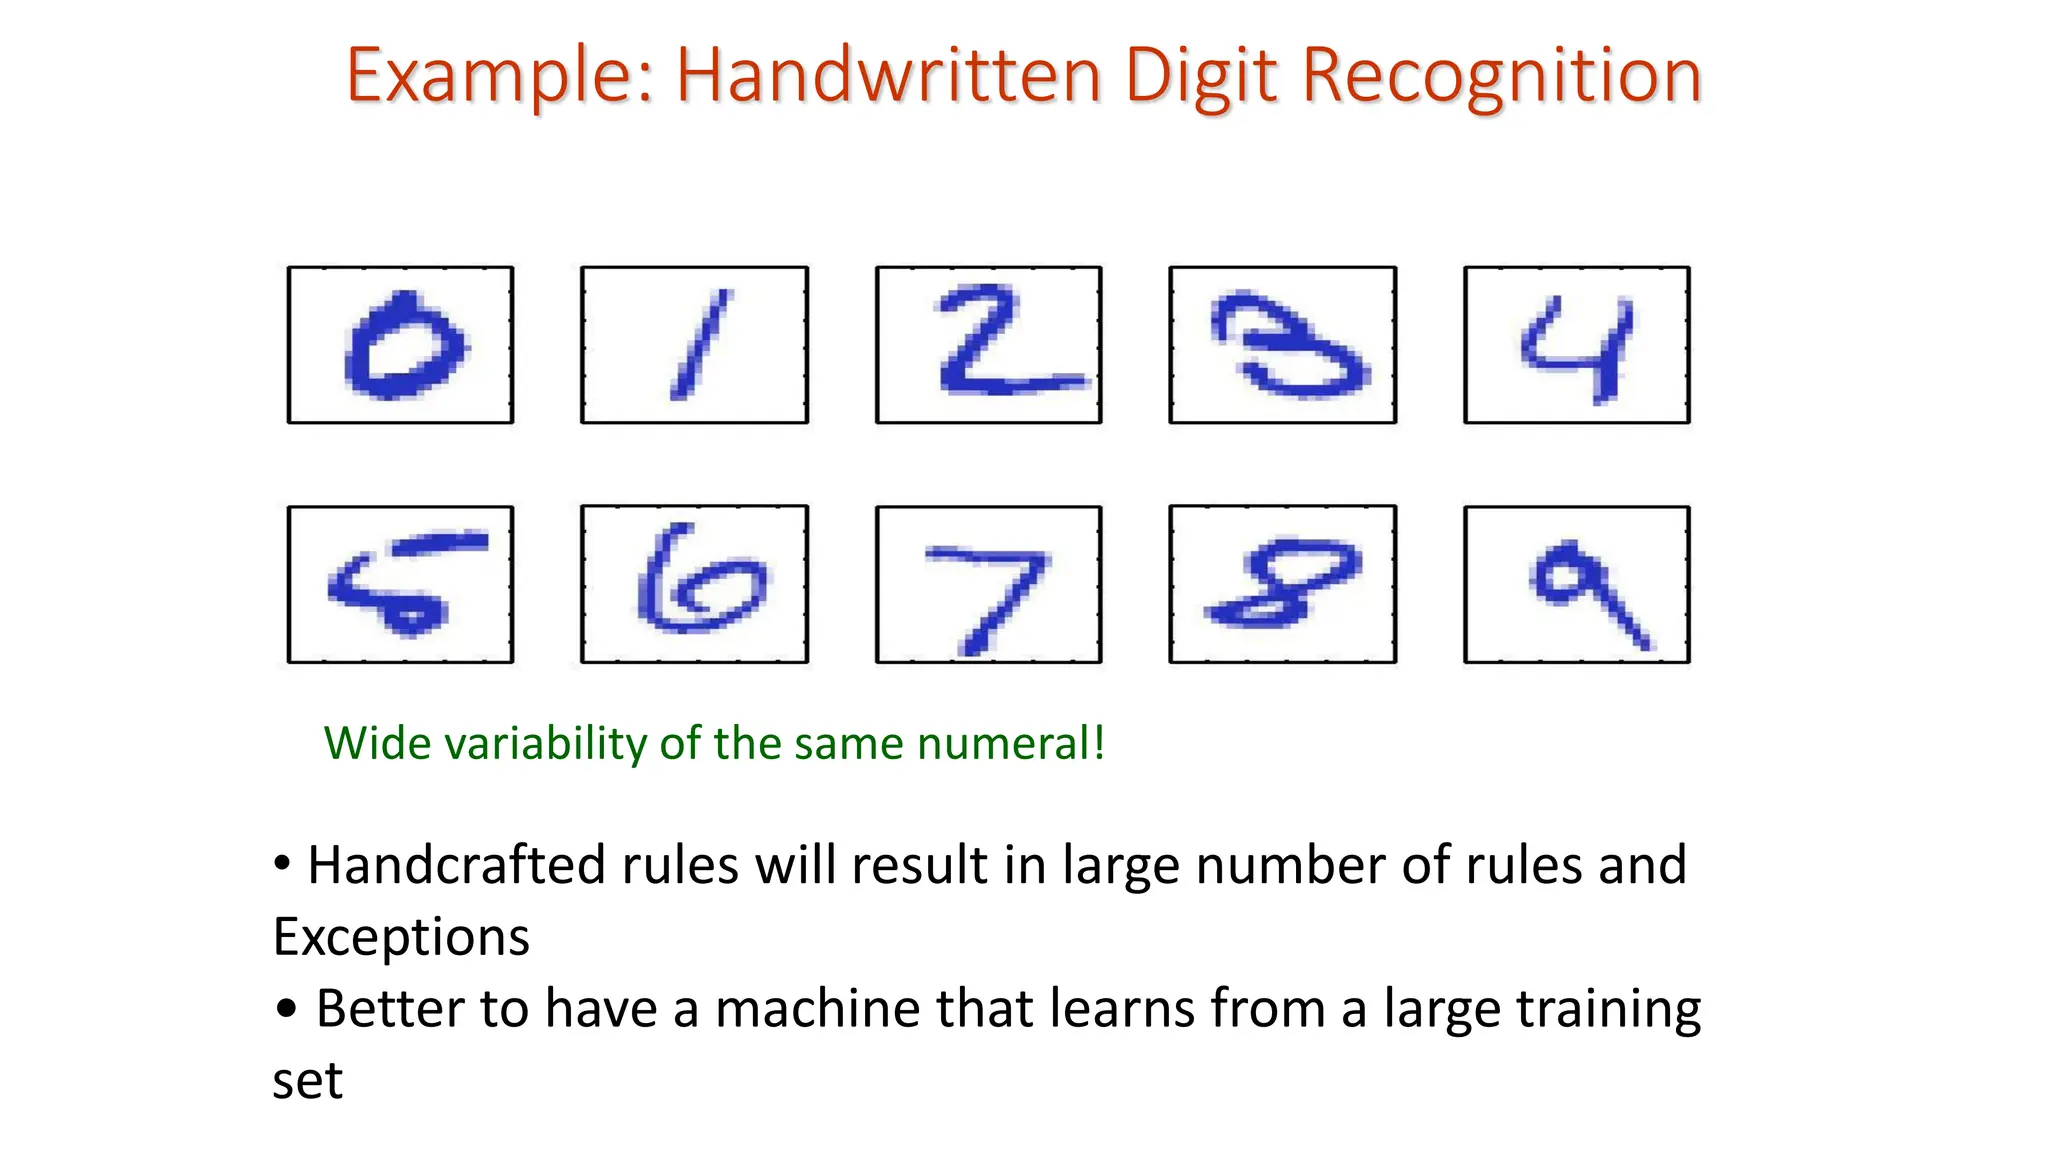
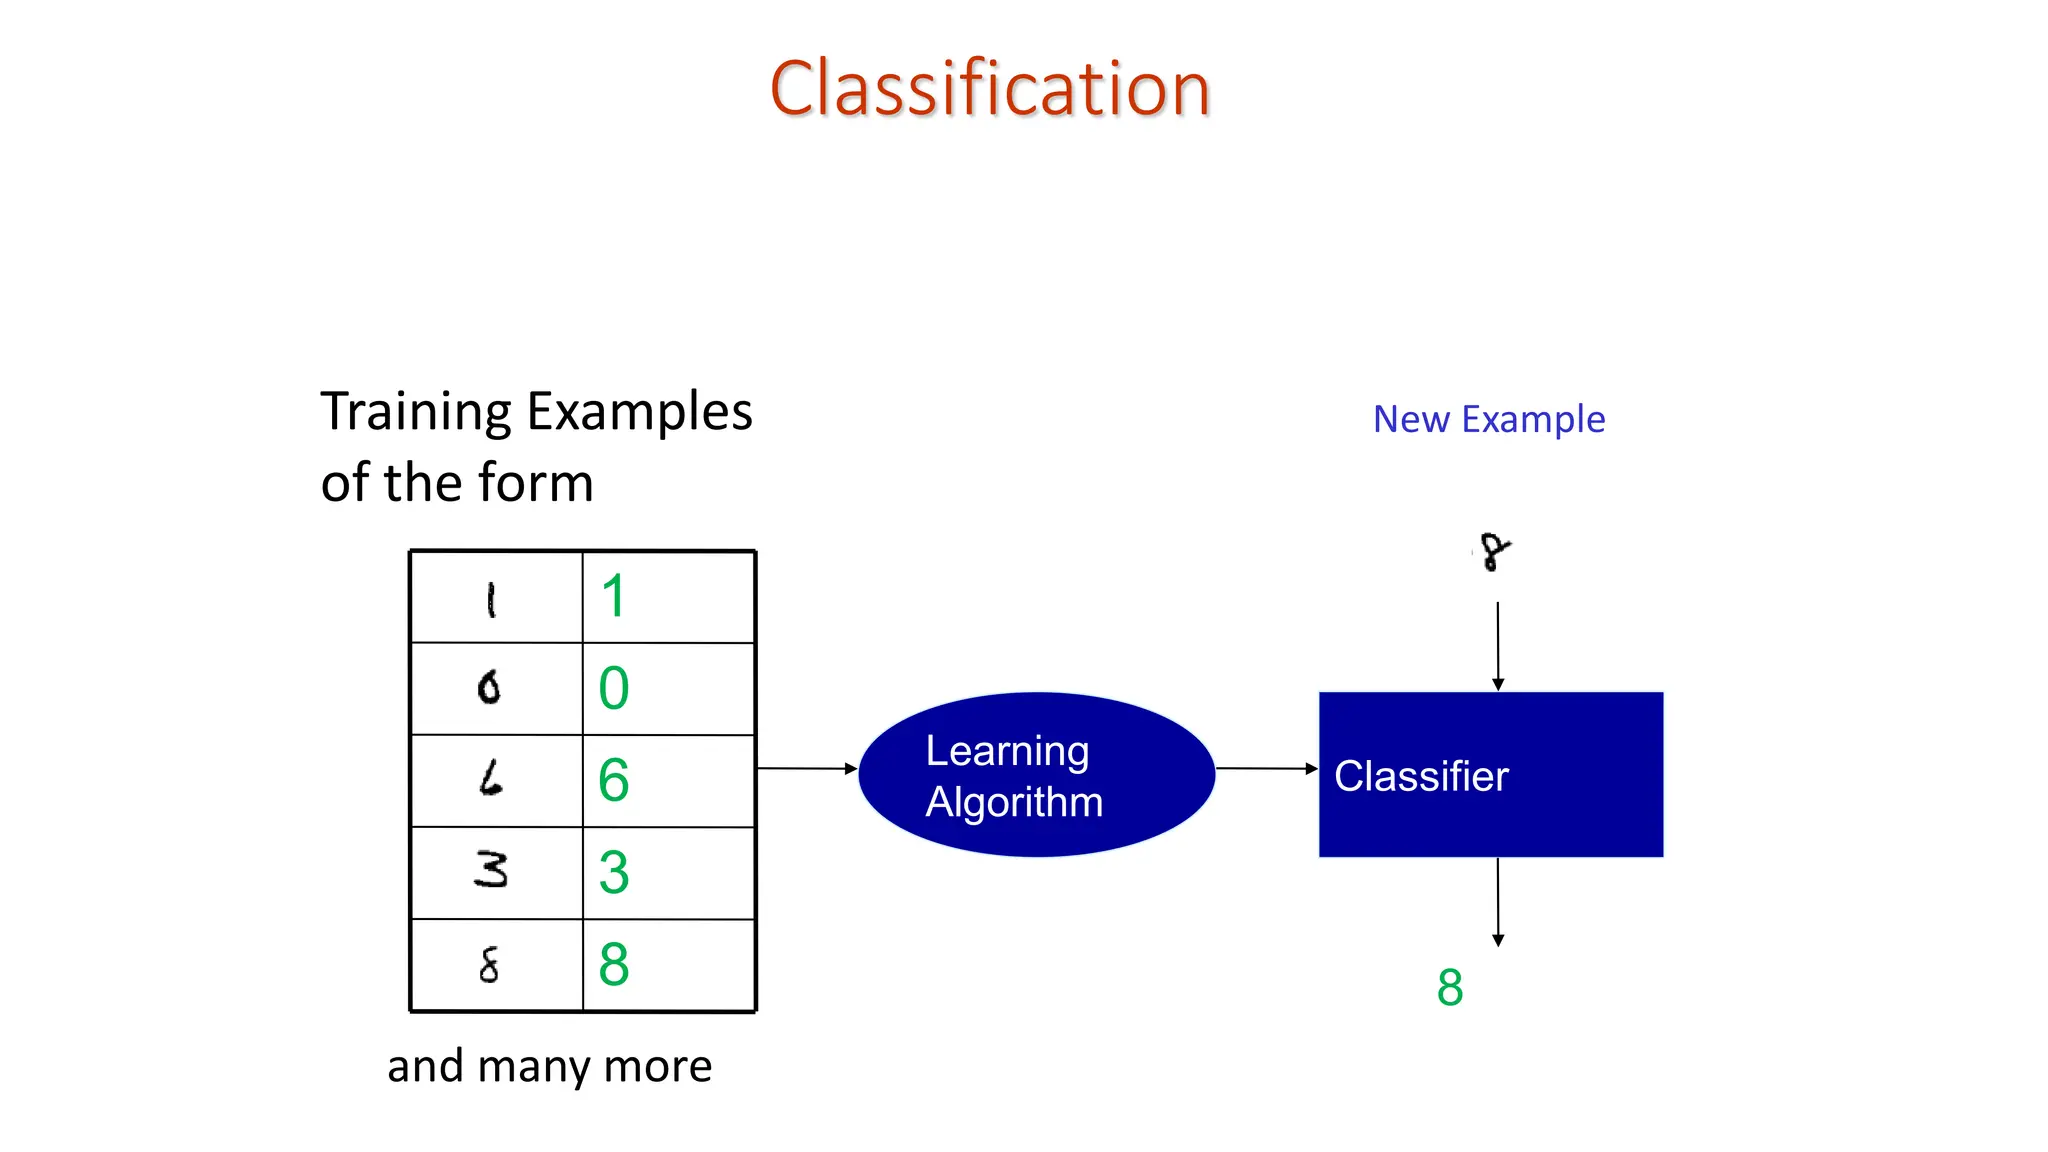
Example: Handwritten DigitRecognition • Handcrafted rules will result in large number of rules and Exceptions • Better to have a machine that learns from a large training set Wide variability of the same numeral!
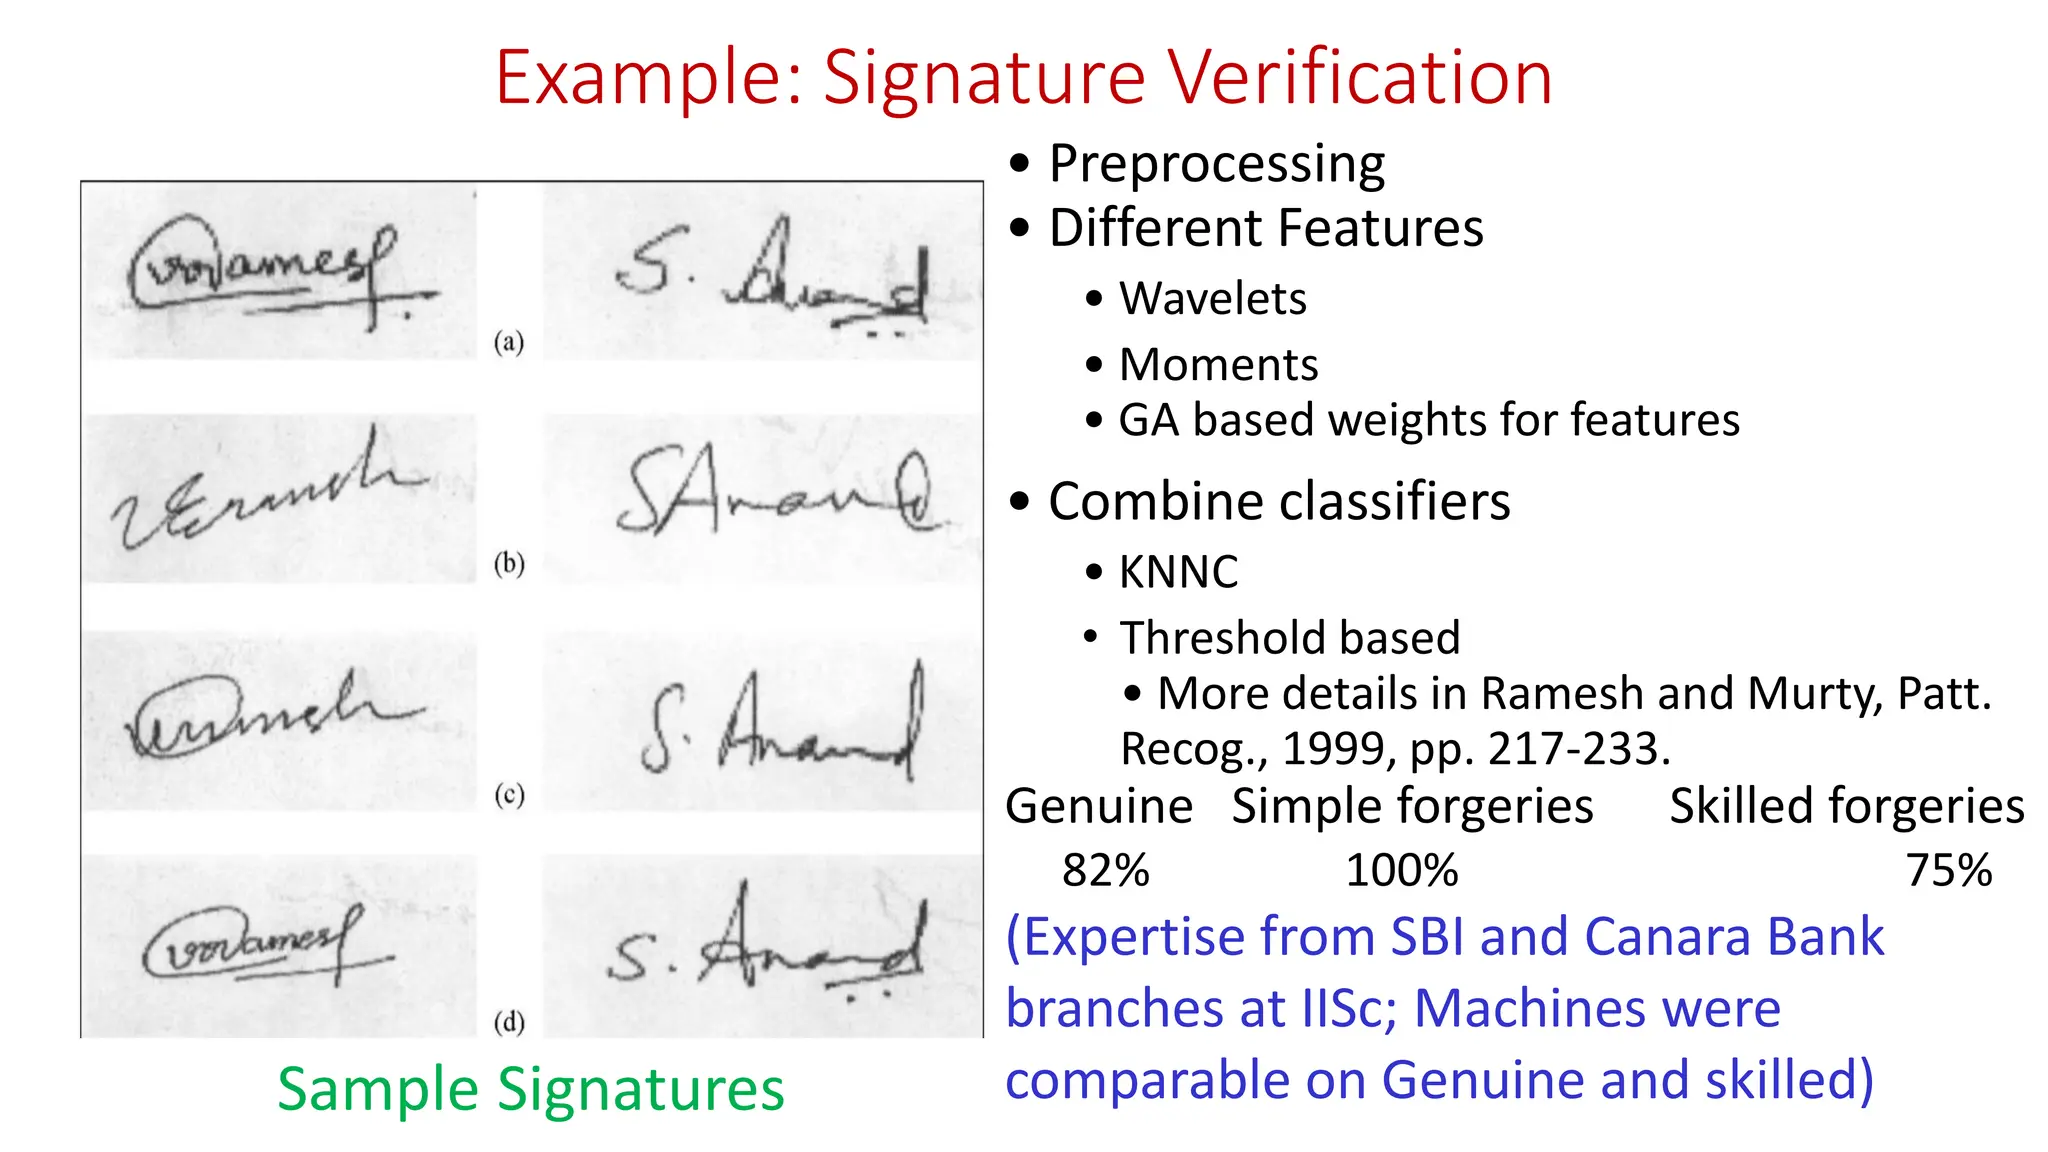
Example: Signature Verification •Preprocessing • Different Features • Wavelets • Moments • GA based weights for features • Combine classifiers • KNNC • Threshold based • More details in Ramesh and Murty, Patt. Recog., 1999, pp. 217-233. Sample Signatures Genuine Simple forgeries Skilled forgeries 82% 100% 75% (Expertise from SBI and Canara Bank branches at IISc; Machines were comparable on Genuine and skilled)
21.
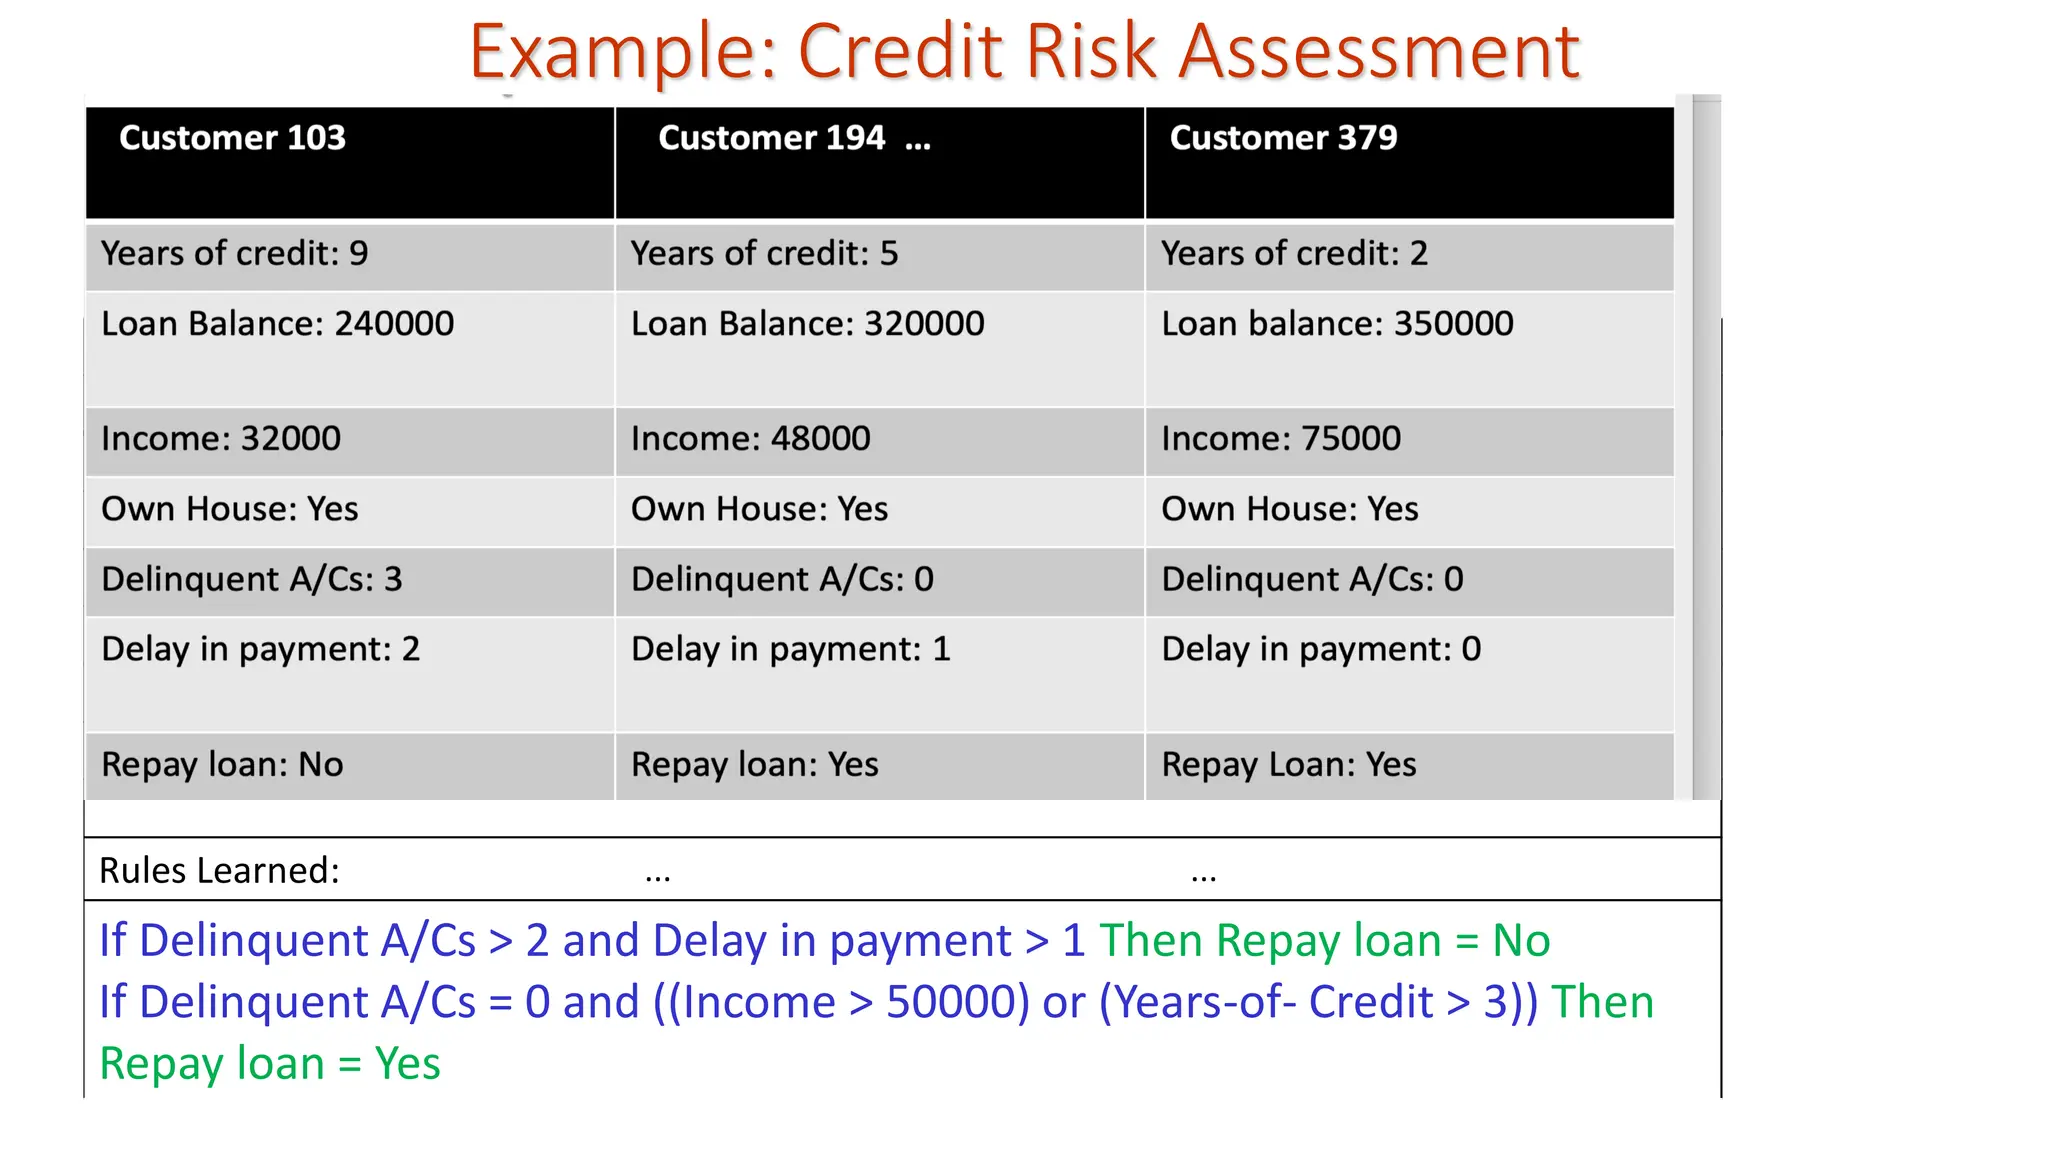
Example: Credit RiskAssessment Rules Learned: ... ... If Delinquent A/Cs > 2 and Delay in payment > 1 Then Repay loan = No If Delinquent A/Cs = 0 and ((Income > 50000) or (Years-of- Credit > 3)) Then Repay loan = Yes
22.
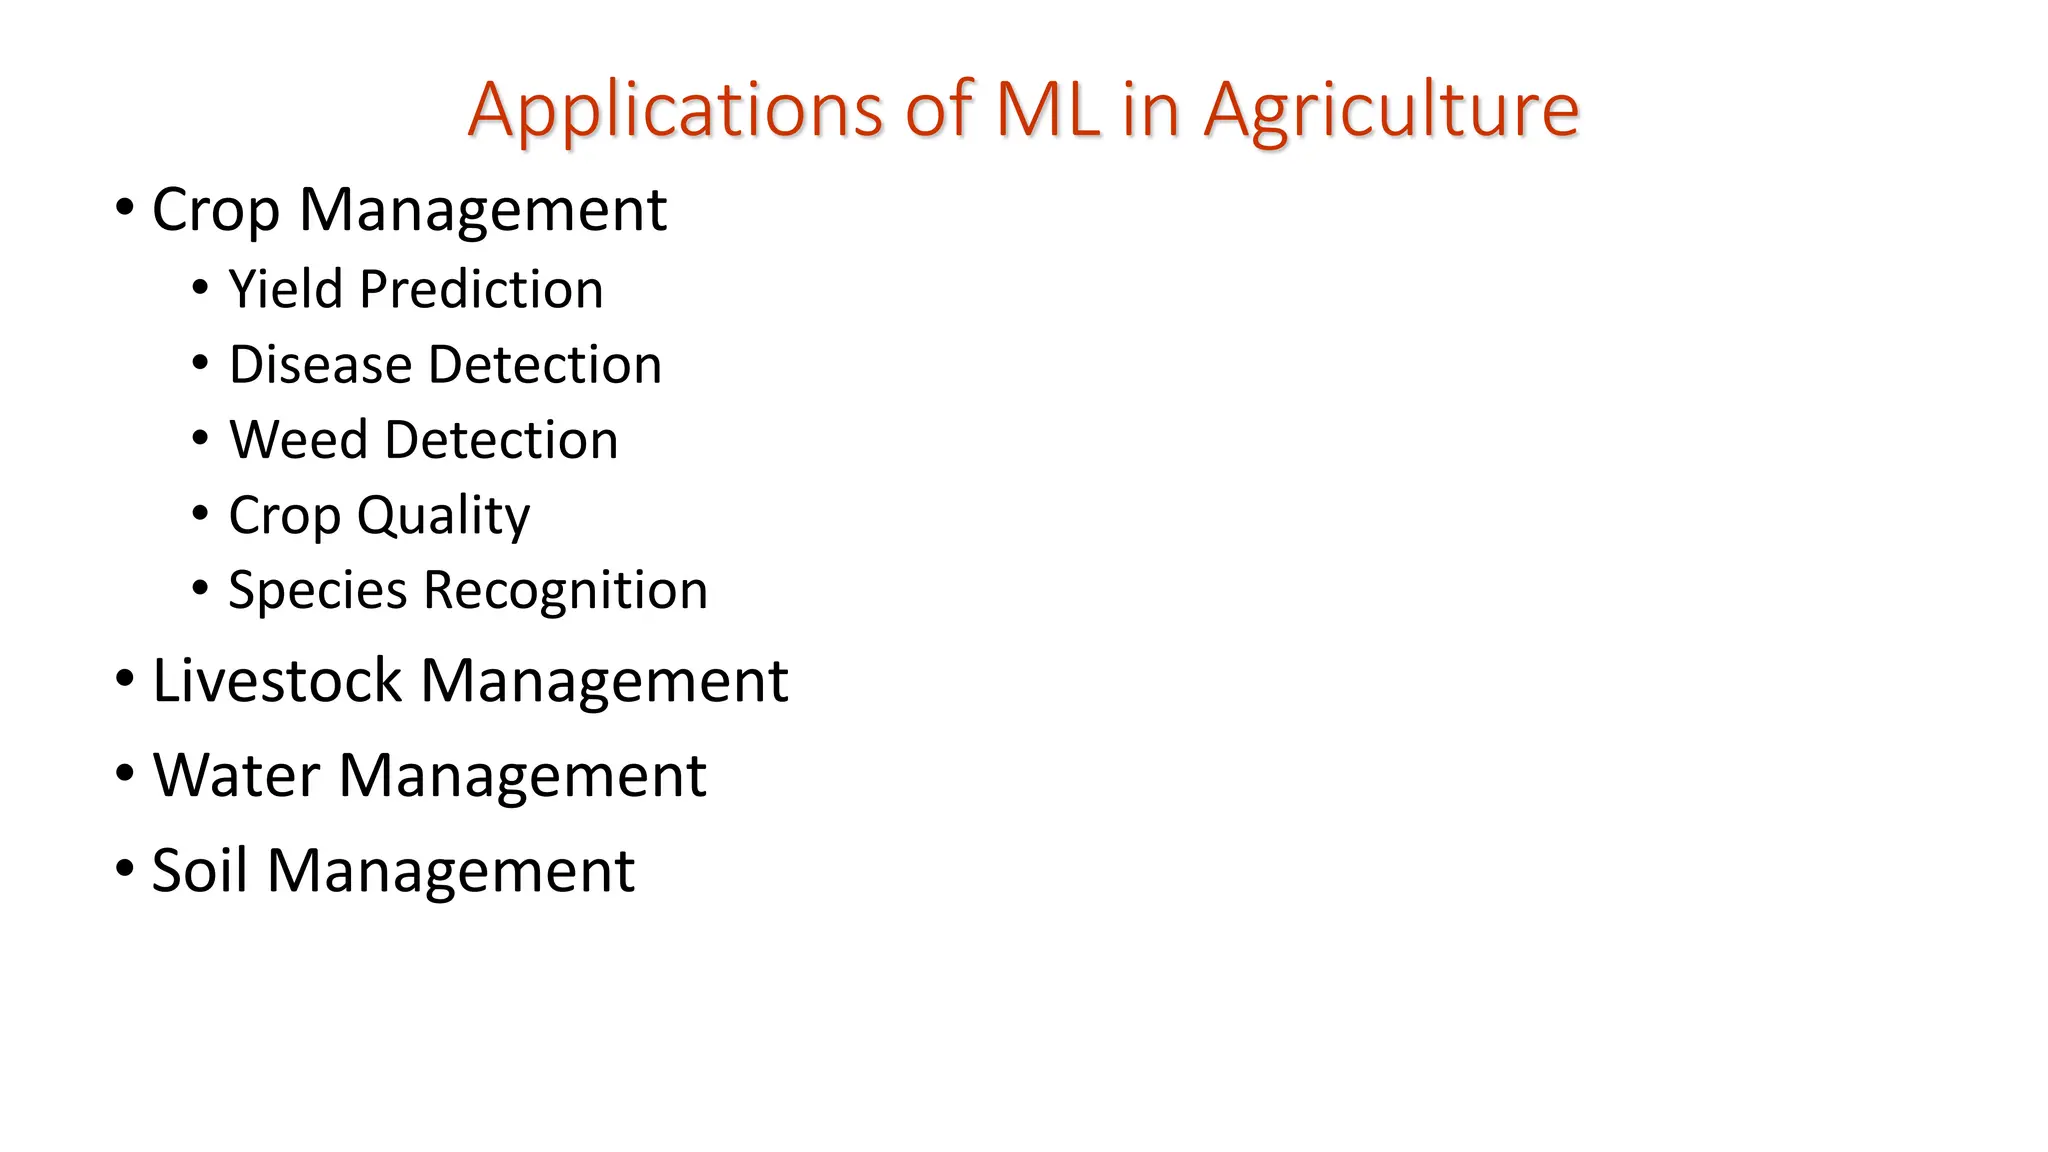
Examples of Applications •Optical Character Recognition • Handwritten: sorting letters by postal code, input device for PDA‘s • Printed texts: reading machines for blind people, digitalization of text documents • Biometrics • Face recognition, verification, retrieval, • Fingerprints recognition • Speech recognition • Health, Education, Transport, Agriculture, Finance • Normal/Abnormal • Easy/Difficult concepts • Traffic violation • Crop disease, crop yield
23.
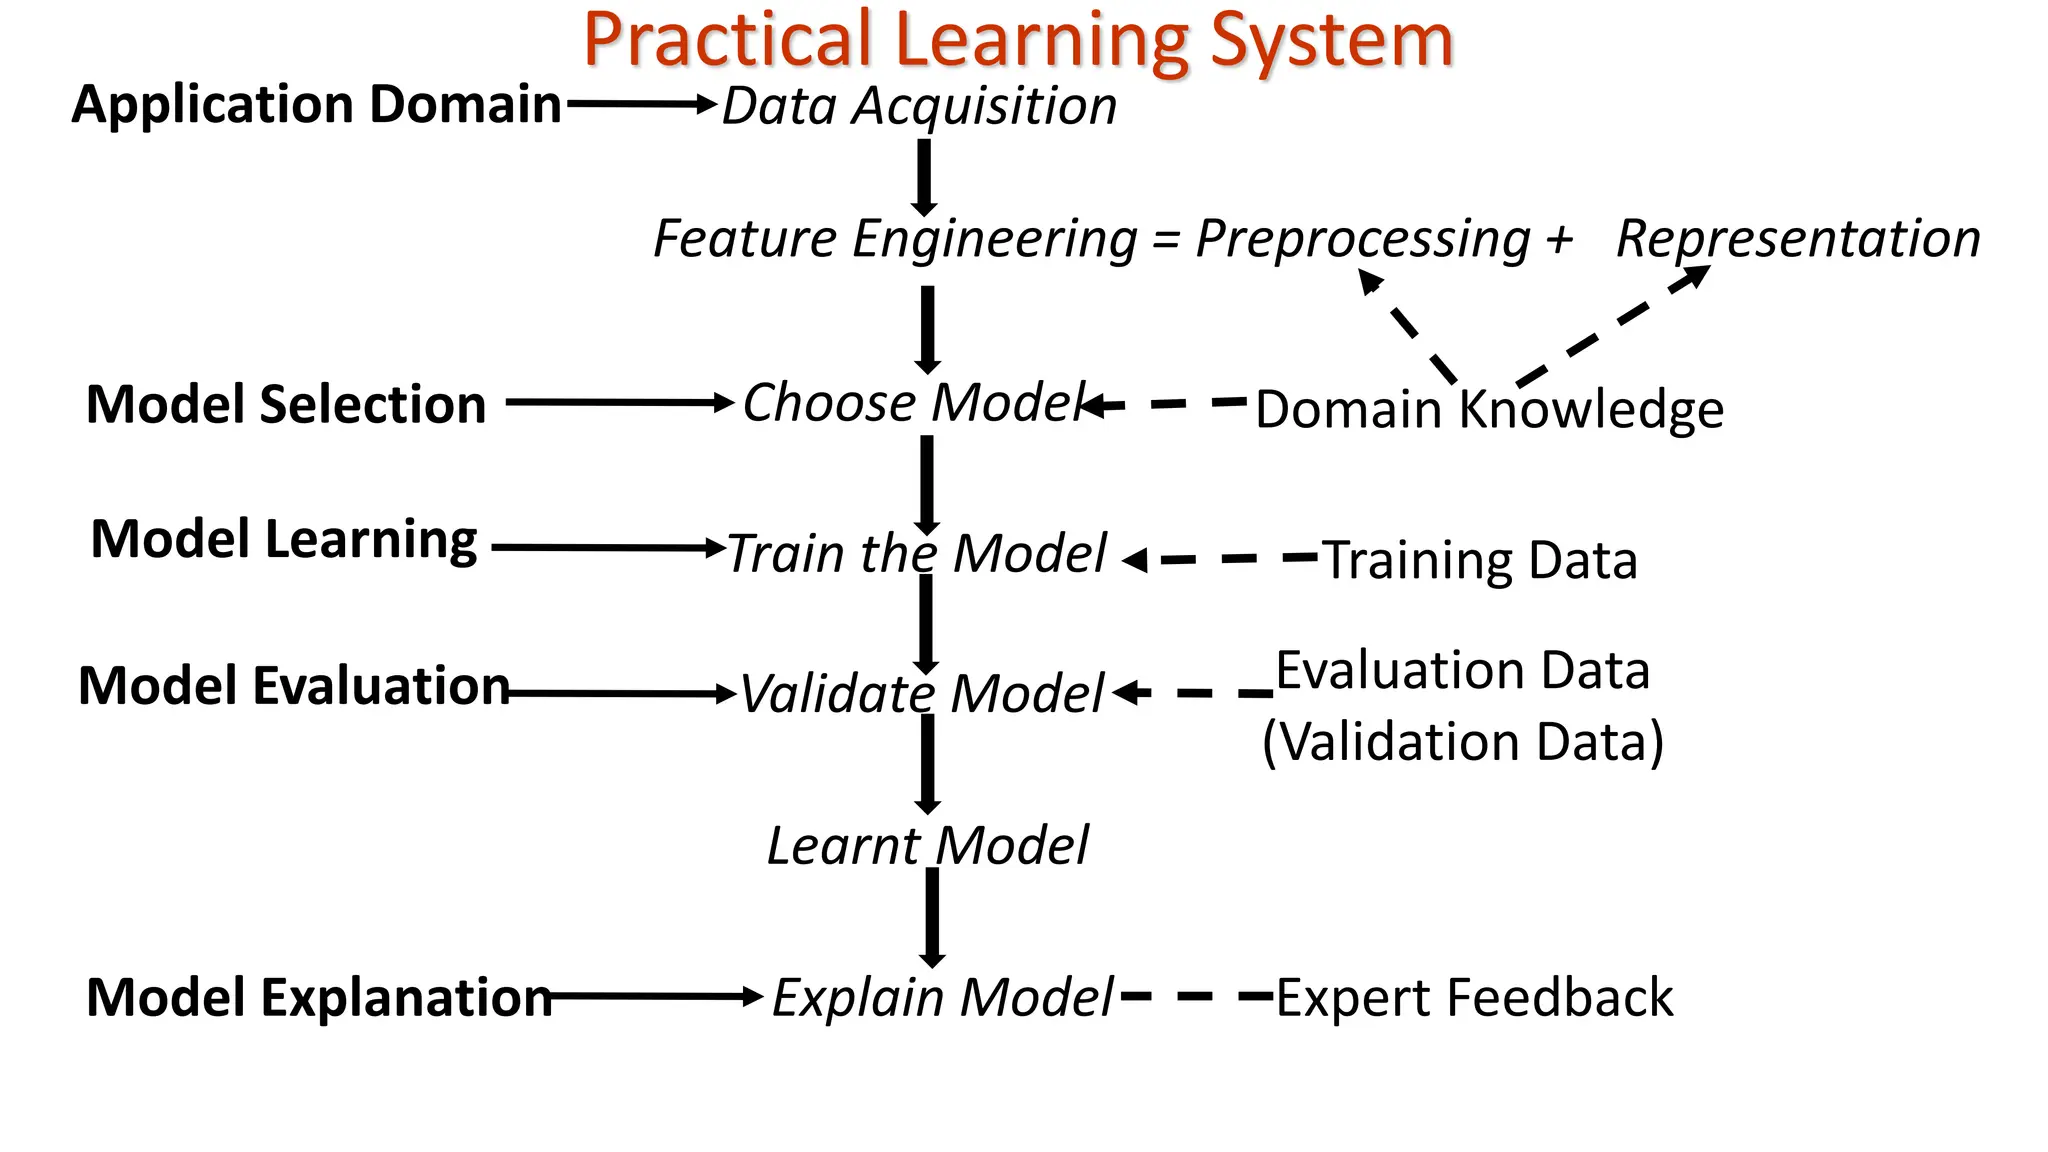
Data Acquisition Feature Engineering= Preprocessing + Representation Choose Model Train the Model Validate Model Learnt Model Explain Model Application Domain Model Selection Model Learning Model Evaluation Model Explanation Domain Knowledge Training Data Evaluation Data (Validation Data) Expert Feedback Practical Learning System
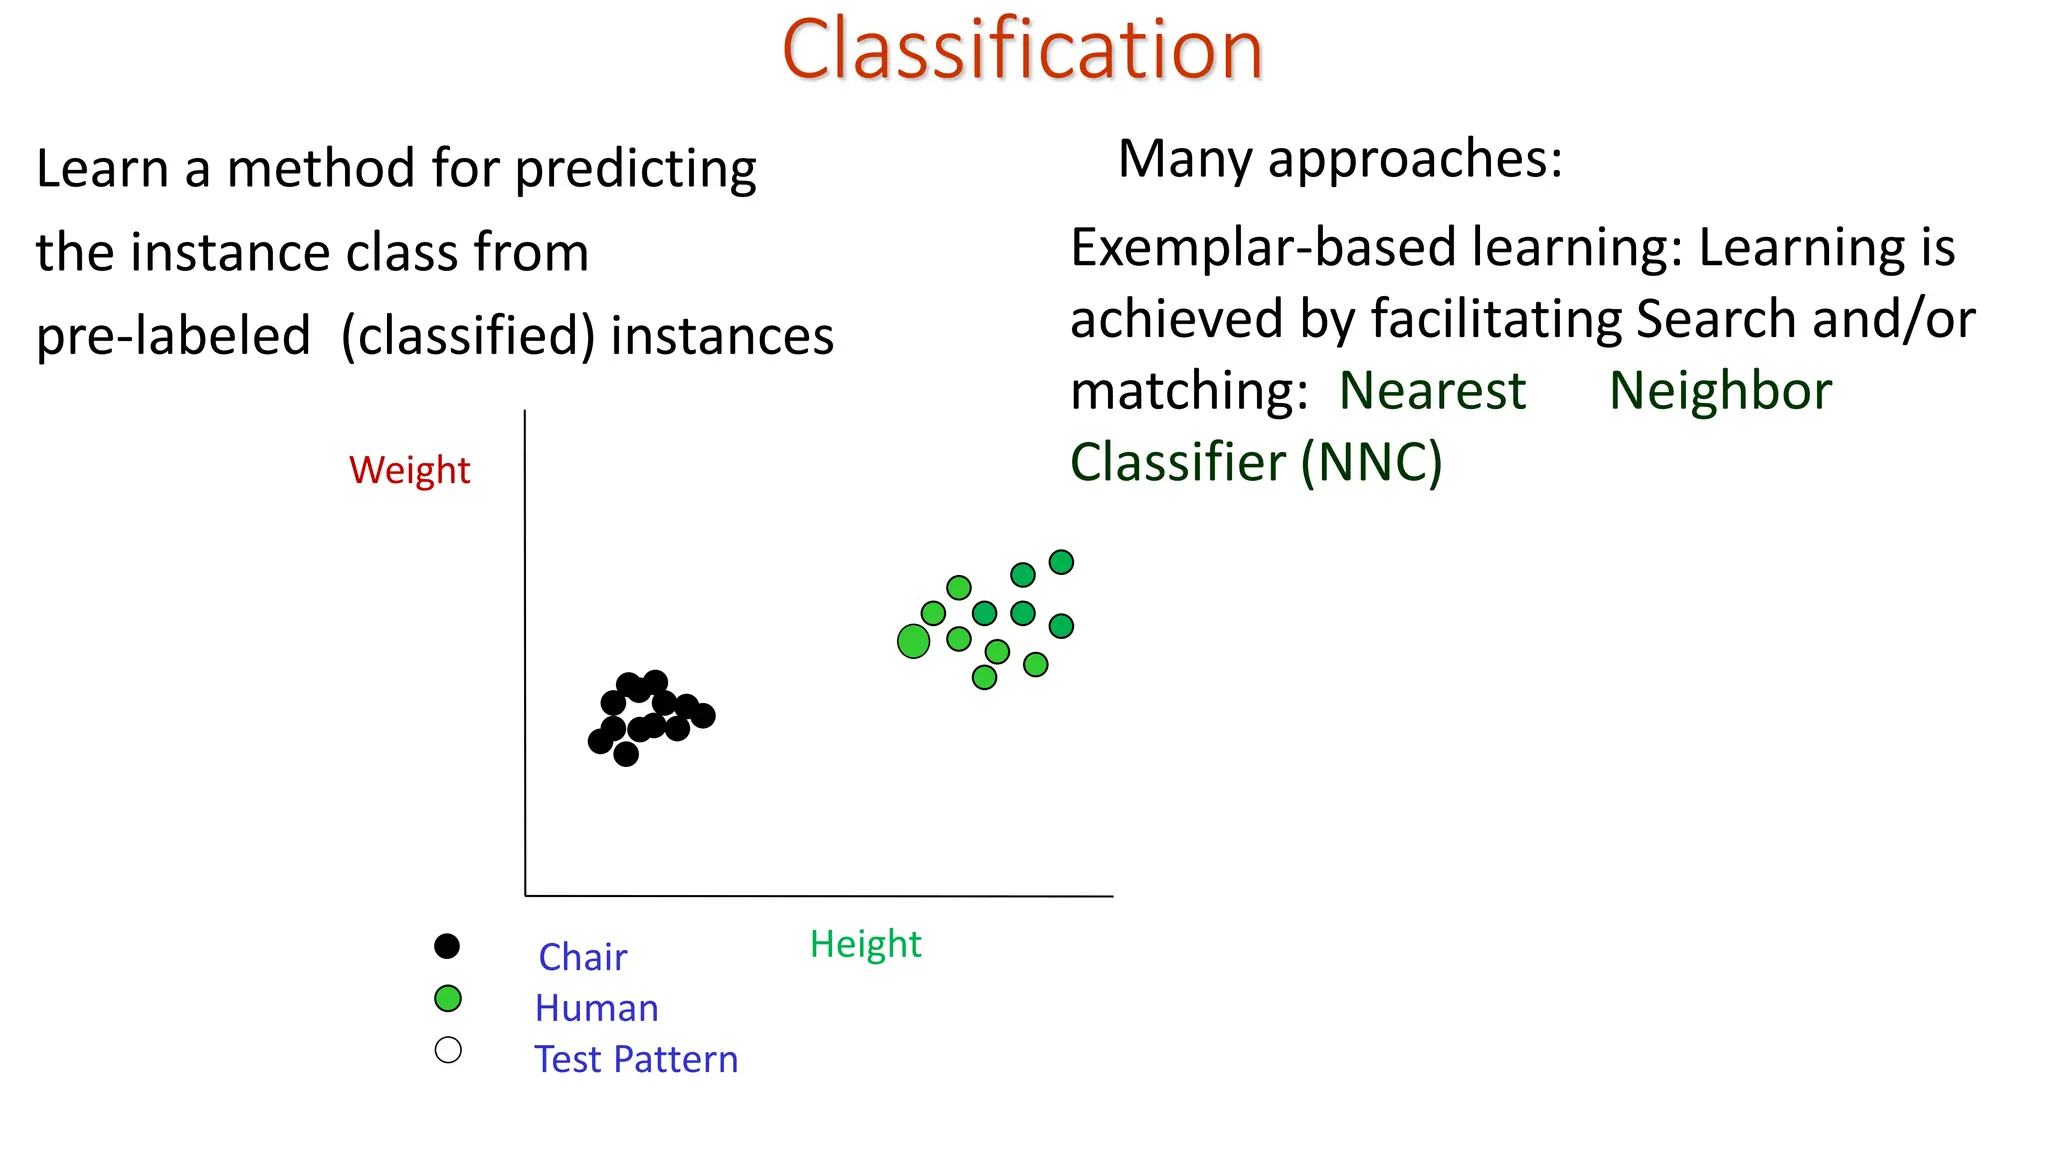
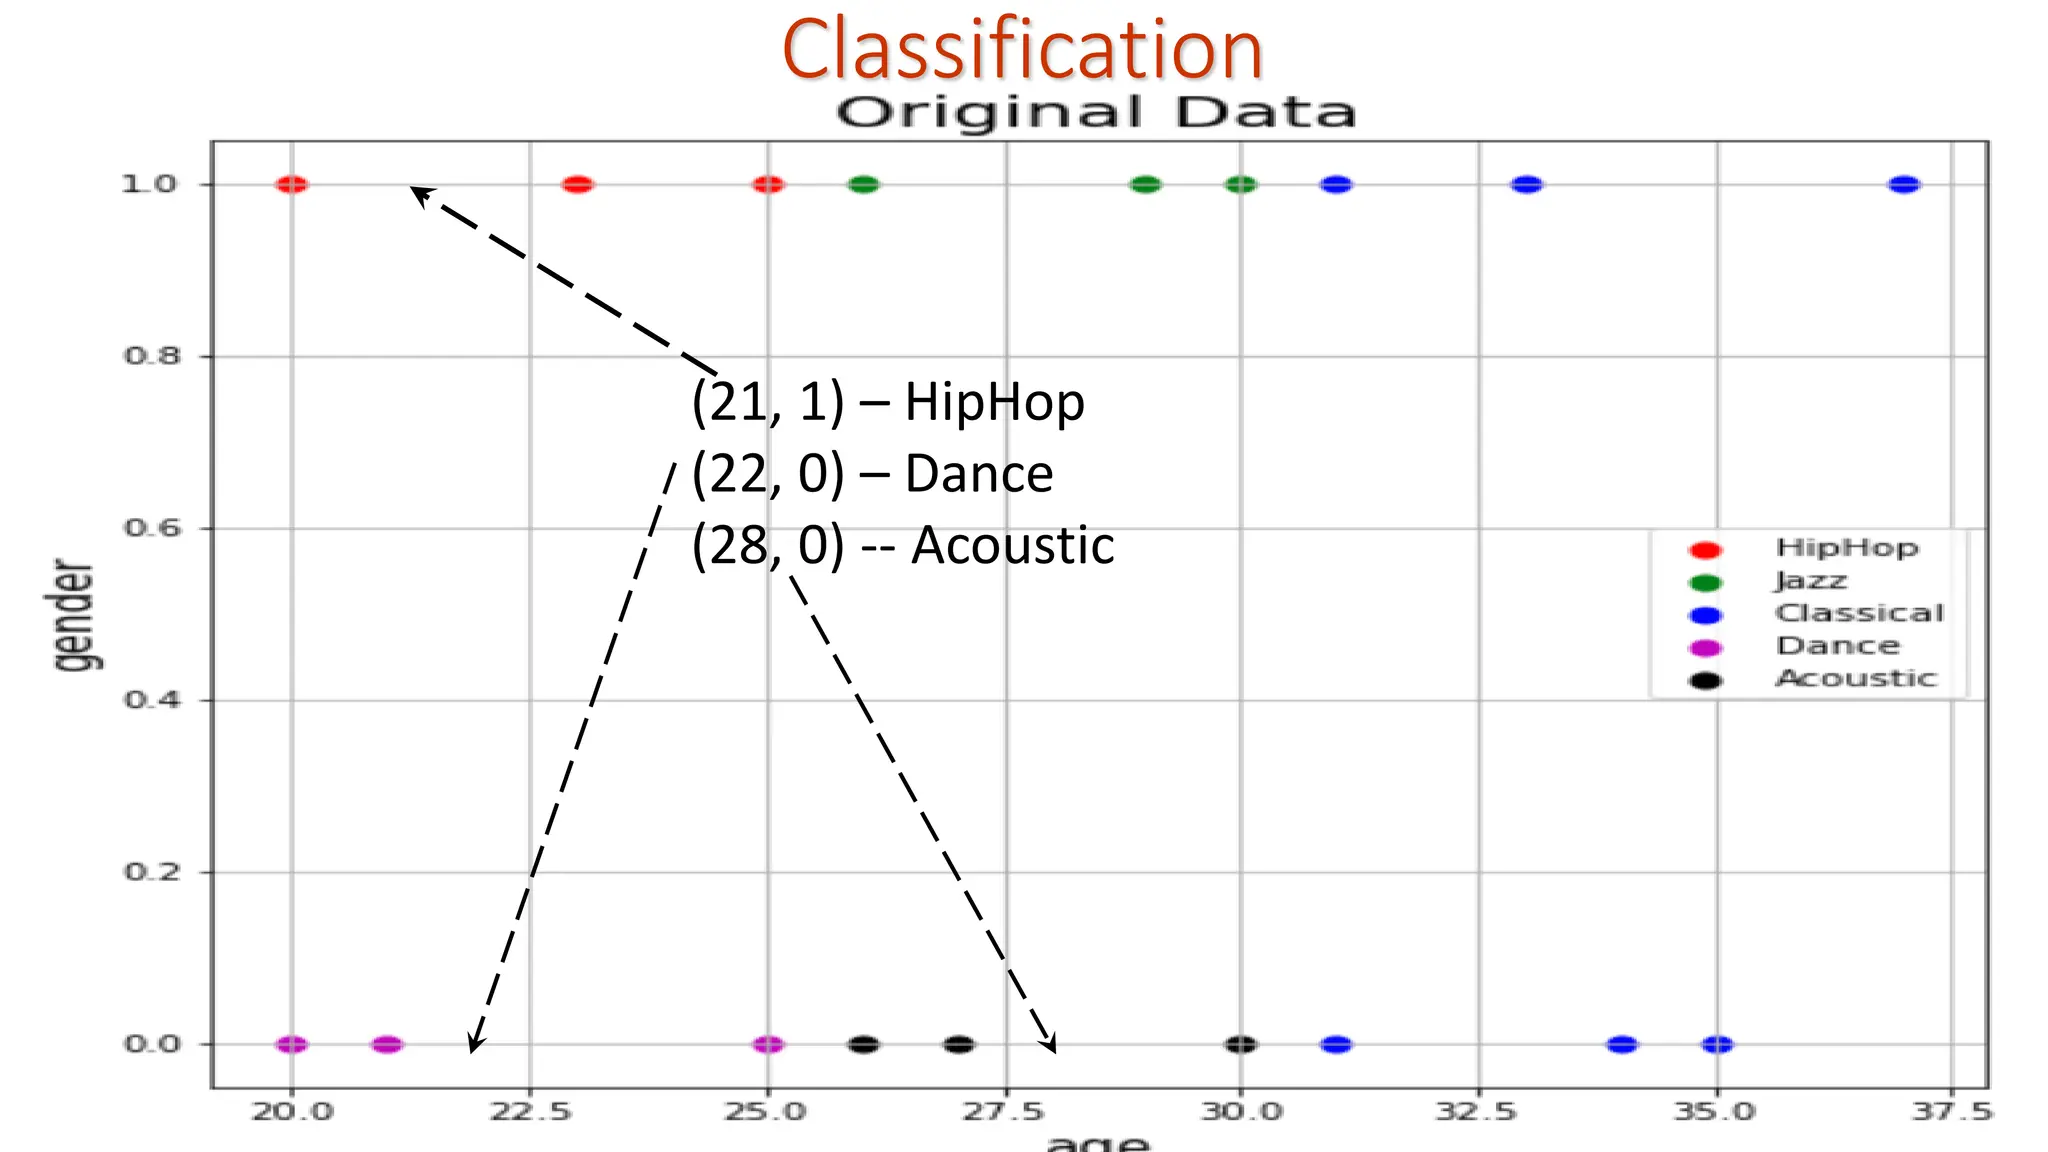
Classification Learn a methodfor predicting the instance class from pre-labeled (classified) instances Many approaches: Height Weight Chair Human Test Pattern Exemplar-based learning: Learning is achieved by facilitating Search and/or matching: Nearest Neighbor Classifier (NNC)
31.
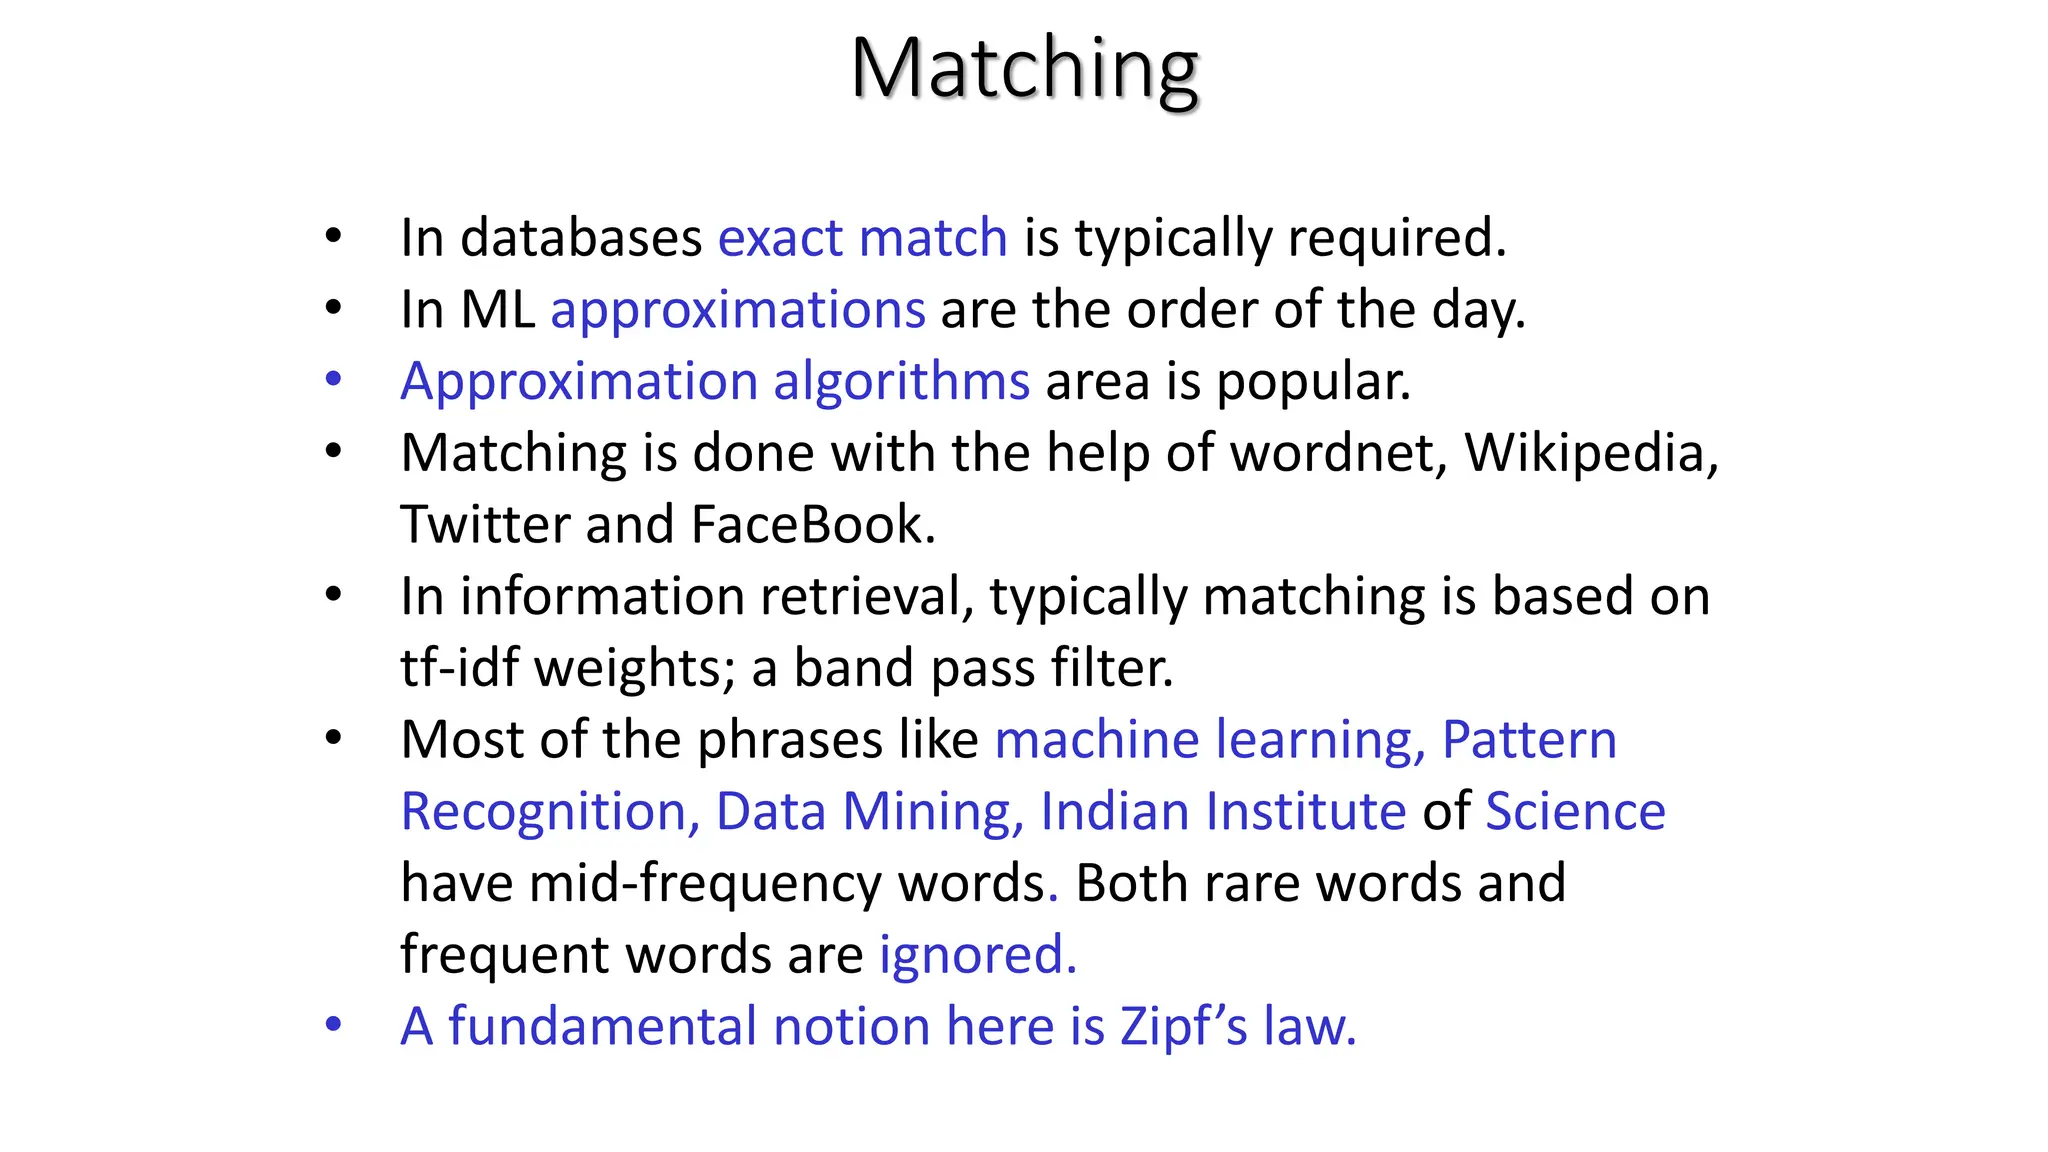
Matching • In databasesexact match is typically required. • In ML approximations are the order of the day. • Approximation algorithms area is popular. • Matching is done with the help of wordnet, Wikipedia, Twitter and FaceBook. • In information retrieval, typically matching is based on tf-idf weights; a band pass filter. • Most of the phrases like machine learning, Pattern Recognition, Data Mining, Indian Institute of Science have mid-frequency words. Both rare words and frequent words are ignored. • A fundamental notion here is Zipf’s law.
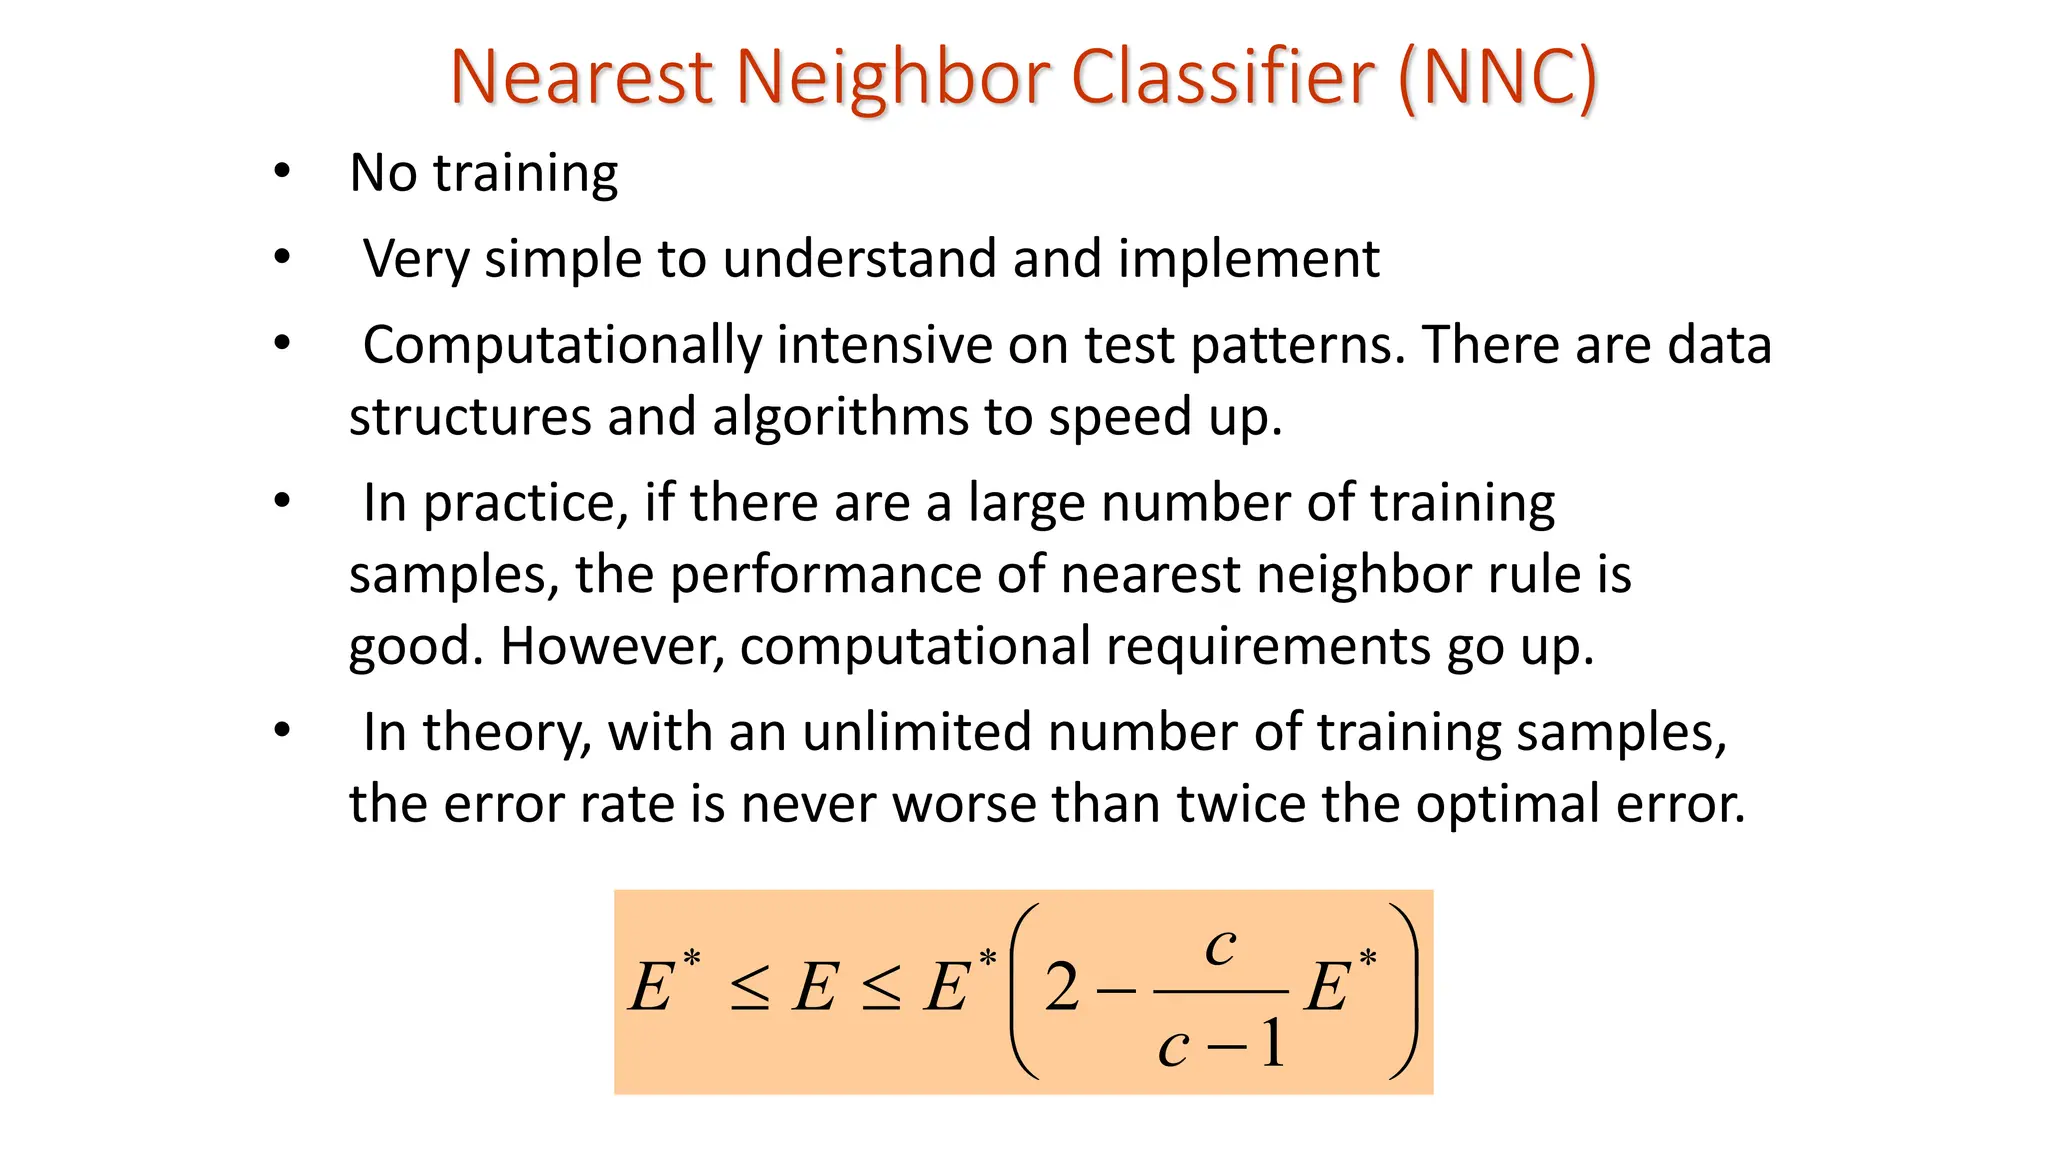
Nearest Neighbor Classifier(NNC) • No training • Very simple to understand and implement • Computationally intensive on test patterns. There are data structures and algorithms to speed up. • In practice, if there are a large number of training samples, the performance of nearest neighbor rule is good. However, computational requirements go up. • In theory, with an unlimited number of training samples, the error rate is never worse than twice the optimal error. − − * * * 1 2 E c c E E E
43.
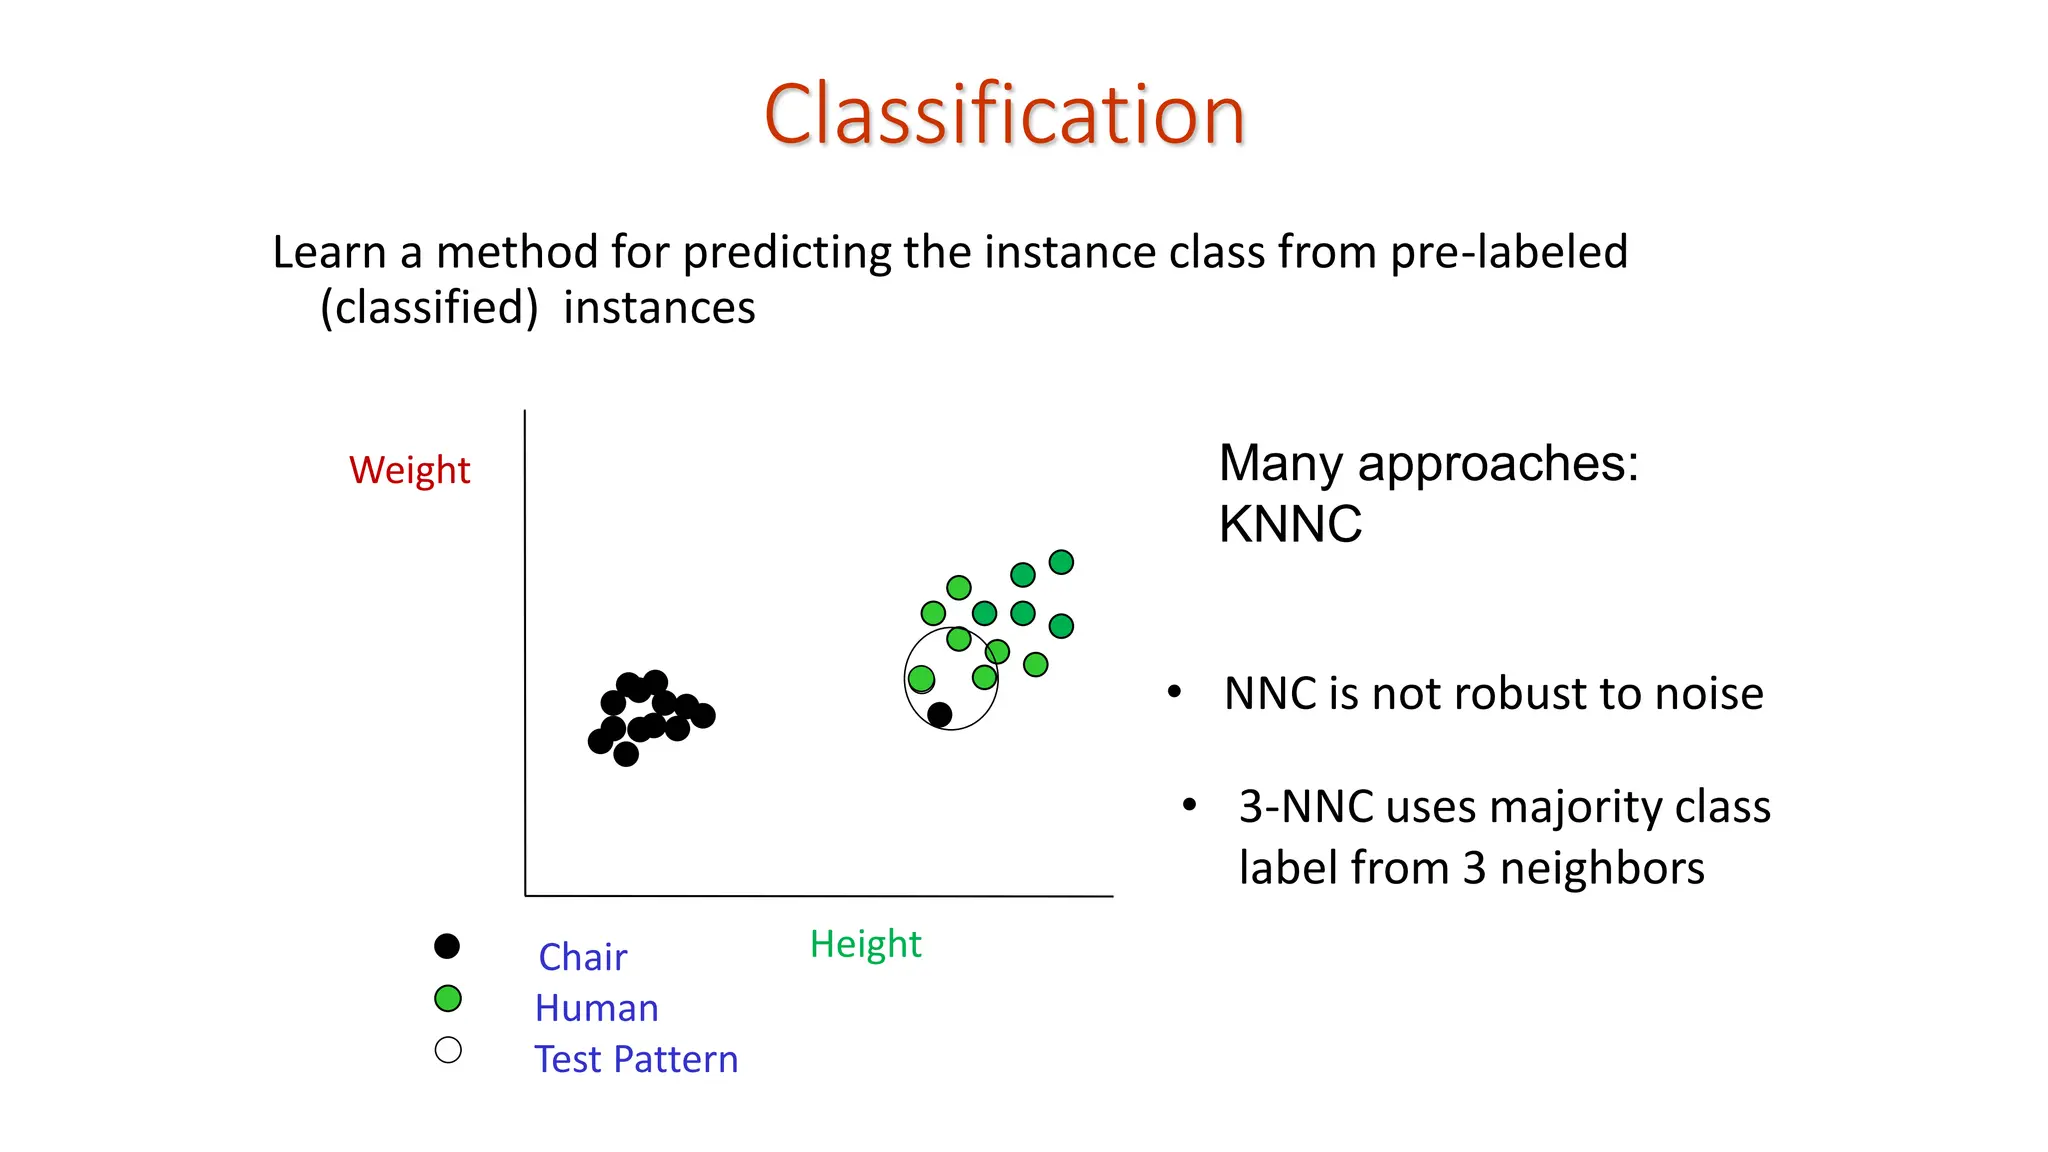
Classification Learn a methodfor predicting the instance class from pre-labeled (classified) instances Many approaches: KNNC Height Weight Chair Human Test Pattern • NNC is not robust to noise • 3-NNC uses majority class label from 3 neighbors
44.
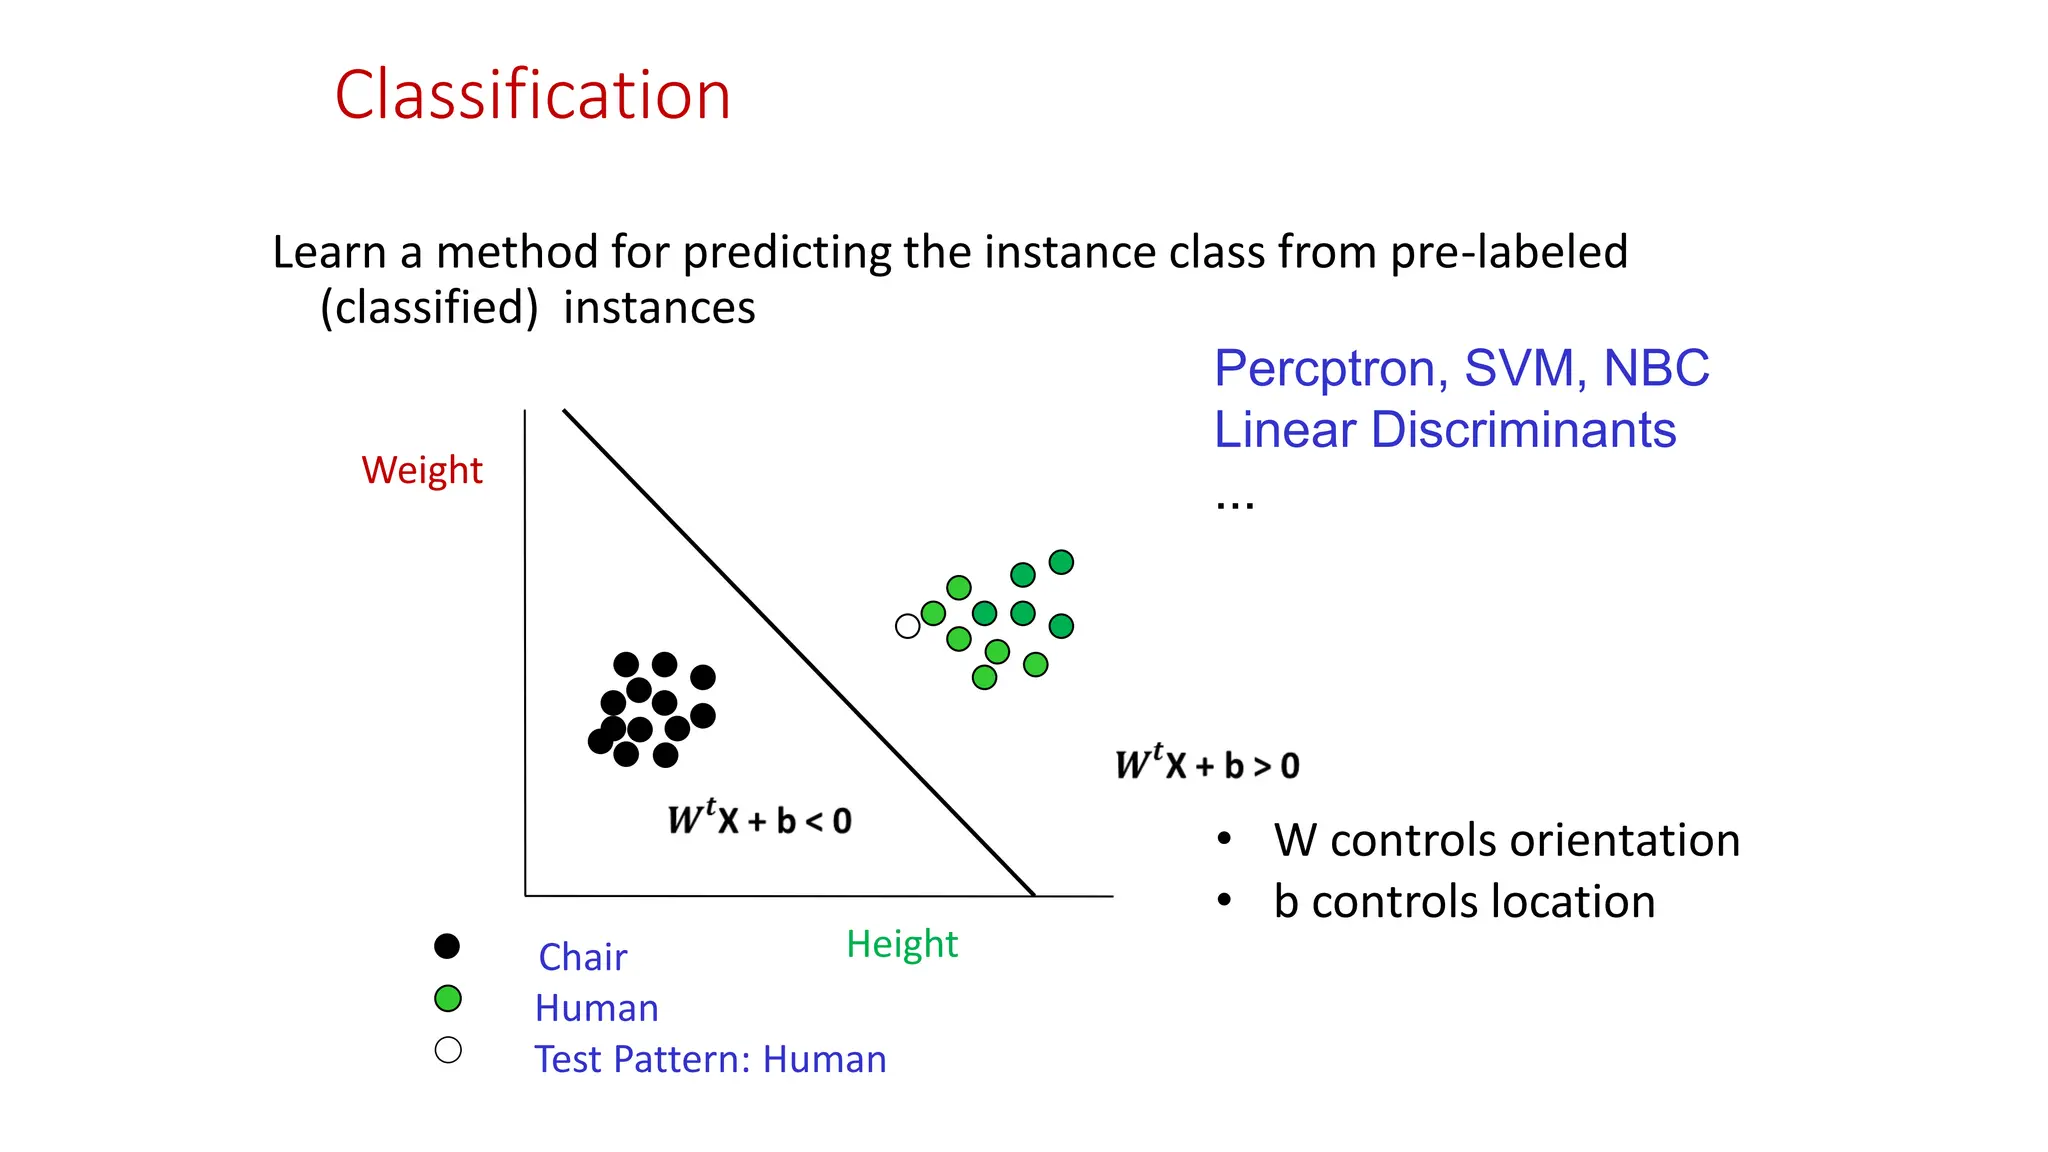
Classification Learn a methodfor predicting the instance class from pre-labeled (classified) instances Percptron, SVM, NBC Linear Discriminants ... Height Weight Chair Human Test Pattern: Human • W controls orientation • b controls location
45.
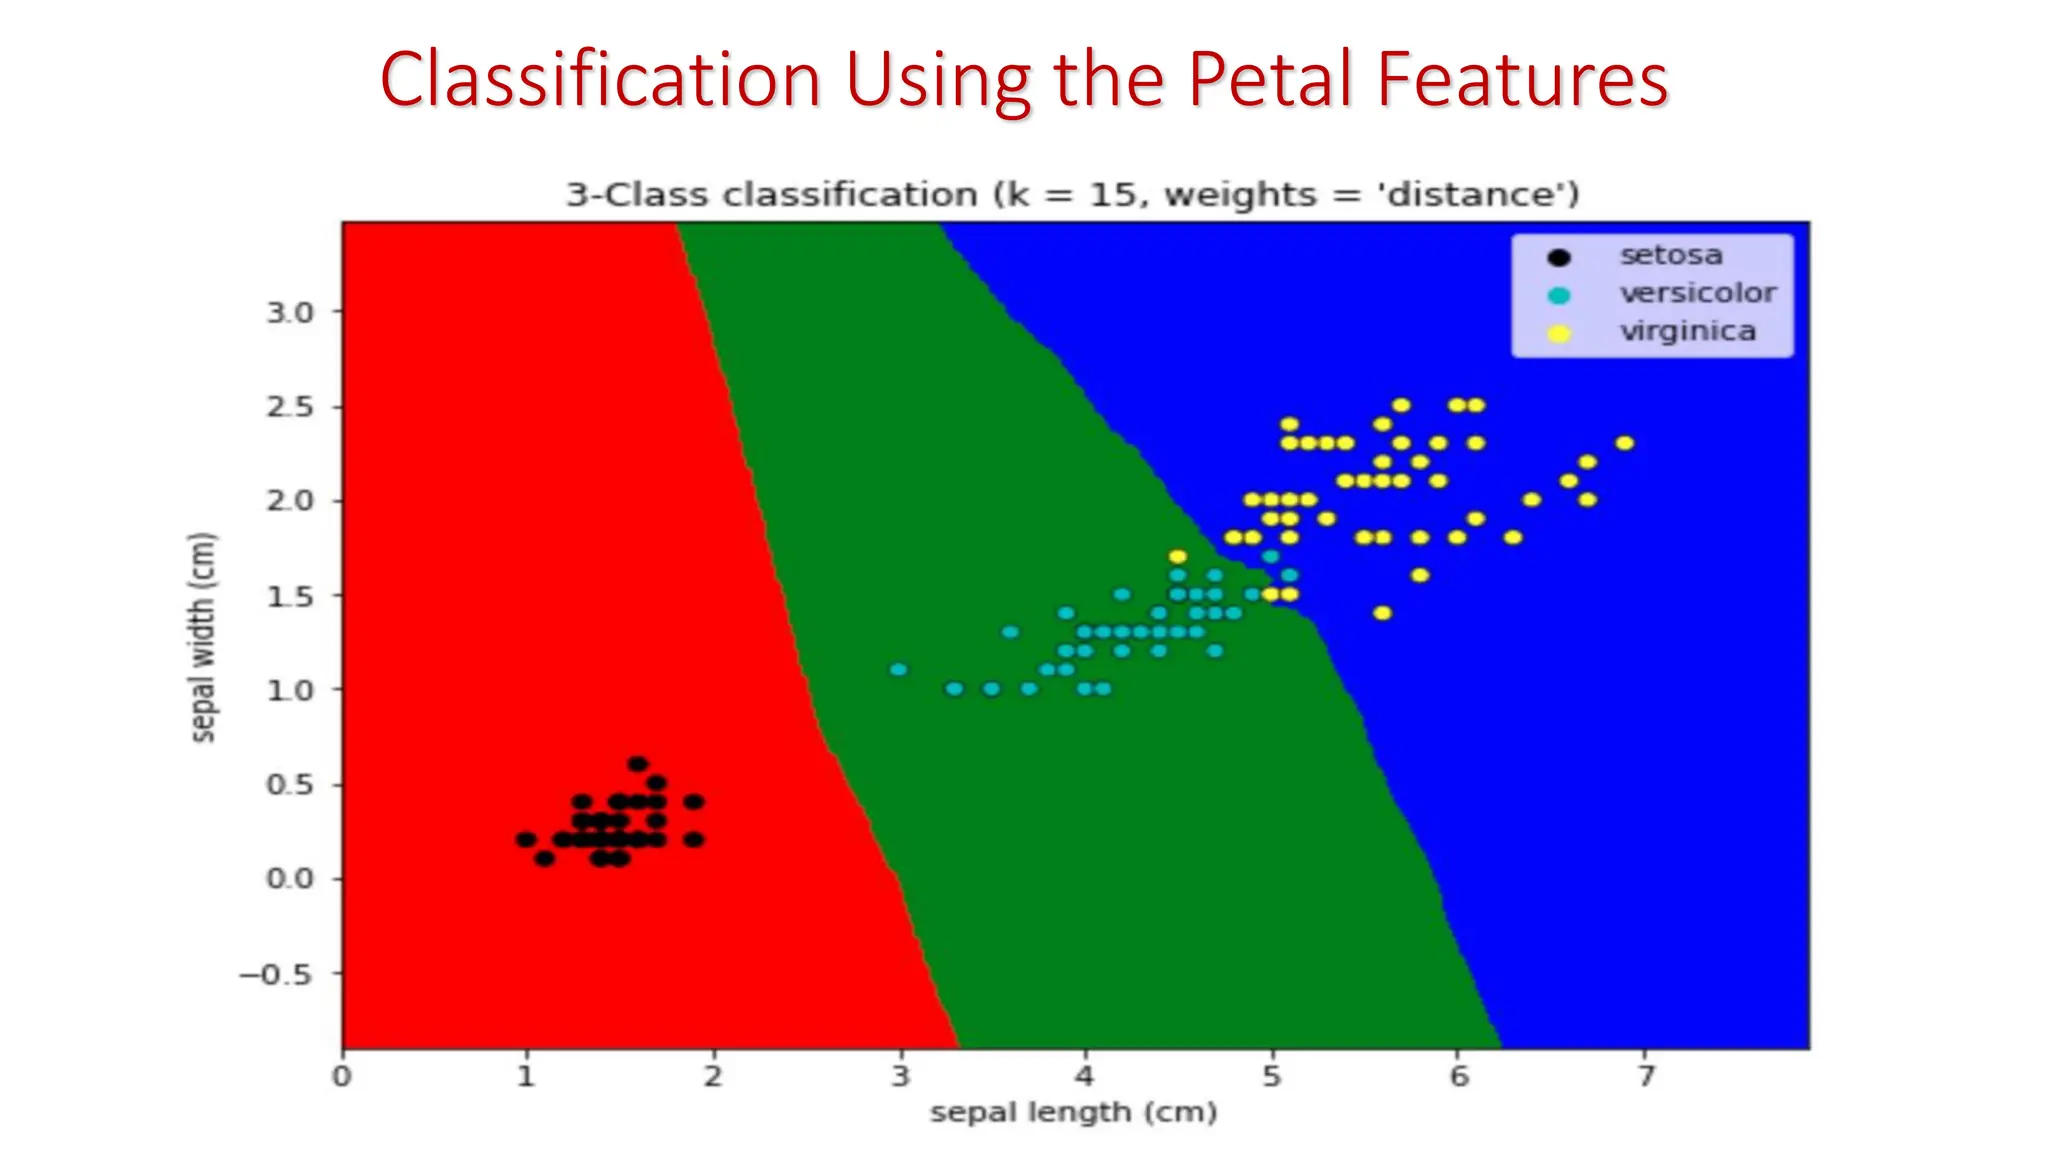
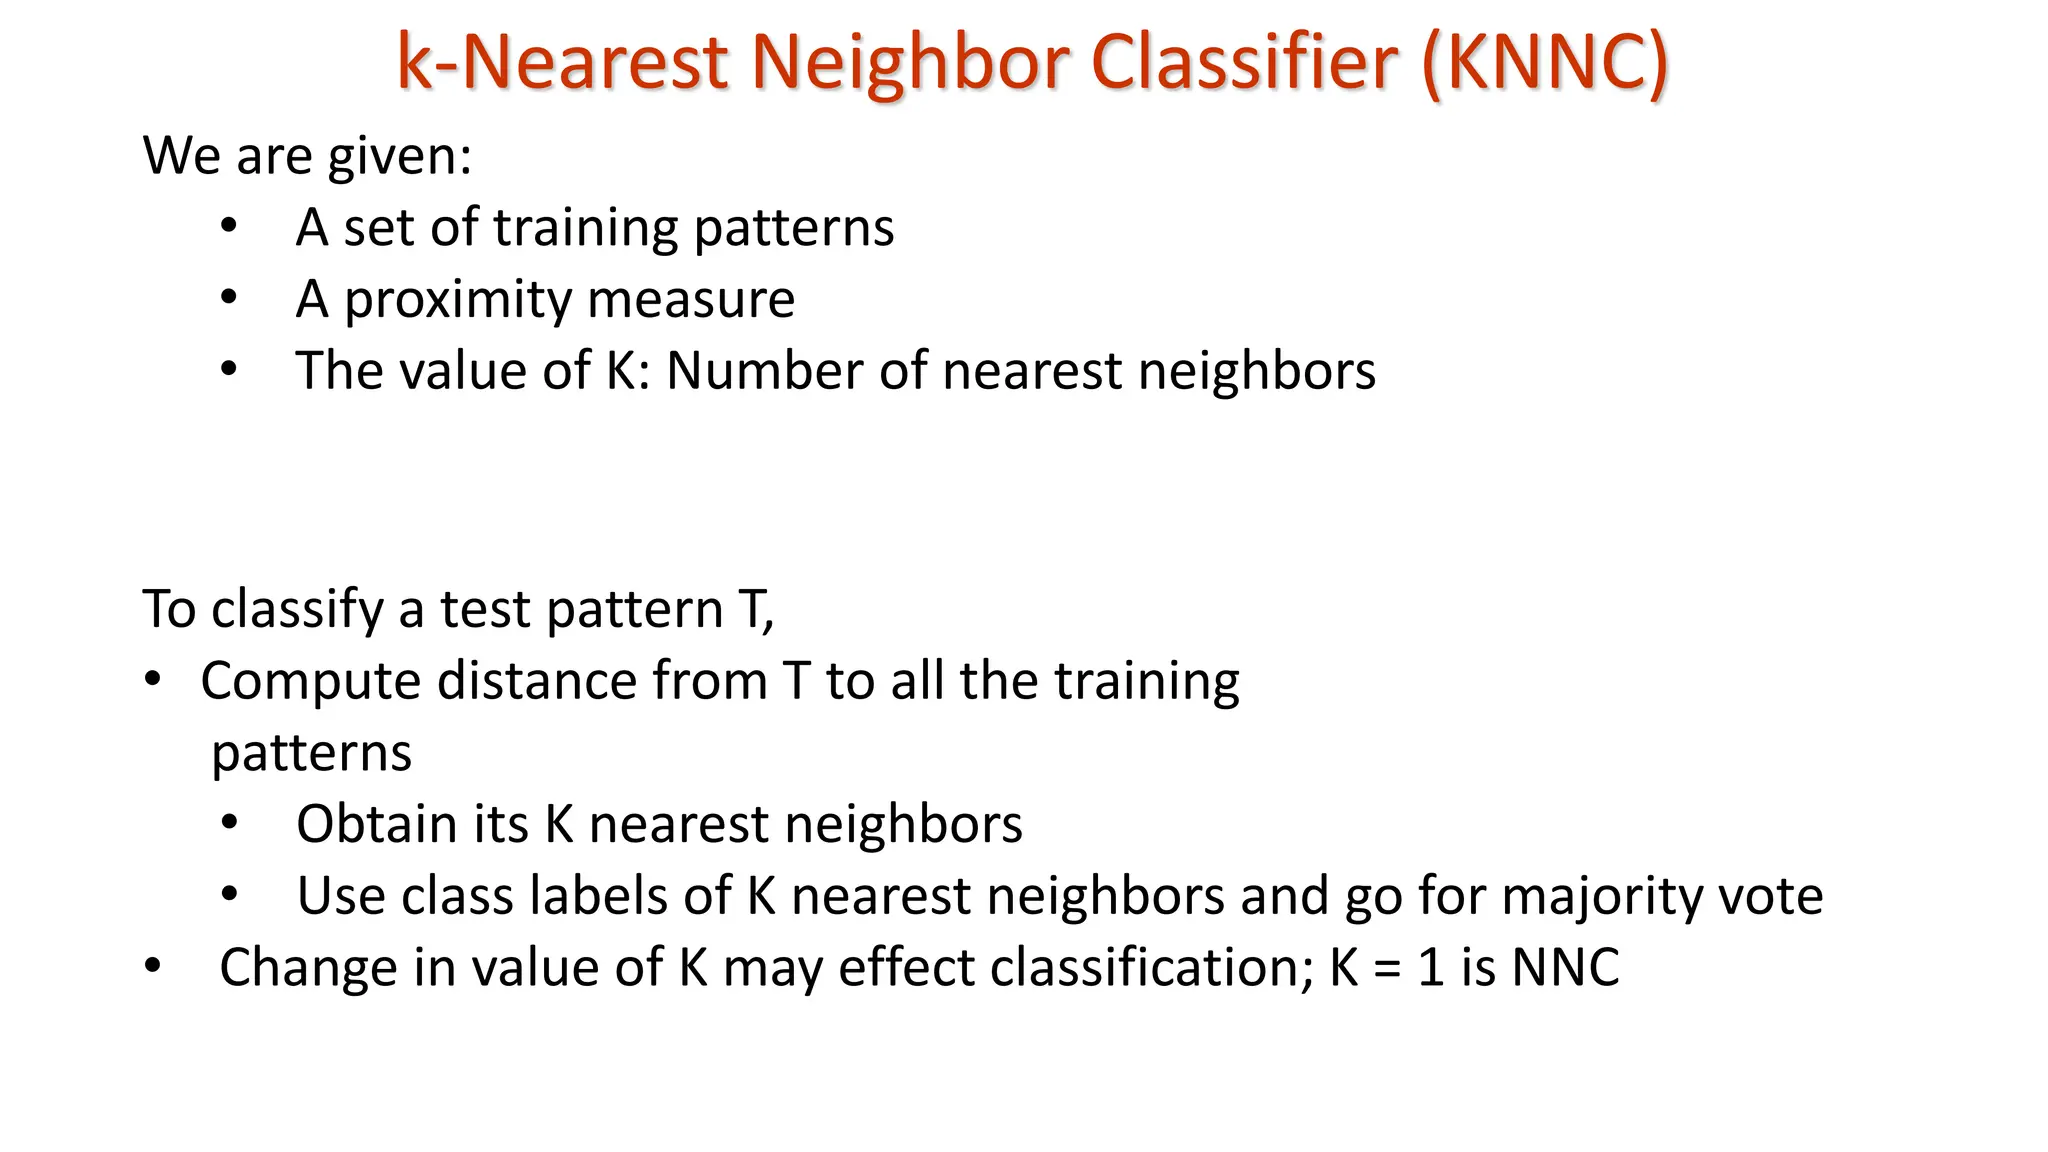
k-Nearest Neighbor Classifier(KNNC) To classify a test pattern T, • Compute distance from T to all the training patterns • Obtain its K nearest neighbors • Use class labels of K nearest neighbors and go for majority vote • Change in value of K may effect classification; K = 1 is NNC We are given: • A set of training patterns • A proximity measure • The value of K: Number of nearest neighbors
46.
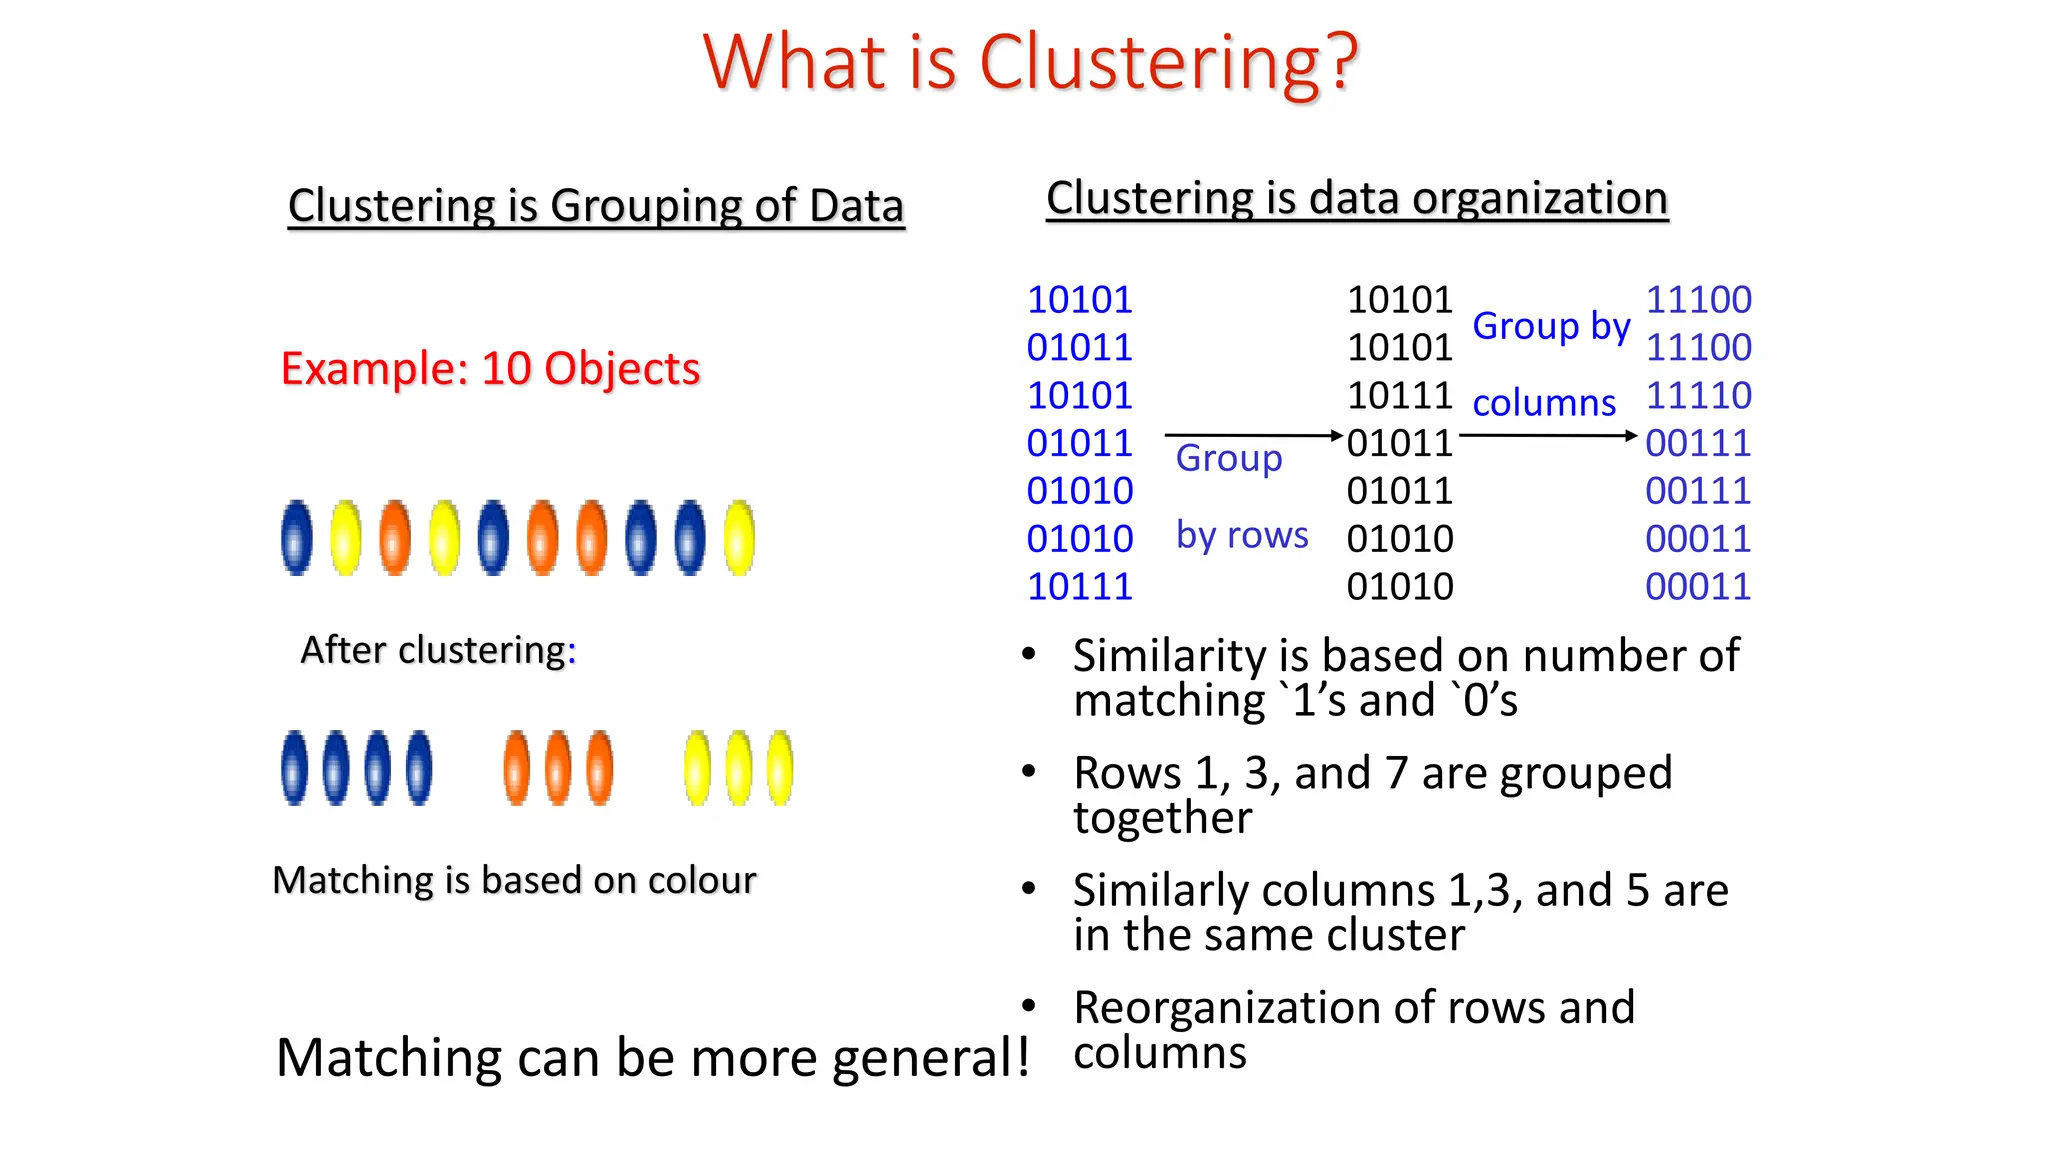
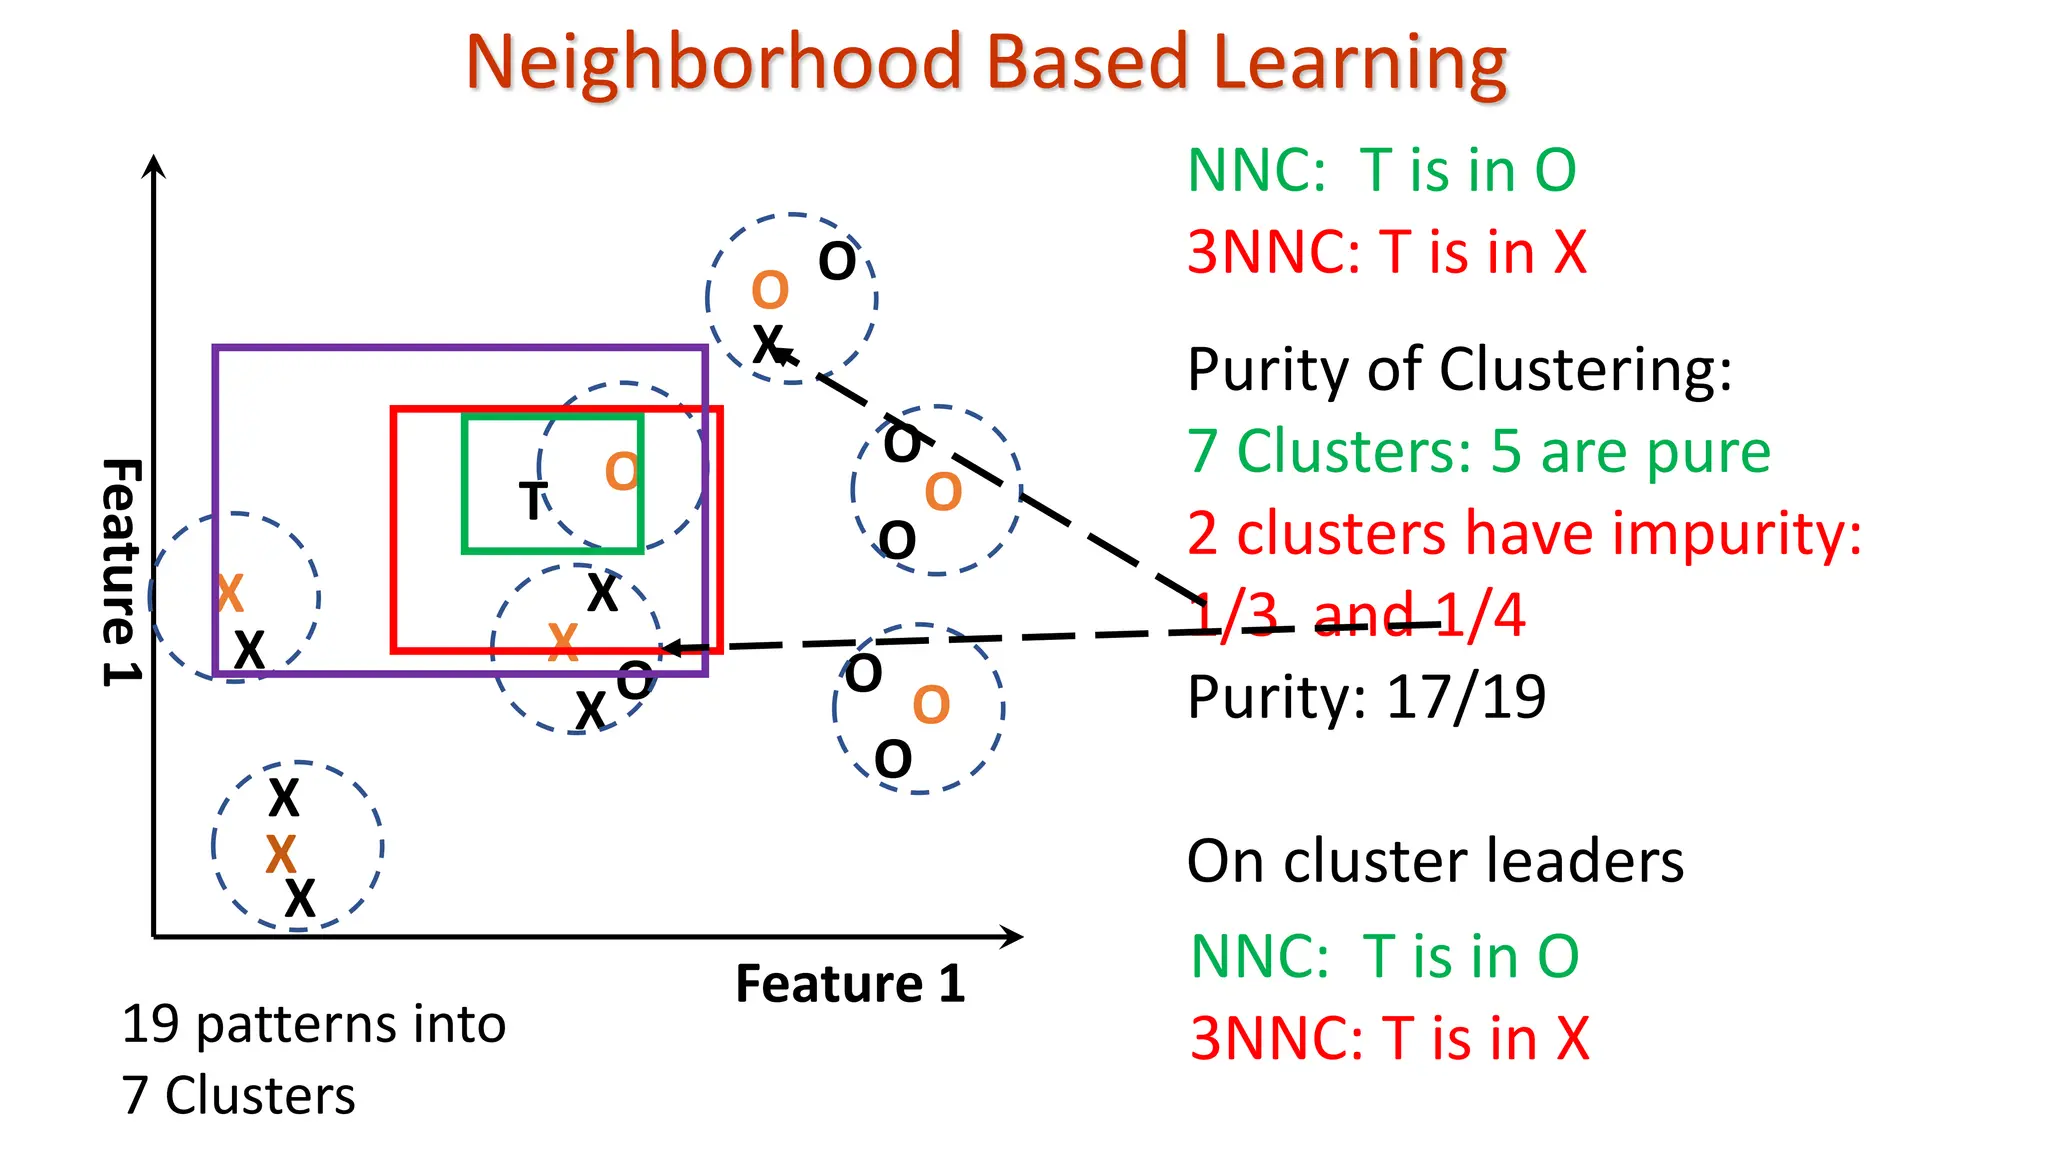
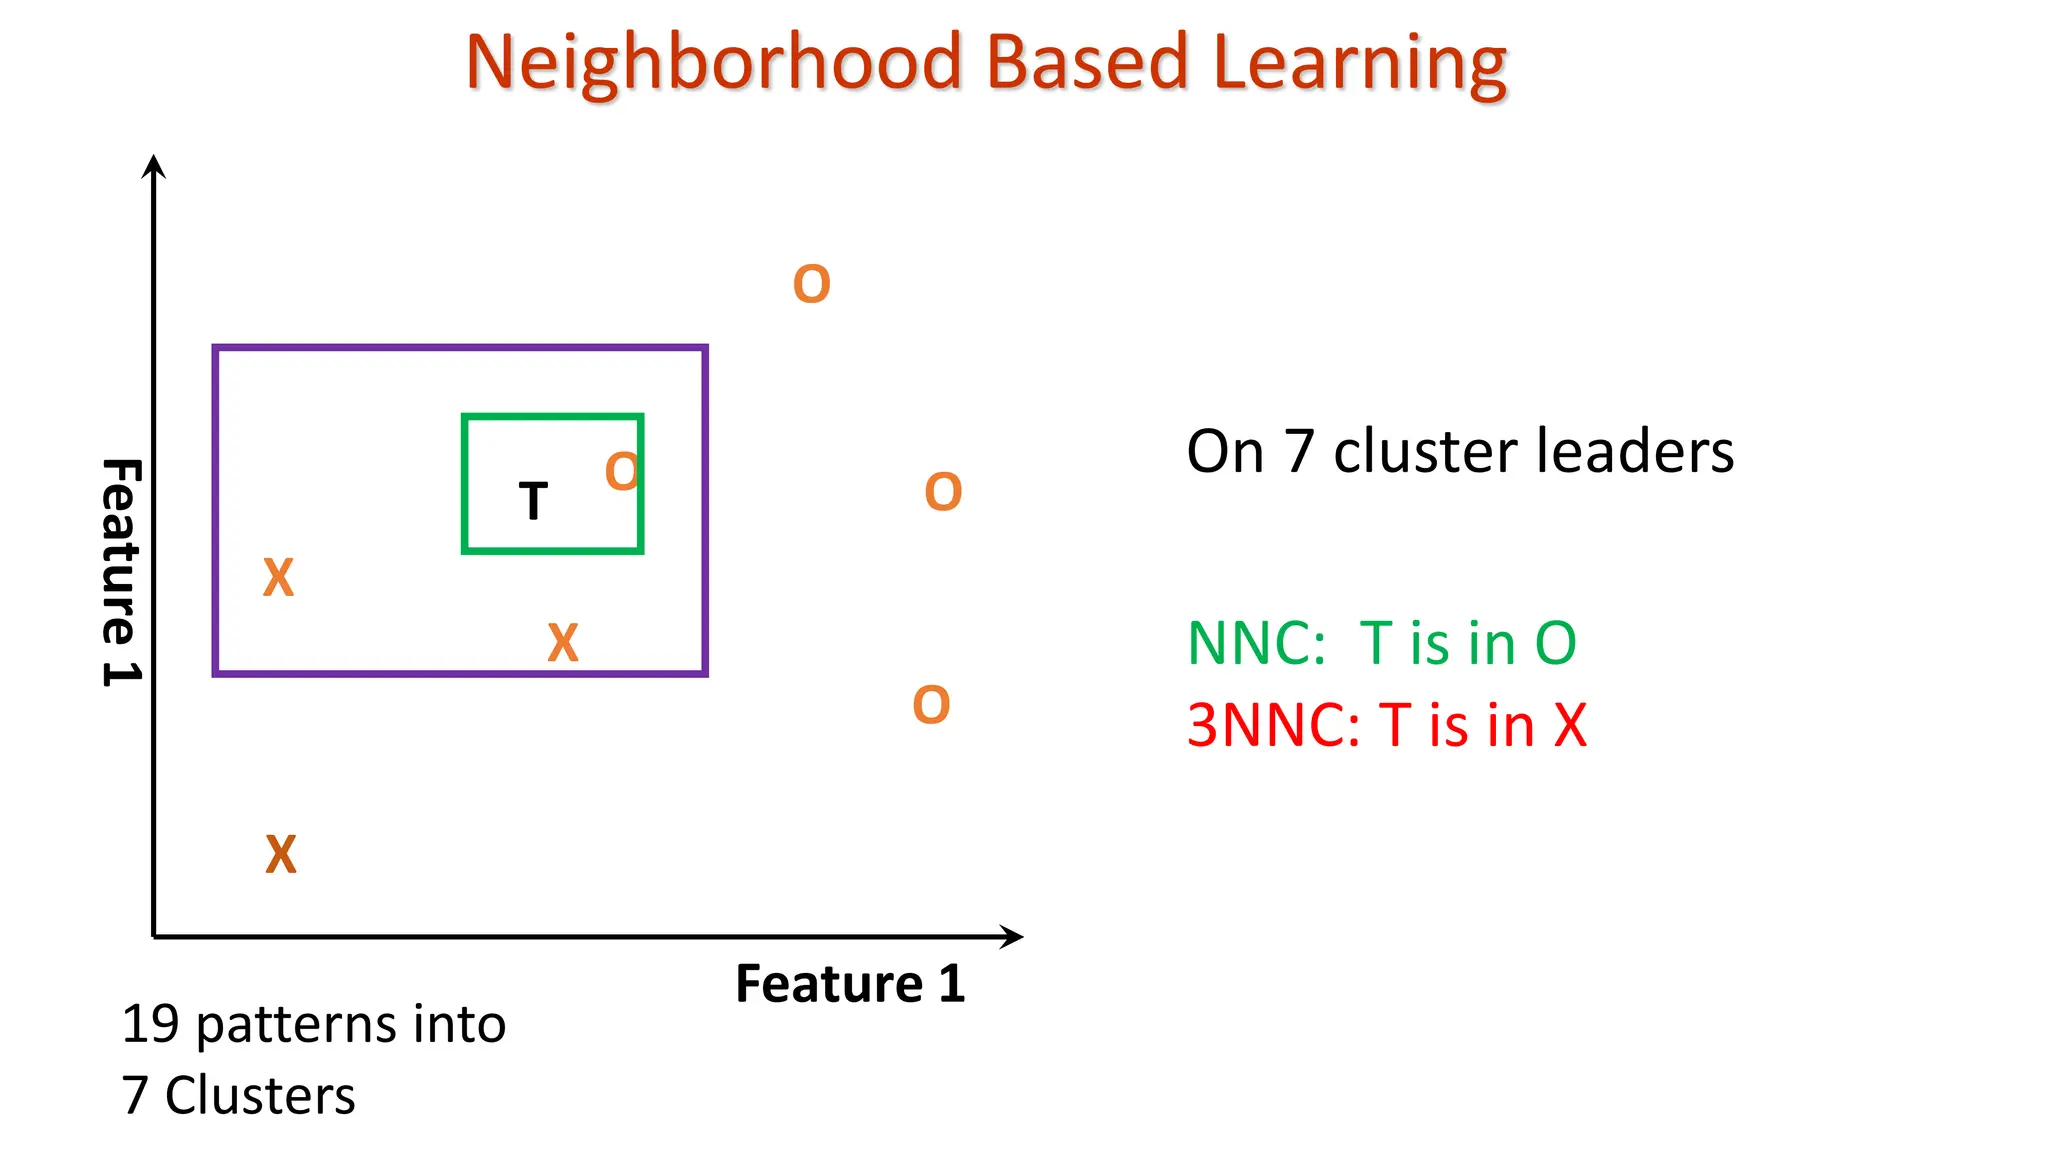
What is Clustering? Example:10 Objects After clustering: Matching is based on colour Clustering is data organization 10101 01011 10101 01011 01010 01010 10111 10101 10101 10111 01011 01011 01010 01010 Group by rows 11100 11100 11110 00111 00111 00011 00011 Group by columns • Similarity is based on number of matching `1’s and `0’s • Rows 1, 3, and 7 are grouped together • Similarly columns 1,3, and 5 are in the same cluster • Reorganization of rows and columns Matching can be more general! Clustering is Grouping of Data
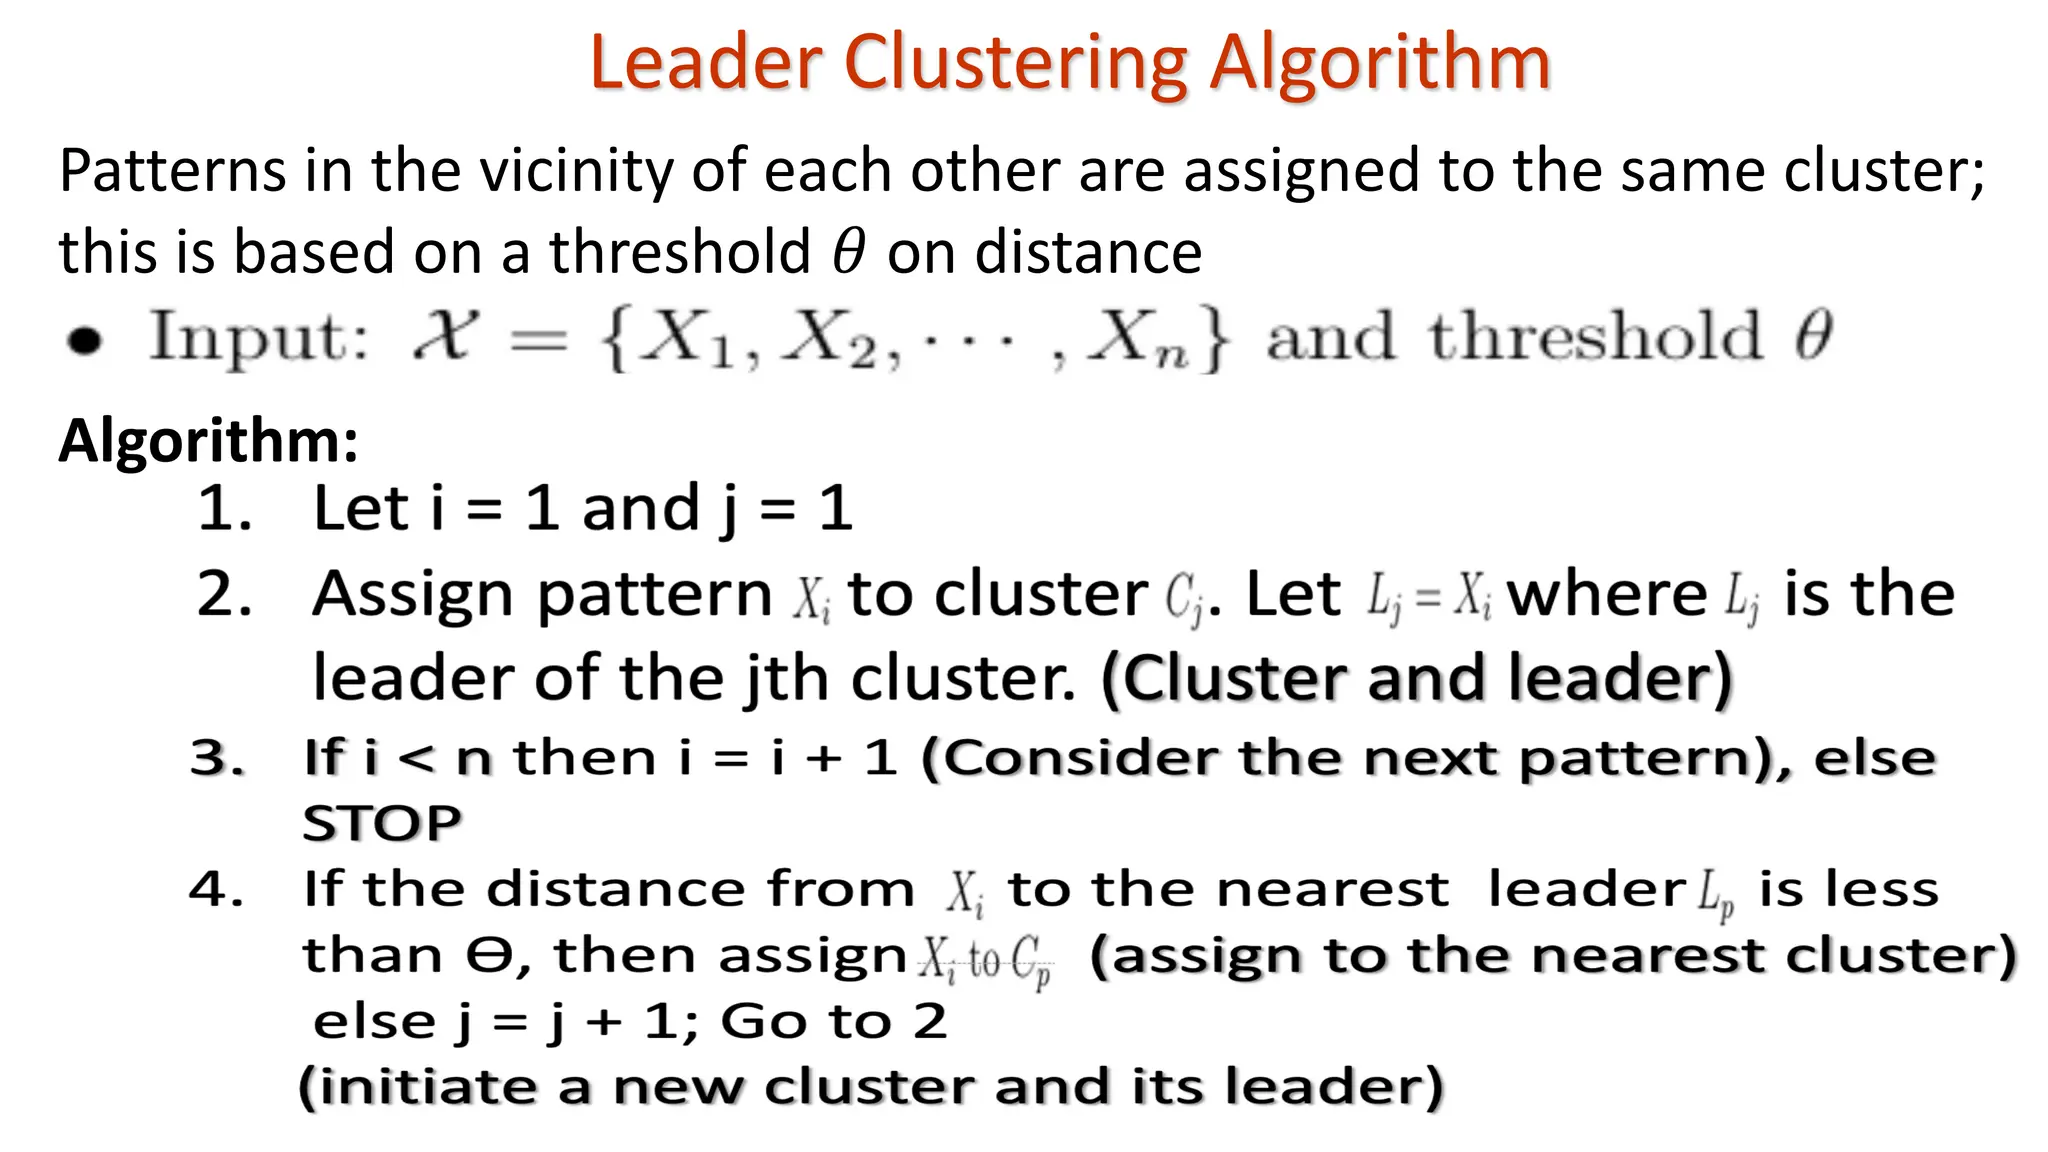
Leader Clustering Algorithm Patternsin the vicinity of each other are assigned to the same cluster; this is based on a threshold 𝜃 on distance Algorithm:
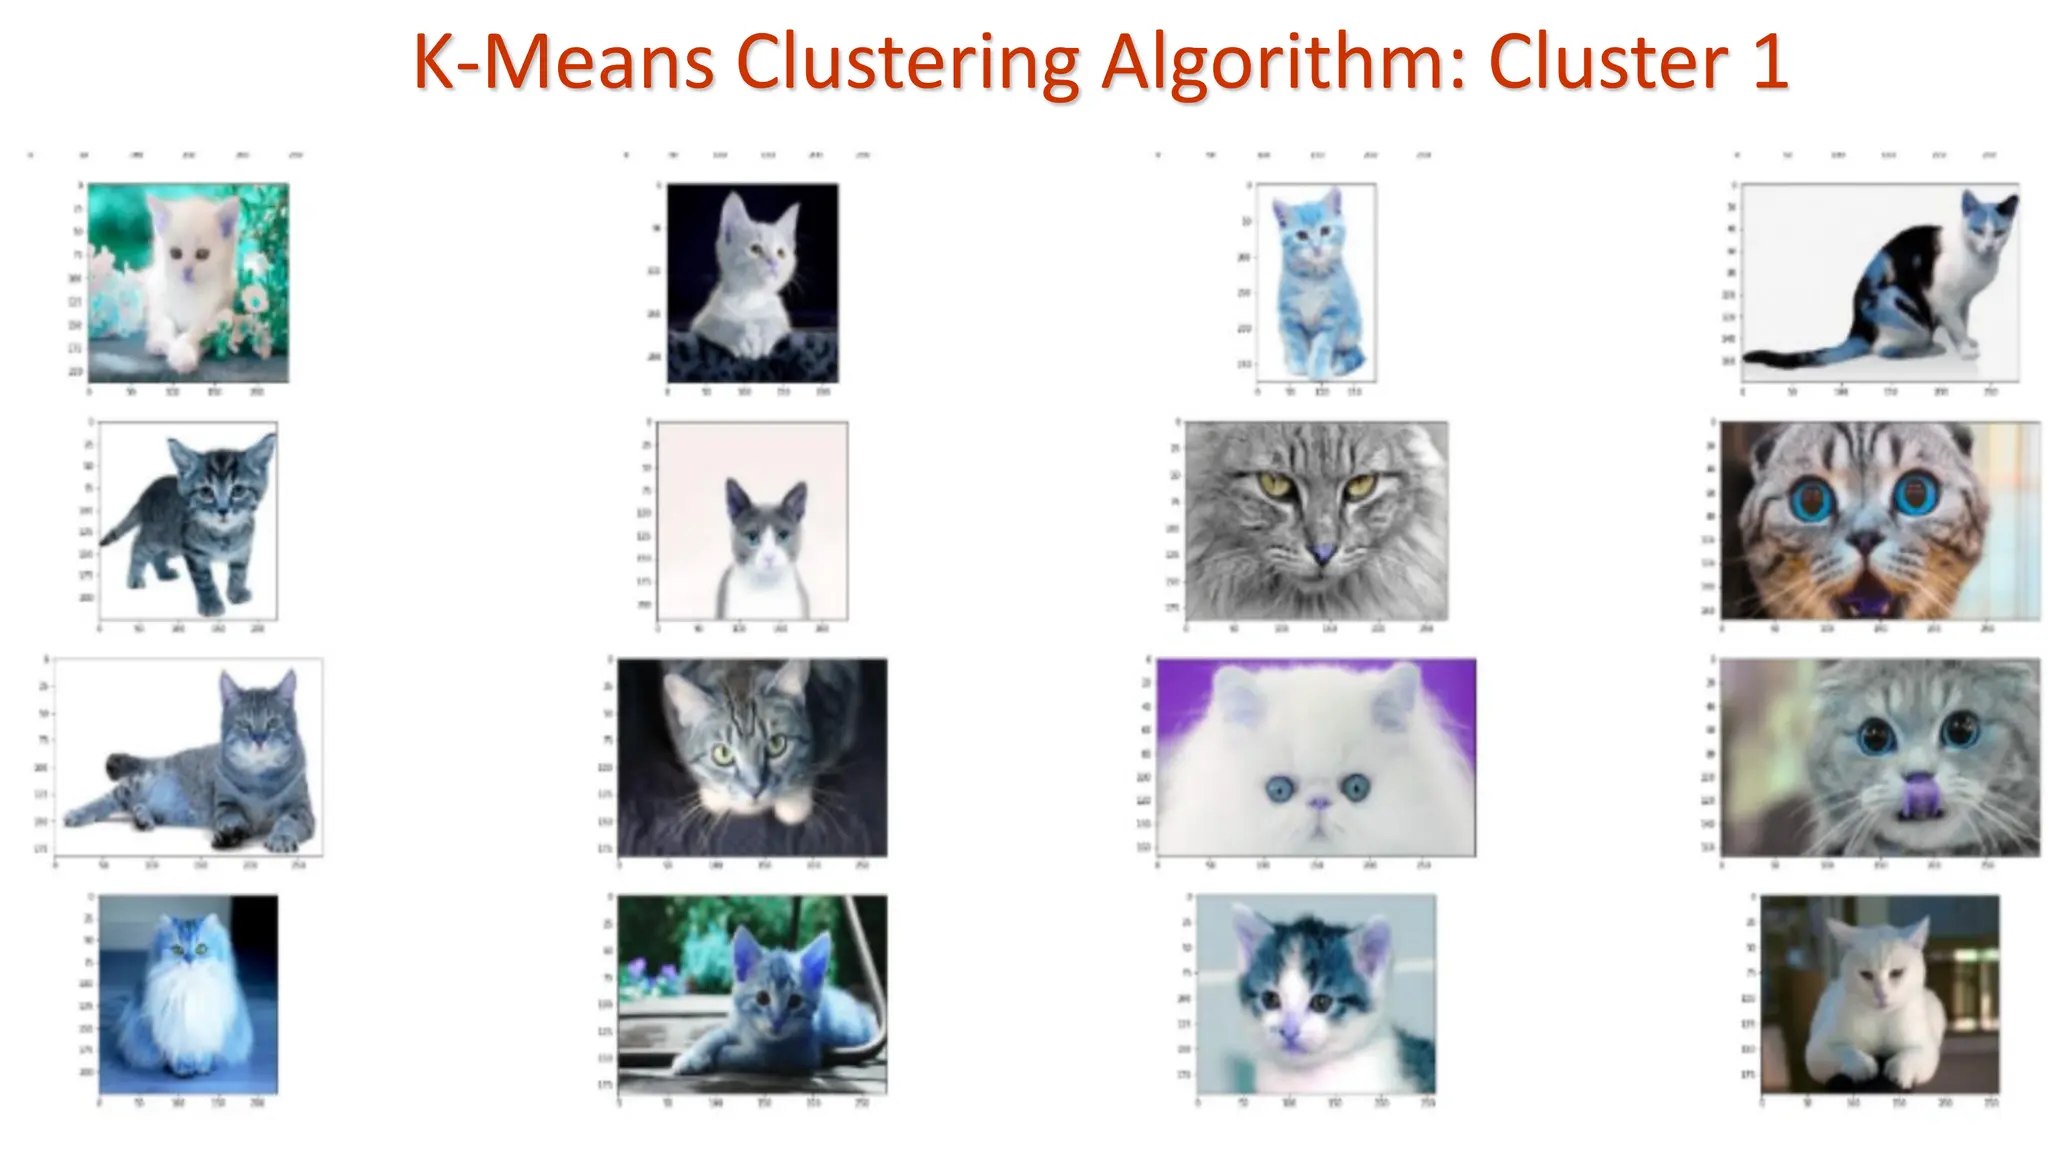
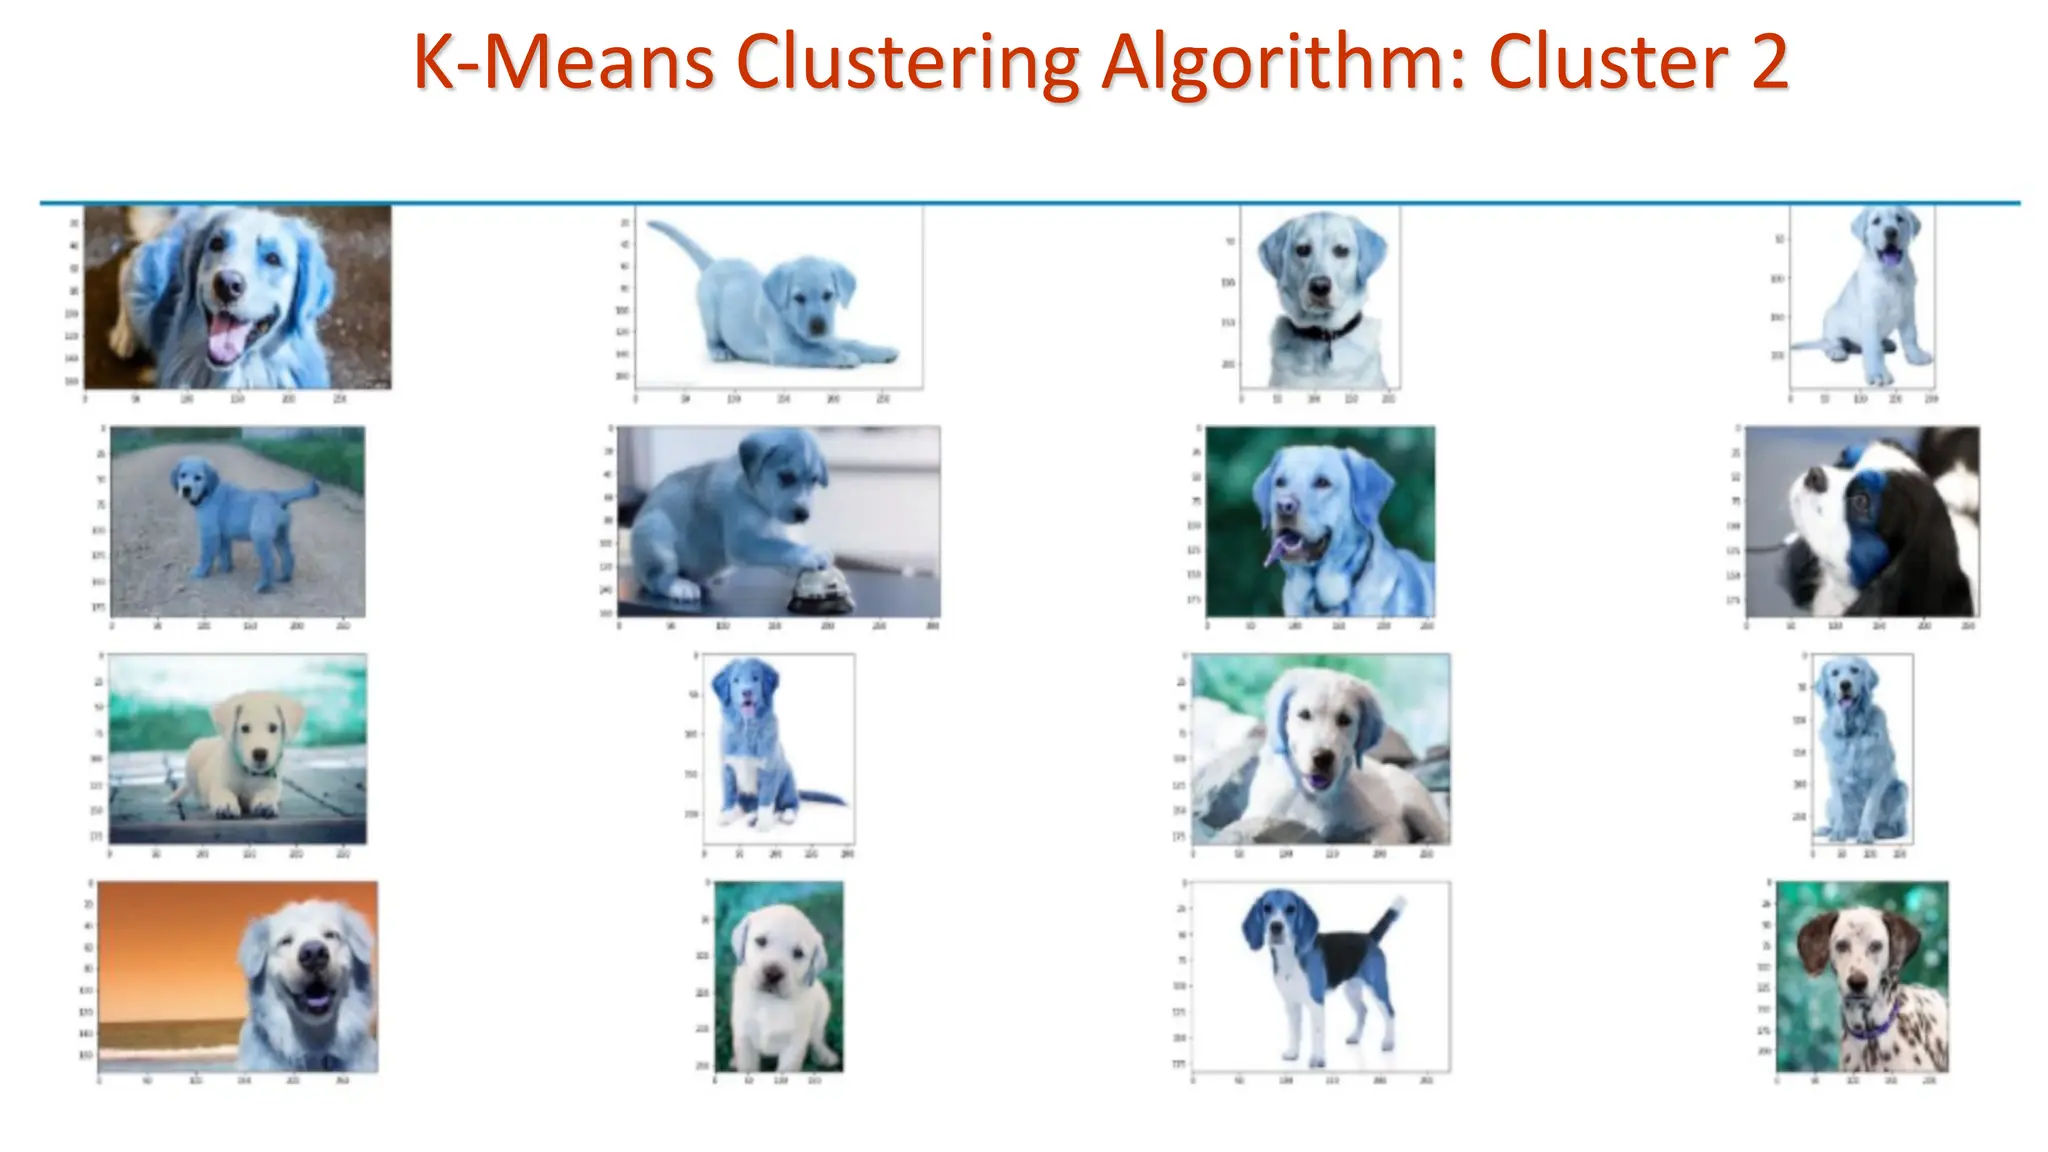
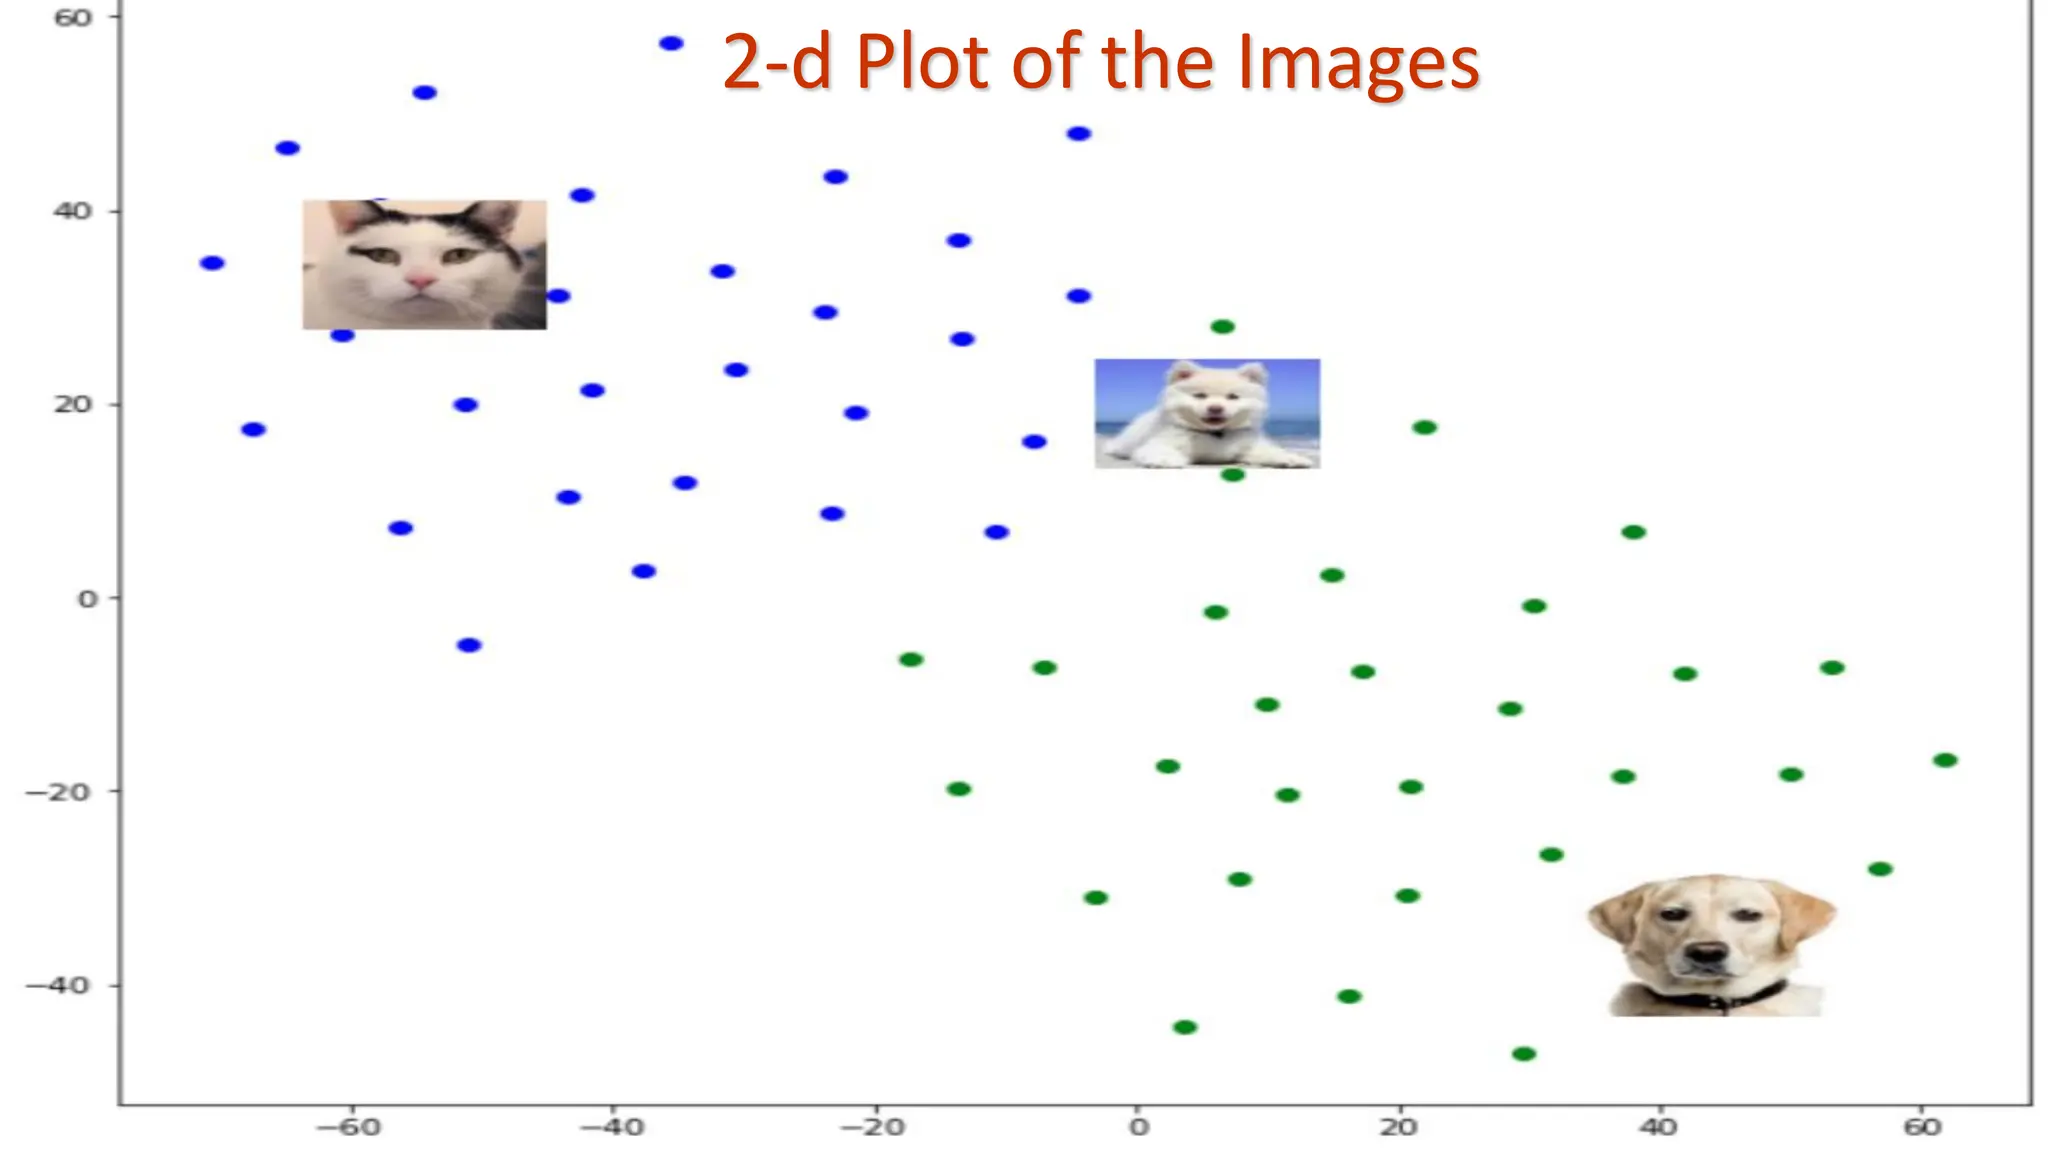
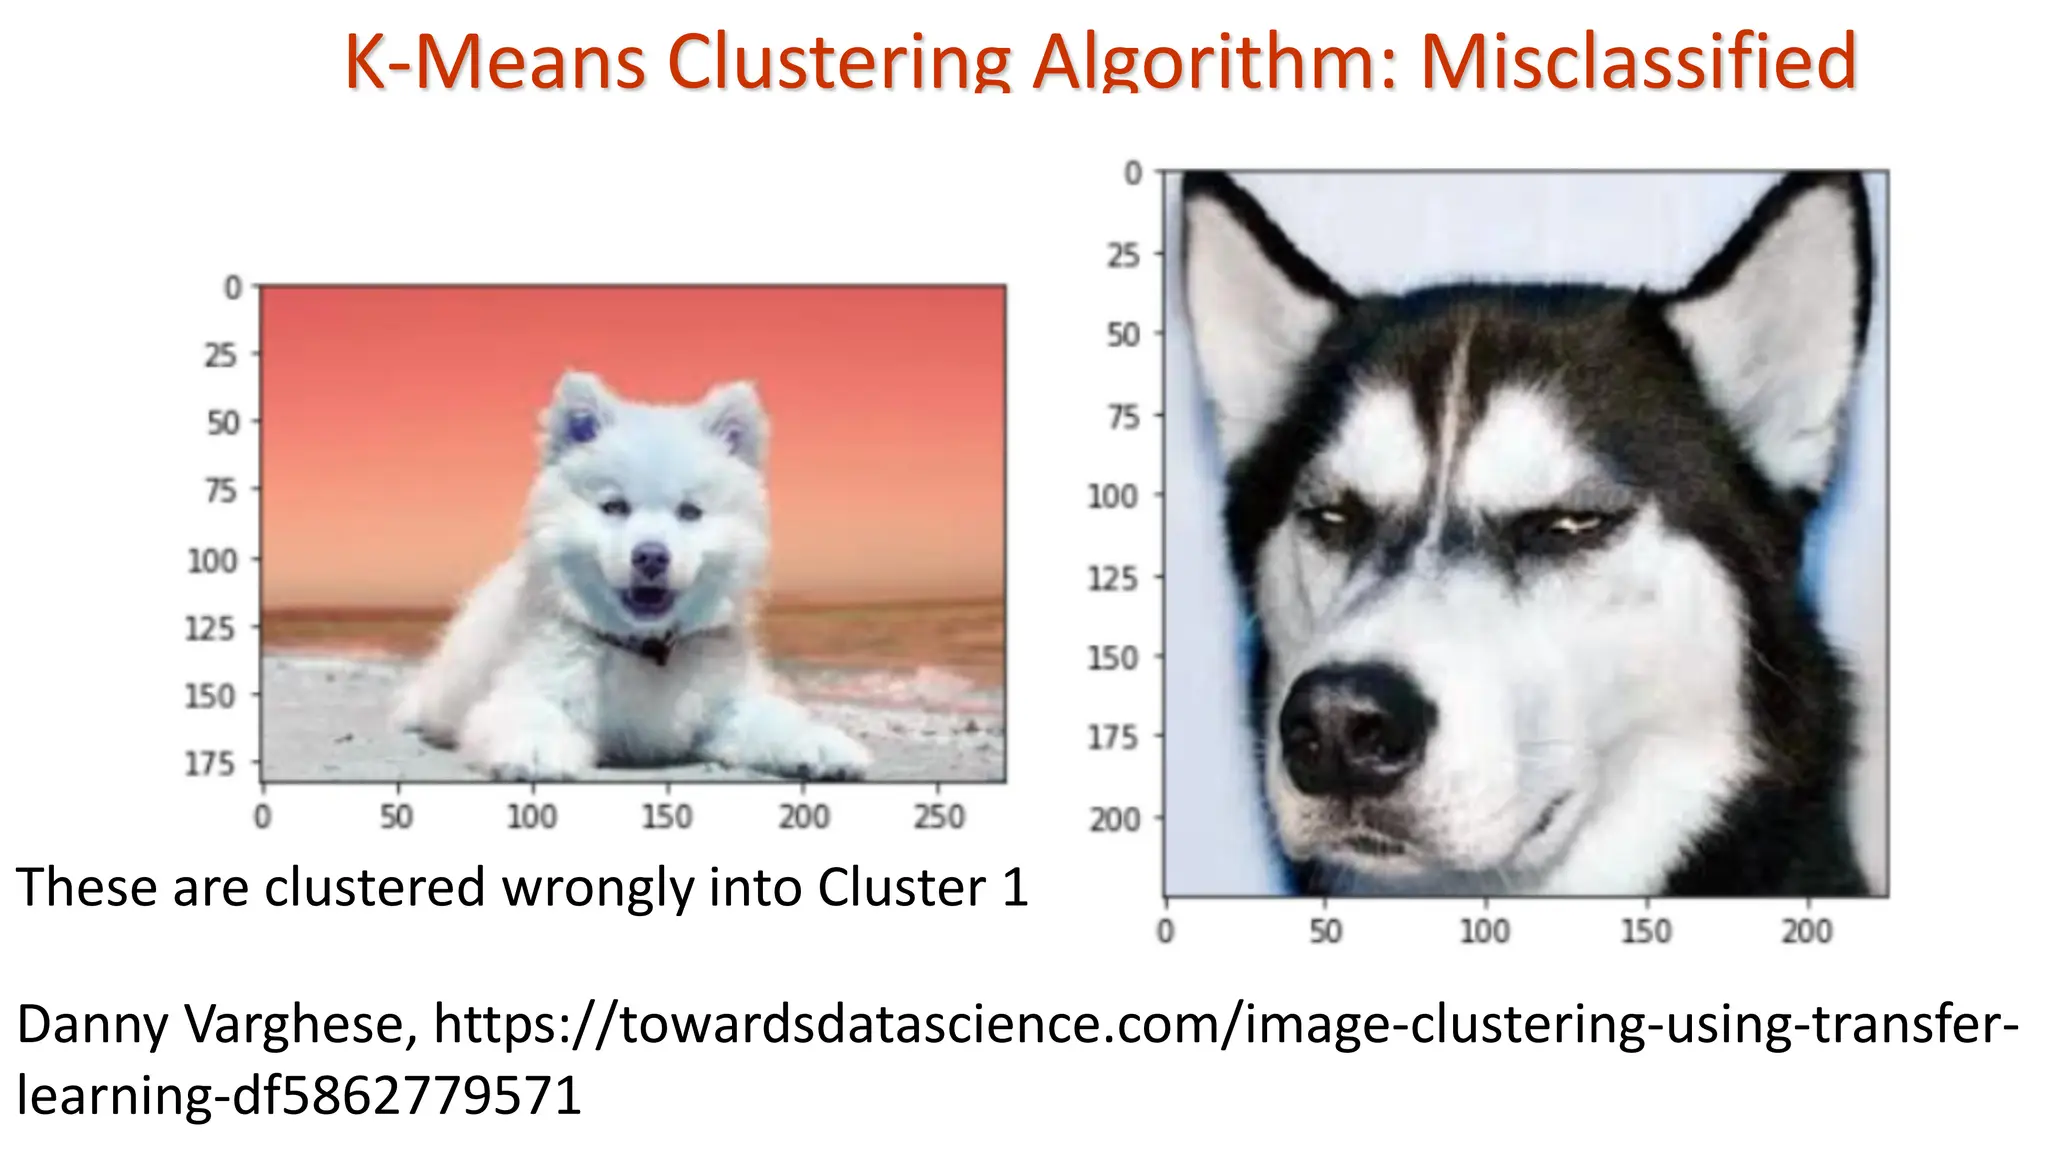
K-Means Clustering Algorithm:Misclassified These are clustered wrongly into Cluster 1 Danny Varghese, https://towardsdatascience.com/image-clustering-using-transfer- learning-df5862779571
55.
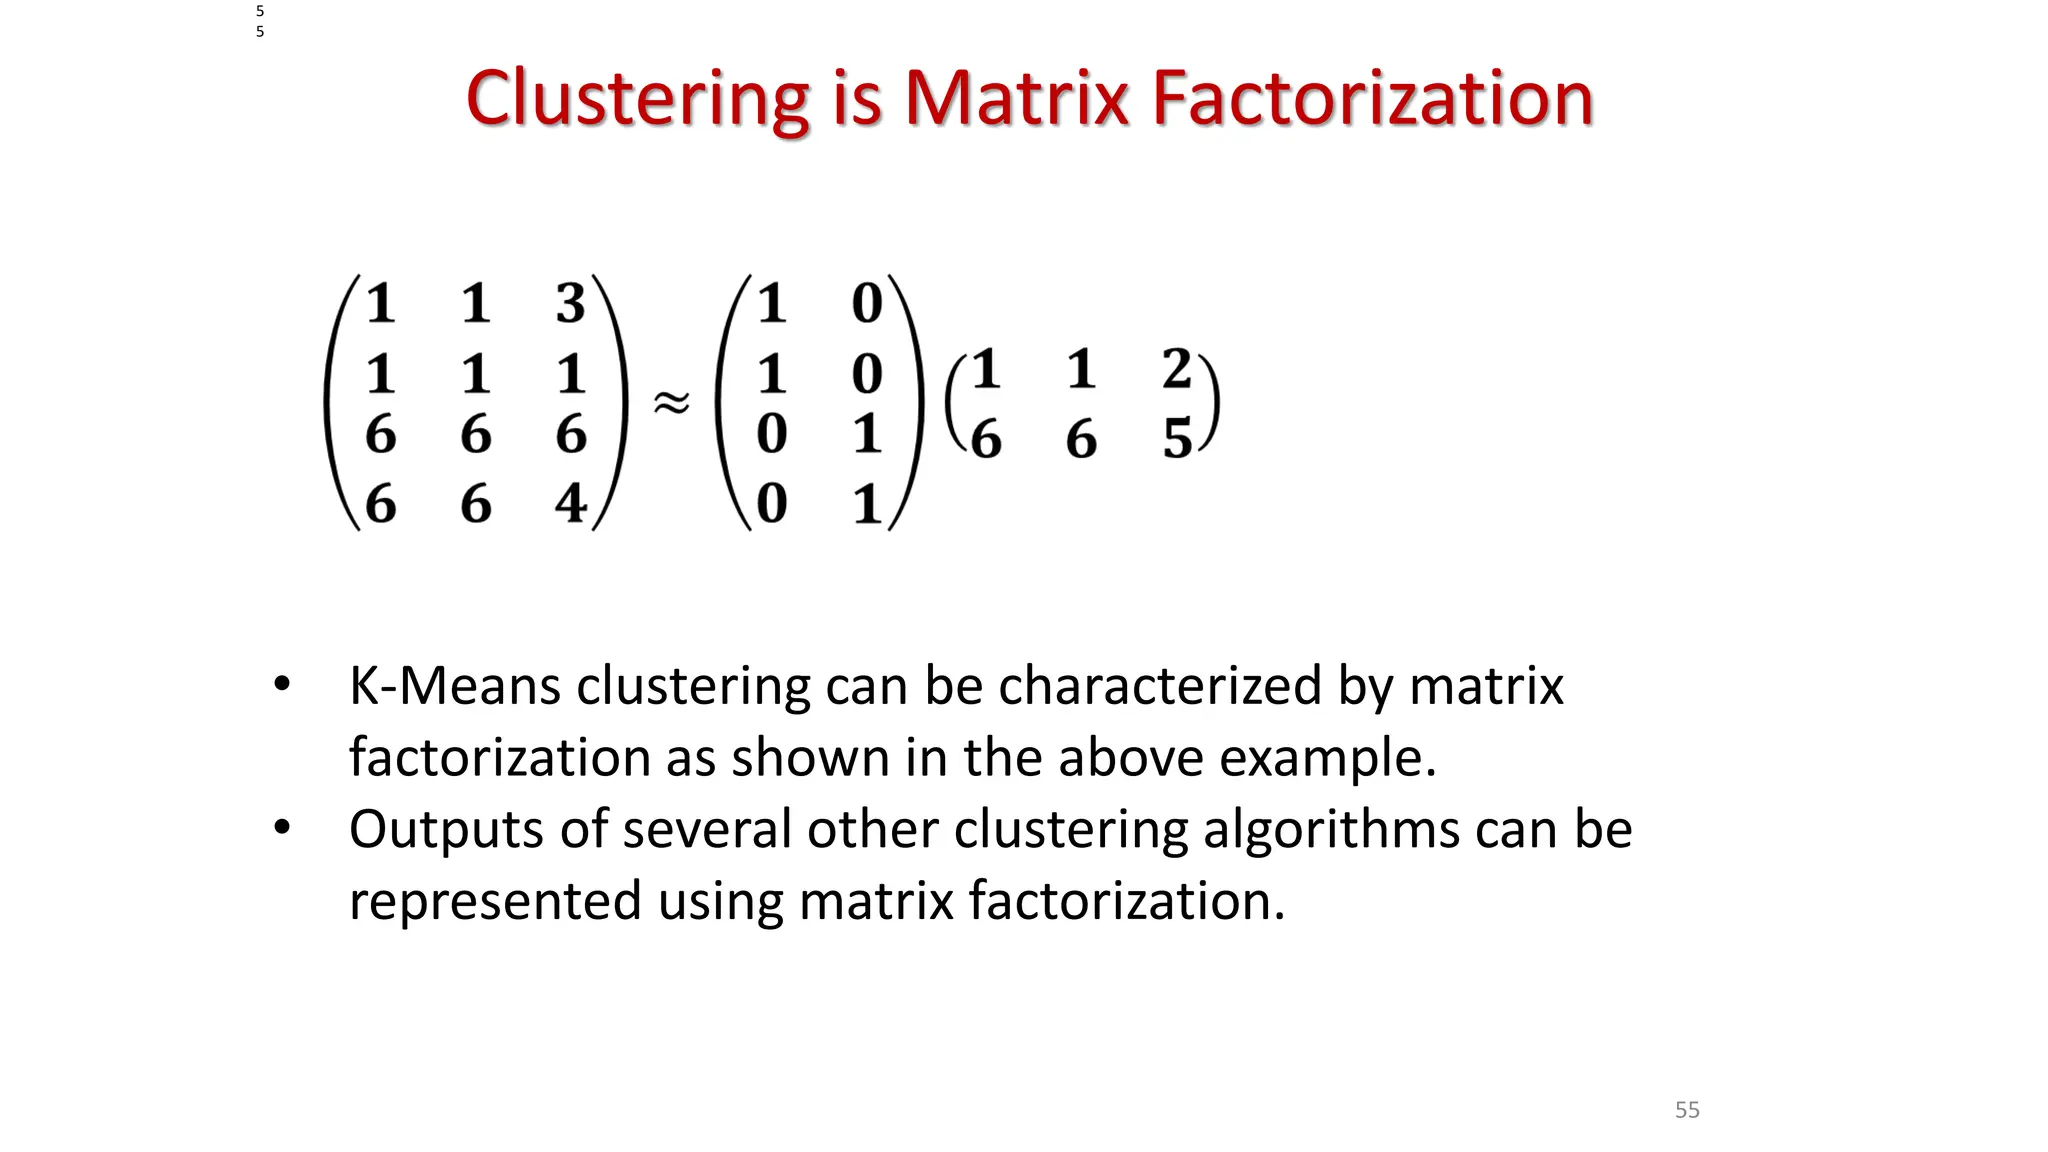
55 Clustering is MatrixFactorization 5 5 • K-Means clustering can be characterized by matrix factorization as shown in the above example. • Outputs of several other clustering algorithms can be represented using matrix factorization.
56.
Neighborhood Based Learning:Regression • The data is generated using y = 1 + x + x2 • Suppose we select a random point in the interval [0,1]; say 0.16 • We take 3 NNs of 0.16 among the x values; they are 0.2, 0.1, and 0.3, the respective values of y are 1.24, 1.11, 1.39. The average value, ො 𝑦 is approximately 1.25 ( this is the predicted value of y for 0.16, even 0.17 and many more.) • The target value is 1.1856; there is an error • If we take the value of K=5, the NNs are 0.2, 0.1, 0.3, 0, 0.4 with y values 1.24, 1.11, 1.39, 1, 1.56 respectively. The average value of y is 1.26 • The target value is 1.1856
57.
Weighted Neighborhood BasedLearning: Regression • The data is generated using y = 1 + x + x2 • Suppose we select a random point in the interval [0,1]; say 0.16 • We take 3 NNs of 0.16 among the x values; they are 0.2, 0.1, and 0.3, the respective values of y are 1.24, 1.11, 1.39. The weighted average value, ො 𝑦 is approximately 1.22 ( 1.24 0.04 + 1.11 0.06 + 1.39 0.14 ) / 48.8 • The target value is 1.1856; there is an error • Nearer neighbours contribute more and farther neighbours less. • In general, 𝑊𝑖 = 𝑑𝑚𝑎𝑥 − 𝑑𝑖 𝑑𝑚𝑎𝑥 − 𝑑𝑚𝑖𝑛 • 𝑊1 = 1 and 𝑊𝑘 = 0 for kNNC


![Representation using PCs Variance of each component: [0.52787257 0.47212743] Total Variance Explained: 100.0](https://image.slidesharecdn.com/chapter1-250318235805-cb164d1b/75/Chapter1MACHINE-LEARNING-THEORY-AND-PRACTICES-pdf-34-2048.jpg)
![Variance of each component: [0.72770452 0.23030523] Total Variance Explained: 95.8](https://image.slidesharecdn.com/chapter1-250318235805-cb164d1b/75/Chapter1MACHINE-LEARNING-THEORY-AND-PRACTICES-pdf-39-2048.jpg)
![Neighborhood Based Learning: Regression • The data is generated using y = 1 + x + x2 • Suppose we select a random point in the interval [0,1]; say 0.16 • We take 3 NNs of 0.16 among the x values; they are 0.2, 0.1, and 0.3, the respective values of y are 1.24, 1.11, 1.39. The average value, ො 𝑦 is approximately 1.25 ( this is the predicted value of y for 0.16, even 0.17 and many more.) • The target value is 1.1856; there is an error • If we take the value of K=5, the NNs are 0.2, 0.1, 0.3, 0, 0.4 with y values 1.24, 1.11, 1.39, 1, 1.56 respectively. The average value of y is 1.26 • The target value is 1.1856](https://image.slidesharecdn.com/chapter1-250318235805-cb164d1b/75/Chapter1MACHINE-LEARNING-THEORY-AND-PRACTICES-pdf-56-2048.jpg)
![Weighted Neighborhood Based Learning: Regression • The data is generated using y = 1 + x + x2 • Suppose we select a random point in the interval [0,1]; say 0.16 • We take 3 NNs of 0.16 among the x values; they are 0.2, 0.1, and 0.3, the respective values of y are 1.24, 1.11, 1.39. The weighted average value, ො 𝑦 is approximately 1.22 ( 1.24 0.04 + 1.11 0.06 + 1.39 0.14 ) / 48.8 • The target value is 1.1856; there is an error • Nearer neighbours contribute more and farther neighbours less. • In general, 𝑊𝑖 = 𝑑𝑚𝑎𝑥 − 𝑑𝑖 𝑑𝑚𝑎𝑥 − 𝑑𝑚𝑖𝑛 • 𝑊1 = 1 and 𝑊𝑘 = 0 for kNNC](https://image.slidesharecdn.com/chapter1-250318235805-cb164d1b/75/Chapter1MACHINE-LEARNING-THEORY-AND-PRACTICES-pdf-57-2048.jpg)