This document introduces Java profiling and the YourKit Java Profiler tool. It discusses how profiling can be used to measure and locate performance bottlenecks, memory leaks, and unnecessary memory allocation. The YourKit Java Profiler is presented as a commercial tool that offers on-demand CPU, memory, and concurrency profiling along with IDE integration and support for various Java versions and operating systems. A demonstration of the tool is provided.
An introduction to Java profiling presented at Developer's Day 2008, outlining the agenda of the presentation.
Profiling is defined as a development tool for dynamic performance analysis, aiding in problem analysis, design, development, testing, and deployment.
The primary goals of profiling are to measure performance bottlenecks, identify memory leaks, and improve software performance despite challenges like overhead and result interpretation.
Introduction to YourKit Java Profiler, a commercial tool with free trials, widely used across major companies and open-source projects.
Detailed profiling methods provided by YourKit including CPU profiling, memory profiling, and thread profiling, each with specific features and functionalities.
A demonstration segment of the YourKit Java Profiler.
Further information and resources related to Java profiling tools, including links to YourKit, Jprobe, JProfiler, and various open-source profilers.
Thanking the audience at the end of the presentation.
An Introduction toJava Profiling Developer's Day 2008 Patrick Schlebusch
2.
Overview An Introductionto Java Profiling An Introduction to Profiling YourKit Java Profiler Demonstration Additional information
3.
What is Profiling?An Introduction to Profiling A development tool Dynamic performance analysis at runtime Implicit: Performance optimization based on analysis results
4.
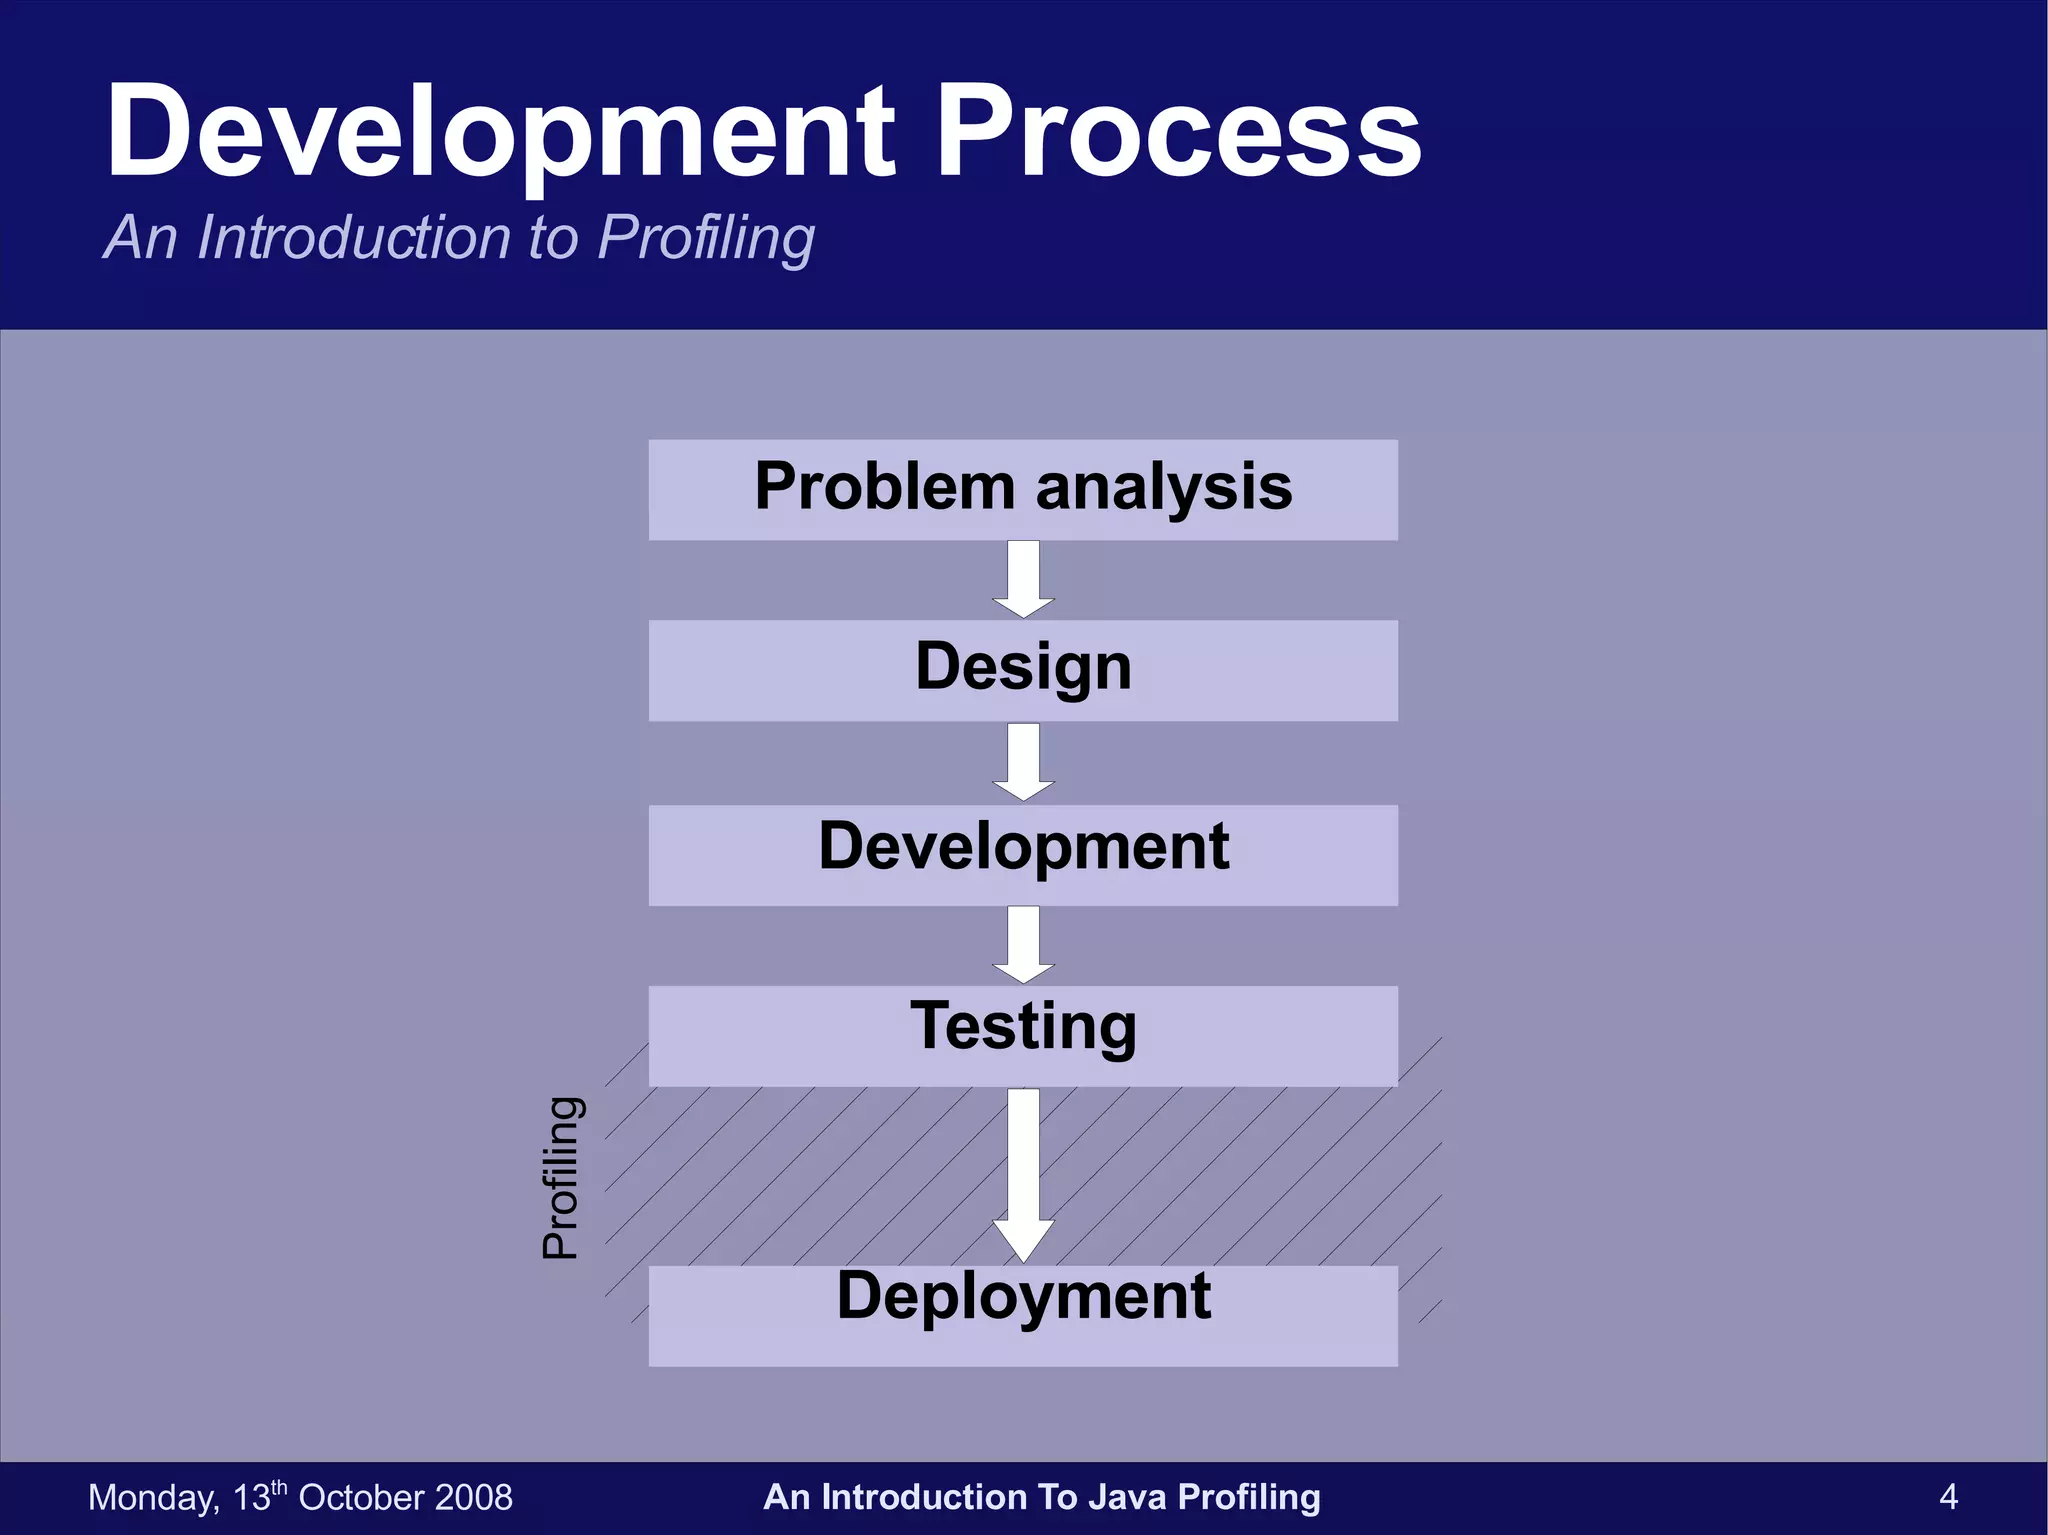
Development Process AnIntroduction to Profiling Problem analysis Design Development Testing Deployment Profiling
5.
Goals An Introductionto Profiling Measuring and locating performance „bottlenecks“ Time-expensive functions or code parts Memory leaks and unnecessary memory allocation Deadlocks Useful interpretation of analysis results Software performance improvements Provide a detailed view on runtime behaviour
6.
Problems An Introductionto Profiling Profiling produces overhead Interpretation of results can be difficult Identifying the „crucial“ parts of the software Recognizing potential for improvements
7.
YourKit Java ProfileryourKit Java Profiler Commercial Java Profiling Tool Free tryout and Open Source licenses are available Used by Open Source projects such as various Apache projects, Azureus (many more..) Also used by Sun Microsystems, Google, SAP and at i5
8.
Features yourKit JavaProfiler On-Demand Profiling CPU, Memory and Concurrency profiling methods IDE Integration Profiling API Support of many different Java versions and OSs
9.
CPU Profiling yourKitJava Profiler Sampling Low overhead Useful to find slow parts of the code Tracing Significant overhead Exact CPU time and method invokation counts CPU Usage graphs
10.
Memory Profiling yourKitJava Profiler Memory telemetry graphs Heap / Non-Heap memory Class loading statistics Object count and size of classes Explicit garbage collection Object allocation recording
11.
Thread Profiling yourKitJava Profiler Deadlock detection Synchronization analysis For which synchronized blocks or methods are Threads waiting? How long?
Additional Information YourKitJava Profiler www.yourkit.com Jprobe www.quest.com/jprobe/ JProfiler www.ej-technologies.com/products/jprofiler/ Various Open Source Profilers java-source.net/open-source/profilers