
Statistical Arbitrage Through Cointegrated Stocks (Part 7): Scoring System 2
This article describes two additional scoring criteria used for selection of baskets of stocks to be traded in mean-reversion strategies, more specifically, in cointegration based statistical arbitrage. It complements a previous article where liquidity and strength of the cointegration vectors were presented, along with the strategic criteria of timeframe and lookback period, by including the stability of the cointegration vectors and the time to mean reversion (half-time). The article includes the commented results of a backtest with the new filters applied and the files required for its reproduction are also provided.

Circle Search Algorithm (CSA)
The article presents a new metaheuristic optimization Circle Search Algorithm (CSA) based on the geometric properties of a circle. The algorithm uses the principle of moving points along tangents to find the optimal solution, combining the phases of global exploration and local exploitation.

MetaTrader 5 Machine Learning Blueprint (Part 5): Sequential Bootstrapping—Debiasing Labels, Improving Returns
Sequential bootstrapping reshapes bootstrap sampling for financial machine learning by actively avoiding temporally overlapping labels, producing more independent training samples, sharper uncertainty estimates, and more robust trading models. This practical guide explains the intuition, shows the algorithm step‑by‑step, provides optimized code patterns for large datasets, and demonstrates measurable performance gains through simulations and real backtests.

Market Simulation (Part 05): Creating the C_Orders Class (II)
In this article, I will explain how Chart Trade, together with the Expert Advisor, will process a request to close all of the users' open positions. This may sound simple, but there are a few complications that you need to know how to manage.
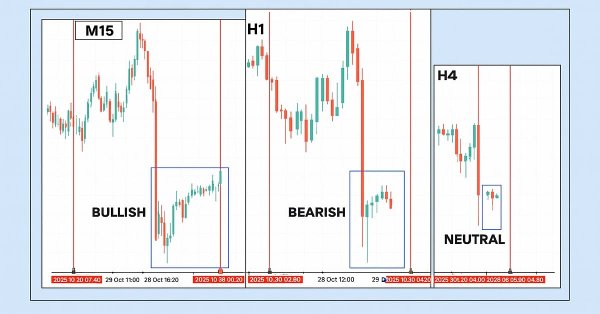
Price Action Analysis Toolkit Development (Part 48): Multi-Timeframe Harmony Index with Weighted Bias Dashboard
This article introduces the “Multi-Timeframe Harmony Index”—an advanced Expert Advisor for MetaTrader 5 that calculates a weighted bias from multiple timeframes, smooths the readings using EMA, and displays the results in a clean chart panel dashboard. It includes customizable alerts and automatic buy/sell signal plotting when strong bias thresholds are crossed. Suitable for traders who use multi-timeframe analysis to align entries with overall market structure.
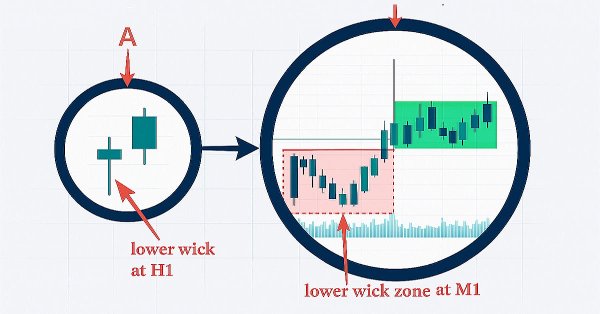
From Novice to Expert: Revealing the Candlestick Shadows (Wicks)
In this discussion, we take a step forward to uncover the underlying price action hidden within candlestick wicks. By integrating a wick visualization feature into the Market Periods Synchronizer, we enhance the tool with greater analytical depth and interactivity. This upgraded system allows traders to visualize higher-timeframe price rejections directly on lower-timeframe charts, revealing detailed structures that were once concealed within the shadows.
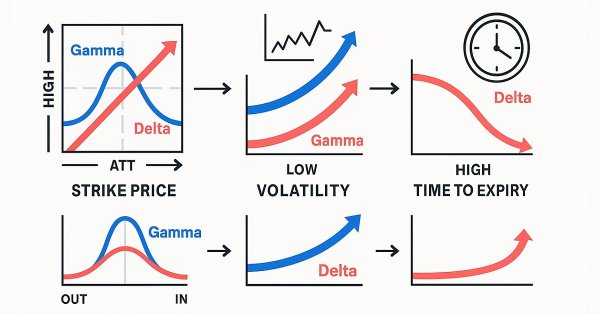
Black-Scholes Greeks: Gamma and Delta
Gamma and Delta measure how an option’s value reacts to changes in the underlying asset’s price. Delta represents the rate of change of the option’s price relative to the underlying, while Gamma measures how Delta itself changes as price moves. Together, they describe an option’s directional sensitivity and convexity—critical for dynamic hedging and volatility-based trading strategies.

Machine Learning Blueprint (Part 4): The Hidden Flaw in Your Financial ML Pipeline — Label Concurrency
Discover how to fix a critical flaw in financial machine learning that causes overfit models and poor live performance—label concurrency. When using the triple-barrier method, your training labels overlap in time, violating the core IID assumption of most ML algorithms. This article provides a hands-on solution through sample weighting. You will learn how to quantify temporal overlap between trading signals, calculate sample weights that reflect each observation's unique information, and implement these weights in scikit-learn to build more robust classifiers. Learning these essential techniques will make your trading models more robust, reliable and profitable.
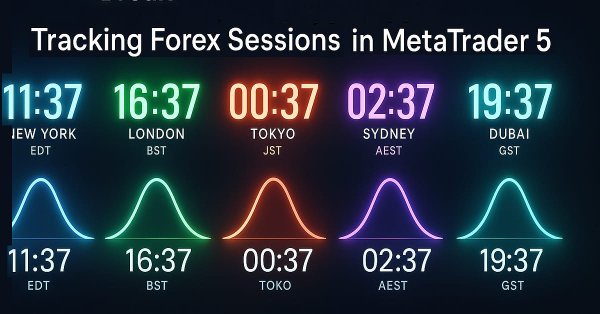
Price Action Analysis Toolkit Development (Part 47): Tracking Forex Sessions and Breakouts in MetaTrader 5
Global market sessions shape the rhythm of the trading day, and understanding their overlap is vital to timing entries and exits. In this article, we’ll build an interactive trading sessions EA that brings those global hours to life directly on your chart. The EA automatically plots color‑coded rectangles for the Asia, Tokyo, London, and New York sessions, updating in real time as each market opens or closes. It features on‑chart toggle buttons, a dynamic information panel, and a scrolling ticker headline that streams live status and breakout messages. Tested on different brokers, this EA combines precision with style—helping traders see volatility transitions, identify cross‑session breakouts, and stay visually connected to the global market’s pulse.

Statistical Arbitrage Through Cointegrated Stocks (Part 6): Scoring System
In this article, we propose a scoring system for mean-reversion strategies based on statistical arbitrage of cointegrated stocks. The article suggests criteria that go from liquidity and transaction costs to the number of cointegration ranks and time to mean-reversion, while taking into account the strategic criteria of data frequency (timeframe) and the lookback period for cointegration tests, which are evaluated before the score ranking properly. The files required for the reproduction of the backtest are provided, and their results are commented on as well.
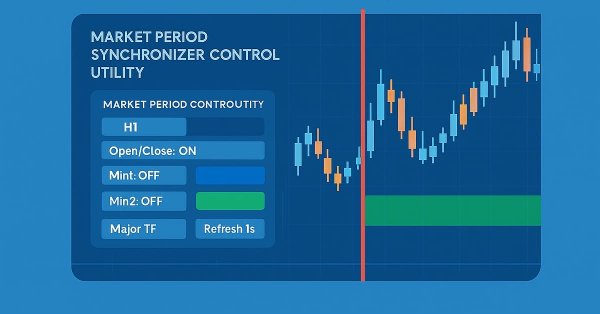
From Novice to Expert: Parameter Control Utility
Imagine transforming the traditional EA or indicator input properties into a real-time, on-chart control interface. This discussion builds upon our foundational work in the Market Period Synchronizer indicator, marking a significant evolution in how we visualize and manage higher-timeframe (HTF) market structures. Here, we turn that concept into a fully interactive utility—a dashboard that brings dynamic control and enhanced multi-period price action visualization directly onto the chart. Join us as we explore how this innovation reshapes the way traders interact with their tools.

Overcoming The Limitation of Machine Learning (Part 6): Effective Memory Cross Validation
In this discussion, we contrast the classical approach to time series cross-validation with modern alternatives that challenge its core assumptions. We expose key blind spots in the traditional method—especially its failure to account for evolving market conditions. To address these gaps, we introduce Effective Memory Cross-Validation (EMCV), a domain-aware approach that questions the long-held belief that more historical data always improves performance.

Market Simulation (Part 04): Creating the C_Orders Class (I)
In this article, we will start creating the C_Orders class to be able to send orders to the trading server. We'll do this little by little, as our goal is to explain in detail how this will happen through the messaging system.

Royal Flush Optimization (RFO)
The original Royal Flush Optimization algorithm offers a new approach to solving optimization problems, replacing the classic binary coding of genetic algorithms with a sector-based approach inspired by poker principles. RFO demonstrates how simplifying basic principles can lead to an efficient and practical optimization method. The article presents a detailed analysis of the algorithm and test results.
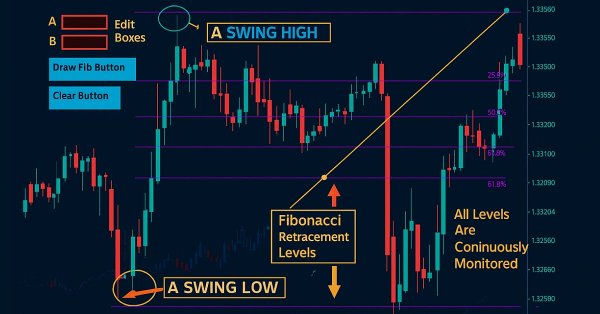
Price Action Analysis Toolkit Development (Part 46): Designing an Interactive Fibonacci Retracement EA with Smart Visualization in MQL5
Fibonacci tools are among the most popular instruments used by technical analysts. In this article, we’ll build an Interactive Fibonacci EA that draws retracement and extension levels that react dynamically to price movement, delivering real‑time alerts, stylish lines, and a scrolling news‑style headline. Another key advantage of this EA is flexibility; you can manually type the high (A) and low (B) swing values directly on the chart, giving you exact control over the market range you want to analyze.

Dialectic Search (DA)
The article introduces the dialectical algorithm (DA), a new global optimization method inspired by the philosophical concept of dialectics. The algorithm exploits a unique division of the population into speculative and practical thinkers. Testing shows impressive performance of up to 98% on low-dimensional problems and overall efficiency of 57.95%. The article explains these metrics and presents a detailed description of the algorithm and the results of experiments on different types of functions.

Building a Trading System (Part 5): Managing Gains Through Structured Trade Exits
For many traders, it's a familiar pain point: watching a trade come within a whisker of your profit target, only to reverse and hit your stop-loss. Or worse, seeing a trailing stop close you out at breakeven before the market surges toward your original target. This article focuses on using multiple entries at different Reward-to-Risk Ratios to systematically secure gains and reduce overall risk exposure.

Biological neuron for forecasting financial time series
We will build a biologically correct system of neurons for time series forecasting. The introduction of a plasma-like environment into the neural network architecture creates a kind of "collective intelligence," where each neuron influences the system's operation not only through direct connections, but also through long-range electromagnetic interactions. Let's see how the neural brain modeling system will perform in the market.
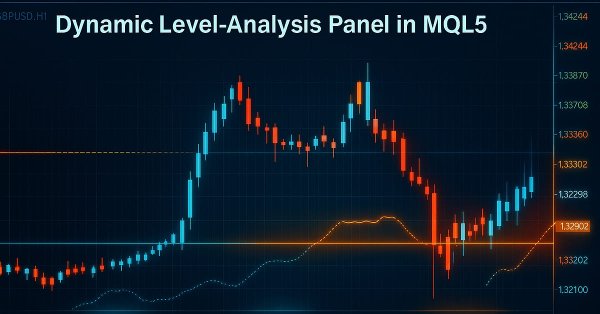
Price Action Analysis Toolkit Development (Part 45): Creating a Dynamic Level-Analysis Panel in MQL5
In this article, we explore a powerful MQL5 tool that let's you test any price level you desire with just one click. Simply enter your chosen level and press analyze, the EA instantly scans historical data, highlights every touch and breakout on the chart, and displays statistics in a clean, organized dashboard. You'll see exactly how often price respected or broke through your level, and whether it behaved more like support or resistance. Continue reading to explore the detailed procedure.

Creating volatility forecast indicator using Python
In this article, we will forecast future extreme volatility using binary classification. Besides, we will develop an extreme volatility forecast indicator using machine learning.
1 2 →