Articles on the MQL5 programming and use of technical indicators
Price Action Analysis Toolkit Development (Part 47): Tracking Forex Sessions and Breakouts in MetaTrader 5
Global market sessions shape the rhythm of the trading day, and understanding their overlap is vital to timing entries and exits. In this article, we’ll build an interactive trading sessions EA that brings those global hours to life directly on your chart. The EA automatically plots color‑coded rectangles for the Asia, Tokyo, London, and New York sessions, updating in real time as each market opens or closes. It features on‑chart toggle buttons, a dynamic information panel, and a scrolling ticker headline that streams live status and breakout messages. Tested on different brokers, this EA combines precision with style—helping traders see volatility transitions, identify cross‑session breakouts, and stay visually connected to the global market’s pulse.

From Novice to Expert: Parameter Control Utility
Imagine transforming the traditional EA or indicator input properties into a real-time, on-chart control interface. This discussion builds upon our foundational work in the Market Period Synchronizer indicator, marking a significant evolution in how we visualize and manage higher-timeframe (HTF) market structures. Here, we turn that concept into a fully interactive utility—a dashboard that brings dynamic control and enhanced multi-period price action visualization directly onto the chart. Join us as we explore how this innovation reshapes the way traders interact with their tools.

Mastering Quick Trades: Overcoming Execution Paralysis
The UT BOT ATR Trailing Indicator is a personal and customizable indicator that is very effective for traders who like to make quick decisions and make money from differences in price referred to as short-term trading (scalpers) and also proves to be vital and very effective for long-term traders (positional traders).

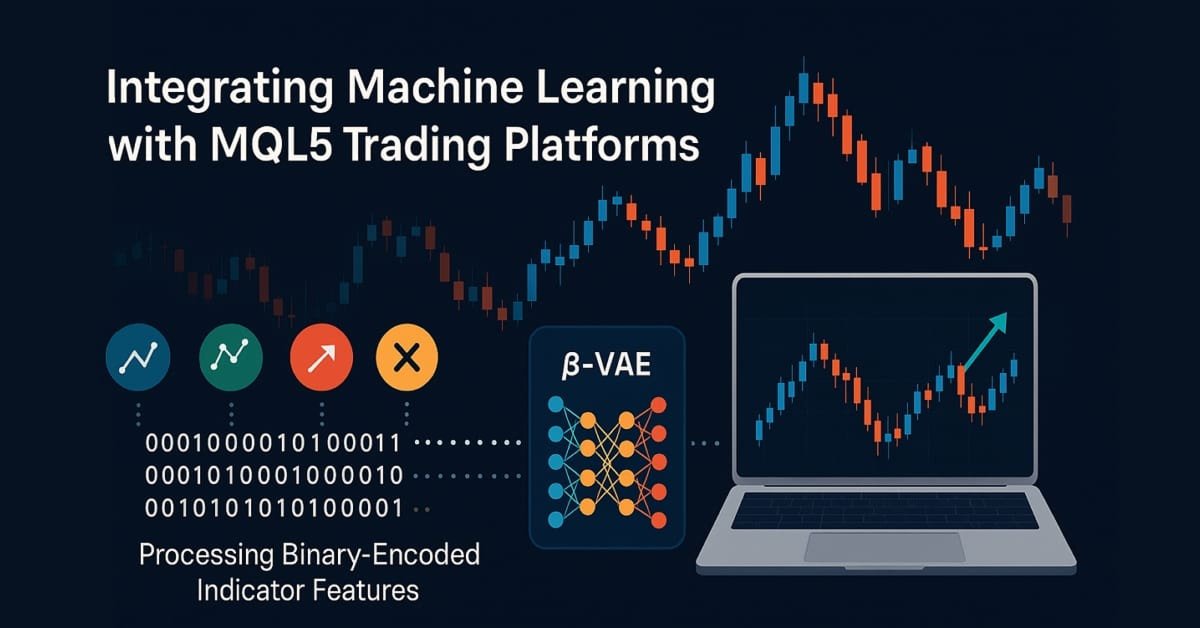
MQL5 Wizard Techniques you should know (Part 85): Using Patterns of Stochastic-Oscillator and the FrAMA with Beta VAE Inference Learning
This piece follows up ‘Part-84’, where we introduced the pairing of Stochastic and the Fractal Adaptive Moving Average. We now shift focus to Inference Learning, where we look to see if laggard patterns in the last article could have their fortunes turned around. The Stochastic and FrAMA are a momentum-trend complimentary pairing. For our inference learning, we are revisiting the Beta algorithm of a Variational Auto Encoder. We also, as always, do the implementation of a custom signal class designed for integration with the MQL5 Wizard.

Price Action Analysis Toolkit Development (Part 46): Designing an Interactive Fibonacci Retracement EA with Smart Visualization in MQL5
Fibonacci tools are among the most popular instruments used by technical analysts. In this article, we’ll build an Interactive Fibonacci EA that draws retracement and extension levels that react dynamically to price movement, delivering real‑time alerts, stylish lines, and a scrolling news‑style headline. Another key advantage of this EA is flexibility; you can manually type the high (A) and low (B) swing values directly on the chart, giving you exact control over the market range you want to analyze.

Introduction to MQL5 (Part 24): Building an EA that Trades with Chart Objects
This article teaches you how to create an Expert Advisor that detects support and resistance zones drawn on the chart and executes trades automatically based on them.

MQL5 Wizard Techniques you should know (Part 84): Using Patterns of Stochastic Oscillator and the FrAMA - Conclusion
The Stochastic Oscillator and the Fractal Adaptive Moving Average are an indicator pairing that could be used for their ability to compliment each other within an MQL5 Expert Advisor. We introduced this pairing in the last article, and now look to wrap up by considering its 5 last signal patterns. In exploring this, as always, we use the MQL5 wizard to build and test out their potential.

MQL5 Wizard Techniques you should know (Part 83): Using Patterns of Stochastic Oscillator and the FrAMA — Behavioral Archetypes
The Stochastic Oscillator and the Fractal Adaptive Moving Average are another indicator pairing that could be used for their ability to compliment each other within an MQL5 Expert Advisor. We look at the Stochastic for its ability to pinpoint momentum shifts, while the FrAMA is used to provide confirmation of the prevailing trends. In exploring this indicator pairing, as always, we use the MQL5 wizard to build and test out their potential.

Introduction to MQL5 (Part 22): Building an Expert Advisor for the 5-0 Harmonic Pattern
This article explains how to detect and trade the 5-0 harmonic pattern in MQL5, validate it using Fibonacci levels, and display it on the chart.

MQL5 Wizard Techniques you should know (Part 82): Using Patterns of TRIX and the WPR with DQN Reinforcement Learning
In the last article, we examined the pairing of Ichimoku and the ADX under an Inference Learning framework. For this piece we revisit, Reinforcement Learning when used with an indicator pairing we considered last in ‘Part 68’. The TRIX and Williams Percent Range. Our algorithm for this review will be the Quantile Regression DQN. As usual, we present this as a custom signal class designed for implementation with the MQL5 Wizard.
MQL5 Wizard Techniques you should know (Part 81): Using Patterns of Ichimoku and the ADX-Wilder with Beta VAE Inference Learning
This piece follows up ‘Part-80’, where we examined the pairing of Ichimoku and the ADX under a Reinforcement Learning framework. We now shift focus to Inference Learning. Ichimoku and ADX are complimentary as already covered, however we are going to revisit the conclusions of the last article related to pipeline use. For our inference learning, we are using the Beta algorithm of a Variational Auto Encoder. We also stick with the implementation of a custom signal class designed for integration with the MQL5 Wizard.

Developing Advanced ICT Trading Systems: Implementing Signals in the Order Blocks Indicator
In this article, you will learn how to develop an Order Blocks indicator based on order book volume (market depth) and optimize it using buffers to improve accuracy. This concludes the current stage of the project and prepares for the next phase, which will include the implementation of a risk management class and a trading bot that uses signals generated by the indicator.
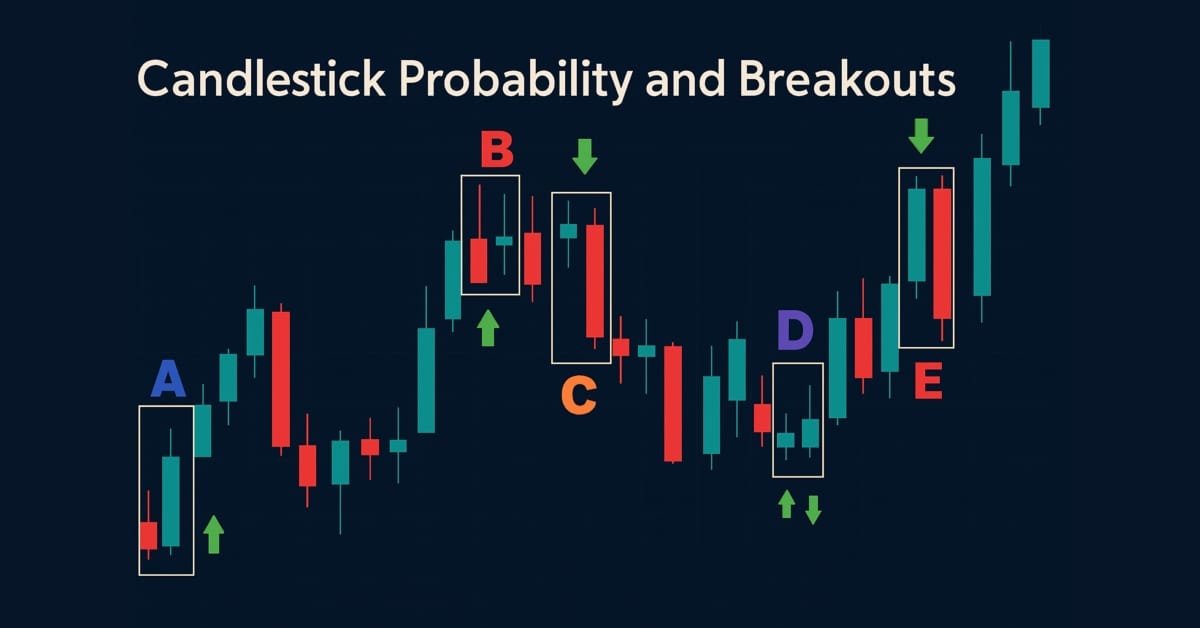
Price Action Analysis Toolkit Development (Part 43): Candlestick Probability and Breakouts
Enhance your market analysis with the MQL5-native Candlestick Probability EA, a lightweight tool that transforms raw price bars into real-time, instrument-specific probability insights. It classifies Pinbars, Engulfing, and Doji patterns at bar close, uses ATR-aware filtering, and optional breakout confirmation. The EA calculates raw and volume-weighted follow-through percentages, helping you understand each pattern's typical outcome on specific symbols and timeframes. On-chart markers, a compact dashboard, and interactive toggles allow easy validation and focus. Export detailed CSV logs for offline testing. Use it to develop probability profiles, optimize strategies, and turn pattern recognition into a measurable edge.

Building a Professional Trading System with Heikin Ashi (Part 2): Developing an EA
This article explains how to develop a professional Heikin Ashi-based Expert Advisor (EA) in MQL5. You will learn how to set up input parameters, enumerations, indicators, global variables, and implement the core trading logic. You will also be able to run a backtest on gold to validate your work.
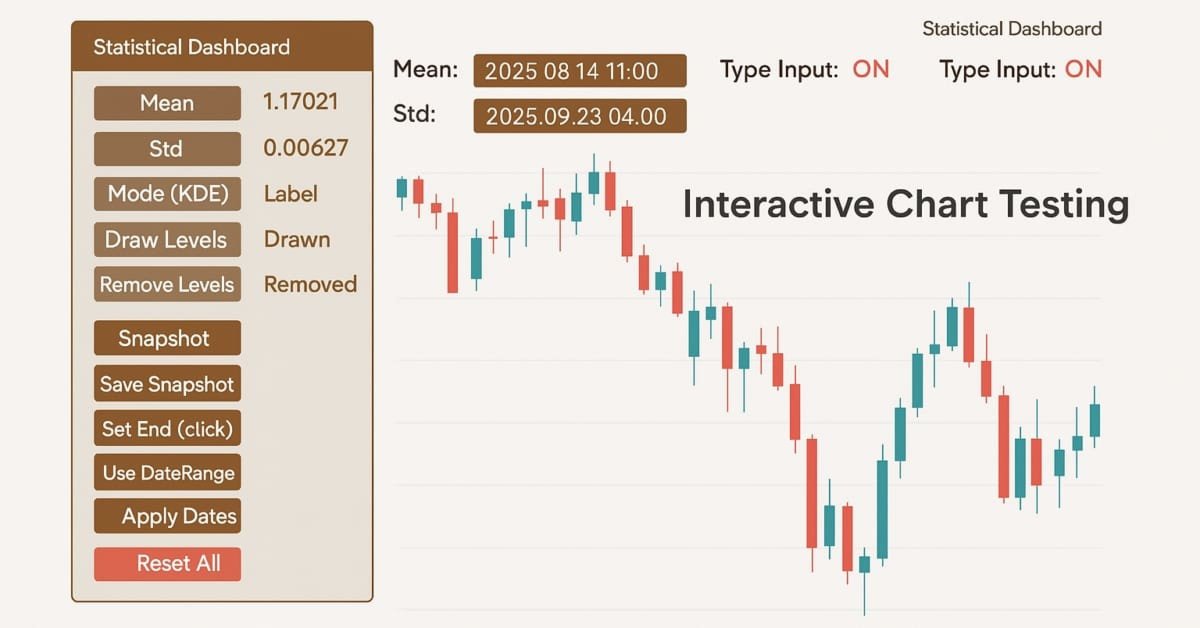
Price Action Analysis Toolkit Development (Part 42): Interactive Chart Testing with Button Logic and Statistical Levels
In a world where speed and precision matter, analysis tools need to be as smart as the markets we trade. This article presents an EA built on button logic—an interactive system that instantly transforms raw price data into meaningful statistical levels. With a single click, it calculates and displays mean, deviation, percentiles, and more, turning advanced analytics into clear on-chart signals. It highlights the zones where price is most likely to bounce, retrace, or break, making analysis both faster and more practical.

How to build and optimize a cycle-based trading system (Detrended Price Oscillator - DPO)
This article explains how to design and optimise a trading system using the Detrended Price Oscillator (DPO) in MQL5. It outlines the indicator's core logic, demonstrating how it identifies short-term cycles by filtering out long-term trends. Through a series of step-by-step examples and simple strategies, readers will learn how to code it, define entry and exit signals, and conduct backtesting. Finally, the article presents practical optimization methods to enhance performance and adapt the system to changing market conditions.

Automating The Market Sentiment Indicator
In this article, we automate a custom market sentiment indicator that classifies market conditions into bullish, bearish, risk-on, risk-off, and neutral. The Expert Advisor delivers real-time insights into prevailing sentiment while streamlining the analysis process for current market trends or direction.
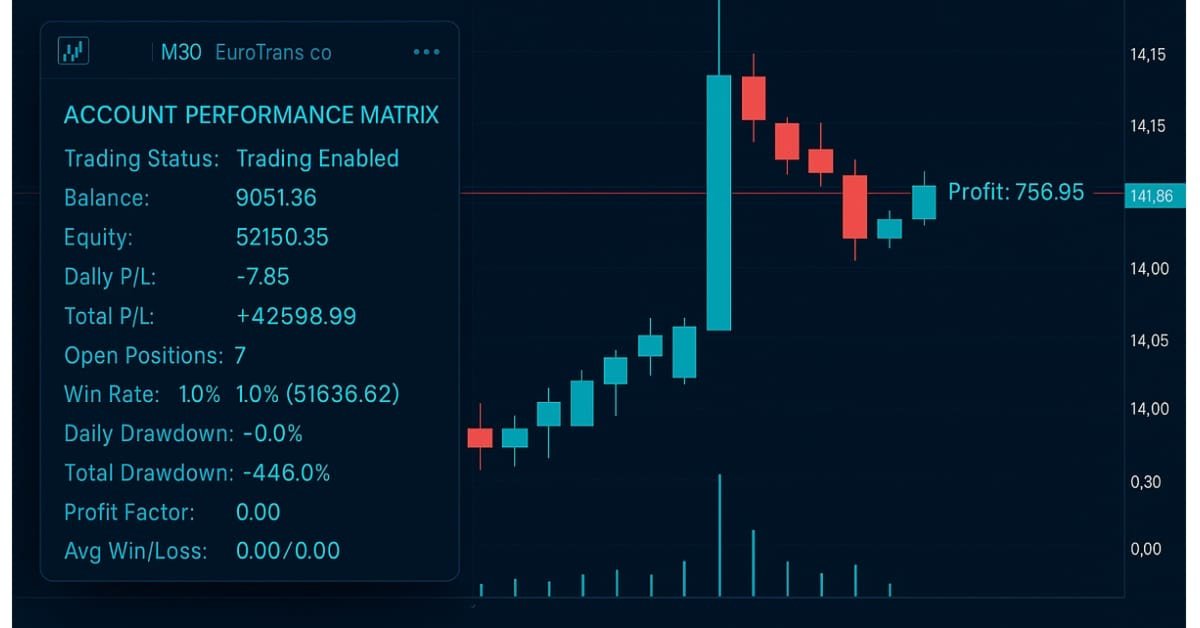
Developing A Custom Account Performace Matrix Indicator
This indicator acts as a discipline enforcer by tracking account equity, profit/loss, and drawdown in real-time while displaying a performance dashboard. It can help traders stay consistent, avoid overtrading, and comply with prop-firm challenge rules.

The Parafrac V2 Oscillator: Integrating Parabolic SAR with Average True Range
The Parafrac V2 Oscillator is an advanced technical analysis tool that integrates the Parabolic SAR with the Average True Range (ATR) to overcome limitations of its predecessor, which relied on fractals and was prone to signal spikes overshadowing previous and current signals. By leveraging ATR’s volatility measure, the version 2 offers a smoother, more reliable method for detecting trends, reversals, and divergences, helping traders reduce chart congestion and analysis paralysis.

Price Action Analysis Toolkit Development (Part 40): Market DNA Passport
This article explores the unique identity of each currency pair through the lens of its historical price action. Inspired by the concept of genetic DNA, which encodes the distinct blueprint of every living being, we apply a similar framework to the markets, treating price action as the “DNA” of each pair. By breaking down structural behaviors such as volatility, swings, retracements, spikes, and session characteristics, the tool reveals the underlying profile that distinguishes one pair from another. This approach provides more profound insight into market behavior and equips traders with a structured way to align strategies with the natural tendencies of each instrument.
1 2 →