Price Action Analysis Toolkit Development (Part 44): Building a VWMA Crossover Signal EA in MQL5
Introduction
Successful trading depends on the ability to separate meaningful price trends from background market noise. For decades, moving averages such as the Simple Moving Average (SMA) and Exponential Moving Average (EMA) have helped traders smooth volatility and clarify market direction. Yet, these traditional indicators overlook an essential component of price movement: trading volume, which often determines the true significance of a trend.
The evolution of the Volume-Weighted Moving Average (VWMA) has addressed this limitation by assigning greater importance to prices associated with higher trading activity. As a result, the VWMA delivers a clearer, more reliable indication of genuine market momentum and helps traders differentiate between strong, volume-backed moves and weak, low-participation fluctuations.
This article examines the practical application of VWMA crossovers in algorithmic trading. It will introduce the VWMA approach, explain its implementation in MQL5, present test results, and summarize key takeaways for both discretionary and systematic traders.
Building on these principles, the VWMA Crossover Expert Advisor features a VWMA crossover strategy combined with an intuitive on-chart dashboard. Designed for clarity and ease of use on any chart background, this tool automatically detects crossover events, highlights actionable signals, and delivers timely alerts—streamlining both trade execution and market monitoring.
The following table of contents outlines the sections of this article, each of which will be examined in detail below:
Understanding the VWMA Concept
Unlike many indicators tied to a known creator, the VWMA emerged organically from the technical analysis community as practitioners sought to weight averages by actual market volume. It builds on the long tradition of moving averages (dating back to early smoothing techniques in the 1900s) and borrows from institutional practices around VWAP, which has clearer historical attribution.
Below are some advantages of VWMA over SMA and EMA
| Advantage | Explanation |
|---|---|
| Volume Awareness | VWMA reflects where most trades occurred, not just where prices moved. |
| Superior Trend Confirmation | Confirms genuine reversals or continuations with volume support. |
| Adaptive Responsiveness | Reacts to high-volume market moves while filtering out low-volume noise. |
| Detects Institutional Strength | Useful for identifying smart money accumulation or distribution. |
VWMA Formula:
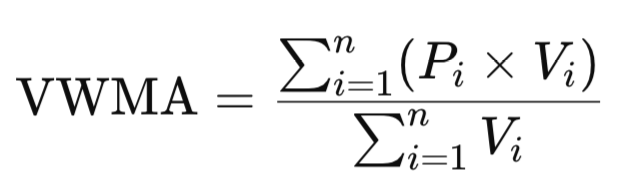
Where:
- 𝑃(𝑖) = price of candle i (usually the closing price)
- 𝑉(𝑖) = trading volume of candle i
- 𝑛 = number of periods (for example, 20)
Let’s say we want to calculate a 5-period VWMA using the following data:
| Candle | Close Price | Volume |
|---|---|---|
| 1 | 10 | 100 |
| 2 | 11 | 200 |
| 3 | 12 | 150 |
| 4 | 13 | 300 |
| 5 | 14 | 250 |
Now calculate:
- Multiply each price by its volume:
(10×100) + (11×200) + (12×150) + (13×300) + (14×250) = 1000 + 2200 + 1800 + 3900 + 3500 = 12,400
- Add up all the volumes:
100 + 200 + 150 + 300 + 250 = 1000
- Divide the total of (price × volume) by total volume:
VWMA = 12,400/1000 = 12.4
So, the 5-period VWMA = 12.4.
- When price > VWMA, the market is often in a volume-backed uptrend.
- When price < VWMA, it signals a volume-supported downtrend.
- Flat or sideways VWMA implies weak participation or range-bound trading.
Here is a concise code snippet demonstrating how to manually calculate the Volume-Weighted Moving Average (VWMA) within an MQL5 Expert Advisor or indicator:
double VWMA(const string symbol, ENUM_TIMEFRAMES timeframe, int period, int shift) { if(period <= 0) return EMPTY_VALUE; MqlRates rates[]; if(CopyRates(symbol, timeframe, shift, period, rates) != period) return EMPTY_VALUE; double sumPriceVolume = 0, sumVolume = 0; for(int i = 0; i < period; i++) { sumPriceVolume += rates[i].close * rates[i].tick_volume; sumVolume += rates[i].tick_volume; } return (sumVolume == 0) ? EMPTY_VALUE : sumPriceVolume / sumVolume; }
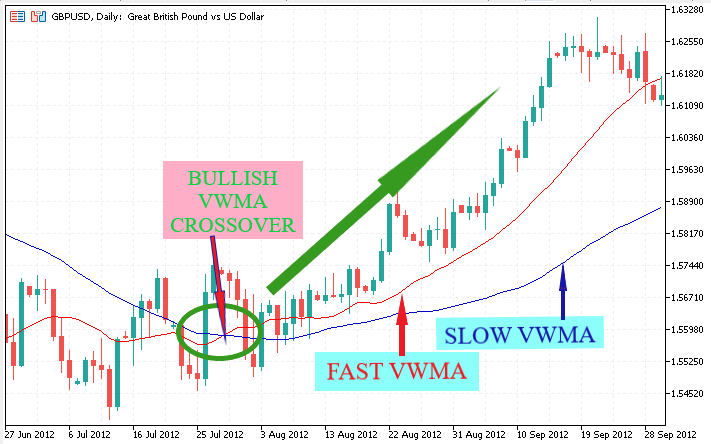
In this development, we utilize both a fast and a slow Volume-Weighted Moving Average (VWMA) to capture short-term and long-term market trends, respectively.
Fast VWMA
- Has a shorter period (e.g., 10 or 20 bars).
- Responds quickly to recent price and volume changes.
- More sensitive to short-term market moves.
- Useful for detecting short-term trends, momentum, or possible entry/exit points.
Slow VWMA
- Has a longer period (e.g., 50 or 60 bars).
- Responds more slowly to recent price and volume changes.
- Smooths out minor fluctuations and focuses on the bigger trend.
- Useful for identifying the general market direction or filtering out noise.
The logic for generating trading signals in this EA closely mirrors that of standard moving average (MA) crossover strategies, where buy or sell signals are produced when the fast VWMA crosses above or below the slow VWMA.
Bearish Signal

Sell signals are generated when the fast VWMA crosses below the slow VWMA.
Specifically, the conditions for a sell signal are
- On the previous bar, the fast VWMA was above the slow VWMA.
- On the current bar, the fast VWMA has moved below the slow VWMA.
This “downward crossover” indicates a potential shift from bullish to bearish momentum, suggesting it may be an opportune moment to sell.
bool bear = (f_prev > s_prev) && (f_now < s_now); if(bear /* && other filters */) { // Generate sell signal }
Bullish Signal
Buy (bullish) signals are generated when the fast VWMA crosses above the slow VWMA.
Specifically, the conditions for a buy signal are
- On the previous bar, the fast VWMA was below the slow VWMA.
- On the current bar, the fast VWMA has moved above the slow VWMA.
This “upward crossover” suggests a potential shift from bearish to bullish momentum, indicating it may be a favorable time to buy.
bool bull = (f_prev < s_prev) && (f_now > s_now); if(bull /* && other filters */) { // Generate buy signal }
Please note that the Volume-Weighted Moving Average (VWMA) is not available as a standard, built-in indicator in MetaTrader 5. To use VWMA in your EA or indicator, you need to implement the calculation manually using the formula shared earlier.
MQL5 Implementation
To get started with MQL5 development, first ensure you have MetaTrader 5 installed on your computer. MetaEditor, which is the official environment for writing and editing MQL5 code, comes bundled with every MetaTrader 5 installation, so you do not need to install it separately. Once MetaTrader 5 is ready, launch MetaEditor either from within the MetaTrader 5 terminal (by clicking the MetaEditor icon or pressing F4) or directly from your applications menu. In MetaEditor, go to “File” > “New”, select “Expert Advisor (template)”, and provide a name for your EA. After completing these steps, you will be ready to follow the detailed instructions I provide next to build your own MQL5 Expert Advisor from scratch.
1. File Header and Meta-information
//+------------------------------------------------------------------+ //| VWMA CROSSOVER EA.mq5| //| Copyright 2025, Christian Benjamin.| //| https://www.mql5.com/en/users/lynnchris| //+------------------------------------------------------------------+ #property copyright "https://www.mql5.com/en/users/lynnchris" #property version "1.0" #property strict
The very first lines of the source file carry three #property directives that describe the program to the MetaTrader 5 terminal. The copyright URL attributes authorship, while the version string supplies a formal release number that will later appear in the terminal’s Navigator. Finally, #property strict forces the compiler to apply the newest language rules. Coding under strict mode prevents many legacy shortcuts, catches ambiguous type conversions and therefore makes the codebase more robust.
2. External Inputs
input ENUM_TIMEFRAMES InpTimeframe = PERIOD_CURRENT; input uint FastPeriod = 20; input uint SlowPeriod = 60; input uint SR_LookBack = 50; input double SR_OffsetPips = 3.0; input bool Draw_Arrows = true; input bool Send_Alerts = true; input bool Show_VWMA_Lines = true; input int PlotDepth = 500;
Immediately after the header come the input variables—the public parameters that the user will see in the EA’s settings dialog. InpTimeframe defines the working chart period; if left to PERIOD_CURRENT the EA simply adopts the timeframe of the chart on which it is running. FastPeriod and SlowPeriod are the look-back windows of the two VWMAs that will later be compared. The next pair, SR_LookBack and SR_OffsetPips, control the lightweight support-resistance filter: the EA scans the last N bars for extremes and only allows a trade when price has moved at least offset pips beyond them. Three Boolean flags let the trader decide whether to draw arrows, send alerts, or plot the moving-average lines, while PlotDepth limits how many historic bars are painted on the chart in to keep rendering time reasonable.
3. Global Runtime Variables
datetime g_last_bar_time = 0; int g_last_signal = 0; // 1 = BUY, -1 = SELL, 0 = none datetime g_last_signal_time = 0; string DASH_BASE = "VWMA_DASH_";
Four globals preserve the EA’s state between ticks. g_last_bar_time remembers the open-time of the candle that has already been processed so that the logic only runs once per bar. g_last_signal and g_last_signal_time keep track of the direction and the time stamp of the most recent alert; this information is reused by the dashboard. Finally, DASH_BASE is a textual prefix that ensures every object belonging to the on-chart panel has a unique, easily identifiable name.
4. The VWMA Calculation Routine
double VWMA(const string sym, ENUM_TIMEFRAMES tf, uint per, int shift) { if(per == 0) return EMPTY_VALUE; MqlRates r[]; if(CopyRates(sym, tf, shift, per, r) != (int)per) return EMPTY_VALUE; double num = 0, den = 0; for(int i = 0; i < (int)per; i++) { double vol = (double)r[i].tick_volume; num += r[i].close * vol; den += vol; } return (den == 0) ? EMPTY_VALUE : num / den; }
double VWMA(const string sym, ENUM_TIMEFRAMES tf, uint per, int shift) embodies the mathematical heart of the program. It starts by copying per candles from the history using CopyRates, beginning shift bars back from the current one. Inside a simple loop, the function accumulates two running sums: num, the total of close × volume, and den, the total volume. Dividing the first by the second produces the canonical volume-weighted moving average.
If price data cannot be obtained or if the denominator happens to be zero, the function returns the MetaTrader constant EMPTY_VALUE, which downstream routines treat like NaN.
5. Support and Resistance Helpers
double HighestHigh(const string s, ENUM_TIMEFRAMES tf, uint lb) { if(lb == 0) return EMPTY_VALUE; double a[]; if(CopyHigh(s, tf, 0, lb, a) != (int)lb) return EMPTY_VALUE; double m = a[0]; for(uint i = 1; i < lb; i++) if(a[i] > m) m = a[i]; return m; } double LowestLow(const string s, ENUM_TIMEFRAMES tf, uint lb) { if(lb == 0) return EMPTY_VALUE; double a[]; if(CopyLow(s, tf, 0, lb, a) != (int)lb) return EMPTY_VALUE; double m = a[0]; for(uint i = 1; i < lb; i++) if(a[i] < m) m = a[i]; return m; } bool ValidateSR(bool buy, double bid, double ask, double& sup, double& res) { res = HighestHigh(_Symbol, InpTimeframe, SR_LookBack); sup = LowestLow(_Symbol, InpTimeframe, SR_LookBack); if(res == EMPTY_VALUE || sup == EMPTY_VALUE) return false; double off = SR_OffsetPips * _Point; return buy ? (bid >= sup + off) : (ask <= res - off); }
Two short wrappers, HighestHigh and LowestLow, scan the last N bars for the extreme high or low by reading raw arrays from CopyHigh and CopyLow. Above them sits ValidateSR, a Boolean gate that implements a rudimentary but effective trade filter. First it calls the two wrappers to fetch the recent high (res) and low (sup). It then adds or subtracts the user-specified pip offset and finally checks whether the current bid or ask price has cleared those levels. In practice this prevents the EA from buying straight into potential resistance or selling into potential support.
6. Object-Management Utilities
//+------------------------------------------------------------------+ //| Chart Utilities | //+------------------------------------------------------------------+ void SafeDeleteObject(const string name) { if(ObjectFind(0, name) != -1) ObjectDelete(0, name); } //+------------------------------------------------------------------+ //| | //+------------------------------------------------------------------+ void PlotChartArrow(const string n, datetime t, double price, color clr, int code) { SafeDeleteObject(n); ObjectCreate(0, n, OBJ_ARROW, 0, t, price); ObjectSetInteger(0, n, OBJPROP_COLOR, clr); ObjectSetInteger(0, n, OBJPROP_ARROWCODE, code); ObjectSetInteger(0, n, OBJPROP_WIDTH, 2); }
SafeDeleteObject is a one-liner that first checks whether a graphical object exists and deletes it only if present. The method prevents terminal log spam that would otherwise occur when trying to remove an already-deleted object. PlotChartArrow is a helper that constructs an OBJ_ARROW with consistent styling—colour, arrow code, and width—at the time and price supplied. By centralizing deletion and creation in these two helpers, the rest of the code can focus on trading logic rather than on chart housekeeping.
7. Drawing Moving-Average Polylines
void DrawLineVWMA(const string name, int period, color clr, int depth) { if(!Show_VWMA_Lines) { SafeDeleteObject(name); int total = ObjectsTotal(0); for(int i = total - 1; i >= 0; i--) { string nm = ObjectName(0, i); if(StringFind(nm, name + "_seg_") == 0) ObjectDelete(0, nm); } return; } const int extra = period + 2; MqlRates r[]; if(CopyRates(_Symbol, InpTimeframe, 0, depth + extra, r) < depth + extra) return; int total = ObjectsTotal(0); for(int i = total - 1; i >= 0; i--) { string nm = ObjectName(0, i); if(StringFind(nm, name + "_seg_") == 0) ObjectDelete(0, nm); } for(int i = 0; i < depth - 1; i++) { double vw1 = VWMA(_Symbol, InpTimeframe, period, i); double vw2 = VWMA(_Symbol, InpTimeframe, period, i + 1); if(vw1 == EMPTY_VALUE || vw2 == EMPTY_VALUE) continue; datetime t1 = r[i].time; datetime t2 = r[i + 1].time; string seg = name + "_seg_" + IntegerToString(i); if(ObjectCreate(0, seg, OBJ_TREND, 0, t1, vw1, t2, vw2)) { ObjectSetInteger(0, seg, OBJPROP_COLOR, clr); ObjectSetInteger(0, seg, OBJPROP_WIDTH, 1); ObjectSetInteger(0, seg, OBJPROP_RAY_RIGHT, false); } } }
Instead of writing a separate indicator with buffers, this Expert Advisor draws its Volume-Weighted Moving Averages (VWMAs) directly onto the chart using the DrawLineVWMA function, allowing for seamless integration with the EA's logic and ensuring that the moving averages are always in sync with the chart and parameters. The function begins by checking the Show_VWMA_Lines flag; if the user disables VWMA line drawing, it immediately performs a thorough cleanup by deleting any objects that were used to display the VWMA, identified by their name prefix, and then exits to keep the chart uncluttered.
If line drawing is enabled, the function requests a block of historical candle data using CopyRates, collecting enough bars (based on the user-specified depth plus a few extra for calculation accuracy) to compute the VWMA across the entire visible range. Before drawing new lines, it once again iterates through all chart objects and deletes any remnants of old VWMA segments, preventing clutter and graphical artifacts from previous runs. The main drawing routine then loops over each consecutive pair of bars in the specified depth and, for each pair, calculates the VWMA at both segment endpoints; if either VWMA value is invalid (for example, because of insufficient data), it skips to the next pair. Otherwise, it creates a short two-point trend line (OBJ_TREND) connecting these two VWMA values at their respective times and prices, uniquely naming each segment for future easy cleanup, and styling them with the chosen color and width while ensuring the lines do not extend beyond their endpoints.
By repeating this process for many bar pairs, the function constructs a visually continuous VWMA line, and this segmented approach is both efficient and effective, minimizing memory usage and ensuring rapid updates even as new bars are added or parameters are changed. The function is designed for robust automatic maintenance; every time it is called, it removes outdated segments and draws new ones based on the latest VWMA calculations, so the visual representation is always current and accurate. In summary, DrawLineVWMA offers a practical and robust mechanism for overlaying VWMAs on the chart as part of the EA’s visual output, balancing clarity, efficiency, and user control, and it eliminates the need for a separate indicator file or buffers while providing the user with the option to toggle VWMA lines on or off as desired, keeping the chart both informative and tidy.
8. Dashboard Construction and Maintenance
void UpdateDashboard(double fast_vwma, double slow_vwma) { int corner = 0, x = 12, y = 12; int panel_w = 320, panel_h = 130, pill_w = 120, pill_h = 36, gap_y = 12; int digits = (int)SymbolInfoInteger(_Symbol, SYMBOL_DIGITS); string prefix = DASH_BASE; // ... (creation and property setting for each rectangle and label) // See full code for all label/rectangle setup string sia = prefix + "SIGN_ARROW"; if(ObjectFind(0, sia) == -1) ObjectCreate(0, sia, OBJ_LABEL, 0, 0, 0); ObjectSetInteger(0, sia, OBJPROP_CORNER, corner); ObjectSetInteger(0, sia, OBJPROP_XDISTANCE, x + pill_w + 130); ObjectSetInteger(0, sia, OBJPROP_YDISTANCE, y + (pill_h + gap_y) * 2 + 10); ObjectSetInteger(0, sia, OBJPROP_FONTSIZE, 28); string txt = ""; color arrclr = clrGray; if(g_last_signal == 1) { txt = "▲"; arrclr = clrLime; } if(g_last_signal == -1) { txt = "▼"; arrclr = clrRed; } ObjectSetInteger(0, sia, OBJPROP_COLOR, arrclr); ObjectSetString(0, sia, OBJPROP_TEXT, txt); }
UpdateDashboard synthesizes a compact three-row control panel in the upper-left corner of the chart. A black OBJ_RECTANGLE forms the background; within it, two color-coded pills display the latest fast and slow VWMA values, and a wider pill beneath them shows the most recent trading signal. All rectangles and labels are named with a common DASH_BASE prefix, allowing bulk deletion through DeleteDashboardObjects when the EA is unloaded. The function dynamically chooses the arrow glyph, its colour, and the numeric precision of the VWMA readings, thereby giving the trader at-a-glance information without having to inspect tooltips or the Experts log.
9. Executing a Trading Signal
void ExecuteSignal(bool buy, const string cmt) { g_last_signal = buy ? 1 : -1; g_last_signal_time = TimeCurrent(); // Plot arrow if(Draw_Arrows) { string name = (buy ? "SIGNAL_BUY_" : "SIGNAL_SELL_") + (string)g_last_signal_time; color clr = buy ? clrLime : clrRed; int code = buy ? 233 : 234; double price = buy ? SymbolInfoDouble(_Symbol, SYMBOL_BID) : SymbolInfoDouble(_Symbol, SYMBOL_ASK); PlotChartArrow(name, g_last_signal_time, price, clr, code); } // Alert if(Send_Alerts) { string msg = (buy ? "VWMA SIGNAL BUY " : "VWMA SIGNAL SELL ") + _Symbol + " | " + cmt; Alert(msg); PlaySound("alert.wav"); } // Update dashboard double f = VWMA(_Symbol, InpTimeframe, FastPeriod, 0); double s = VWMA(_Symbol, InpTimeframe, SlowPeriod, 0); if(f != EMPTY_VALUE && s != EMPTY_VALUE) UpdateDashboard(f, s); }
When the strategy logic determines that a new buy or sell signal has occurred, it calls the ExecuteSignal function, which manages all related actions except for placing trades. First, it updates global variables to record the latest signal type and time, ensuring other components, like dashboards, stay in sync. If arrow drawing is enabled, the function marks the chart at the signal’s location with a colored arrow—lime for buy and red for sell—making it easy to spot signals visually. If alerts are enabled, the function also displays a popup message and plays a notification sound, providing immediate user feedback with information about the signal and symbol. Finally, it refreshes the dashboard by updating it with the latest VWMA values, so the visual summary reflects the most recent market analysis. It’s important to note that this function only generates and displays signals; it does not execute any trades, allowing the EA to serve as a signal generator that can be further extended with automated trading features in the future.
10. Lifecycle Event Handlers
int OnInit() { Print("VWMA Crossover Dashboard (signal-only) loaded."); g_last_bar_time = 0; g_last_signal = 0; g_last_signal_time = 0; return(INIT_SUCCEEDED); } void OnDeinit(const int reason) { SafeDeleteObject("VWMA_FAST"); SafeDeleteObject("VWMA_SLOW"); int total = ObjectsTotal(0); for(int i = total - 1; i >= 0; i--) { string nm = ObjectName(0, i); if(StringFind(nm, "SIGNAL_BUY_") == 0 || StringFind(nm, "SIGNAL_SELL_") == 0) ObjectDelete(0, nm); if(StringFind(nm, "VWMA_FAST_seg_") == 0 || StringFind(nm, "VWMA_SLOW_seg_") == 0) ObjectDelete(0, nm); } DeleteDashboardObjects(); }
OnInit executes once when the EA is attached to a chart or recompiled. It zeros all state variables and prints a console greeting so the user can confirm that initialization succeeded. OnDeinit performs the opposite task: it scrubs the chart clean by deleting individual master objects ("VWMA_FAST", "VWMA_SLOW") and then loops through every remaining chart object, removing any whose name begins with "SIGNAL_BUY_", "SIGNAL_SELL_", or the segment prefixes that the polyline painter uses. The dashboard is also dismantled to leave the chart exactly as it was before the EA was loaded.
11. The Heartbeat—OnTick
void OnTick() { // Update dashboard every tick double f_now_dash = VWMA(_Symbol, InpTimeframe, FastPeriod, 0); double s_now_dash = VWMA(_Symbol, InpTimeframe, SlowPeriod, 0); if(f_now_dash != EMPTY_VALUE && s_now_dash != EMPTY_VALUE) UpdateDashboard(f_now_dash, s_now_dash); datetime cur = iTime(_Symbol, InpTimeframe, 0); if(cur == g_last_bar_time) { DrawLineVWMA("VWMA_FAST", FastPeriod, clrDodgerBlue, PlotDepth); DrawLineVWMA("VWMA_SLOW", SlowPeriod, clrOrangeRed, PlotDepth); return; } g_last_bar_time = cur; double f_prev = VWMA(_Symbol, InpTimeframe, FastPeriod, 1); double s_prev = VWMA(_Symbol, InpTimeframe, SlowPeriod, 1); double f_now = VWMA(_Symbol, InpTimeframe, FastPeriod, 0); double s_now = VWMA(_Symbol, InpTimeframe, SlowPeriod, 0); if(f_prev == EMPTY_VALUE || s_prev == EMPTY_VALUE || f_now == EMPTY_VALUE || s_now == EMPTY_VALUE) return; bool bull = (f_prev < s_prev && f_now > s_now); bool bear = (f_prev > s_prev && f_now < s_now); double sup, res; if(bull && ValidateSR(true, SymbolInfoDouble(_Symbol, SYMBOL_BID), SymbolInfoDouble(_Symbol, SYMBOL_ASK), sup, res)) ExecuteSignal(true, "VWMA BUY"); if(bear && ValidateSR(false, SymbolInfoDouble(_Symbol, SYMBOL_BID), SymbolInfoDouble(_Symbol, SYMBOL_ASK), sup, res)) ExecuteSignal(false, "VWMA SELL"); DrawLineVWMA("VWMA_FAST", FastPeriod, clrDodgerBlue, PlotDepth); DrawLineVWMA("VWMA_SLOW", SlowPeriod, clrOrangeRed, PlotDepth); }
Every incoming market tick triggers OnTick, but the computationally heavy part of the algorithm only runs once per bar. The function starts by updating the dashboard values on every tick so the numbers remain live. It then checks whether the current candle time iTime(...,0) differs from g_last_bar_time; if not, only the MA lines are repainted and the function exits quickly. When a fresh bar is detected, the EA collects the fast and slow VWMA for both the previous and current candles. A bullish crossover is recognized when the fast VWMA moves from below to above the slow VWMA; the inverse forms a bearish crossover. Each prospective trade is then passed through ValidateSR; if the level check passes, ExecuteSignal is called. Regardless of whether a signal fires, the method finishes by redrawing both VWMA polylines so the visual elements stay in sync with the newly formed candle.
After finishing your MQL5 EA code, click the "Compile" button in the MetaEditor. If there are no errors or warnings, your EA is ready for deployment and testing. To evaluate its performance, open MetaTrader 5, go to the "Navigator" window, expand the "Experts" section, and drag your EA onto a chart for live or demo testing. Alternatively, you can use the Strategy Tester to backtest your EA's behavior on historical data.
Step-by-step:
- Compile your EA in MetaEditor by pressing the "Compile" button.
- Check for errors and warnings. If none are reported, the EA is ready.
- Open MetaTrader 5, go to the "Navigator" (usually on the left), and find your EA under "Experts".
- Drag and drop the EA onto a chart to run it live or in demo mode.
- For historical performance analysis, open the Strategy Tester (press Ctrl+R or use the "View" menu), select your EA, choose your settings, and start the backtest.
Outcomes
Below is an illustration of the backtesting results for our tool. A dedicated panel is displayed, updating in real time to show the current values of both the fast and slow VWMA as each new tick arrives. On the chart, green arrows indicate buy signals, while red arrows mark sell signals, providing clear visual cues for each trading event. Overall, we observe a series of positive signals, with most indicating favorable trading opportunities. While there are a few incorrect signals, they are relatively limited, demonstrating the tool’s potential effectiveness in filtering out market noise and identifying genuine trends.

Conclusion
In conclusion, while traditional moving averages such as the Simple Moving Average (SMA) and Exponential Moving Average (EMA) remain valuable tools for technical analysis, they primarily focus on price data and may sometimes overlook the significance of trading volume in market movements. The VWMA crossover EA complements these approaches by integrating volume into its calculations, offering a more nuanced perspective on price action. By emphasizing both price and volume, the tool helps traders more effectively identify potential bullish and bearish reversals, especially during periods of heightened market activity. This added layer of insight can enhance decision-making and provide more context to trading signals, making the VWMA crossover EA a useful addition to any trader’s analytical toolkit.
Read my other articles.
Note: This article and the VWMA crossover EA are provided for educational purposes, empowering you to deepen your understanding of technical analysis and signal-based trading. The EA serves as a signal generator; it does not execute trades automatically, so you remain in full control of your trading decisions. We encourage you to experiment with the tool, backtest it thoroughly, and adjust the input settings to match your personal strategy and market preferences. Use the signals as a valuable part of your analysis, and always validate them with your own judgment. With careful testing and thoughtful customization, this tool can become a valuable addition to your trading toolkit.