
 Data Structure
 Networking
 RDBMS
RDBMS Operating System
 Java
Java MS Excel
 iOS
iOS HTML
HTML CSS
CSS Android
 Python
 C Programming
 C++
C++ C#
C# MongoDB
 MySQL
MySQL Javascript
 PHP
PHP
- Selected Reading
- UPSC IAS Exams Notes
- Developer's Best Practices
- Questions and Answers
- Effective Resume Writing
- HR Interview Questions
- Computer Glossary
- Who is Who
Text alignment in a Matplotlib legend
To make text alignment in a matplotlib legend, we can take the following steps −
Set the figure size and adjust the padding between and around the subplots.
Create x data points using numpy.
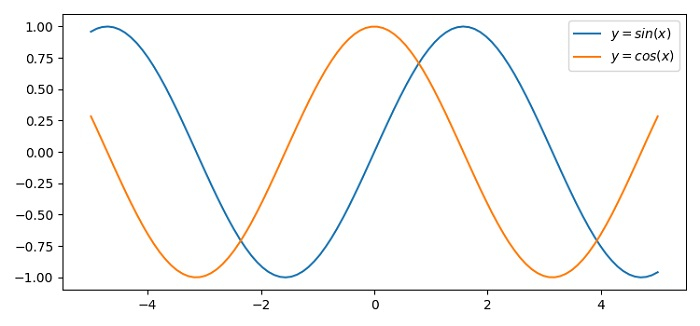
Plot x, sin(x) and cos(x) using plot() method.
Place legend using legend() method and initialize a method.
Iterate the legend.get_texts() method to set the horizontal alignment.
To display the figure, use show() method.
Example
import numpy as np from matplotlib import pyplot as plt plt.rcParams["figure.figsize"] = [7.50, 3.50] plt.rcParams["figure.autolayout"] = True x = np.linspace(-5, 5, 100) plt.plot(x, np.sin(x), label="$y=sin(x)$") plt.plot(x, np.cos(x), label="$y=cos(x)$") legend = plt.legend(loc='upper right') for t in legend.get_texts(): t.set_ha('left') plt.show() Output

Updated on: 2021-06-04T06:18:42+05:30
5K+ Views

Advertisements