
 Data Structure
 Networking
 RDBMS
RDBMS Operating System
 Java
Java MS Excel
 iOS
iOS HTML
HTML CSS
CSS Android
 Python
 C Programming
 C++
C++ C#
C# MongoDB
 MySQL
MySQL Javascript
 PHP
PHP
- Selected Reading
- UPSC IAS Exams Notes
- Developer's Best Practices
- Questions and Answers
- Effective Resume Writing
- HR Interview Questions
- Computer Glossary
- Who is Who
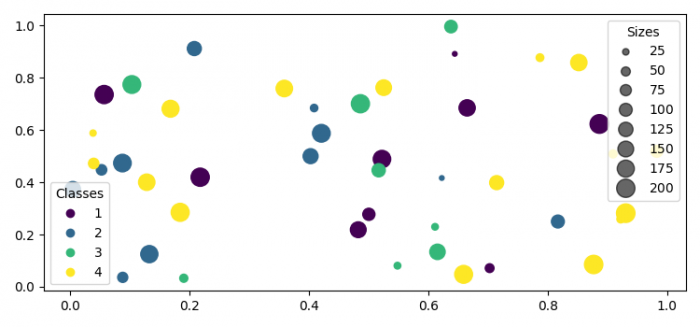
Automated legend creation in Matplotlib
To automate legend creation in Matplotlib, we can take the following steps −
- Set the figure size and adjust the padding between and around the subplots.
- Initialize a variable, N, for number of sample data.
- Create x, y, c and s data using numpy.
- Create a figure and a set of subplots using subplots() method.
- Plot x and y data points with different colors and sizes.
- Place a legend on the axes.
- Add an artist to the figure.
- Create legend handles and labels for a PathCollection.
- Again, place a legend on the axes for sizes.
- To display the figure, use show() method.
Example
import matplotlib.pyplot as plt import numpy as np plt.rcParams["figure.figsize"] = [7.50, 3.50] plt.rcParams["figure.autolayout"] = True N = 45 x, y = np.random.rand(2, N) c = np.random.randint(1, 5, size=N) s = np.random.randint(10, 220, size=N) fig, ax = plt.subplots() scatter = ax.scatter(x, y, c=c, s=s) legend1 = ax.legend(*scatter.legend_elements(), loc="lower left", title="Classes") ax.add_artist(legend1) handles, labels = scatter.legend_elements(prop="sizes", alpha=0.6) legend2 = ax.legend(handles, labels, loc="upper right", title="Sizes") plt.show()
Output

Updated on: 2021-06-10T11:58:42+05:30
907 Views

Advertisements