
 Data Structure
 Networking
 RDBMS
RDBMS Operating System
 Java
Java MS Excel
 iOS
iOS HTML
HTML CSS
CSS Android
 Python
 C Programming
 C++
C++ C#
C# MongoDB
 MySQL
MySQL Javascript
 PHP
PHP
- Selected Reading
- UPSC IAS Exams Notes
- Developer's Best Practices
- Questions and Answers
- Effective Resume Writing
- HR Interview Questions
- Computer Glossary
- Who is Who
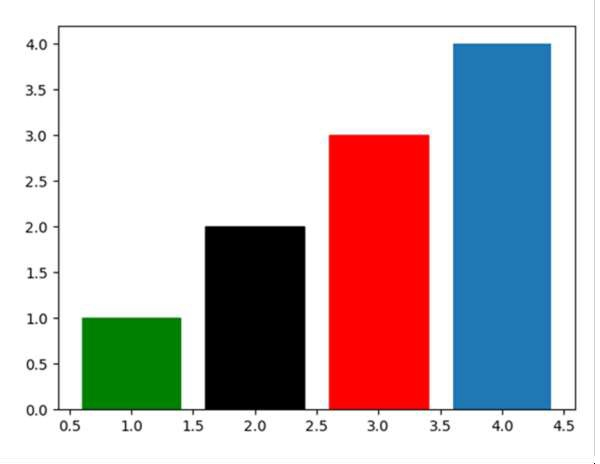
Setting Different Bar color in Matplotlib
We can first create bars and then, by using set_color, we can set the color of the bars.
Steps
Pass two lists consisting of four elements, into the bars method argument.
Step 1 returns bars.
Return values (0, 1, 2, 3) can be set with different colors, using set_color() method. Green, Black, Red color will be set and one bar will have the default color.
To show the figure, use plt.show() method.
Example
from matplotlib import pyplot as plt bars = plt.bar([1, 2, 3, 4], [1, 2, 3, 4]) bars[0].set_color('green') bars[1].set_color('black') bars[2].set_color('red') plt.show() Output

Updated on: 2021-03-16T10:56:01+05:30
17K+ Views

Advertisements