
 Data Structure
 Networking
 RDBMS
RDBMS Operating System
 Java
Java MS Excel
 iOS
iOS HTML
HTML CSS
CSS Android
 Python
 C Programming
 C++
C++ C#
C# MongoDB
 MySQL
MySQL Javascript
 PHP
PHP
- Selected Reading
- UPSC IAS Exams Notes
- Developer's Best Practices
- Questions and Answers
- Effective Resume Writing
- HR Interview Questions
- Computer Glossary
- Who is Who
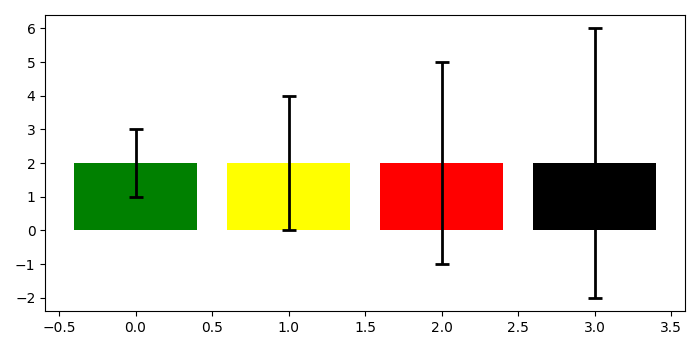
Setting different error bar colors in barplot in Matplotlib
To set different error bar colors in barplot in matplotlib, we can take the following steps −
Create a figure and add a set of subplots using subplots() method.
Make a barplot with data range 4, heights 2. yerr means vertical errorbars to the bar tips. The values are sizes relative to the data. Dictionary of kwargs to be passed to the errorbar method. Values of ecolor or capsize defined here take precedence over the independent kwargs.
To display the figure, use show() method.
Example
import matplotlib.pyplot as plt plt.rcParams["figure.figsize"] = [7.00, 3.50] plt.rcParams["figure.autolayout"] = True fig, ax = plt.subplots() ax.bar(range(4), [2] * 4, yerr=range(1, 5), color=['green', 'yellow', 'red', 'black', 'orange'], error_kw=dict(ecolor='black', lw=2, capsize=5, capthick=2)) plt.show()
Output

Updated on: 2021-05-08T09:44:43+05:30
1K+ Views

Advertisements