
 Data Structure
 Networking
 RDBMS
RDBMS Operating System
 Java
Java MS Excel
 iOS
iOS HTML
HTML CSS
CSS Android
 Python
 C Programming
 C++
C++ C#
C# MongoDB
 MySQL
MySQL Javascript
 PHP
PHP
- Selected Reading
- UPSC IAS Exams Notes
- Developer's Best Practices
- Questions and Answers
- Effective Resume Writing
- HR Interview Questions
- Computer Glossary
- Who is Who
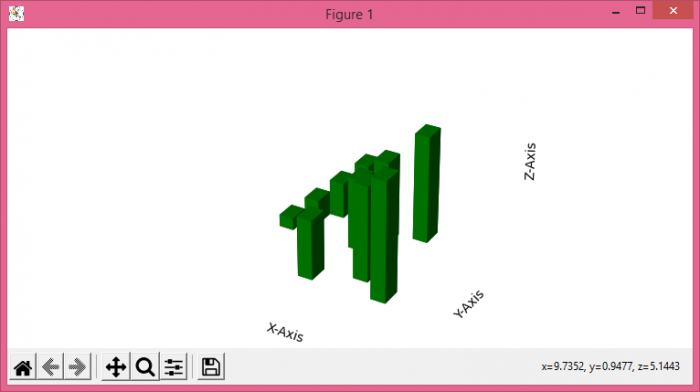
How to hide axes but keep axis-labels in 3D Plot with Matplotlib?
To hide axes but keep axis-labels in 3D plot with Matplotlib, we can take the following steps −
- Set the figure size and adjust the padding between and around the subplots.
- Create a new figure or activate an existing figure.
- Add an '~.axes.Axes' to the figure as part of a subplot arrangement.
- Create x, y, z, dx, dy and dz data points using numpy
- Use bar3d() method to plot the 3D bars.
- To hide the axes, initialize a color tuple, the same as axes color.
- Set x, y and z axes plane color property same with the color tuple.
- Set x, y and z axes line color property same with the color tuple.
- Set empty ticks to the x, y and z axes.
- Set x, y and z axes labels.
- To display the figure, use show() method.
Example
import numpy as np from matplotlib import pyplot as plt plt.rcParams["figure.figsize"] = [7.50, 3.50] plt.rcParams["figure.autolayout"] = True fig = plt.figure() ax = fig.add_subplot(111, projection='3d') x = [1, 2, 3, 4, 5, 6, 7, 8, 9, 10] y = [5, 6, 7, 8, 2, 5, 6, 3, 7, 2] z = np.zeros(10) dx = np.ones(10) dy = np.ones(10) dz = [1, 2, 3, 4, 5, 6, 7, 8, 9, 10] ax.bar3d(x, y, z, dx, dy, dz, color="green") color_tuple = (1.0, 1.0, 1.0, 0.0) ax.w_xaxis.set_pane_color(color_tuple) ax.w_yaxis.set_pane_color(color_tuple) ax.w_zaxis.set_pane_color(color_tuple) ax.w_xaxis.line.set_color(color_tuple) ax.w_yaxis.line.set_color(color_tuple) ax.w_zaxis.line.set_color(color_tuple) ax.set_xticks([]) ax.set_yticks([]) ax.set_zticks([]) ax.set_xlabel('X-Axis') ax.set_ylabel('Y-Axis') ax.set_zlabel('Z-Axis') plt.show() Output

Updated on: 2021-06-03T09:11:21+05:30
2K+ Views

Advertisements