
 Data Structure
 Networking
 RDBMS
RDBMS Operating System
 Java
Java MS Excel
 iOS
iOS HTML
HTML CSS
CSS Android
 Python
 C Programming
 C++
C++ C#
C# MongoDB
 MySQL
MySQL Javascript
 PHP
PHP
- Selected Reading
- UPSC IAS Exams Notes
- Developer's Best Practices
- Questions and Answers
- Effective Resume Writing
- HR Interview Questions
- Computer Glossary
- Who is Who
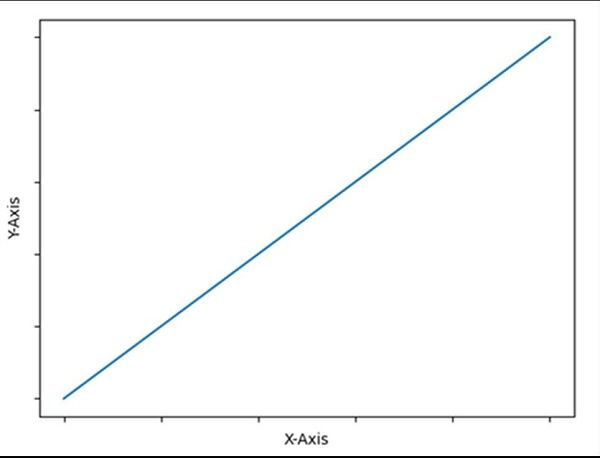
Hide axis values but keep axis tick labels in matplotlib
To hide the axis value but to keep the axis tick labels, we can perform the following steps −
Plot a line using the plot( ) method.
Set X and Y labels using x label and y label methods.
Using plt.gca(), get the current axis, creating one if necessary.
Use xaxis.set_ticklabels() with an empty list.
Use yaxis.set_ticklabels() with an empty list.
To show the diagram, use the plt.show() method.
Example
import matplotlib.pyplot as plt plt.plot([0, 5], [0, 5]) plt.ylabel("Y-axis ") plt.xlabel("X-axis ") ax = plt.gca() ax.axes.xaxis.set_ticklabels([]) ax.axes.yaxis.set_ticklabels([]) plt.show() Output

Updated on: 2021-03-15T07:34:08+05:30
8K+ Views

Advertisements