
 Data Structure
 Networking
 RDBMS
RDBMS Operating System
 Java
Java MS Excel
 iOS
iOS HTML
HTML CSS
CSS Android
 Python
 C Programming
 C++
C++ C#
C# MongoDB
 MySQL
MySQL Javascript
 PHP
PHP
- Selected Reading
- UPSC IAS Exams Notes
- Developer's Best Practices
- Questions and Answers
- Effective Resume Writing
- HR Interview Questions
- Computer Glossary
- Who is Who
How do I convert (or scale) axis values and redefine the tick frequency in Matplotlib?
To convert or scale the axis values and redefine the tick frequency in matplotlib, we can make a list of xticks and xtick_labels using xticks() method. Place the axis scale and redefine the tick frequency.
Steps
Set the figure size and adjust the padding between and around the subplots.
Initialize a variable, n, for the number of data points.
Create x and y data points using numpy.
Plot x and y data points using plot() method.
Make lists of ticks and tick labels.
Use xticks() method to place axis scale and redefine tick frequency.
To display the figure, use show() method.
Example
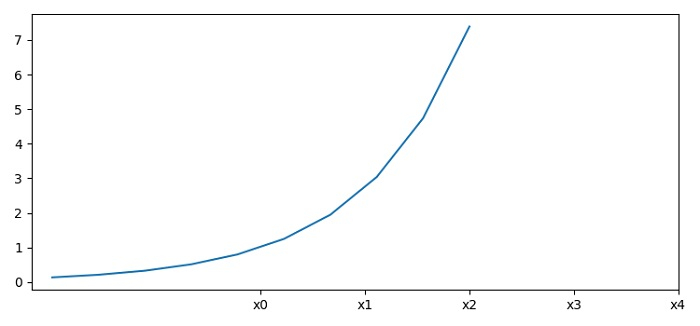
import numpy as np from matplotlib import pyplot as plt plt.rcParams["figure.figsize"] = [7.50, 3.50] plt.rcParams["figure.autolayout"] = True n = 10 x = np.linspace(-2, 2, n) y = np.exp(x) plt.plot(x, y) xticks = [i for i in range(int(n/2))] xtick_labels = ["x"+str(i) for i in range(int(n/2))] plt.xticks(xticks, xtick_labels) plt.show()
Output

Updated on: 2021-06-01T12:06:28+05:30
2K+ Views

Advertisements