
 Data Structure
 Networking
 RDBMS
RDBMS Operating System
 Java
Java MS Excel
 iOS
iOS HTML
HTML CSS
CSS Android
 Python
 C Programming
 C++
C++ C#
C# MongoDB
 MySQL
MySQL Javascript
 PHP
PHP
- Selected Reading
- UPSC IAS Exams Notes
- Developer's Best Practices
- Questions and Answers
- Effective Resume Writing
- HR Interview Questions
- Computer Glossary
- Who is Who
How do I change the axis tick font in a Matplotlib plot when rendering using LaTeX?
To change the axis tick font in matplotlib when rendering using LaTeX, we can take the following Steps −
Create x and y data points using numpy.
Using subplot() method, add a subplot to the current figure.
Set x and y ticks with data points x and y using set_xticks and set_yticks methods, respectively.
Plot x and y using plot() method with color=red.
To set bold font weight, we can use LaTeX representation.
To display the figure, use show() method.
Example
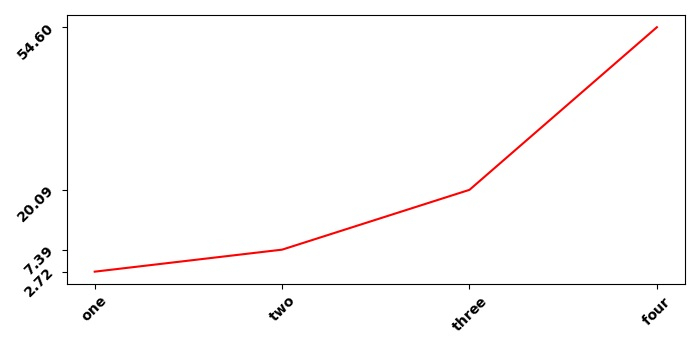
import numpy as np import matplotlib.pyplot as plt plt.rcParams["figure.figsize"] = [7.00, 3.50] plt.rcParams["figure.autolayout"] = True x = np.array([1, 2, 3, 4]) y = np.exp(x) ax1 = plt.subplot() ax1.set_xticks(x) ax1.set_yticks(y) ax1.plot(x, y, c="red") ax1.set_xticklabels(["$\bf{one}$", "$\bf{two}$", "$\bf{three}$", "$\bf{four}$"], rotation=45) ax1.set_yticklabels(["$\bf{:.2f}$".format(y[0]), "$\bf{:.2f}$".format(y[1]), "$\bf{:.2f}$".format(y[2]), "$\bf{:.2f}$".format(y[3])], rotation=45) plt.tight_layout() plt.show() Output

Updated on: 2021-05-15T12:45:24+05:30
549 Views

Advertisements