
 Data Structure
 Networking
 RDBMS
RDBMS Operating System
 Java
Java MS Excel
 iOS
iOS HTML
HTML CSS
CSS Android
 Python
 C Programming
 C++
C++ C#
C# MongoDB
 MySQL
MySQL Javascript
 PHP
PHP
- Selected Reading
- UPSC IAS Exams Notes
- Developer's Best Practices
- Questions and Answers
- Effective Resume Writing
- HR Interview Questions
- Computer Glossary
- Who is Who
How to obtain the same font in Matplotlib output as in LaTex output?
To make bold font weight LaTeX axes label in matplotlib, we can take the following steps−
- Create data points for x.
- Create data points for y, i.e., y=sin(x).
- Plot the curve x and y with LaTex representation.
- To activate the label, use legend() method.
- To display the figure, use show() method.
Example
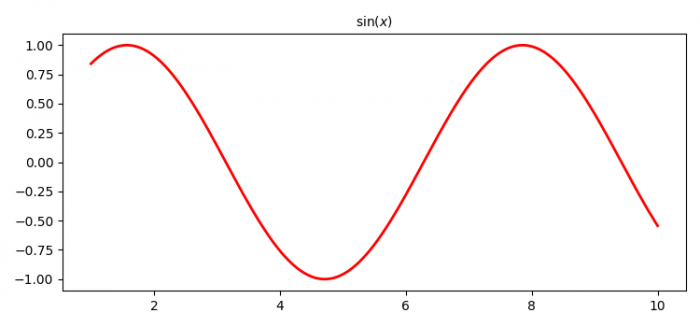
import numpy as np from matplotlib import pyplot as plt, font_manager as fm fprop = fm.FontProperties(fname='/usr/share/fonts/truetype/malayalam/Karumbi.ttf') plt.rcParams["figure.figsize"] = [7.50, 3.50] plt.rcParams["figure.autolayout"] = True x = np.linspace(1, 10, 1000) y = np.sin(x) plt.plot(x, y, label=r'$\sin (x)$', c="red", lw=2) plt.title(label=r'$\sin (x)$', fontproperties=fprop) plt.show()
Output

Updated on: 2021-05-15T12:35:52+05:30
311 Views

Advertisements