The document presents a research article focusing on web-based application layer Distributed Denial-of-Service (DDoS) attacks and introduces an Anomaly-based Real-time Prevention (ARTP) framework that utilizes machine learning for effective detection. The framework distinguishes between legitimate and malicious requests, addressing the challenge posed by increasing volumes of DDoS traffic, particularly application layer attacks. Testing demonstrated the model's efficiency in real-time detection, affirming its adaptability to current web application demands.
![Jilin Daxue Xuebao (Gongxueban)/Journal of Jilin University (Engineering and Technology Edition) ISSN: 1671-5497 E-Publication: Online Open Access Vol: 42 Issue: 11-2023 DOI: 10.5281/zenodo.10205690 Nov 2023 | 418 Network layer DDoS attacks and application layer DDoS attacks are the two main types of distributed denial of service attacks [1]. Both types are typical in the world of distributed denial of service attacks. The first form of attack occurs when an adversary uses techniques like IP spoofing to bombard the target system with counterfeit data packets. However, application layer DDoS attacks, or App-DDoS attacks as they are more commonly known, involve overwhelming the targeted system with a large number of valid requests. In these attacks, the assailant's compromised computers need to establish valid TCP connections with the victim's system, else the connections would be severed. A notable example here is the HTTP flood, a method that leverages surges in HTTP requests to strain the targeted servers' capabilities. Functioning at the application level, these attacks aim to besiege the host server of online applications by inundating it with an avalanche of simultaneous and seemingly legitimate requests, culminating in rendering the server unreachable for legitimate clients. In an effort to address and comprehend these intricate tactics, recent works, such as [2], delve into novel strategies to bypass DDoS defenses and uncover tactics that facilitate more efficient attack collaborations. Notably, the HTTP flood technique amplifies the volume of HTTP requests, orchestrating a surge in transactional interactions to exploit the vulnerabilities in the targeted servers' architecture [3, 4]. Amidst this inundation, the targeted servers grapple with the challenge of differentiating between legitimate payload data and the deluge of seemingly ordinary HTTP requests. 2. RELATED WORK Some of the DDoS defense solutions tailored for countering HTTP floods exhibit a reliance on application layer insights, as indicated by a recent survey [5]. An example of such is the DDoS shield [6], which employs the detection of session initiation times and the manipulation of time intervals between arrivals to thwart HTTP floods. An additional noteworthy approach, investigated in the work "Using Page Access Lead to Fight HTTP Flood" [7, 8], delves into the intricate relationship between data sizes and browsing durations. Yet, these methodologies fall short when confronted with the formidable packet transmission rates facilitated by the coordinated efforts of malicious Botnets [9]. Introducing a CAPTCHA-based probabilistic validation system, while effective in rare cases, risks unduly burdening the user experience. This could potentially translate into an inadvertent Denial of Service scenario, particularly when addressing practical grievances is paramount. The Hidden semi-Markov model (HSMM) is introduced in [10] for this purpose; it utilises the specifics of transactional request instances to decode typical client access patterns. This model further evaluates the ongoing influx of clients using HSMM-derived data. However, this approach yields a substantial volume of false alerts, attributable to the variability in invocation patterns, especially considering the diverse browsing behaviors of actual users. Instances where clients engage external online interfaces, input URLs for potential queries, or navigate with a medley of browsers can inadvertently trigger false alarms, adding an element of uncertainty to the equation. The primary objective of the proposed methodology centers on assessing transactional correlations, drawing from both regular and flood data. In contrast to conventional benchmarking techniques, the focal points of this proposed model derive from extensive](https://image.slidesharecdn.com/30-240313101219-7f2f0a3e/75/WEB-BASED-APPLICATION-LAYER-DISTRIBUTED-DENIAL-OF-SERVICE-ATTACKS-A-DATA-DRIVEN-MACHINE-LEARNING-2-2048.jpg)
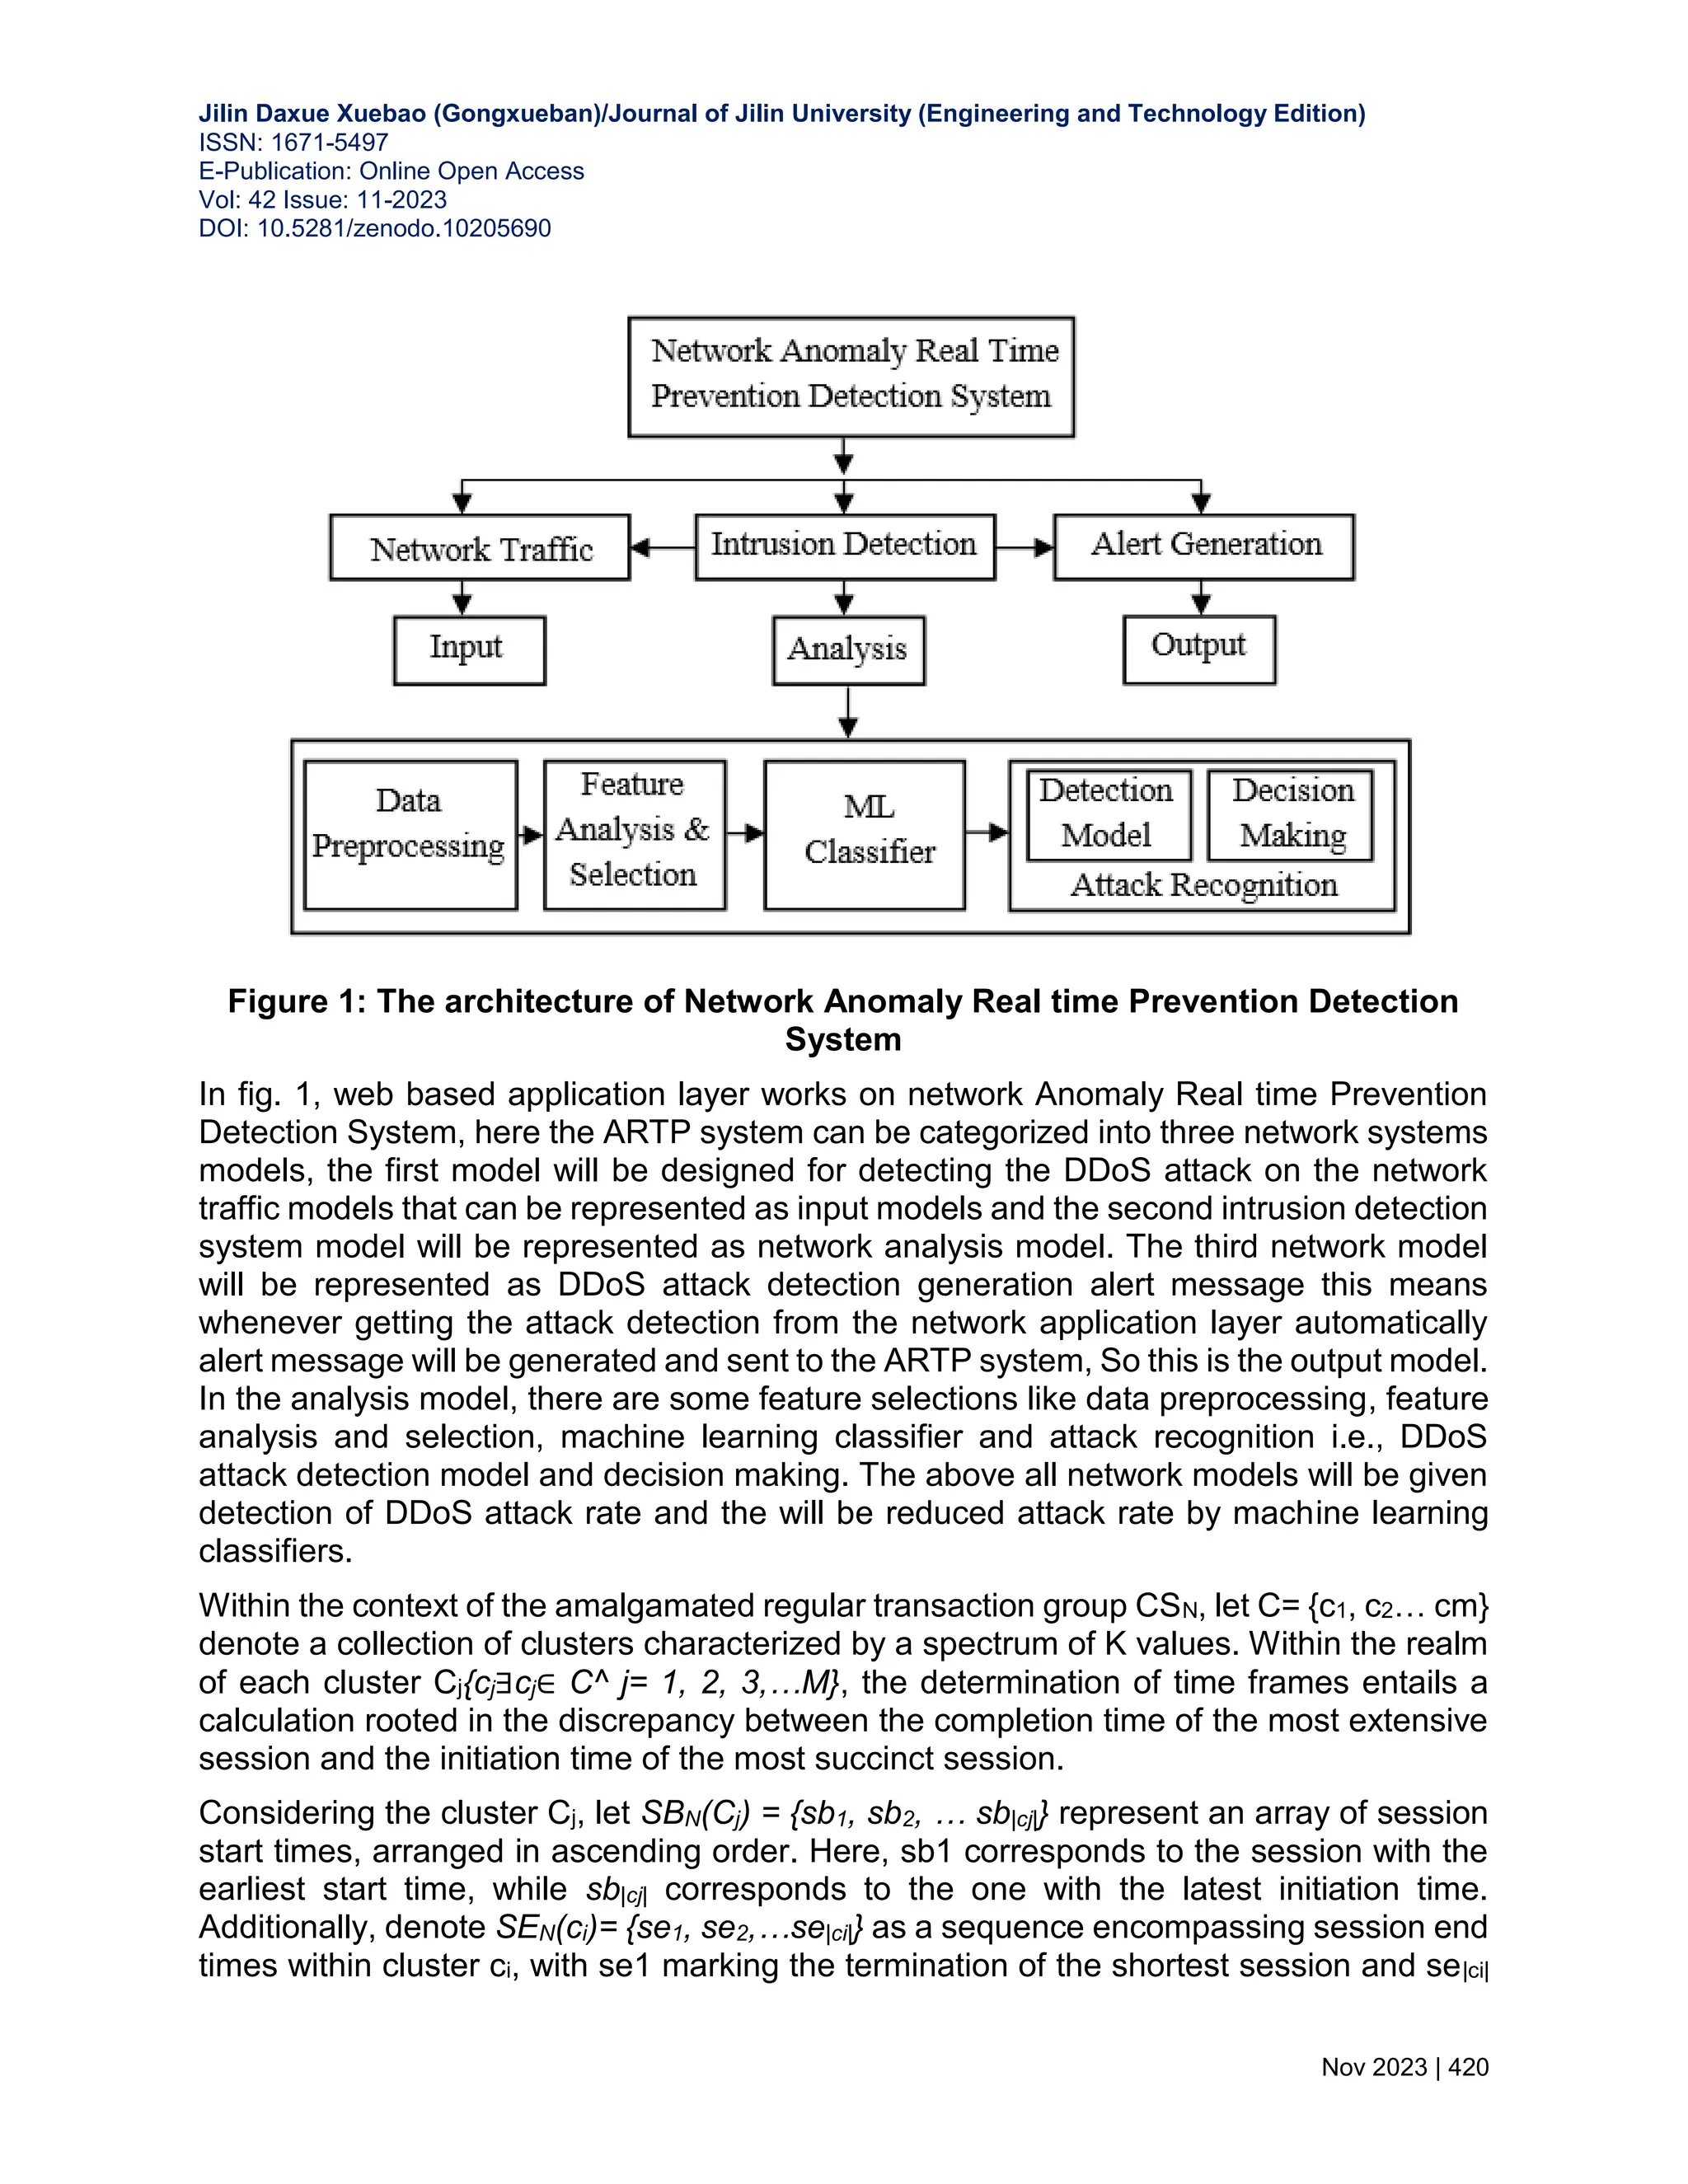
![Jilin Daxue Xuebao (Gongxueban)/Journal of Jilin University (Engineering and Technology Edition) ISSN: 1671-5497 E-Publication: Online Open Access Vol: 42 Issue: 11-2023 DOI: 10.5281/zenodo.10205690 Nov 2023 | 419 observations of the request stream across an extended timeframe. The subsequent sections of this paper meticulously follow a well-organized trajectory: Section 3 elaborates on the proposed ARTP model, while Section 4 delves into a comprehensive examination of a test study and evaluates the efficacy of ARTP. Finally, Section 5 culminates this scholarly endeavor by offering conclusive insights. 3.WEB-BASED APPLICATION LAYER DISTRIBUTED DENIAL-OF-SERVICE ATTACKS: A DATA-DRIVEN MACHINE LEARNING STRATEGY To answer the danger posed by Application Layer DDoS attacks on the internet, we have designed and fine-tuned an anomaly-based Real-Time Prevention (ARTP) framework [11]. The overwhelming number of requests at once inspired the development of this framework. The system's "speedy and early detection" of Application Layer DDoS attacks has been a huge success, making that goal one of its most significant achievements. The essence of the ARTP model lies in its multifaceted entity metrics, encompassing crucial facets such as "request chain length, variations in packet count, permutations in packet sorting, intervals between requests, and the contextual backdrop of transactional chains." Importantly, a multitude of prevalent benchmarking methods, often hinged on sessions or requests as primary inputs, inadvertently bypass the fundamental basis of this methodology. To evaluate the effectiveness and potency of the proposed model, comprehensive testing was undertaken utilizing the LLDoS dataset, underscoring both its adaptability and robustness. It is noteworthy that the envisaged model exhibits remarkable efficacy within the realm of application layer DDoS attacks. This holds especially true given the contemporary landscape of web applications, where the sheer magnitude of incoming requests has escalated to the scale of petabytes, dwarfing the gigabyte-level loads of previous web request paradigms. 3.1 Finding the Length of a Time Frame The acronym CS={s1, s2,…,sn} encapsulates an assemblage of Client Sessions. Each session within this collection, denoted as {l∃l∈si^si∈CS}, encompasses transactions categorized as either N (normal) or D (disordered, signifying a DDoS attack). The aggregate count of transactions in CS encompasses both regular (CSN) and anomalous (CSD) transactions, jointly forming the composite volume of transactions associated with DDoS attacks. The heuristic measures, outlined in Section 3, will undergo validation through experimentation employing these datasets. To provide further clarification, the dataset CS, which encompasses both CSN and CSD instances, undergoes a crucial partitioning process into distinct CSN (normal) and CSD (DDoS attack) subsets. Subsequently, harnessing the K-Means technique [12], the sessions within these subsets are individually clustered. This strategic clustering aids in the determination of the optimal number of clusters within the CSN and CSD sets. This culminates in the simultaneous computation of time frames for both CSN and CSD, adding a layer of precision to the analysis process.](https://image.slidesharecdn.com/30-240313101219-7f2f0a3e/75/WEB-BASED-APPLICATION-LAYER-DISTRIBUTED-DENIAL-OF-SERVICE-ATTACKS-A-DATA-DRIVEN-MACHINE-LEARNING-3-2048.jpg)
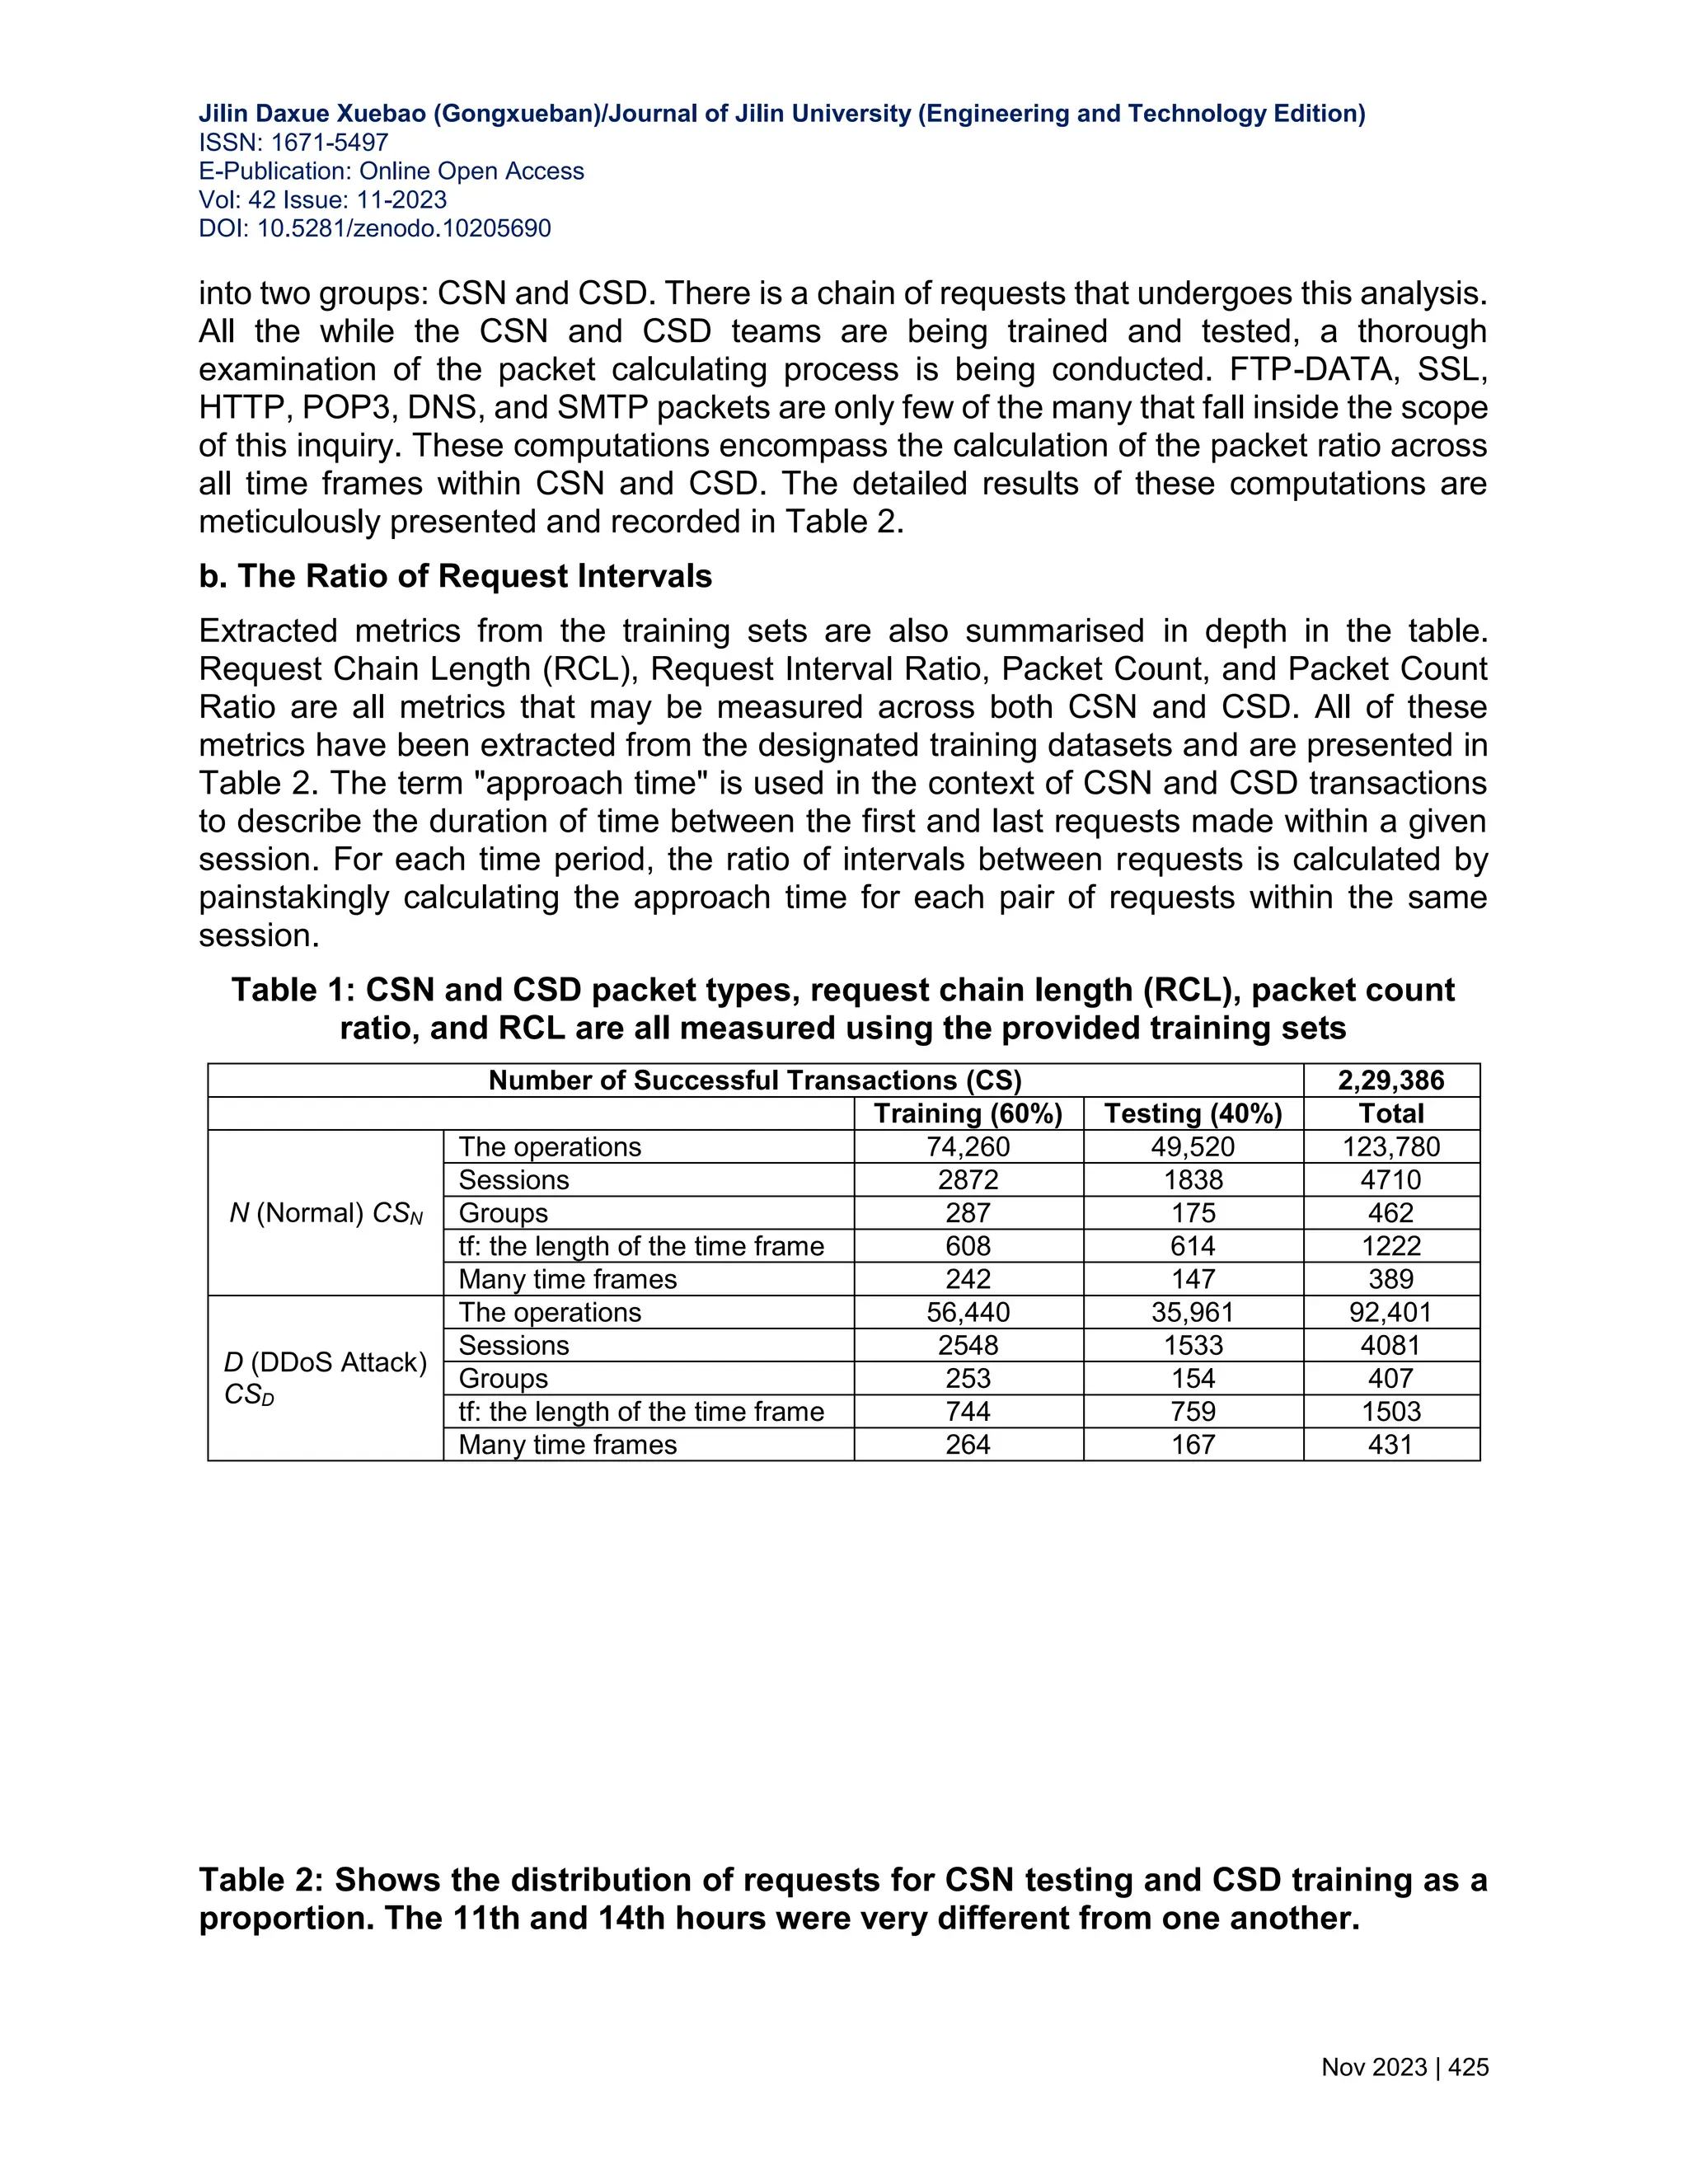
![Jilin Daxue Xuebao (Gongxueban)/Journal of Jilin University (Engineering and Technology Edition) ISSN: 1671-5497 E-Publication: Online Open Access Vol: 42 Issue: 11-2023 DOI: 10.5281/zenodo.10205690 Nov 2023 | 424 The mean value derived from all the pair carry values is computed across the sequence of time frames within the training set CSN. Moreover, for every possible pairing that arises within the scope of this paper, the Absolute Deviation (rpsAD) of request pair support is explored. The sequence (pi∃ pi∈ rpsN ^ i=1,2,…,|rpsN|) is being evaluated in parallel on the request chain context rcc(pi). rcc(pi)= ∑ 𝑙𝑠𝑡𝑠𝑗(𝑝𝑖) |𝑇𝑆(𝐶𝑆𝑛)| 𝑗=1 |𝑇𝑆(𝐶𝑆𝑛)| + rpsAD (16) 5. OUTCOMES OF EXPERIMENTS AND PERFORMANCE EVALUATION The tests have come to a close to evaluate the suggested model ARTP's, resilience, process complexity, Scalability and detection accuracy. 5.1 Experimental Results To simulate application layer DDoS attack scenarios the framework LLDOS 2.0.2 [13, 14] is harnessed under both normal and attack conditions. For the testing phase, a total of 229,386 transactions are processed, encompassing both N (normal) and D (disruptive) transactions representative of DDoS attacks. 60% of this dataset has been set aside for training purposes, while the remaining 40% will be used for testing. Assessed independently using the CS dataset and each metric is generated, which comprises CSN (normal) and CSD (DDoS attack) instances. CSN comprises a total of 123,780 transactions, out of which 60 percent (74,260) are dedicated to training, and the remaining 40 percent (49,520) are reserved for testing. Sessions in the CSN [15] training and testing datasets are evenly divided into 1 minute and 10 second intervals. As a next step, the K-Means technique is applied separately to both the training and testing phases to establish the locations of any existing clusters. Similarly, the assault dataset CSD is divided into sessions and clusters using the same manner to facilitate training and testing. Additionally, temporal frames (as detailed in Sect. 3.1) are synthesized from the stream of sessions, subsequently defining the temporal scope of the CSN and CSD training and evaluation phases in table 1. 5.2 Request chain length (RCL) The request chain length is characterized by the maximum count of requests originating from a transaction. In fact, this concept is expanded in the CSN and CSD training environment to incorporate the typical length of requests recorded from clients within a time frame described as either an attack or a normal scenario. The goal is to better equip pupils to deal with difficulties in the actual world. A comprehensive overview of these details is meticulously presented in Table 2. a. Packet Count Ratio Within the training setting, the ratio of packet counts is calculated by tallying the total number of packets received during each interval along the request chain, which is split](https://image.slidesharecdn.com/30-240313101219-7f2f0a3e/75/WEB-BASED-APPLICATION-LAYER-DISTRIBUTED-DENIAL-OF-SERVICE-ATTACKS-A-DATA-DRIVEN-MACHINE-LEARNING-8-2048.jpg)
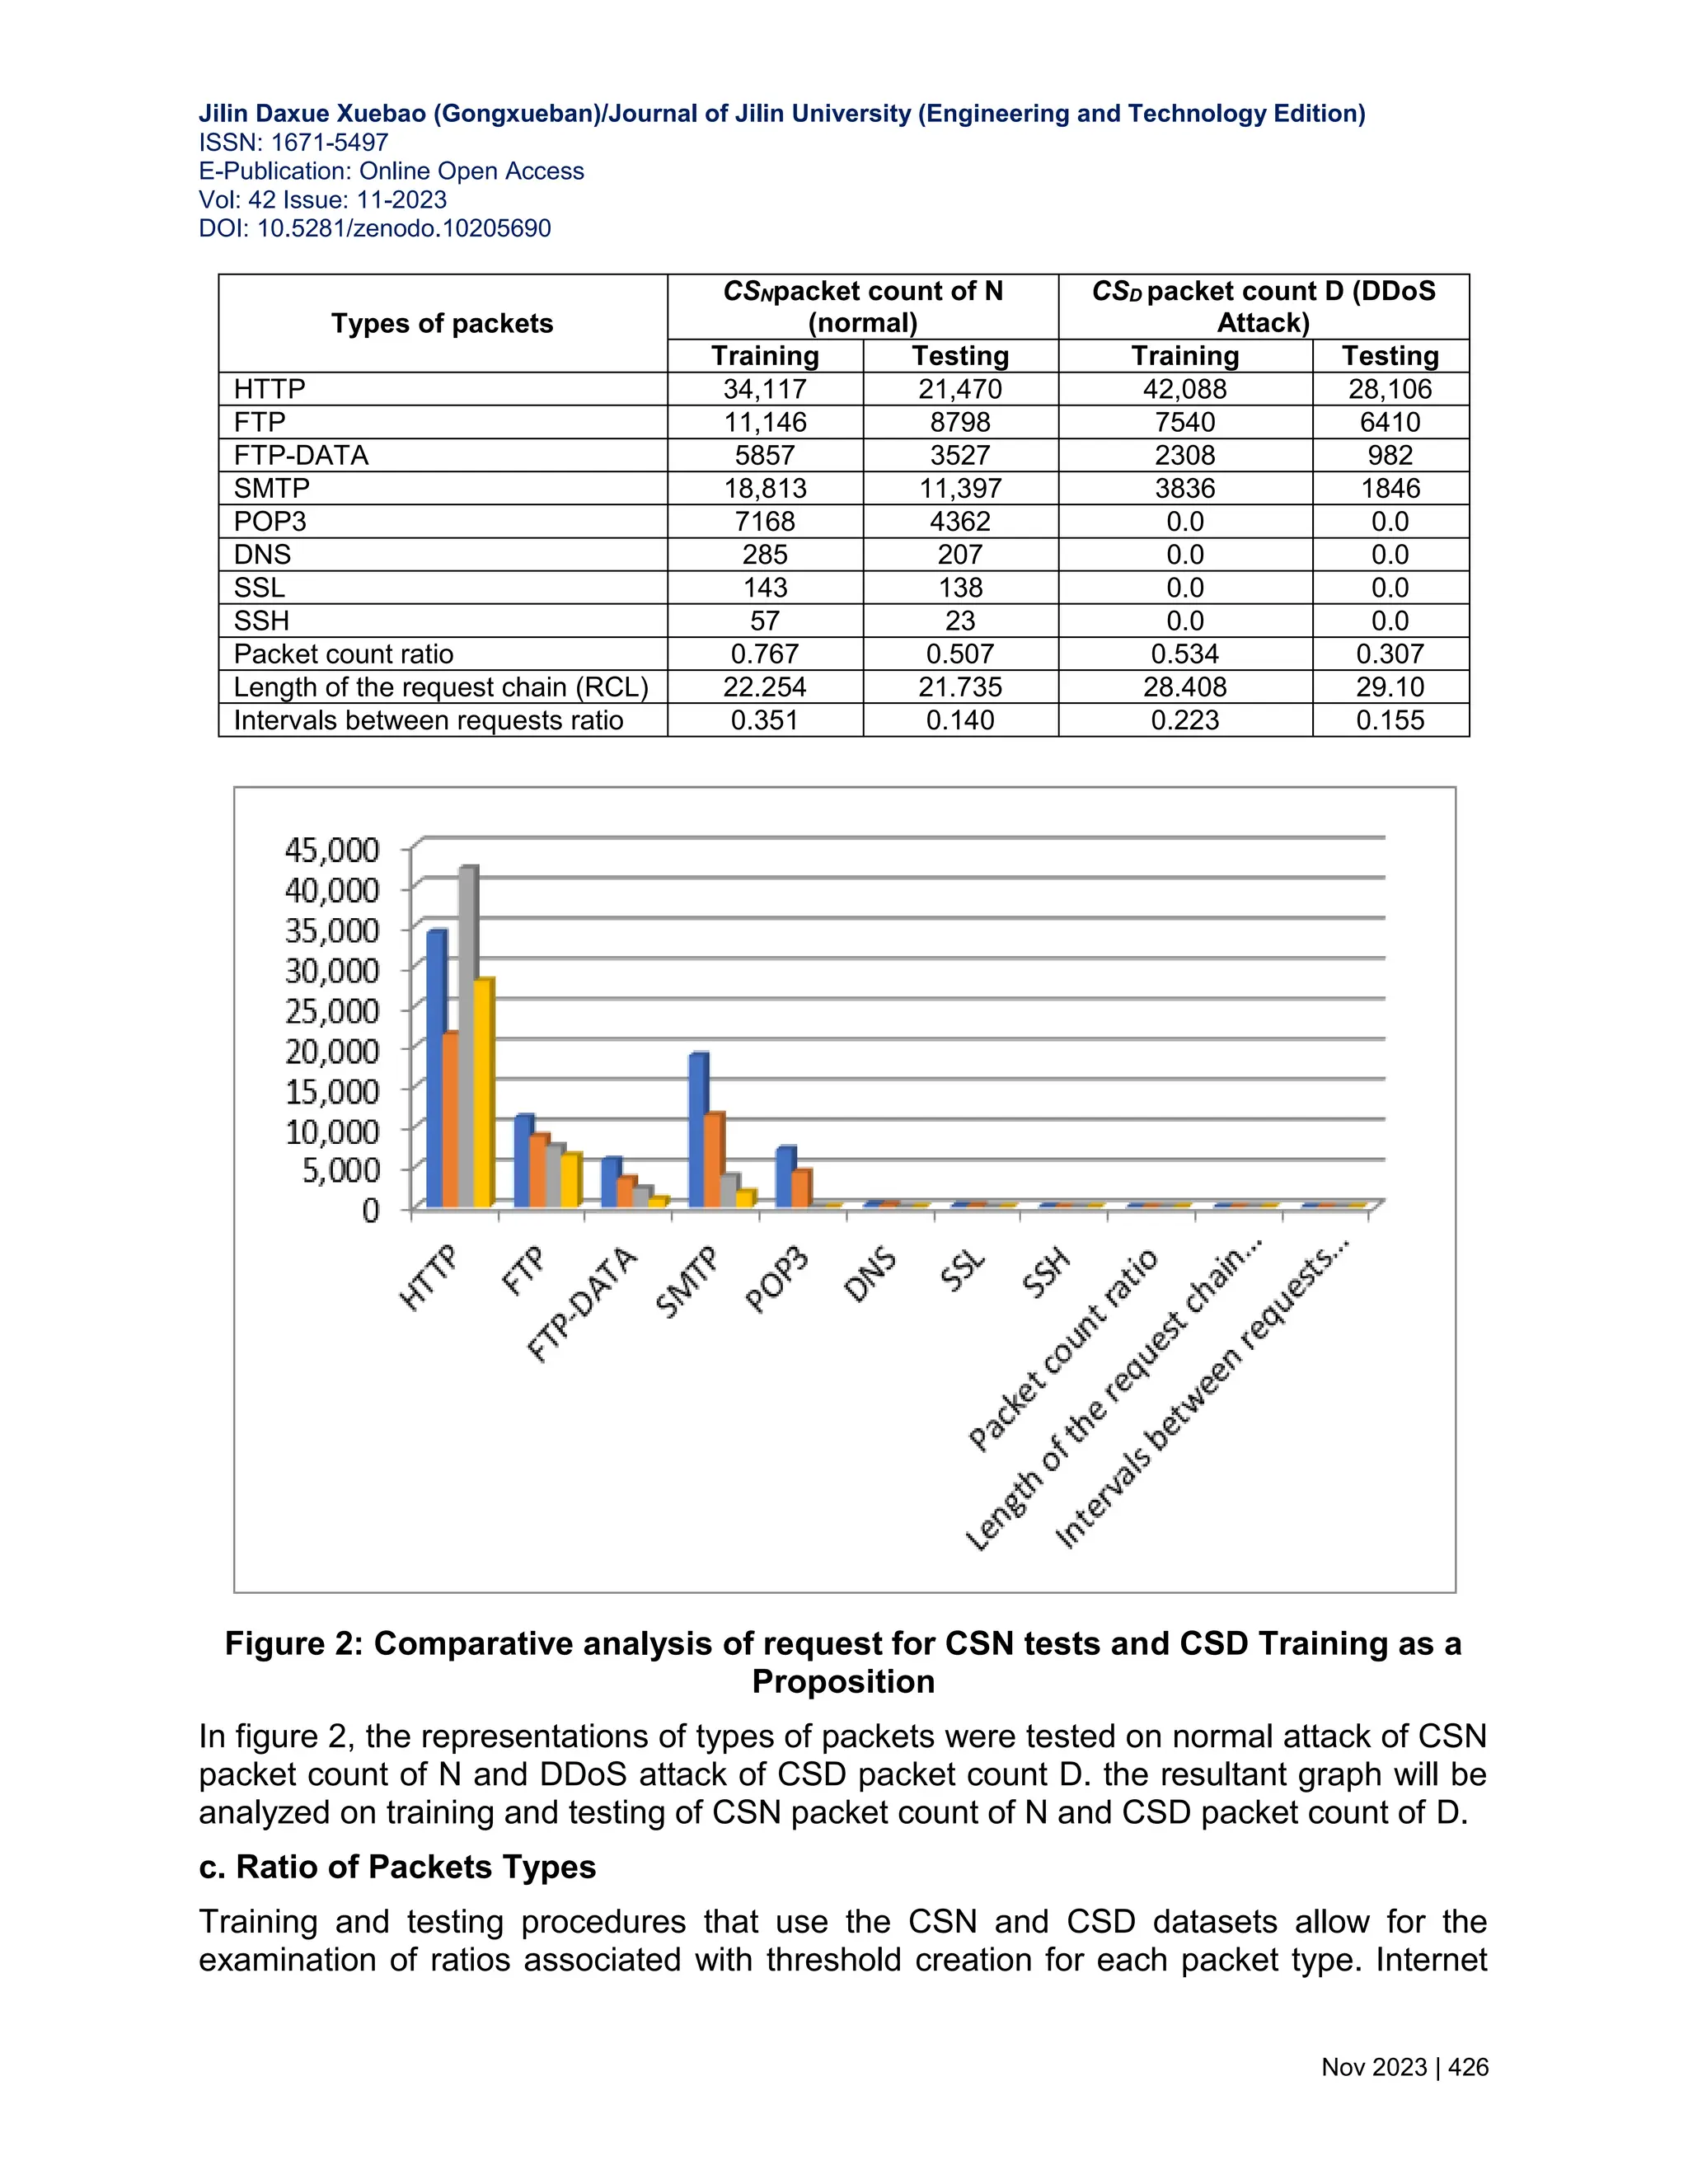
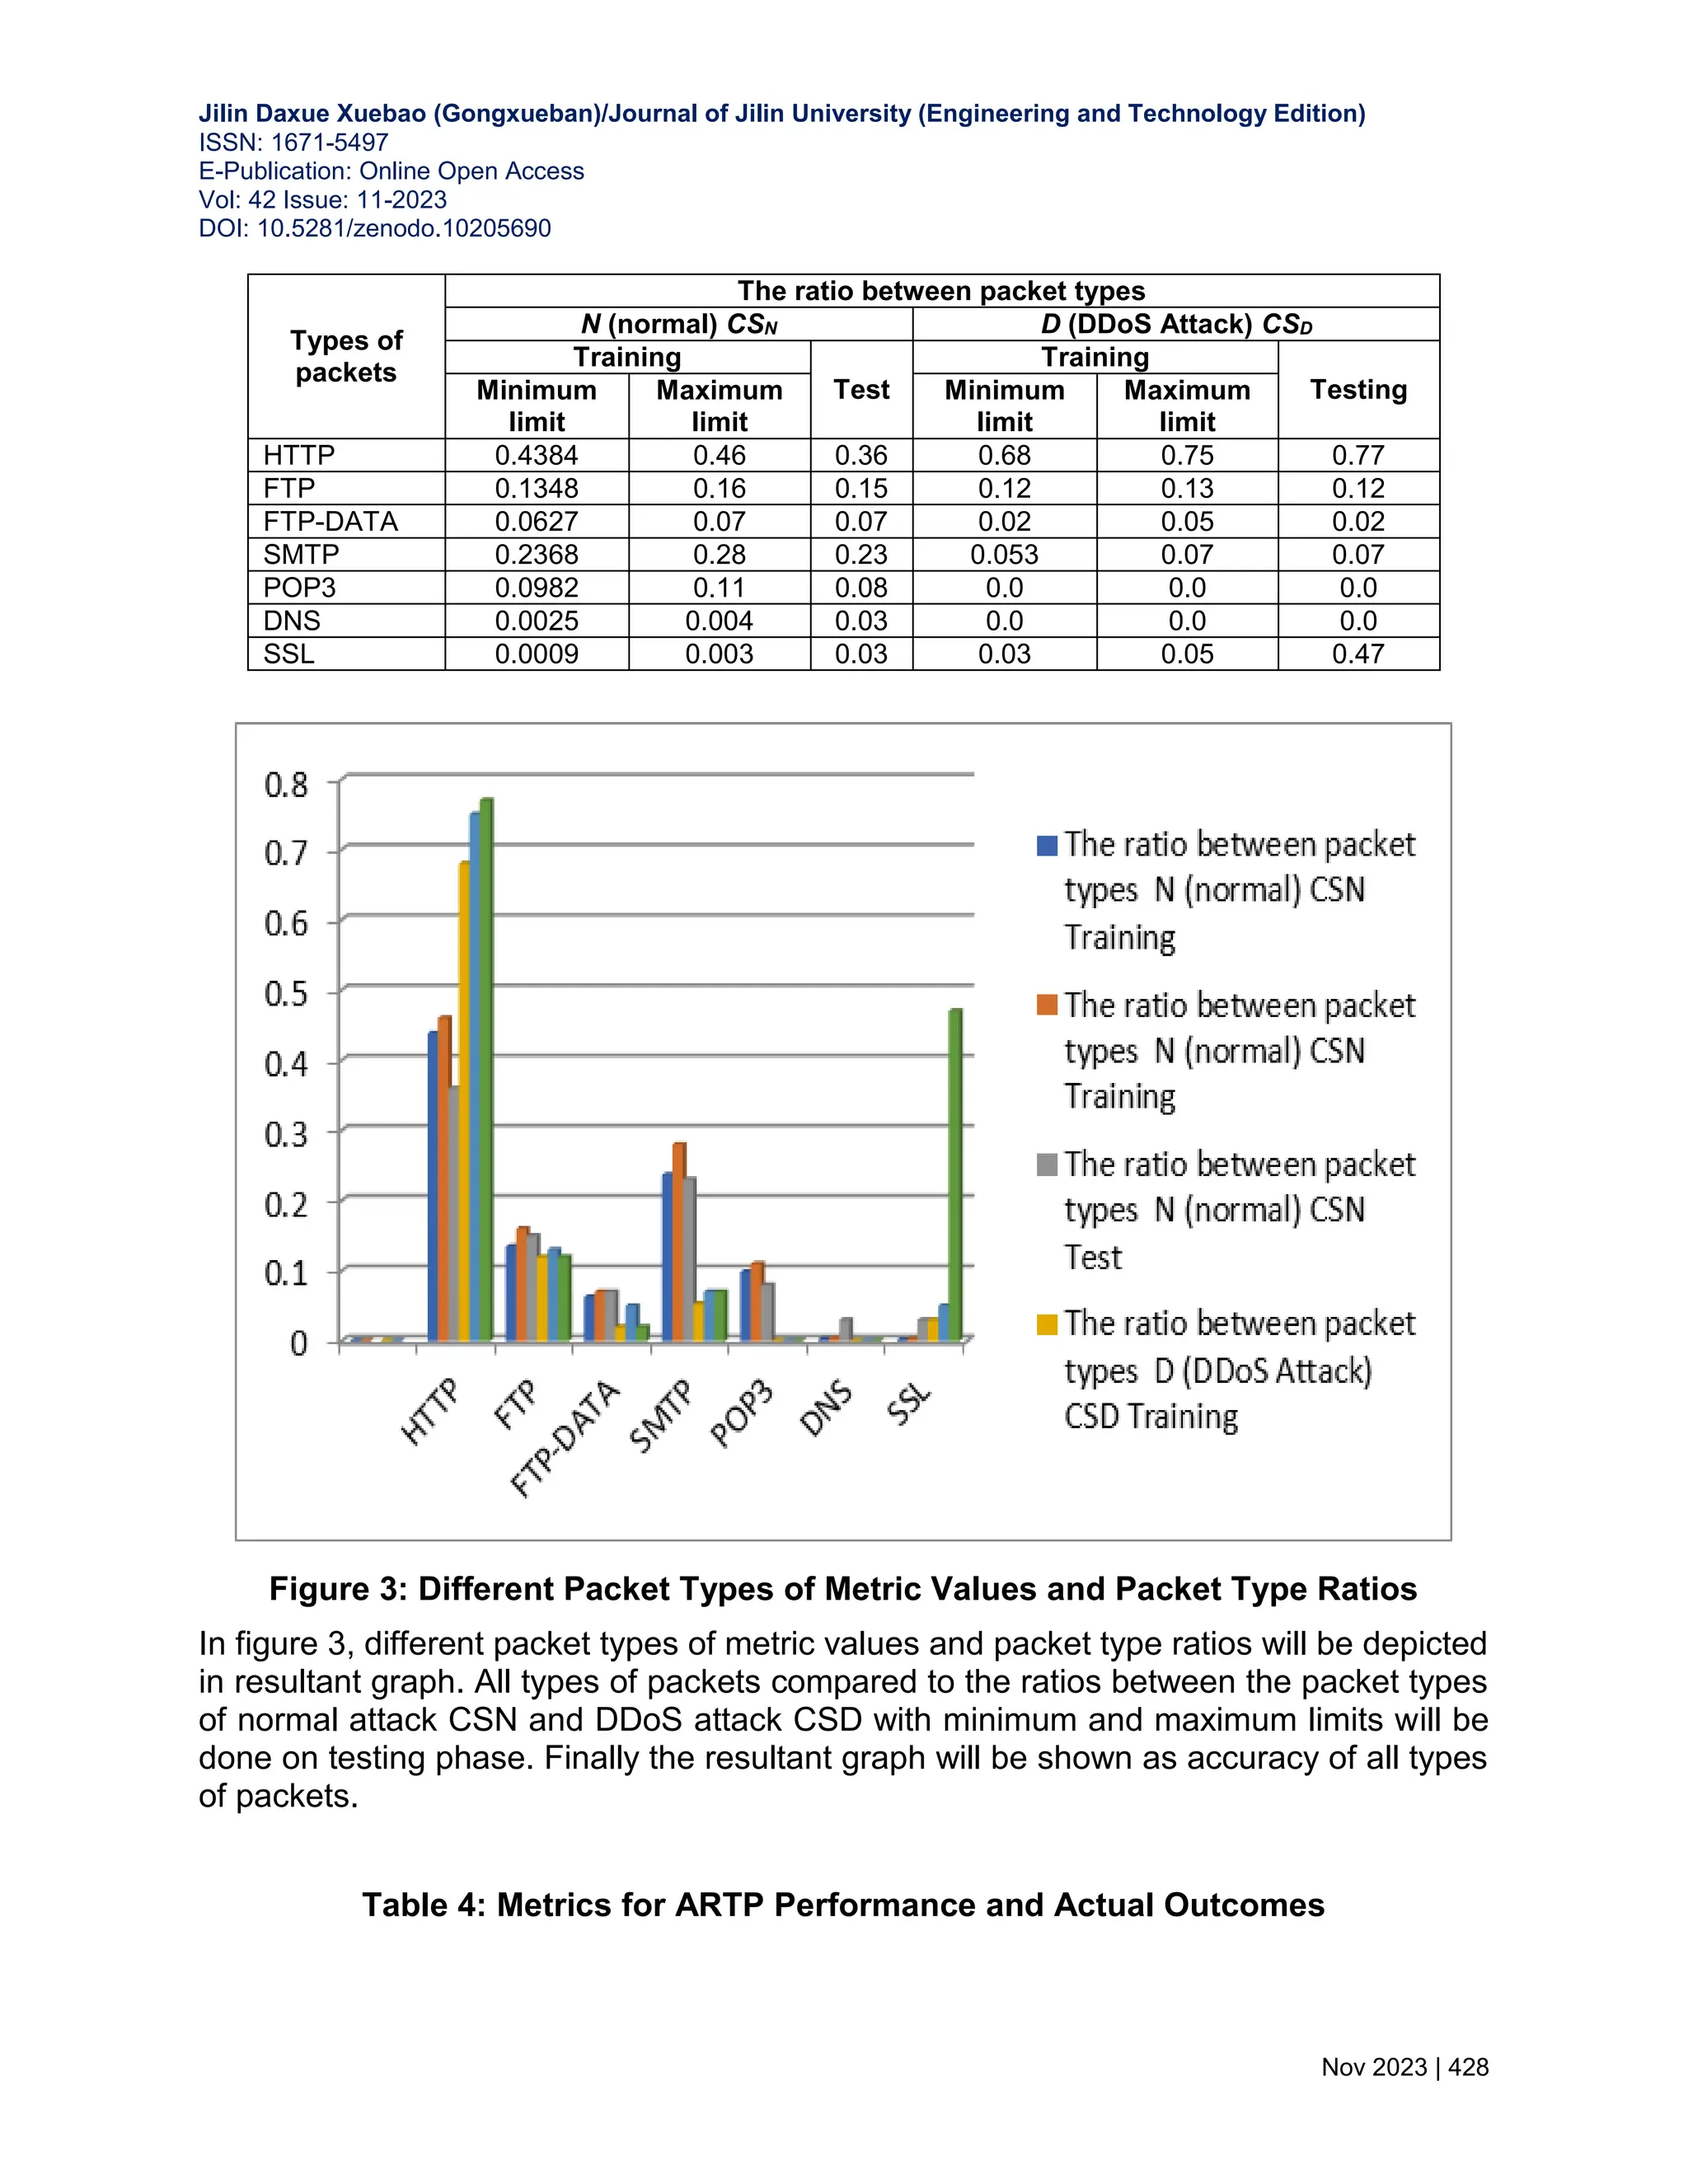
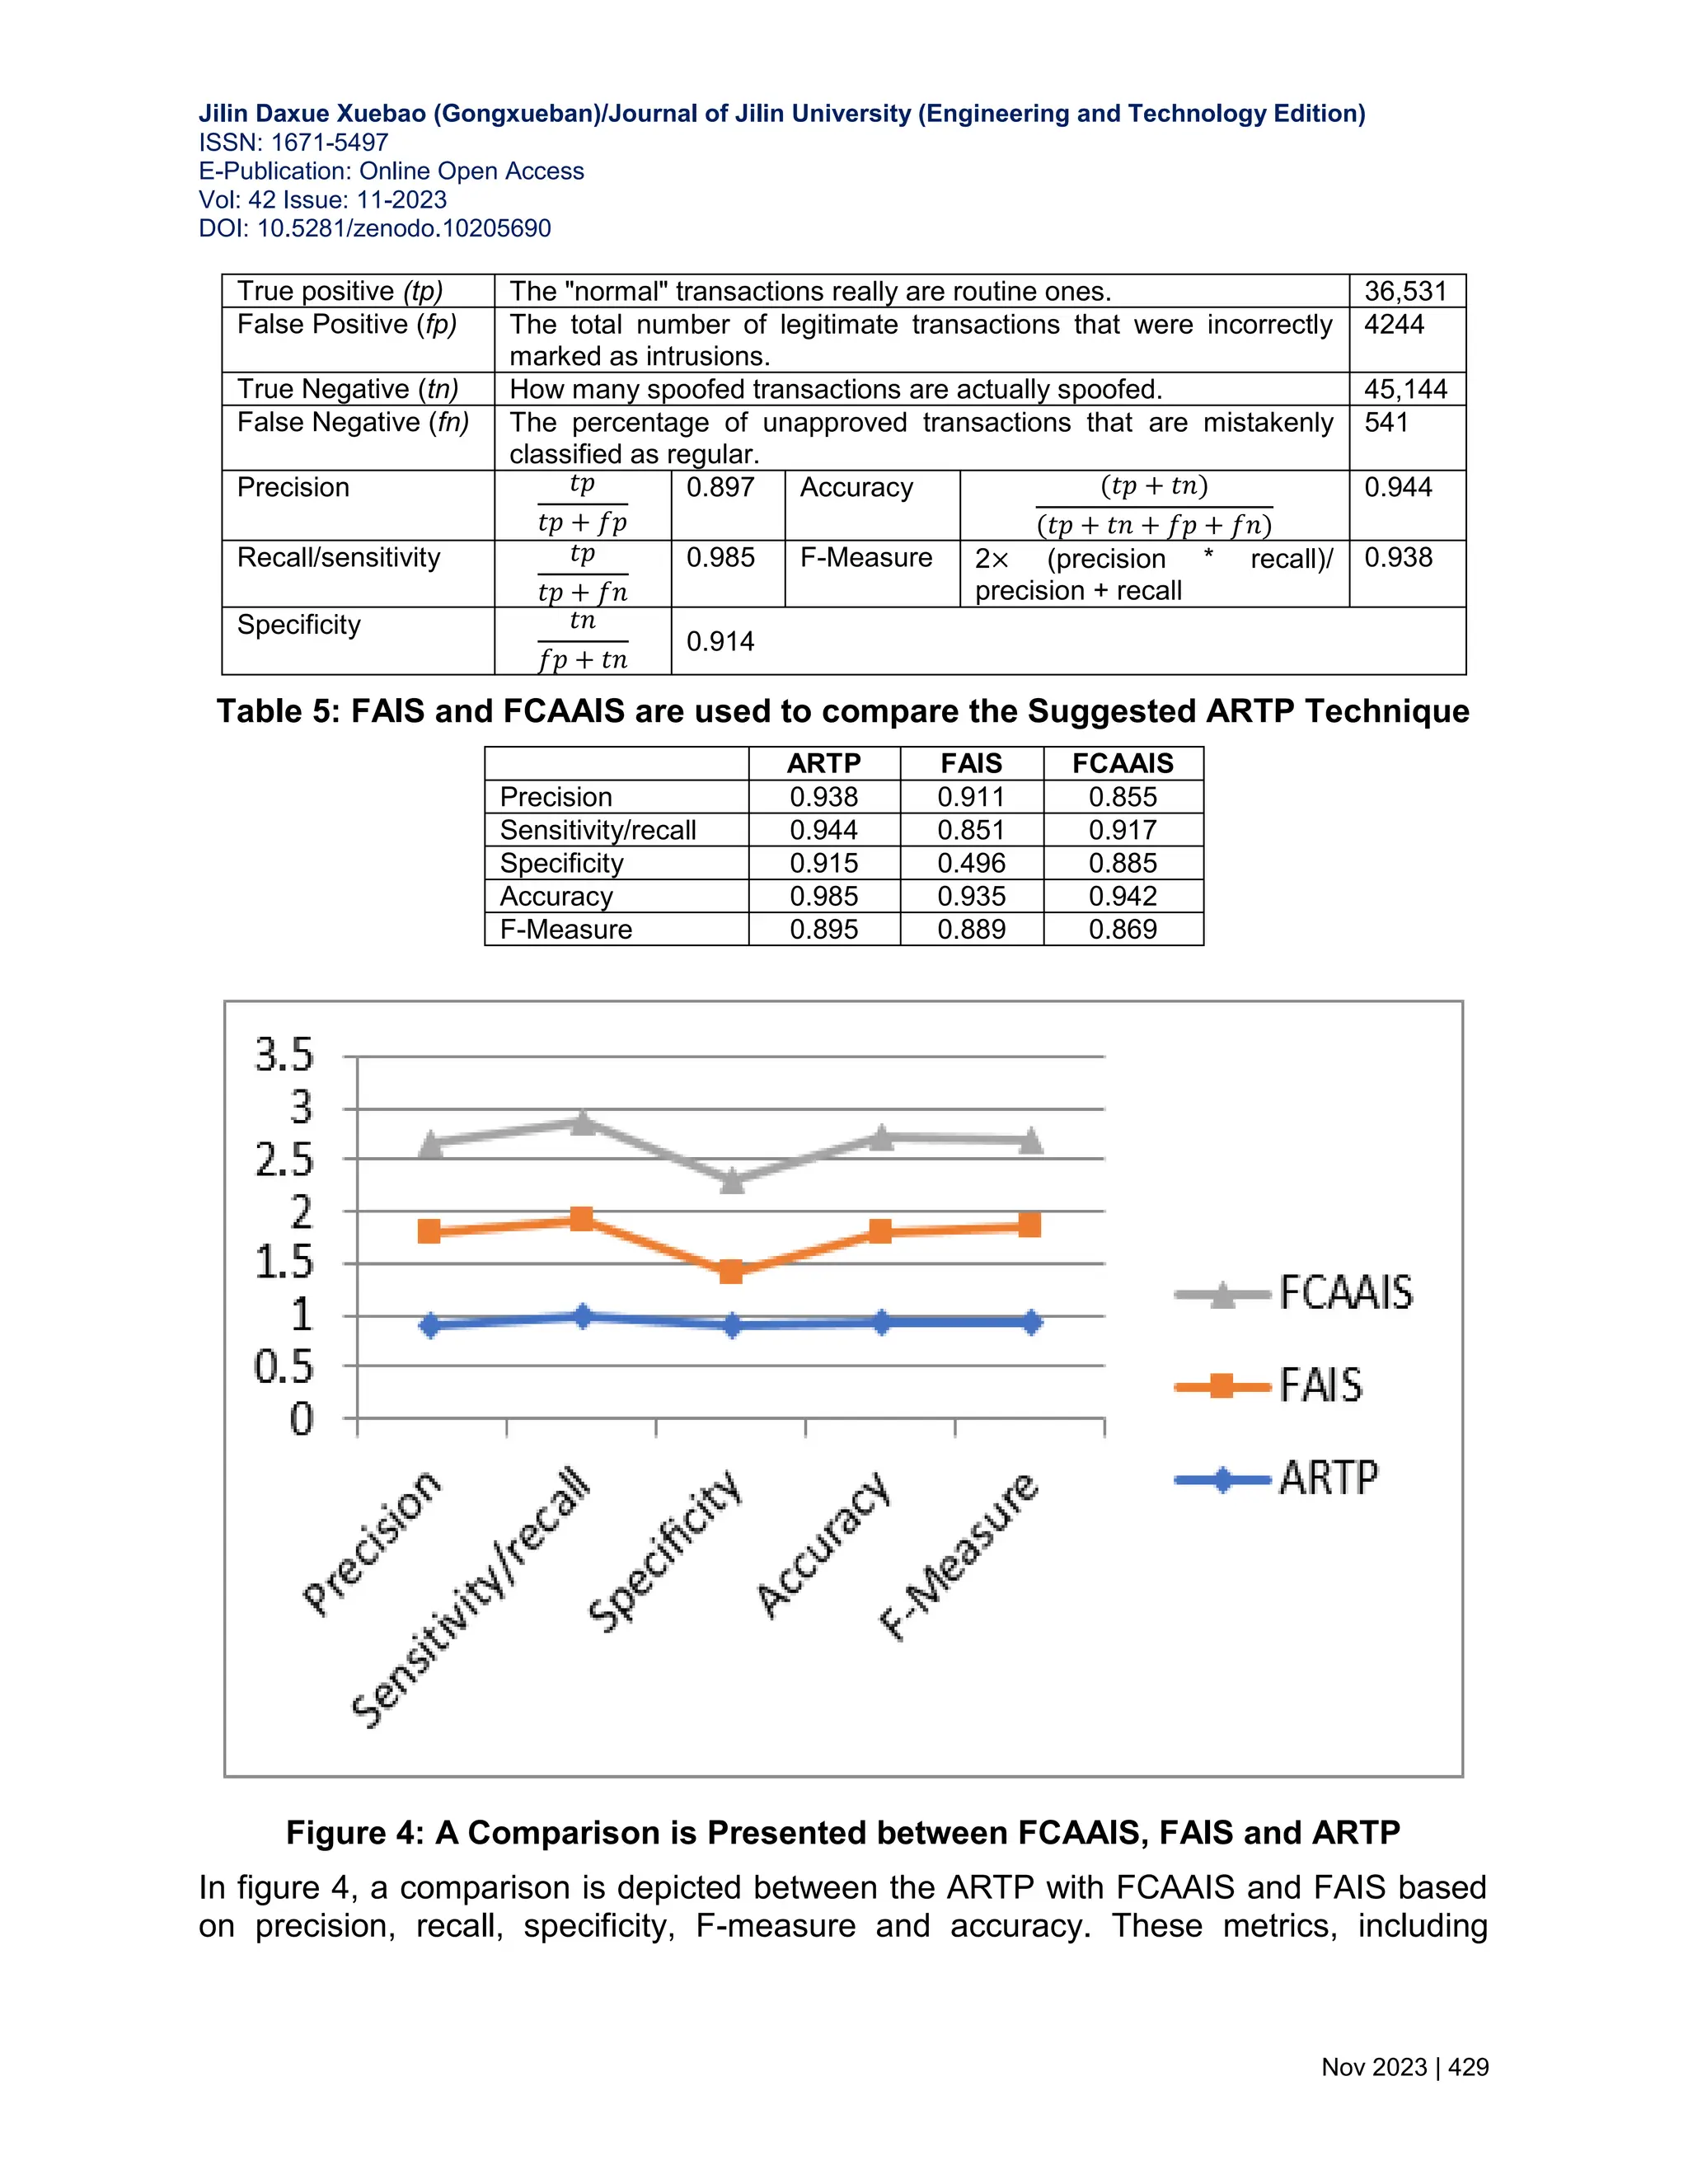
![Jilin Daxue Xuebao (Gongxueban)/Journal of Jilin University (Engineering and Technology Edition) ISSN: 1671-5497 E-Publication: Online Open Access Vol: 42 Issue: 11-2023 DOI: 10.5281/zenodo.10205690 Nov 2023 | 427 Protocol (HTTP), File Transfer Protocol (FTP) (including FTP-DATA), Simple Mail Transfer Protocol (SMTP), Post Office Protocol (POP), and Secure Sockets Layer (SSL) packets are all included here. The required ratios are detailed in Table 3 below. These tables owe a great deal to the CSN and CSD training sets. This set of ratios encapsulates dissimilar packet types constituting a substantial portion of commonly employed packet types within the application layer. 5.3 Performance Analysis Precision, sensitivity (true positive rate), specificity (true negative rate), accuracy, and F- measure are some of the key parameters that can be used to assess the usefulness of ARTP's detection capabilities. Quantitative parameters can include things like accuracy, sensitivity (the proportion of correct diagnoses), and specificity (the proportion of incorrect diagnoses). Similarly, a quantitative parameter is specificity. As showcased in Table 5, this procedure's statistics offer insights into its performance. Predicted requests are accurately classified as normal when they indeed are, and expected attacks are correctly labeled as attacks as well. Sensitivity, as determined in the experiments, guides the identification of true positives projected as positive outcomes. Meanwhile, true negatives that are accurately anticipated as negatives are attributed to specificity. Accuracy, signifying the duration required for precise request classification, is also a notable measure. In other words, the evaluation shows a lower risk of misidentifying a normal condition as an attack than misclassifying an attack configuration as normal, hence the sensitivity rating is higher than the specificity rating. The evaluation shows that the sensitivity is greater than the specificity. An attack misclassified as a normal request has a 1-sensitivity rate of 0.0145, whereas misclassifying a normal request as an attack has a 1-specificity rate of 0.0859. There has been a significant performance boost across the board for each of these numbers. Consequently, it is reasonable to assert that the suggested ARTP demonstrates increased effectiveness in detecting attacks, as evident from the numerical performance metrics and practical observations documented in Table 4. In contrast, the FAIS [16] and FCAAIS [17] models are proposed for DDoS attack detection. Conducted on the same dataset, these models exhibit scalability and resilience in forecasting the scope of network DDoS attacks, achieving an approximate detection accuracy of 91%. However, when juxtaposed with the proposed ARTP model, these approaches encounter challenges stemming from process complexity, particularly in terms of the statistical metrics employed for performance calculation. Notably, as displayed in Table 5 and Fig. 4, the precision of our proposed ARTP model surpasses both FAIS and FCAAIS, exemplifying higher predictive accuracy. Table 3: The Metric's Values, as well as Packet type Ratios for Different Packet Types](https://image.slidesharecdn.com/30-240313101219-7f2f0a3e/75/WEB-BASED-APPLICATION-LAYER-DISTRIBUTED-DENIAL-OF-SERVICE-ATTACKS-A-DATA-DRIVEN-MACHINE-LEARNING-11-2048.jpg)