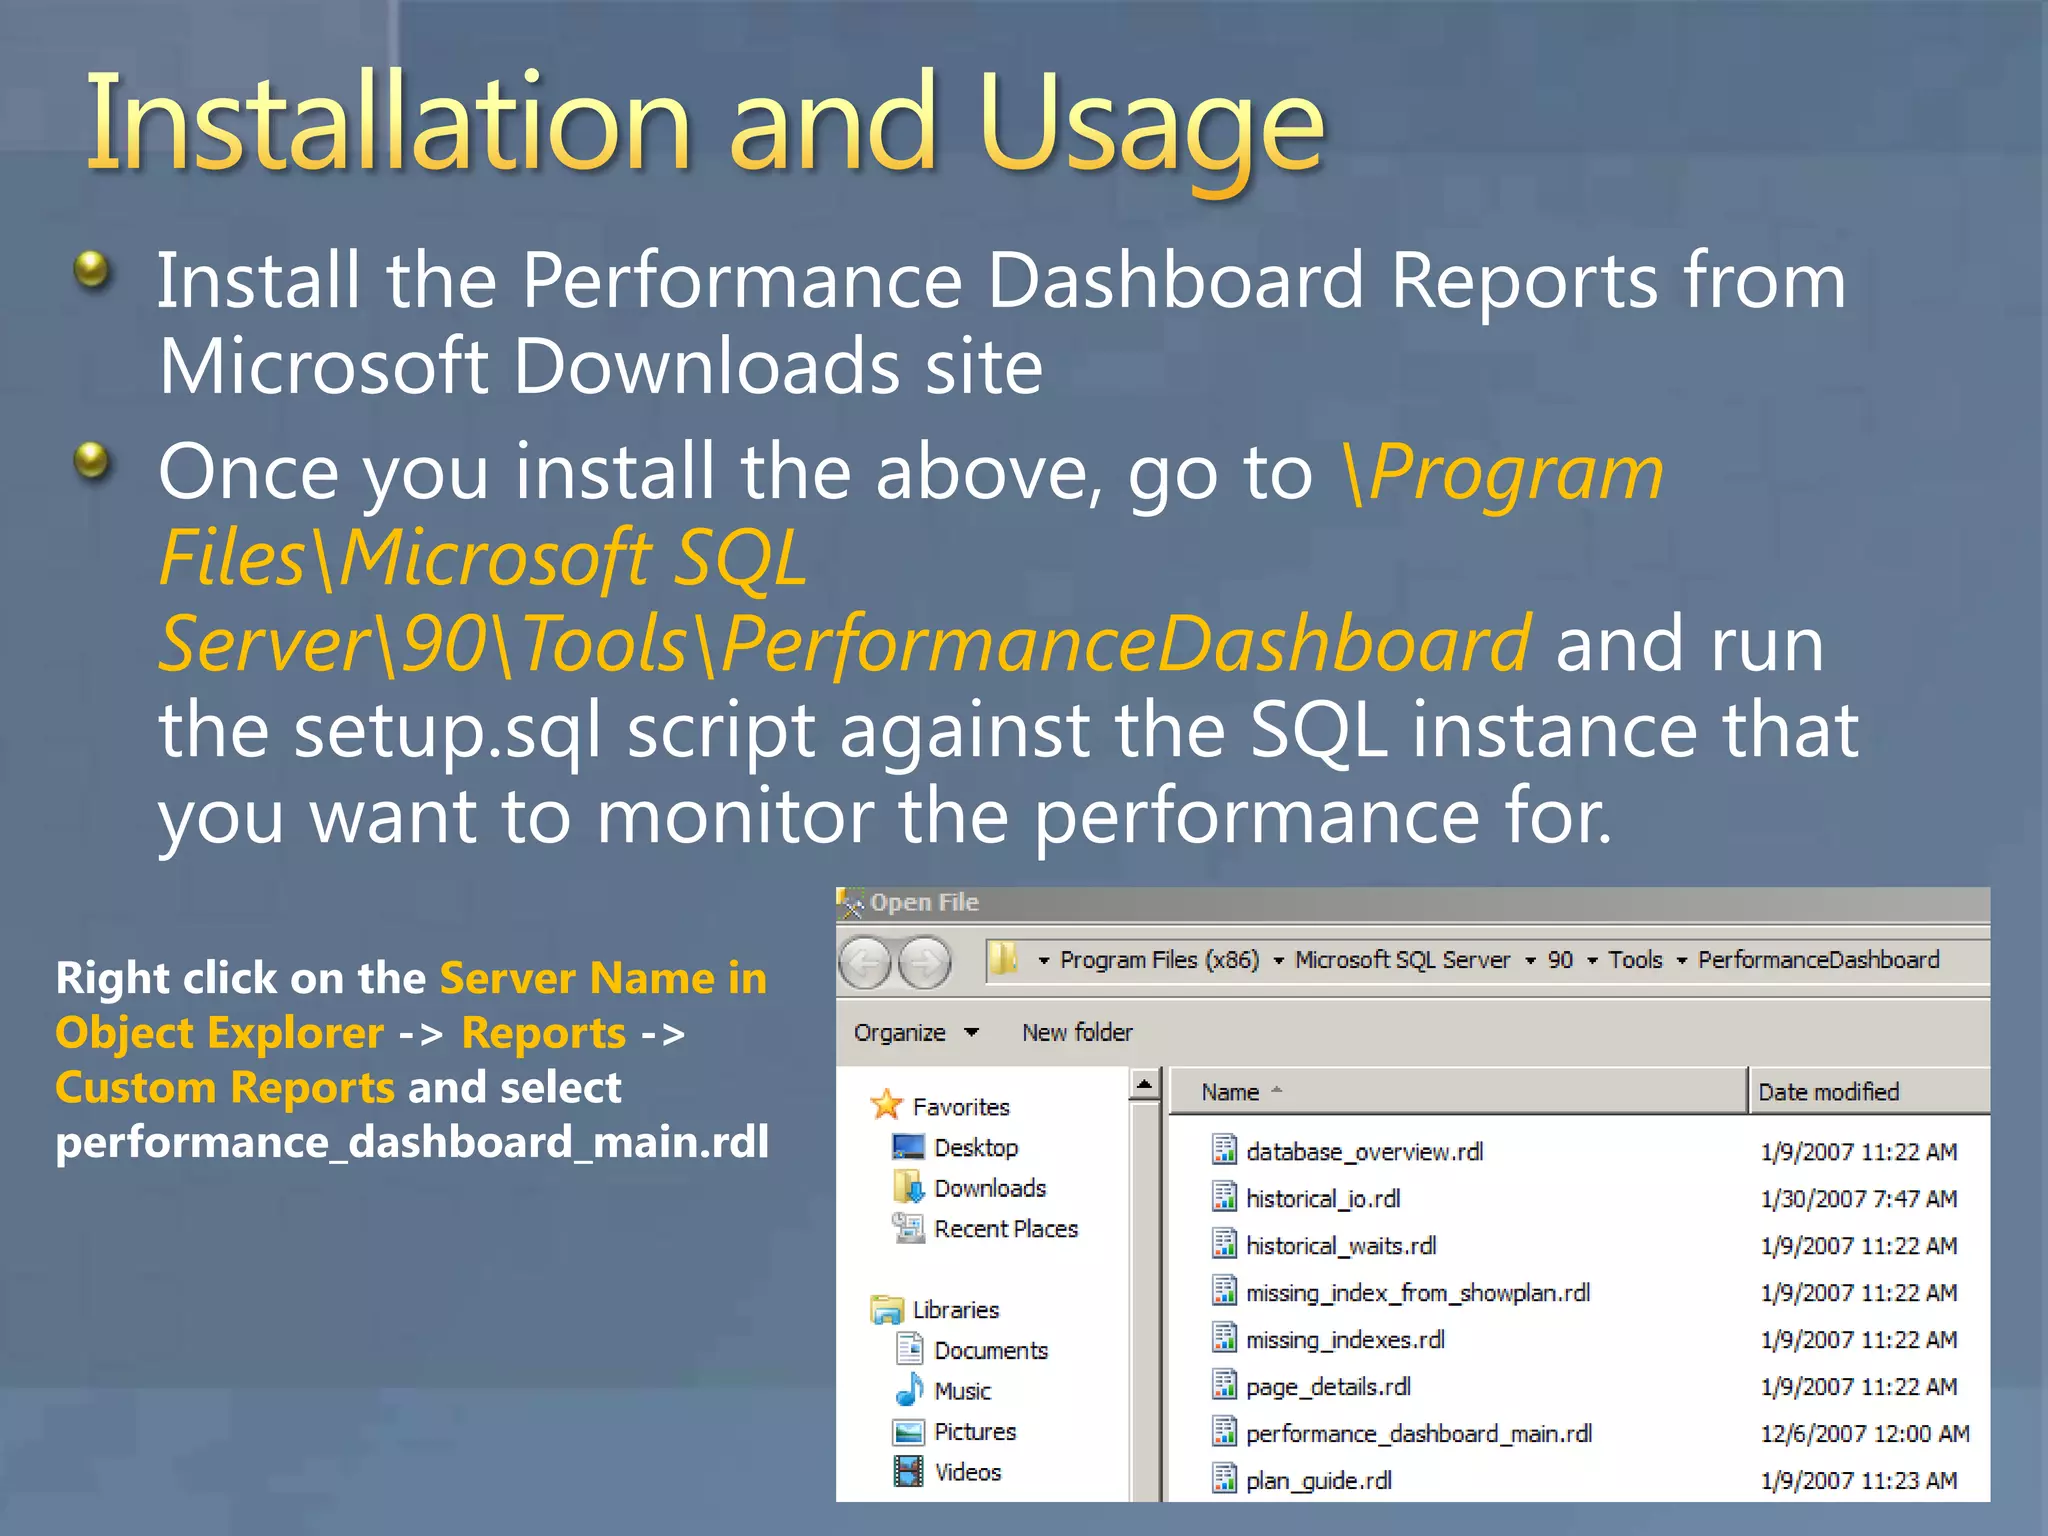
Understanding Performance Bottlenecks using Performance DashboardAmit Banerjee	Support Escalation EngineerMicrosoft CorporationSQL Server FAQ: http://blogs.msdn.com/sqlserverfaqTroubleshootingSQL: http://troubleshootingsql.comTwitter: @banerjeeamit | @MicrosoftSQLCSS
AgendaWhat is Performance DashboardInstallation and usageWhat can it be used for?Demo
What is Performance DashboardA set of RDLs deployed using custom reports feature in Management Studio which help resolve the most common performance issues, such as blocking, high CPU usage, latch contention and disk I/O bottleneck, without having to execute T-SQL queries.
Installation and UsageInstall the Performance Dashboard Reports from Microsoft Downloads siteOnce you install the above, go to \Program Files\Microsoft SQL Server\90\Tools\PerformanceDashboardand run the setup.sql script against the SQL instance that you want to monitor the performance for.Right click on the Server Name in Object Explorer -> Reports -> Custom Reports and select performance_dashboard_main.rdl
What can it be used for?CPU bottlenecks (which queries are consuming the most CPU and Plan for this query)IO bottlenecks (which queries are performing the most IO and Plan for this query).Index recommendations generated by the query optimizer (using Missing Indexes DMV feature)BlockingLatch contention and other Wait Types
What can I find?CPU usage based on Ring Buffer outputBlocking information based on sys.dm_exec_requests outputAll hyperlinks allow various levels of drill-downs to get query-text and the query plan along with connection properties
What can I find?Dashboard Main report -> Click on the waits showing up with the highest count to get to this reportFurther drill-down is available using Session ID or Query-text columns
ReferencesDownload link: SQL Server 2005 Performance DashboardConfiguring Performance Dashboard for SQL Server 2008
© 2009 Microsoft Corporation. All rights reserved. Microsoft, Windows, Windows Vista and other product names are or may be registered trademarks and/or trademarks in the U.S. and/or other countries.The information herein is for informational purposes only and represents the current view of Microsoft Corporation as of the date of this presentation. Because Microsoft must respond to changing market conditions, it should not be interpreted to be a commitment on the part of Microsoft, and Microsoft cannot guarantee the accuracy of any information provided after the date of this presentation. MICROSOFT MAKES NO WARRANTIES, EXPRESS, IMPLIED OR STATUTORY, AS TO THE INFORMATION IN THIS PRESENTATION.

Understanding performance bottlenecks using performance dashboard

  • 1.
    Understanding Performance Bottlenecksusing Performance DashboardAmit Banerjee Support Escalation EngineerMicrosoft CorporationSQL Server FAQ: http://blogs.msdn.com/sqlserverfaqTroubleshootingSQL: http://troubleshootingsql.comTwitter: @banerjeeamit | @MicrosoftSQLCSS
  • 2.
    AgendaWhat is PerformanceDashboardInstallation and usageWhat can it be used for?Demo
  • 3.
    What is PerformanceDashboardA set of RDLs deployed using custom reports feature in Management Studio which help resolve the most common performance issues, such as blocking, high CPU usage, latch contention and disk I/O bottleneck, without having to execute T-SQL queries.
  • 4.
    Installation and UsageInstallthe Performance Dashboard Reports from Microsoft Downloads siteOnce you install the above, go to \Program Files\Microsoft SQL Server\90\Tools\PerformanceDashboardand run the setup.sql script against the SQL instance that you want to monitor the performance for.Right click on the Server Name in Object Explorer -> Reports -> Custom Reports and select performance_dashboard_main.rdl
  • 5.
    What can itbe used for?CPU bottlenecks (which queries are consuming the most CPU and Plan for this query)IO bottlenecks (which queries are performing the most IO and Plan for this query).Index recommendations generated by the query optimizer (using Missing Indexes DMV feature)BlockingLatch contention and other Wait Types
  • 6.
    What can Ifind?CPU usage based on Ring Buffer outputBlocking information based on sys.dm_exec_requests outputAll hyperlinks allow various levels of drill-downs to get query-text and the query plan along with connection properties
  • 7.
    What can Ifind?Dashboard Main report -> Click on the waits showing up with the highest count to get to this reportFurther drill-down is available using Session ID or Query-text columns
  • 8.
    ReferencesDownload link: SQLServer 2005 Performance DashboardConfiguring Performance Dashboard for SQL Server 2008
  • 9.
    © 2009 MicrosoftCorporation. All rights reserved. Microsoft, Windows, Windows Vista and other product names are or may be registered trademarks and/or trademarks in the U.S. and/or other countries.The information herein is for informational purposes only and represents the current view of Microsoft Corporation as of the date of this presentation. Because Microsoft must respond to changing market conditions, it should not be interpreted to be a commitment on the part of Microsoft, and Microsoft cannot guarantee the accuracy of any information provided after the date of this presentation. MICROSOFT MAKES NO WARRANTIES, EXPRESS, IMPLIED OR STATUTORY, AS TO THE INFORMATION IN THIS PRESENTATION.