This paper presents a novel biometric algorithm for iris recognition that combines discrete wavelet transform (DWT) frequency component fusion with enhanced iris images using adaptive histogram equalization. The method involves extracting the iris template and applying DWT to create features that are more robust against variations in positioning and orientation. The results demonstrate improved performance parameters compared to existing algorithms, making it effective for personal authentication.
![Rangaswamy Y & Raja K B International Journal of Image Processing (IJIP), Volume (10) : Issue (1) : 2016 22 The Biometric Algorithm based on Fusion of DWT Frequency Components of Enhanced Iris Image Rangaswamy Y ranga.ace@gmail.com Dept of ECE Alpha College of Engineering Bangalore, 5760077, India Raja K B raja_kb@yahoo.com Dept of ECE University visvesvaraya college of Engineering Bangalore, 560001, India Abstract The biometrics are used to authenticate a person effectively compared to conventional methods of identification. In this paper we propose the biometric algorithm based on fusion of Discrete Wavelet Transform(DWT) frequency components of enhanced iris image.The iris template is extracted from an eye image by considering horizontal pixels in an iris part.The iris template contrast is enhanced using Adaptive Histogram Equalization (AHE) and Histogram Equalization (HE).The DWT is applied on enhanced iris template.The features are formed by straight line fusion of low and high frequency coefficients of DWT.The Euclidian distance is used to compare final test features with database features. It is observed that the performance parameters are better in the case of proposed algorithm compared to existing algorithms. Keywords: Biometrics, Iris Recognition, DWT, Fusion, HE, AHE. 1. INTRODUCTION Biometric is a secured and reliable personal authentication system used in data access and business transactions. It uses inherent physiological and behavioral characteristics like face, fingerprint, palm print, signature, keystroke and gait of human beings for authentication of an individual which provides robust and stable features for recognition. Biometric system extracts distinguishing features from a template formed from mathematical representation of data set features of a biometric trait. Biometric recognition system operates on two modes (i) identification mode: where in a test sample from a biometric trait is compared against all the database template resulting in a one to many comparison to identify a individual(ii) verification mode: compares a test sample only with claimed individual with one to one comparison requires less computation time. Biometric system is characterized by stable and unique features for better recognition with reduced false acceptance and false rejection rate and optimum increase in success rate are achieved by selecting features that are invariant to translation, rotation and shift orientation of biometric traits. Iris is a unique and non invasive biometric trait used in personal authentication. Iris has a distinctive complex texture patterns like arching ligaments, furrows, crypts, rings and freckles which are stable and remains constant for a life time. The iris is characterized with epigenetic patterns which are genetically independent and producing unique features even for identical twins. Biometric recognition using iris is based on preprocessing steps (i) iris localization: determining inner and outer boundary of iris (ii) segmentation: extracting iris part from the localized eye image (iii) normalization: converting circular iris part into rectangular iris to extract desired features. The most of the commercial biometric system uses Daugman [1] iris recognition model which uses integro differential operator and hough transform for locating iris and 2D](https://image.slidesharecdn.com/ijip-1058-160606130649/75/The-Biometric-Algorithm-based-on-Fusion-of-DWT-Frequency-Components-of-Enhanced-Iris-Image-1-2048.jpg)
![Rangaswamy Y & Raja K B International Journal of Image Processing (IJIP), Volume (10) : Issue (1) : 2016 23 gabor filter complex feature for featue extraction. However, this daugman proposed iris recognition require more mathematical computation and time for recognition. Iris based biometric is widely used in secure access to data and control applications due to its stable, unique and features which are robust to external effects like illumination variations, spectacular reflections that occur while capturing eye images in visible and NIR light spectrum. Motivation: Access to data needs a authentication from the authorized user. The biometric authentication using physiological and behavioural traits provides better performance compared to traditional identification. The iris based recognition widely used in biometric system for its good reliability in terms of modern biometric constraints to a personal authentication of an individual. Contribution In this paper the features are generated using novel concept of straight line fusion of low and high frequency coefficients of DWT on enhanced iris image. The iris template extracted using morphological operations and connected component analysis is subjected to AHE which adaptively redistribute the pixel values on intensity threshold selected based on neighboring pixels of a selected region. The histogram equalization and DWT is applied on histogram enhanced iris image to form a features which are more robust to any changes in position and orientation of iris in an eye image Organization: The paper is organized into the following sections. Introduction to biometric system is given in Section 1. Related work is presented in section2. Proposed model is described in section 3. Algorithm of proposed model is given in Section 4. Section 5 discusses the performance analysis of the proposed model and conclusion is given in section 6. 2. RELATED WORK Li Ma et al., [2] have proposed iris recognition using key local variations in iris which are invariant to rotation and translation. The wavelet transform is used to analyze transient and texture features of iris. Discriminative features formed from local sharp variation points of iris image structure are extracted from intensity signal values. Exclusive OR operation is used for features matching. Araabi and Ahamad Poursaberi [3] proposed iris recognition in which iris is segmented based on morphological operations and normalized using Daughman rubber sheet model. The iris is enhanced by histogram equalization and then daubechies wavelet transform is applied for feature extraction. The features are matched using Euclidean distance. Prashanth et al., [4] proposed a technique of human identity authentication by iris verification using Integro-differential equation for iris localization and Daugman’s rubber sheet model for normalization. Integer wavelet transformation and Discrete Wavelet Transformations are used to extract the features from the normalized iris image. Matching between the test image and the database images is done using Hamming distance..Mrinalini et al., [5] Proposed a Binary Particle Swarm Optimization features for Iris Recognition. Triangular Discrete Cosine Transform and Radon transform is applied on iris template to detect frequency and curve features in an illumination variation Iris images. The features set are reduced in dimension using a binary particle optimization for a increased recognition rate. Gagan and Lalitha[6] Proposed reliable iris based biometric recognition which enhance iris feature by Adaptive Histogram Equalization, Image adjustment and image sharpening methods are used in pre processing . The Elliptical sector based DCT features are extracted from iris. An optimal feature is formed using a Binary Particle Swarm Optimization algorithm for good recognition rate. The combined use of Elliptical DCT features and BPSO gives better performance results. Radu et al.,[7] proposed 2D Gabor filter based feature extraction for iris recognition.The accuracy has been increased using complex texture of iris captured using multiple sets of 2D Gabor filter bank analysis. The proposed method gives better localized iris images with good recognition rate for near infrared and visible spectrum iris images.](https://image.slidesharecdn.com/ijip-1058-160606130649/75/The-Biometric-Algorithm-based-on-Fusion-of-DWT-Frequency-Components-of-Enhanced-Iris-Image-2-2048.jpg)
![Rangaswamy Y & Raja K B International Journal of Image Processing (IJIP), Volume (10) : Issue (1) : 2016 24 Albadarneh et al.,[8] described an iris based authentication using texture and shape features extracted with histogram of oriented gradients, combined features of gabor and discrete cosine transform and grey level co-occurrence matrix for recognition. Euclidian distance and Logistic Model Classifier are used for matching a test template with database for a better recognition rate. Nigam et al.,[9] described a biometric recognition using iris which has more discriminative characteristics. This recognition method uses features that are selected from different blocks of iris using block local binary pattern and relational measures capturing local iris features with radial and circumferential features which are robust against noise, illumination variations and camera- to-eye distance of iris images. The features are fused at score level for matching. Isnanto [10] proposed a method wherein the iris part is segmented from an eye image that resultant is iris template.The histogram equalization is used for extracting wavelet features. The energy values of haar and biorthogonal wavelet coefficients forms recognition features. The normalized Euclidian distance classifier is used for better recognition rate. Shashi Kumar et al., [11] described iris recognition system which segments an iris part from an eye image using morphological process. The Discrete Wavelet Transform is applied on segmented iris to get low frequency coefficients .Principal Component Analysis is used on these coefficients to derive final set of features. Different classifiers like SVM, RF and KNN are used for matching resulting in a better performance. Umer and Dhara [12] proposed Iris recognition system using inversion transform to detect outer boundary of sclera and iris .The circular Hough transform is used to find inner boundary of pupil with iris which provides effective localization of an iris from an eye image and the proposed method gives better recognition results tested with standard databases such as CASIA-iris V3,MMU1 and IITD. Podder et al., [13] developed iris recognition model based on localized iris obtained by removing eyelids and eye lashes that covers iris using radial suppression method. The features are extracted with one dimensional log gabor filter which produces optimum stable features for good recognition rate with less error rate compared to other existing methods. Yongqiang LI Proposed [14] iris recognition model based on global and local features of iris sub images extracted using maximum margin criterion and structure preserving projection algorithms which reduces higher dimension data into uniform low dimension data with retaining global structural information. The nearest neighbor is used for classification of iris images and voting method is used for iris recognition.](https://image.slidesharecdn.com/ijip-1058-160606130649/75/The-Biometric-Algorithm-based-on-Fusion-of-DWT-Frequency-Components-of-Enhanced-Iris-Image-3-2048.jpg)
![Rangaswamy Y & Raja K B International Journal of Image Processing (IJIP), Volume (10) : Issue (1) : 2016 25 3. PROPOSED MODEL The proposed Iris recognition model using pre-processing, AHE, HE, DWT and straight line fusion is as shown in Figure 1. FIGURE 1: Block diagram of Proposed Model. 3.1. Iris Database Iris is a region between sclera and pupil with unique features. CASIA V.I (Chinese Academy of Sciences Institute of Automation) iris database [15] is considered to test the proposed algorithm which contains 756 eye images of 108 persons with 7 images per person. The eye images are in gray scale with a size of 280x320. The seven images of each persons were collected in two sessions i.e. first three images in first session and next four images in the second session. The seven eye images of a person are shown in Figure 2. Iris Database Iris Template AHE HE DWT St. Line Fusion Iris Image Iris Template AHE HE DWT St. Line Fusion ED Decision LL LL LL LH HH FusionFusion LH HL HH](https://image.slidesharecdn.com/ijip-1058-160606130649/75/The-Biometric-Algorithm-based-on-Fusion-of-DWT-Frequency-Components-of-Enhanced-Iris-Image-4-2048.jpg)
![Rangaswamy Y & Raja K B International Journal of Image Processing (IJIP), Volume (10) : Issue (1) : 2016 26 FIGURE 2: Seven Samples of single person (CASIA V.1 database). 3.2 Iris Template 3.2.1 Pupil Detection: The iris is between outer boundary of the pupil and the inner boundary of sclera.The pupil is the darkest region in an eye image and can be approximated with suitable intensity threshold values. The connected component analysis which groups the pixels of similar intensity values after morphological operations is used to identify the centre and diameter of a pupil. The pupil is identified by setting pixel values above and below the diameter of a pupil as not a number (nan) as shown in Figure 3. 3.2.2 Horizontal portion of Iris: The pupil is used to detect horizontal portion of Iris from its both left and right boundary which forms horizontal portion of iris. Springer CASIA database analysis [16] predicts that iris radius varies between lower radius of 90 and higher radius of 125 from pupil centre. The iris template is created by considering 45 pixels from either side of the pupil boundary. The vertical portion of iris excluding pupil is removed using morphological operations to eliminate eye lid and eye lashes. The horizontal portion of iris on either sides of pupil is considered by taking 45 pixels from the boundary of pupil as shown in Figure 4.The left and right portion of iris are extracted and concatenated to create iris template with resize of 60*80 as shown in Figure 5. FIGURE 3: Pupil with Iris boundary. FIGURE 4: Horizontal Iris Portion. FIGURE 5: Iris template. 3.3 Adaptive Histogram Equalization It enhances the contrast of an image adaptively by applying histogram equalization on small regions of an image rather than entire region of an image [17]. The histogram equalization is applied on small regions and combined using bilinear interpolation for an entire image to eliminate boundaries of small regions. The AHE is applied on iris template to enhance contrast. The Iris template and corresponding AHE with their histograms are shown in Figure 6. The histogram of iris template has more number of pixels concentrated in a narrow bunch of intensity levels as shown in Figure 6(c). The number of pixels in AHE images has intensity values distributed widely in an intensity levels as shown in Figure 6(d). The intensity values of pixels are distributed widely which is similar to gaussian distribution in AHE compared to histogram of HE.](https://image.slidesharecdn.com/ijip-1058-160606130649/75/The-Biometric-Algorithm-based-on-Fusion-of-DWT-Frequency-Components-of-Enhanced-Iris-Image-5-2048.jpg)
![Rangaswamy Y & Raja K B International Journal of Image Processing (IJIP), Volume (10) : Issue (1) : 2016 27 (a) Iris template (b) Iris histogram (c) AHE (d) AHE Histogram FIGURE 6: AHE on Iris Template with histogram Plot. 3.4 Histogram Equalization Histogram Equalization is a image enhancement method used to increase the contrast of an image with equal intensity distribution of all pixels within the intensity range of pixel values. Histogram gives a plot of relative occurrence of intensity values with respect to the number of pixels in an image[18]. The histogram of an image with intensity values ranging from 0 to 255 is a given in equation (1) kk nrh =)( (1) kn = No pixels in an image with K th intensity value. kr = K th intensity level. )( krh = represents the histogram plot of K th intensity value = total no of pixels occurring in a image with K th intensity value. The probability of occurrence of intensity level kr is the ratio of the no of pixels in an image with th k intensity value to the total no of pixels in an image as given in equation (2) ( ) ( ) mxn n mxn rh rP kk k == (2) ( )krh = Histogram plot of K th intensity value mxn=size of an image= Total no of pixels in an image. The transfer function for an histogram equalization is given by equation (3) = ( )∑= k j jrP 1 (3) Where ( )1rP , ( )2rP , ( )3rP and ( )krP represents the probability occurrence of intensity values 1r , 2r and kr in an image. ( )krT = Represents the histogram equalization of K th intensity value The transfer function given in equation (3) transforms all pixels equally over entire intensity values to give good contrast for an image. The histogram equalization is applied on AHE iris template ( ) ( ) ( ) ( ) ( )kk rPrPrPrPrT .............321 +++=](https://image.slidesharecdn.com/ijip-1058-160606130649/75/The-Biometric-Algorithm-based-on-Fusion-of-DWT-Frequency-Components-of-Enhanced-Iris-Image-6-2048.jpg)
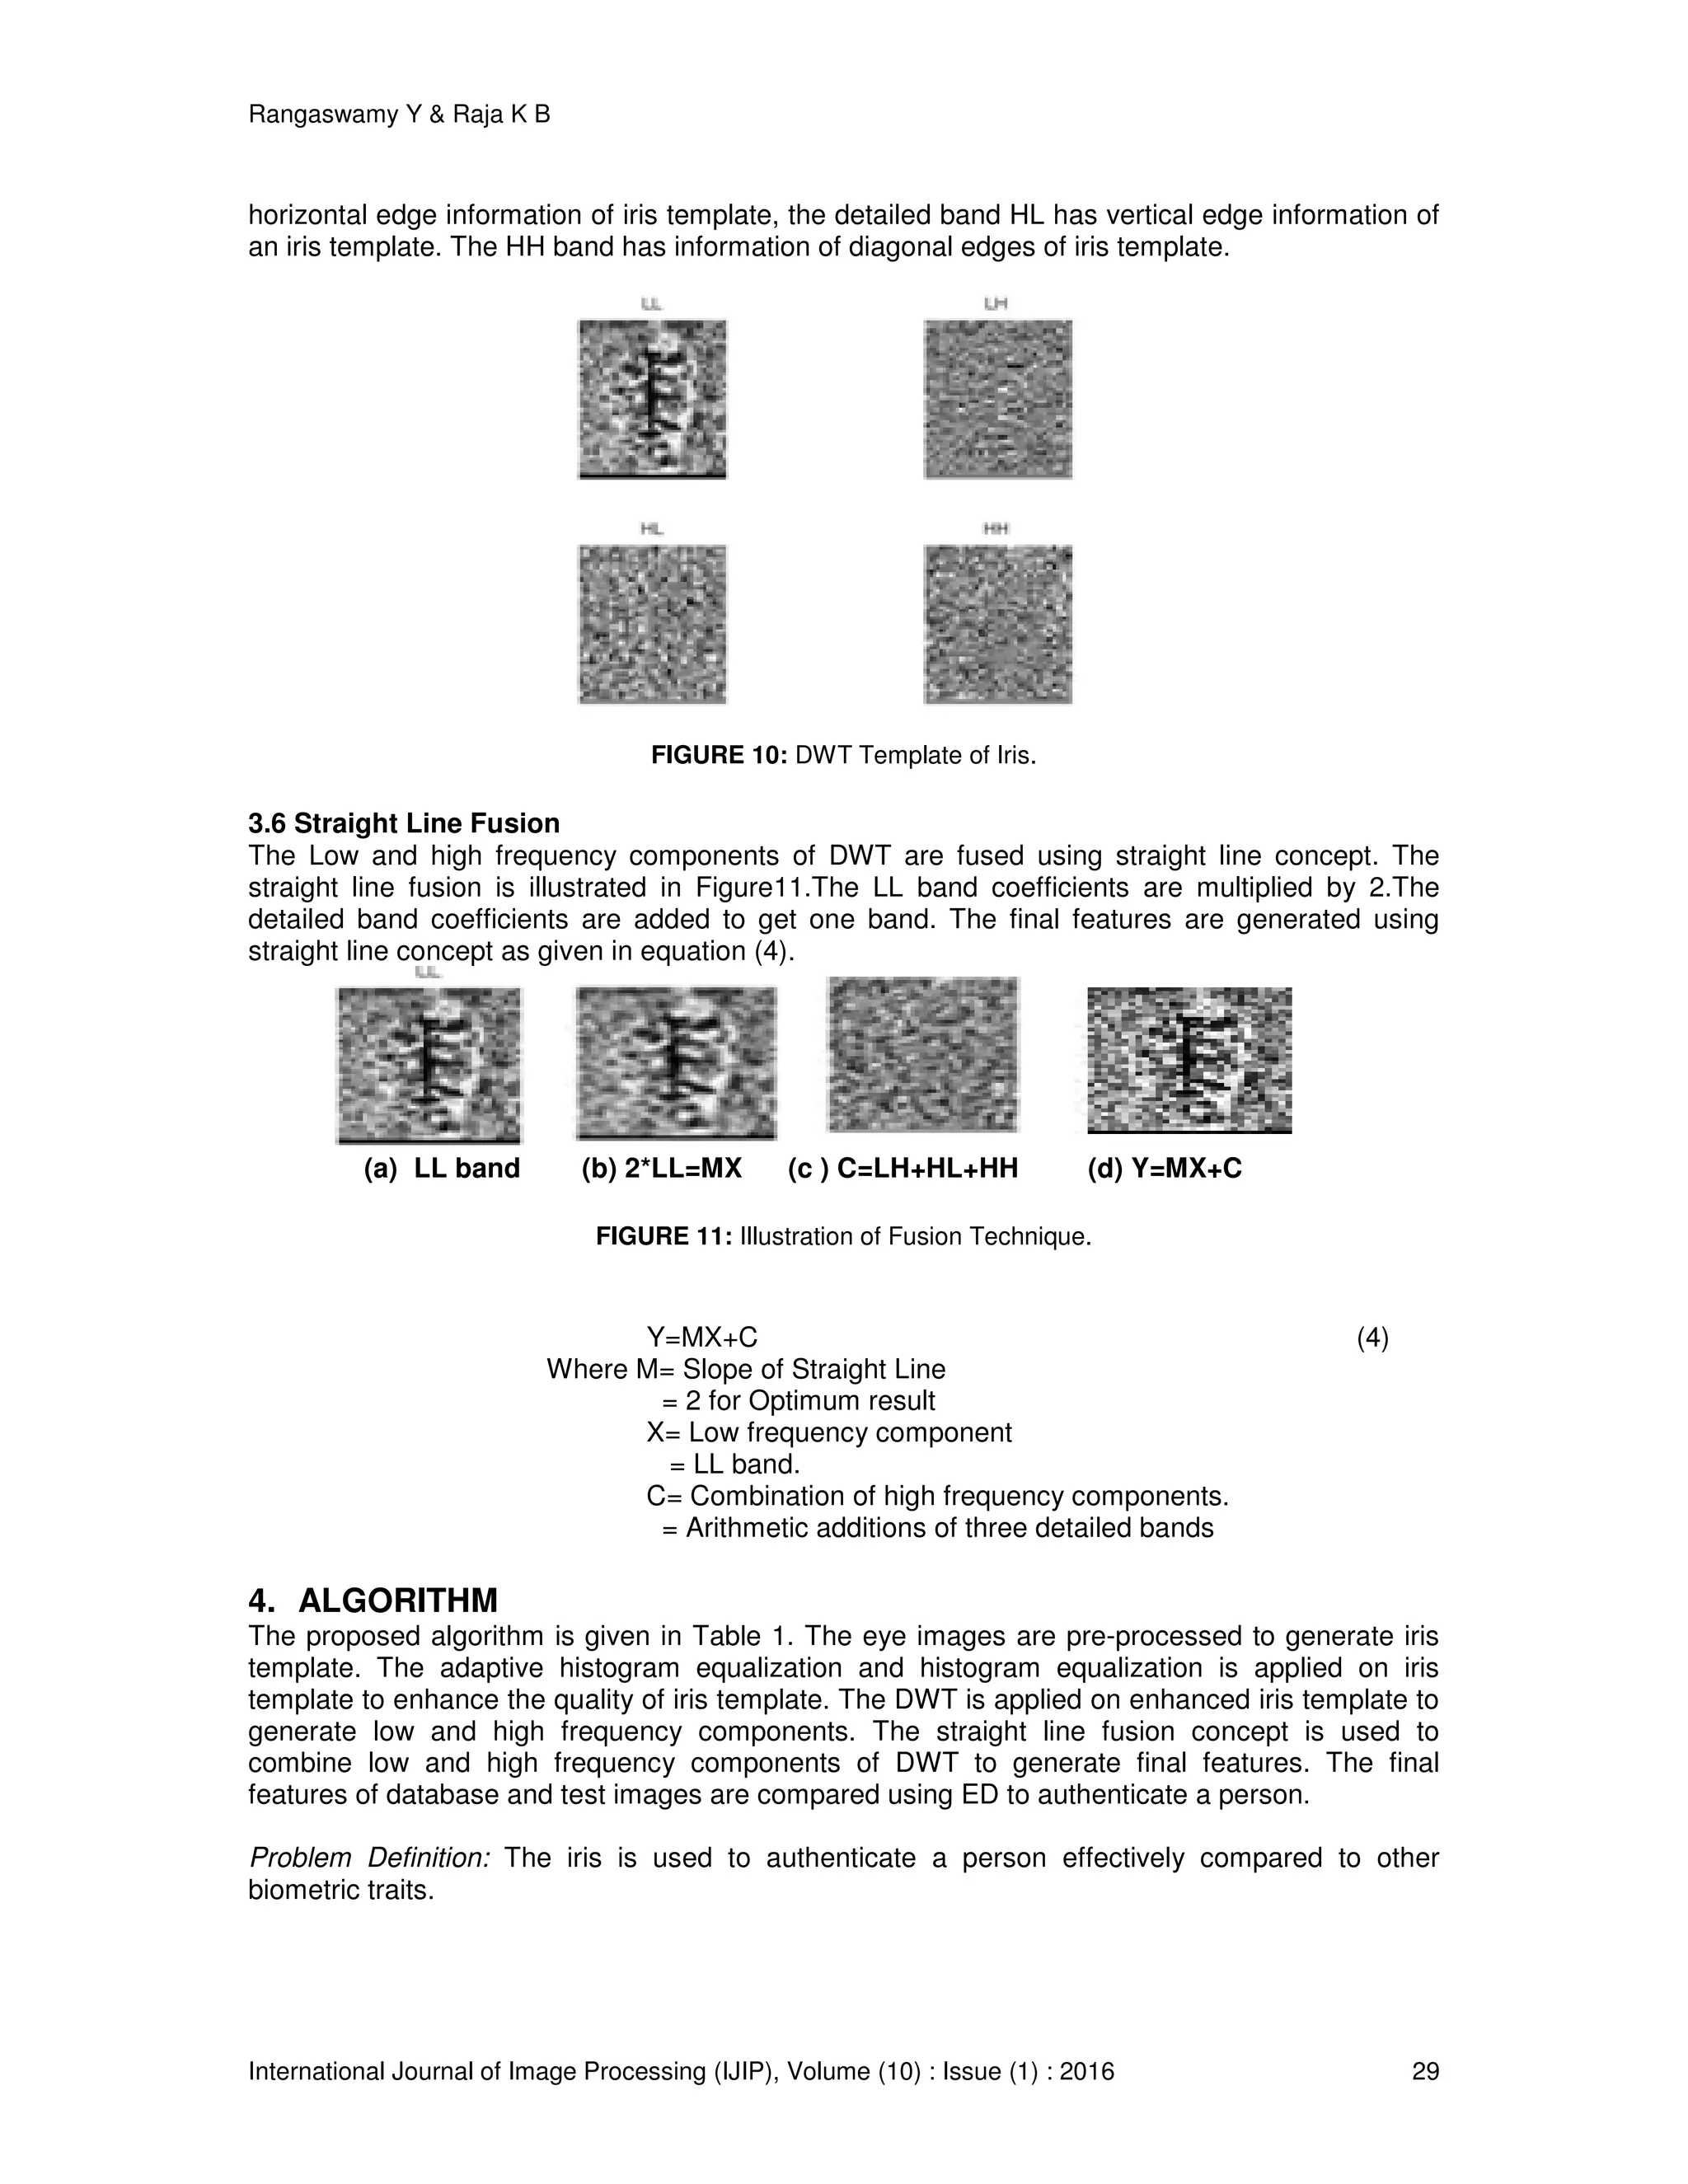
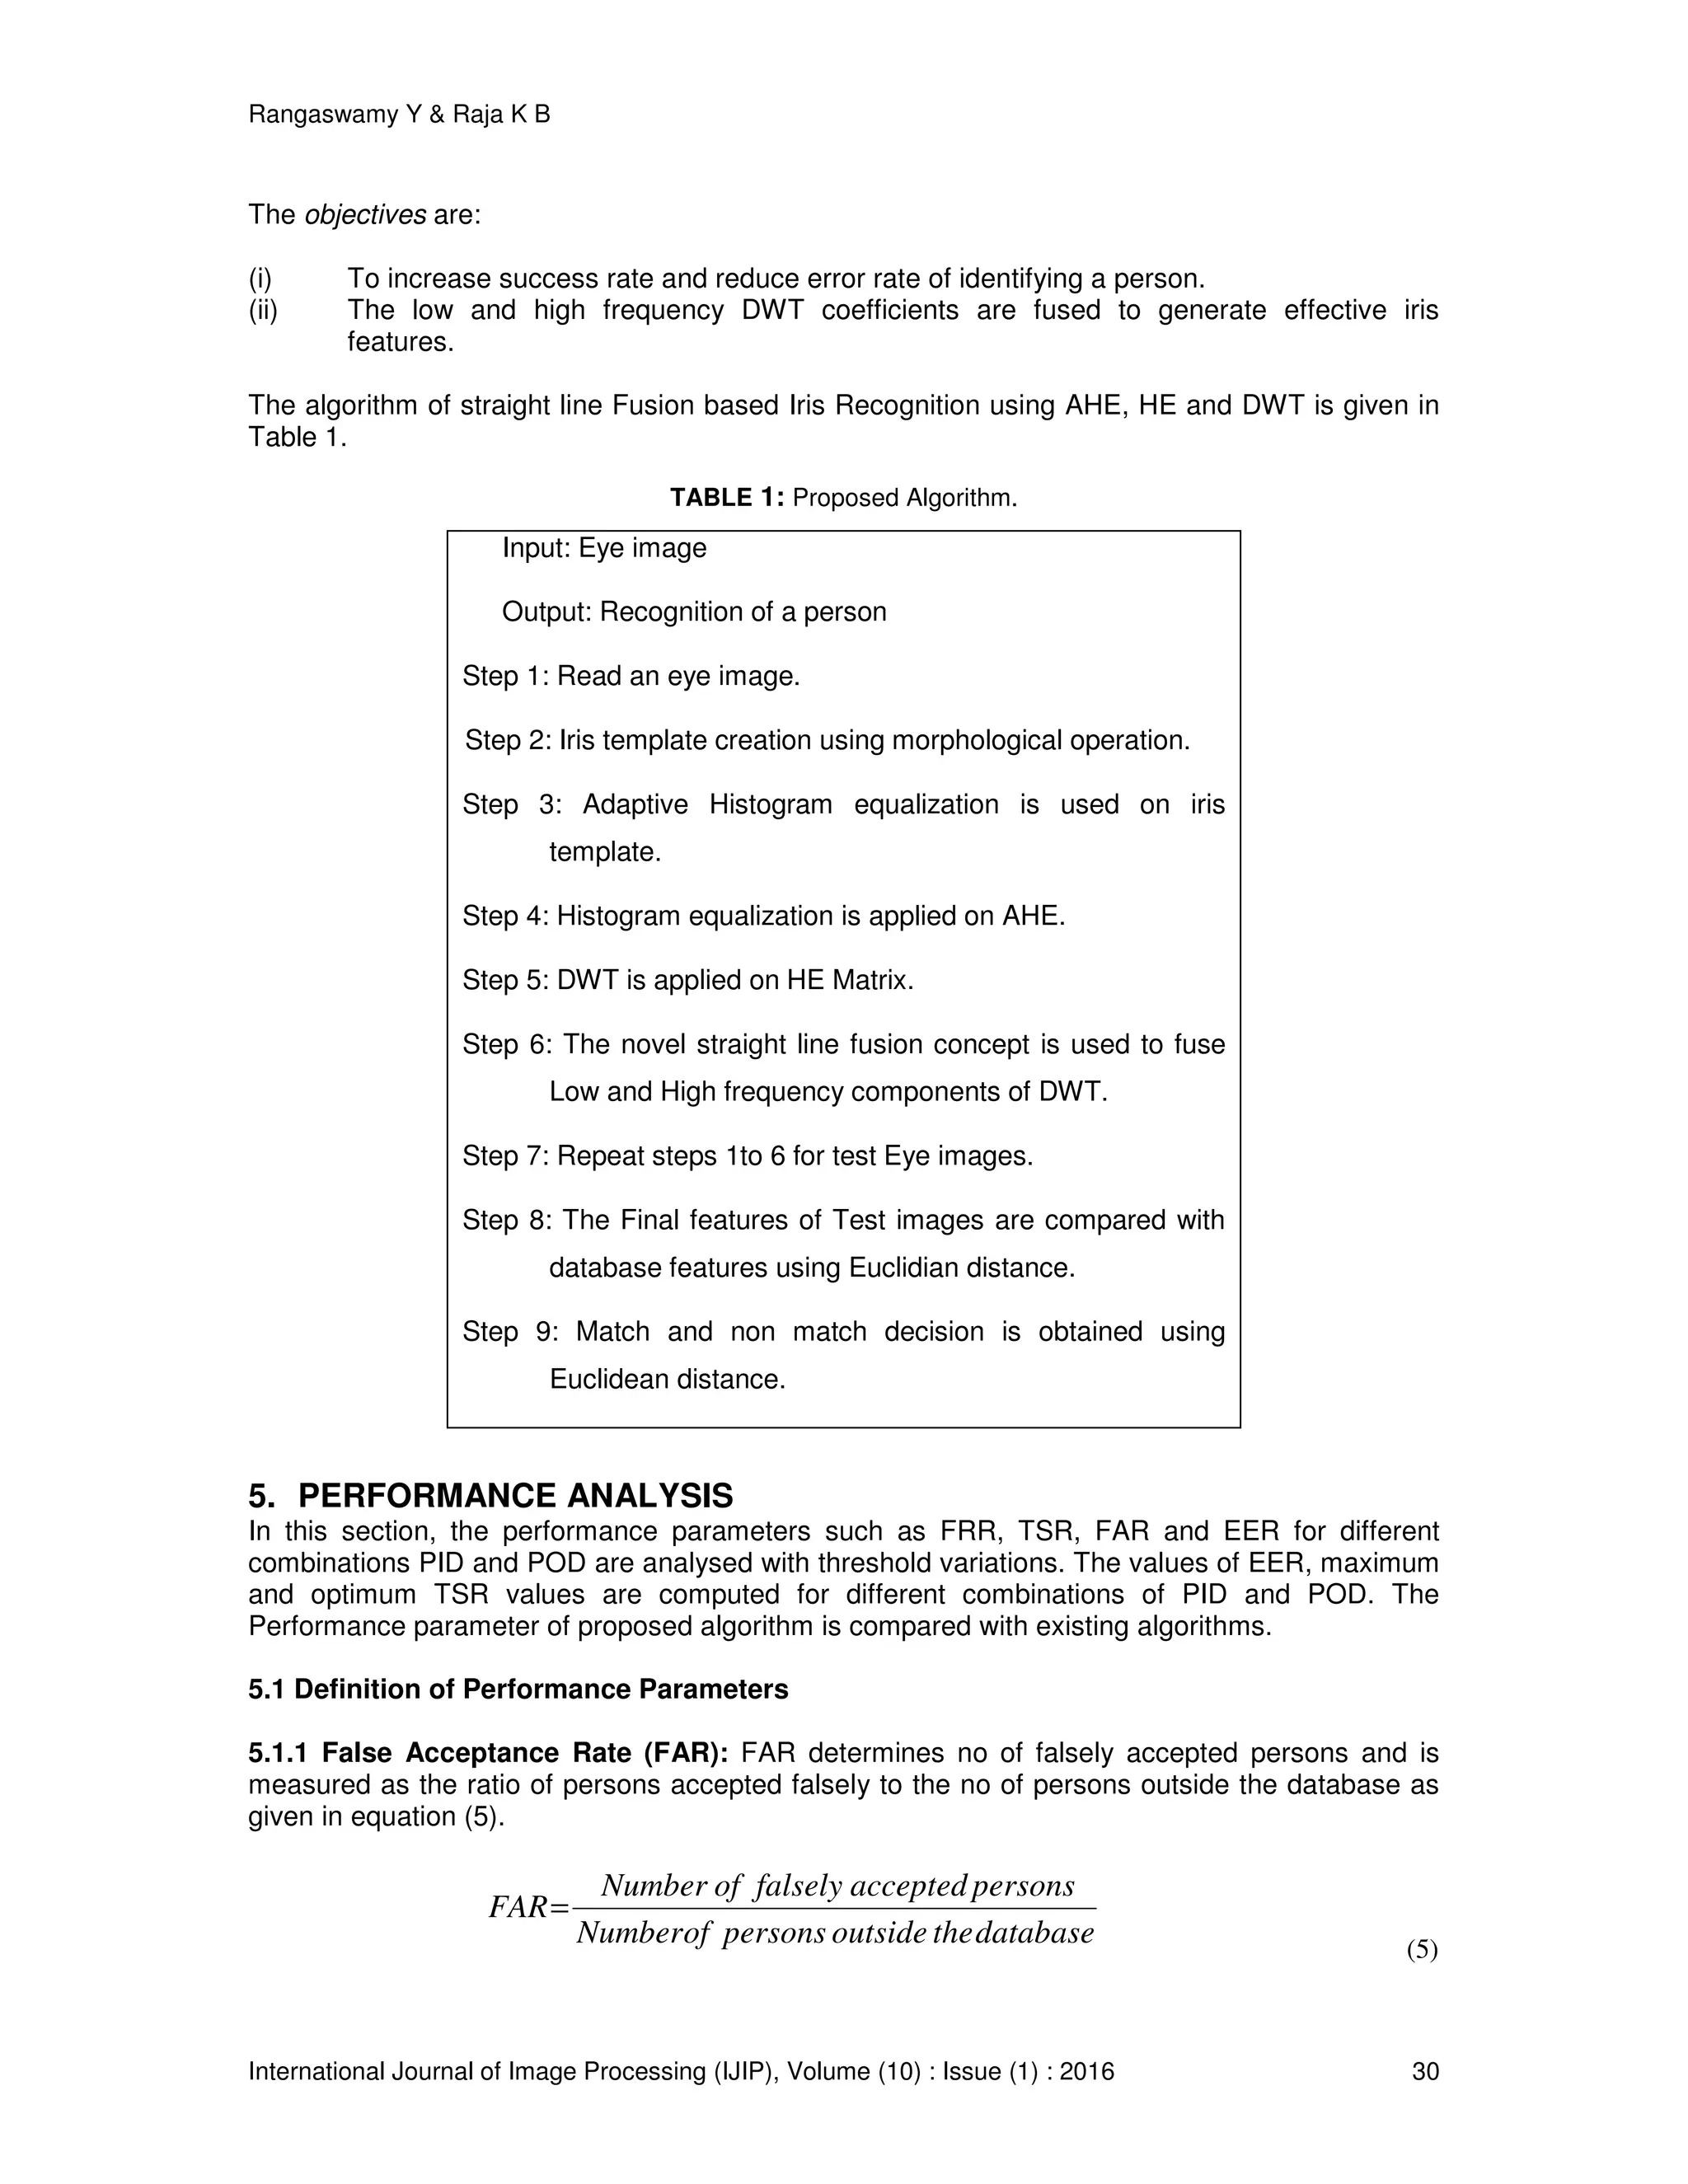
![Rangaswamy Y & Raja K B International Journal of Image Processing (IJIP), Volume (10) : Issue (1) : 2016 28 image to increase further the contrast level and is shown in Figure 7. The pixel intensity values are distributed uniformly throughout intensity levels in HE histogram applied on AHE iris template, which has better contrast compared to original iris template. The features are extracted effectively from HE iris template for better recognition rate. (a) AHE (b) HE (c) AHE histogram (d) HE histogram FIGURE 7: Histogram Equalization applied on AHE. 3.5 Discrete Wavelet Transform The time domain signal is converted into transform domain using DWT for time and frequency analysis. The one dimensional signal is passed through low pass filter of impulse response h[n] and simultaneously passed through high pass filter of impulse response g[n] to derive approximate and detailed bands as shown in Figure 8. Approximation band X[n] Detailed band FIGURE 8: One Dimensional DWT. In the two dimensional DWT, the images is used as input signal and is converted into DWT coefficients corresponding to low and high frequency components[19]. The image is initially pass through low pass filter and high pass filter to generate low and high frequency components. The low pass filter output is again pass through low and high pass filter to generate approximation band LL and detailed band LH. The initial output of high pass filter is again pass through low and high pass filter to generate detail bands HL and HH. The 2D DWT decomposition is as shown in Figure 9. FIGURE 9: 2D-DWT Decomposition on Image. Figure 10 shows the approximate and detailed DWT decomposition bands of iris template. The approximation LL band has significant information of iris template. The detailed LH band has h[n] g[n] h(n) h1(n) g1(n) g(n) h2(n) g2 (n) LL LH HL HH 2 2 2 2 2 2 x(n)](https://image.slidesharecdn.com/ijip-1058-160606130649/75/The-Biometric-Algorithm-based-on-Fusion-of-DWT-Frequency-Components-of-Enhanced-Iris-Image-7-2048.jpg)
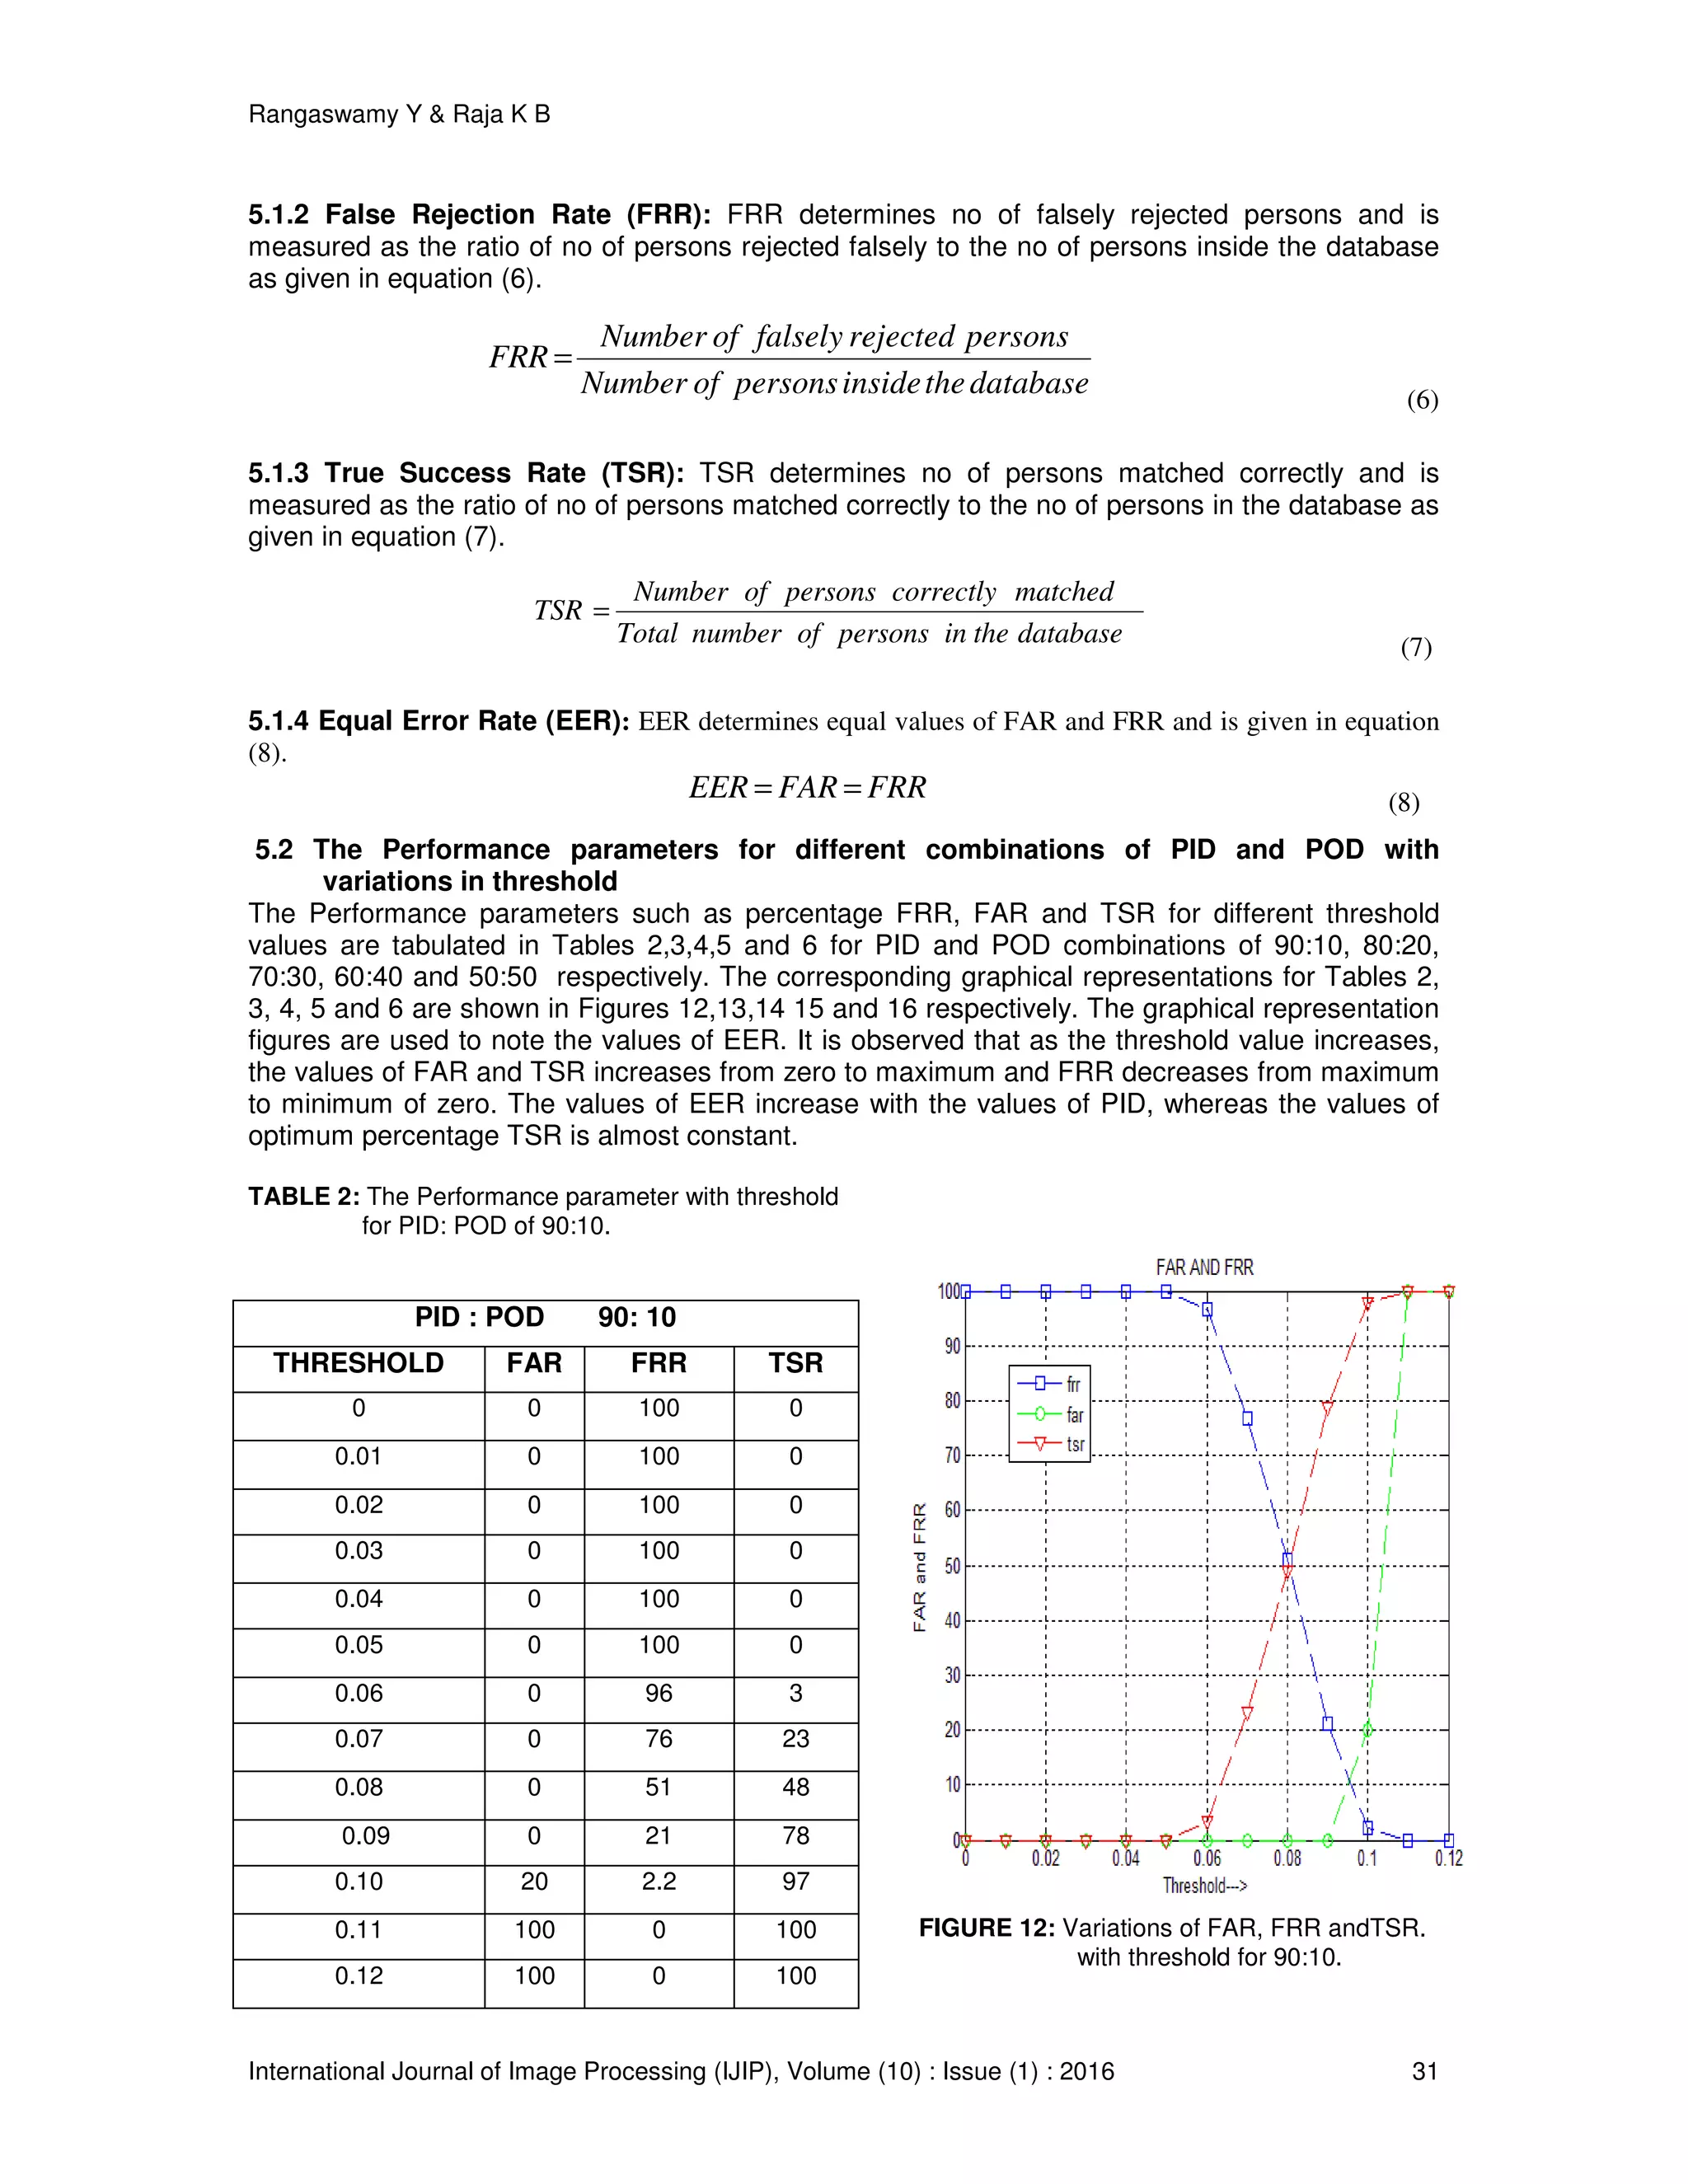
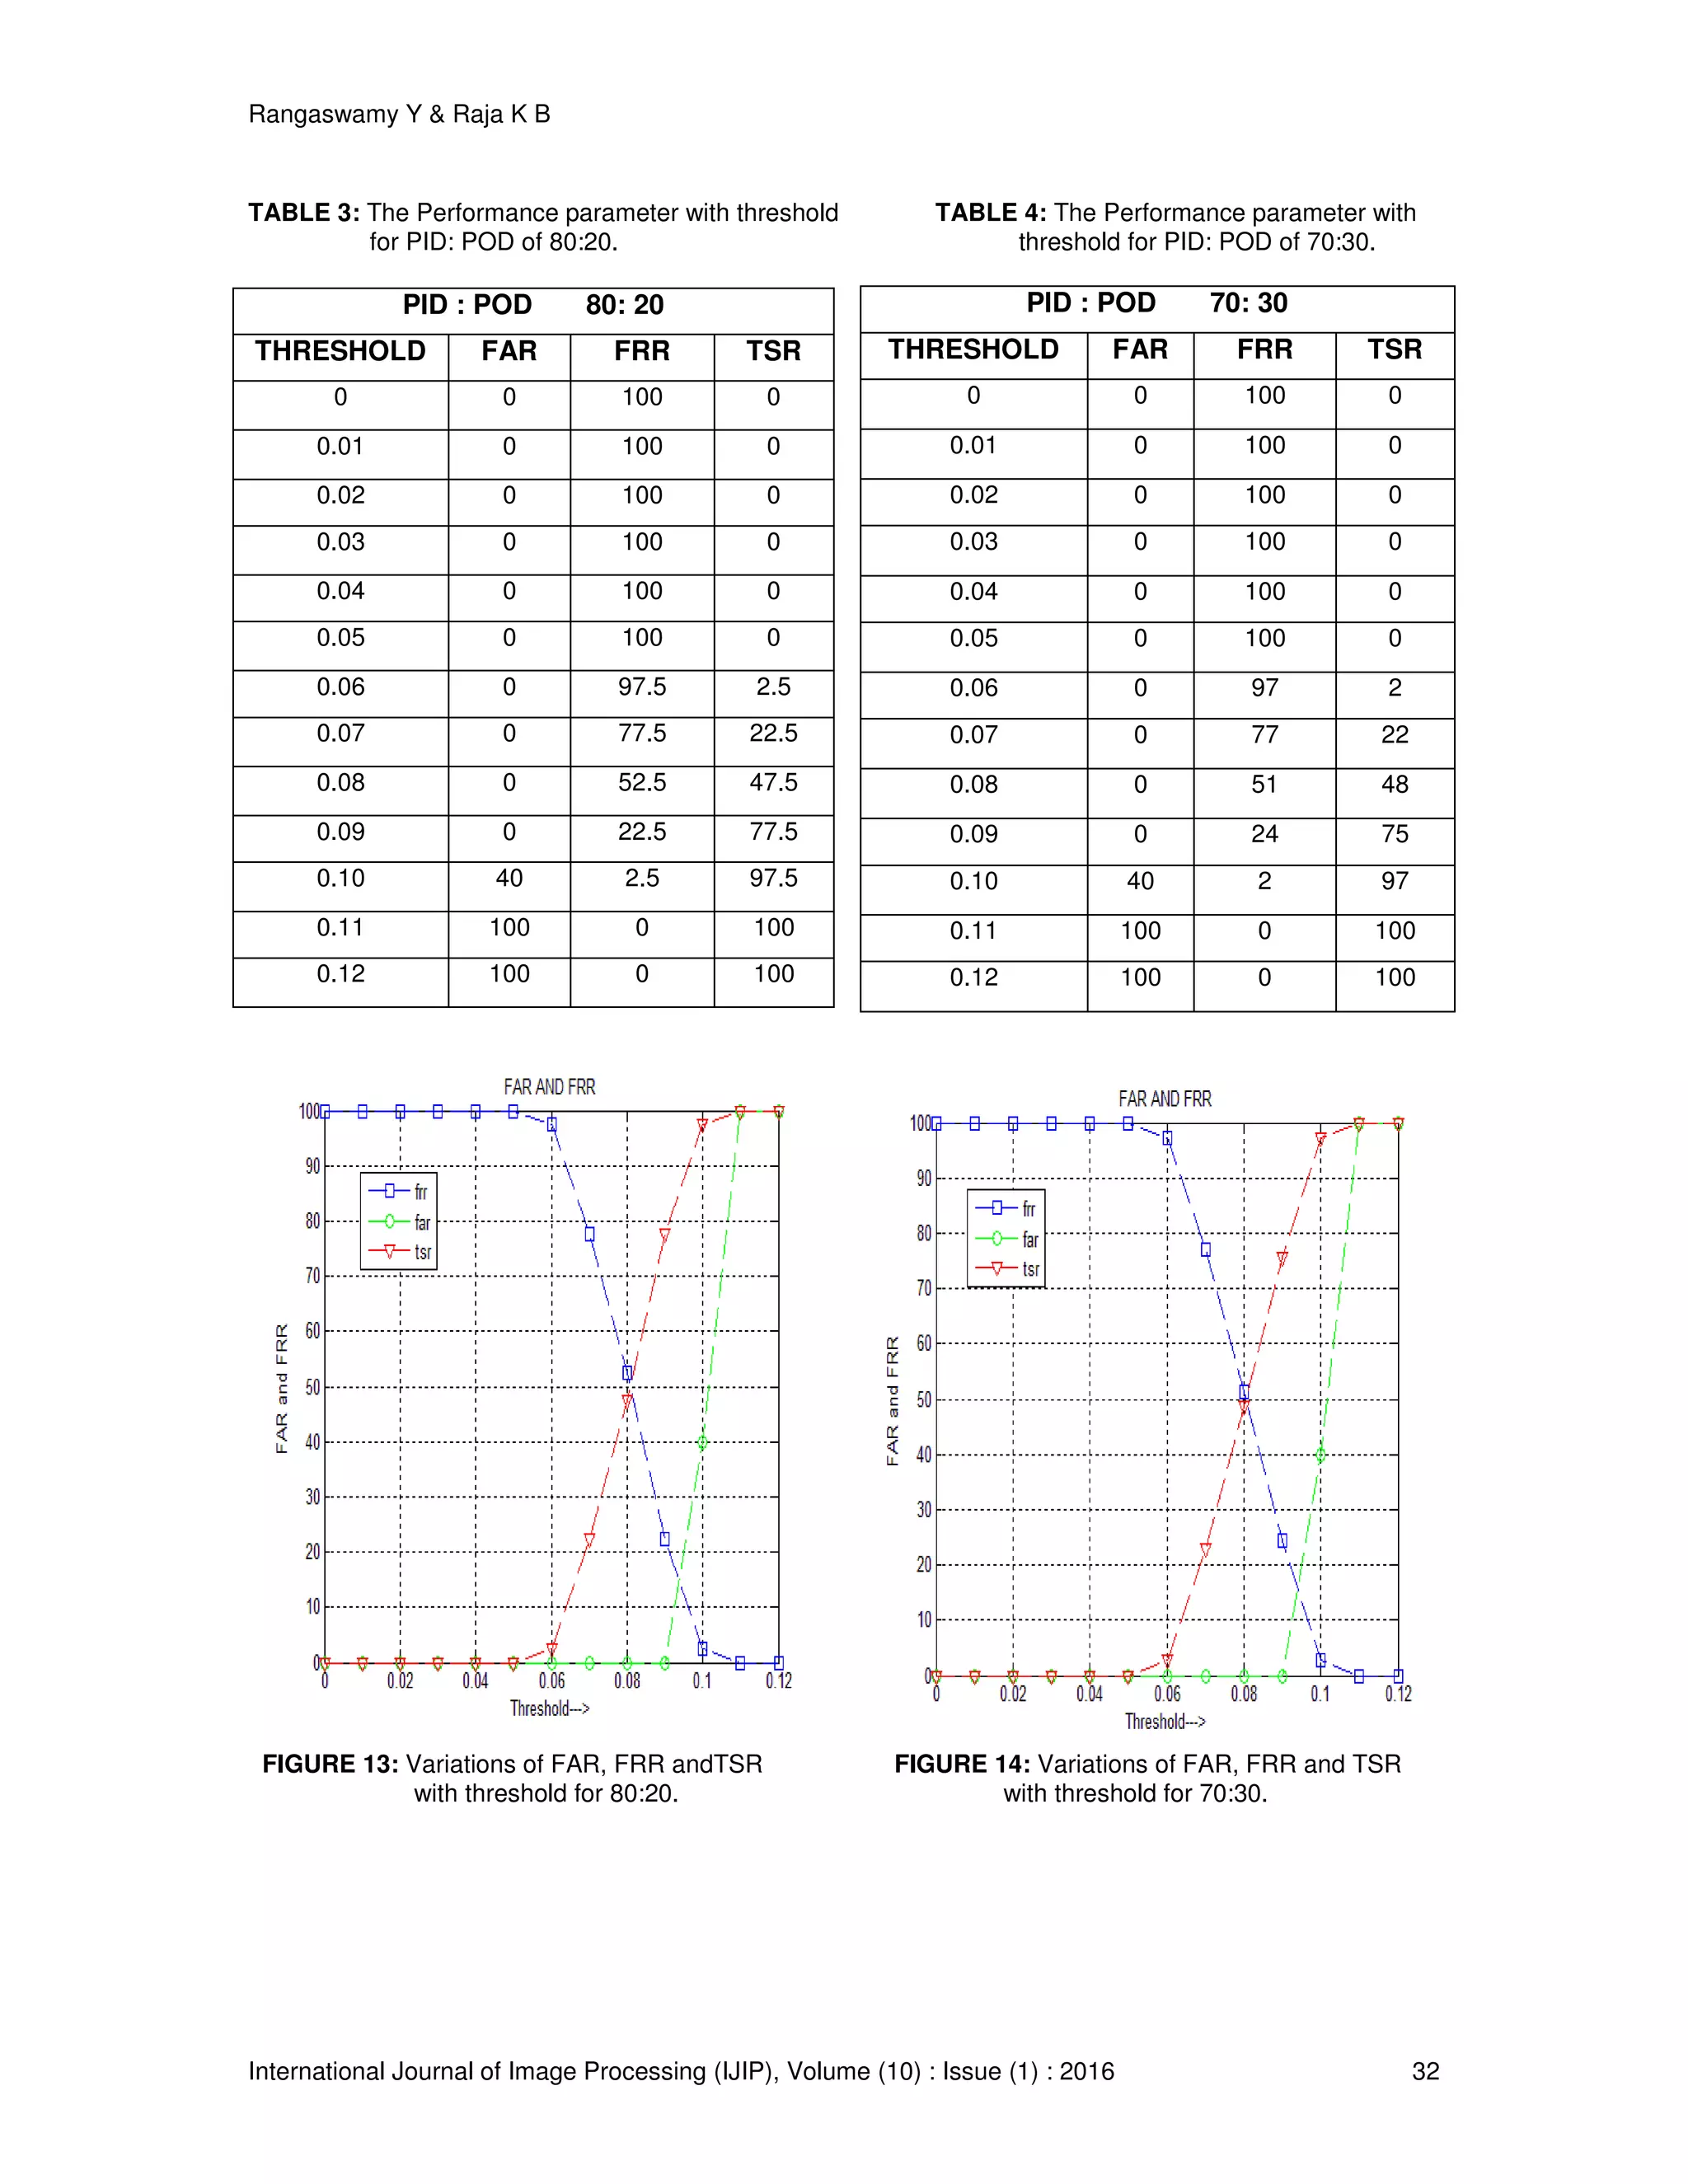
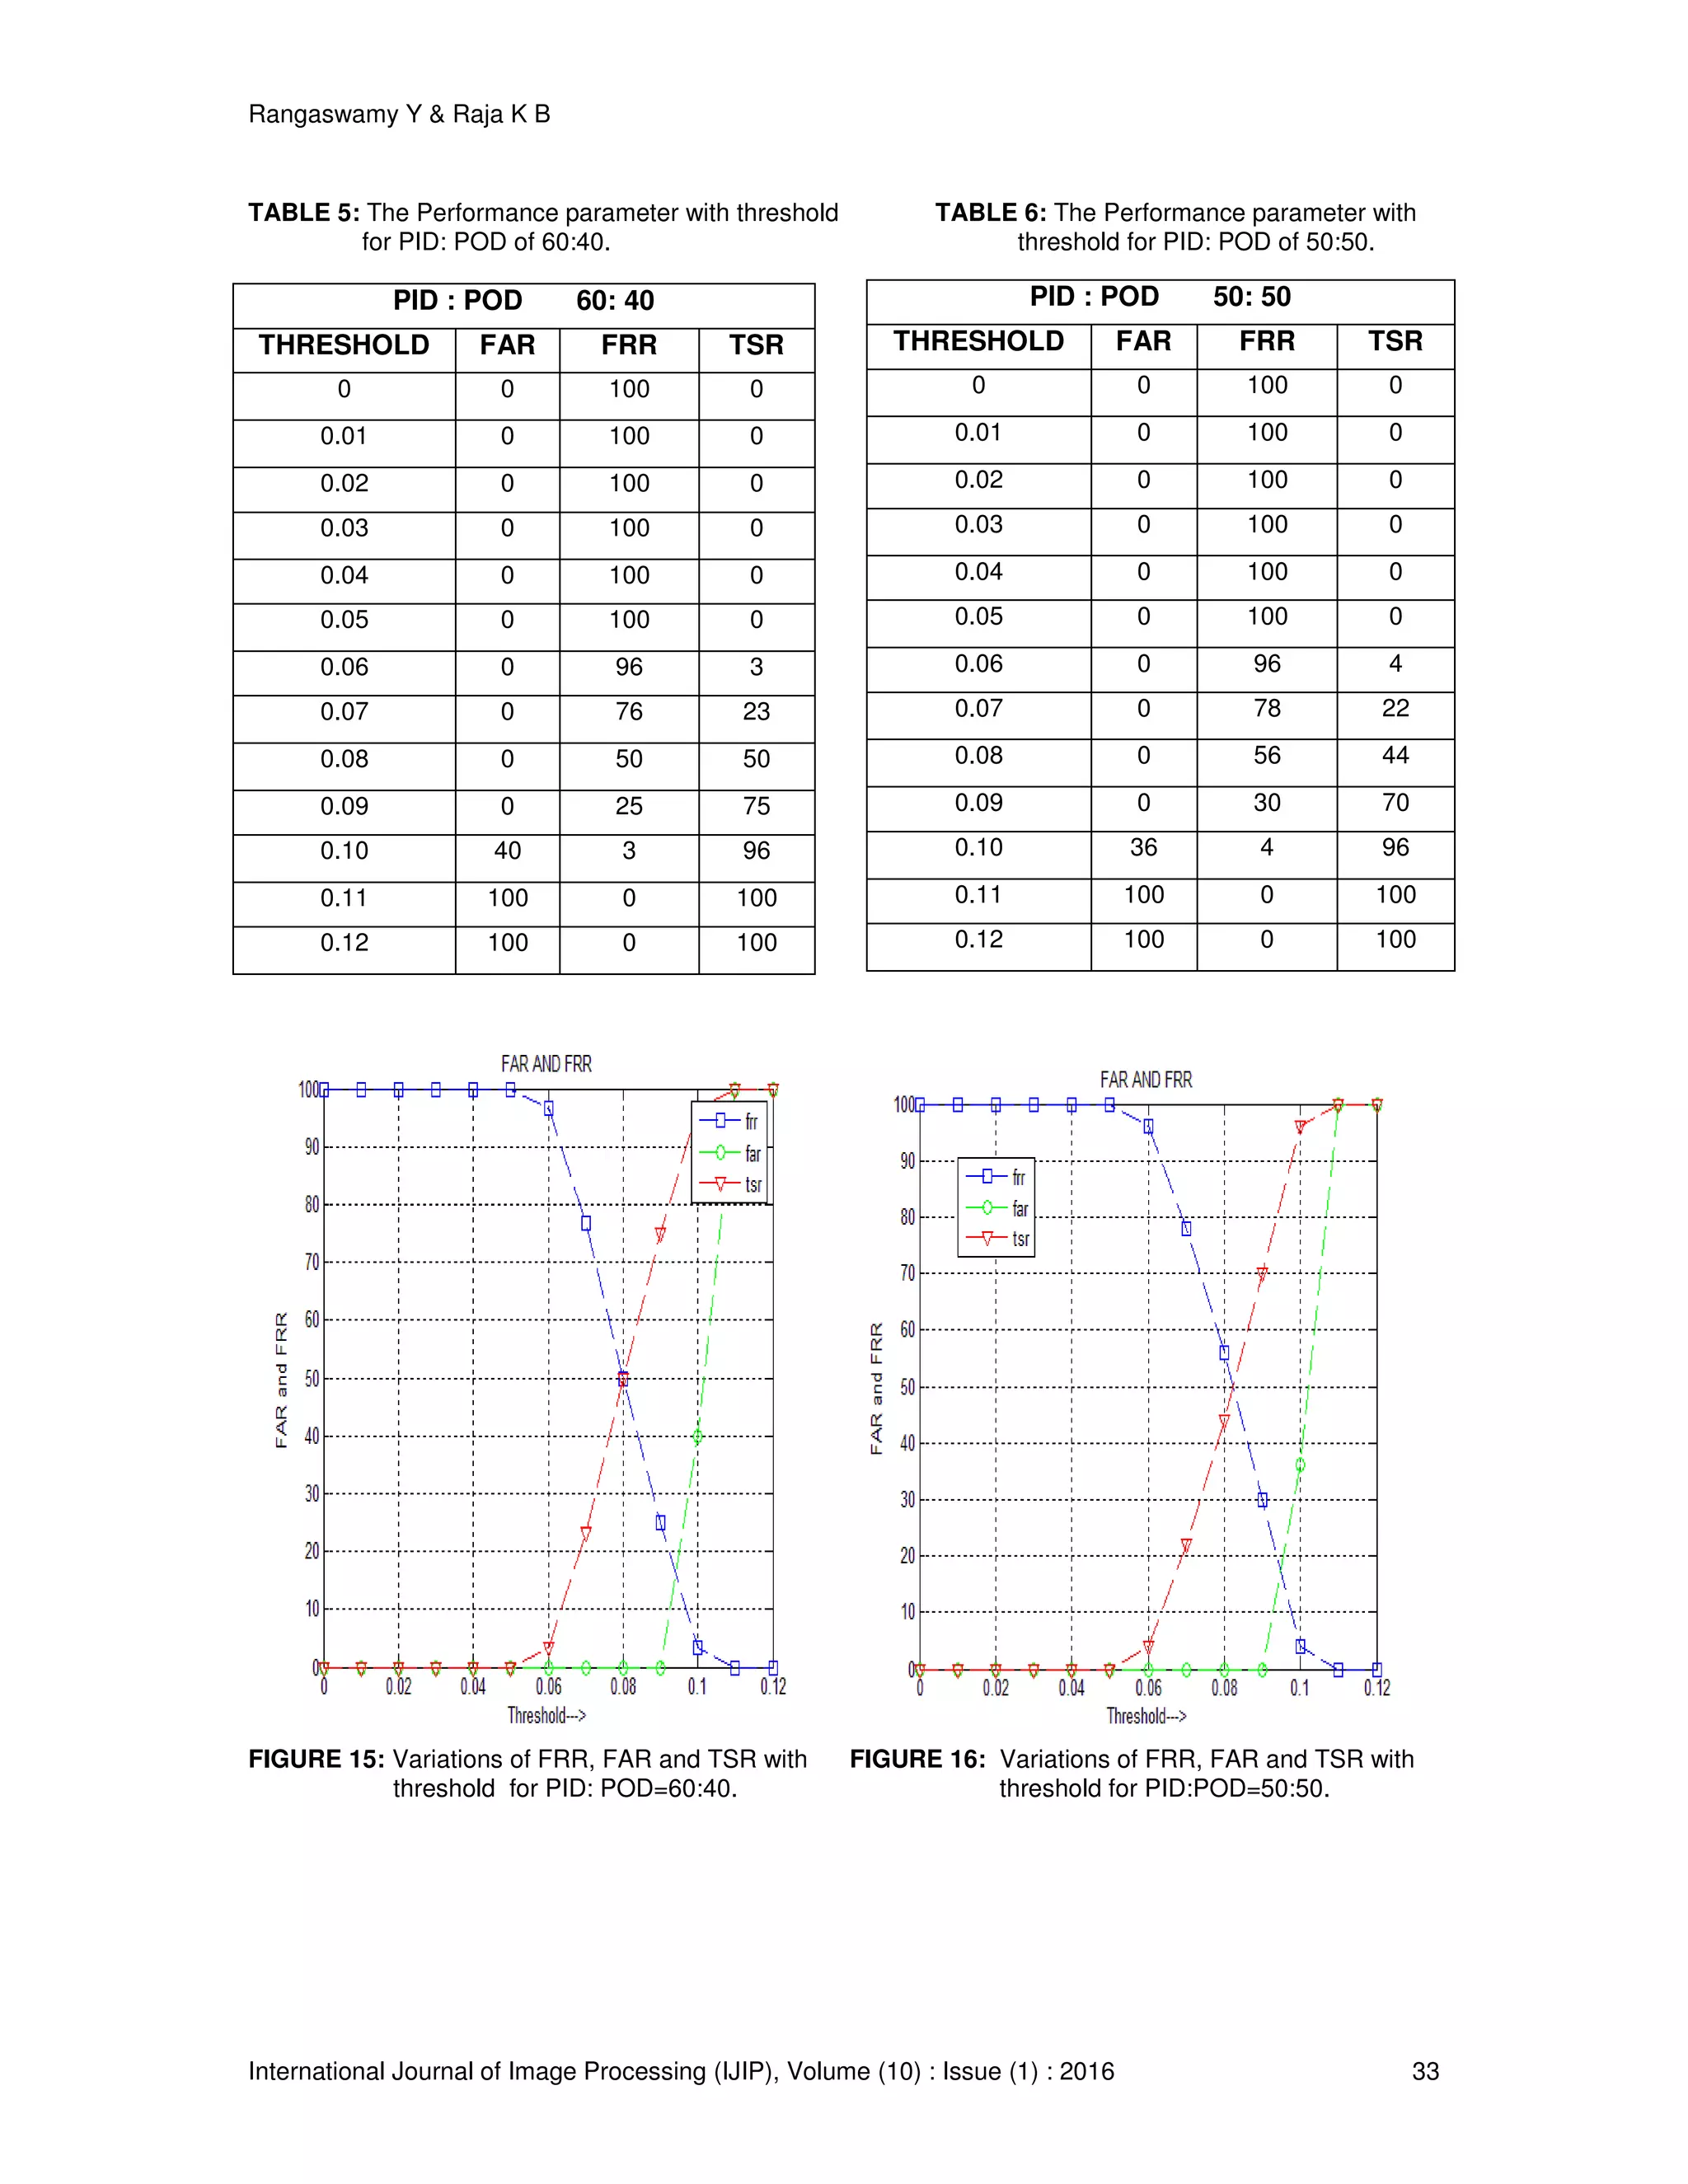
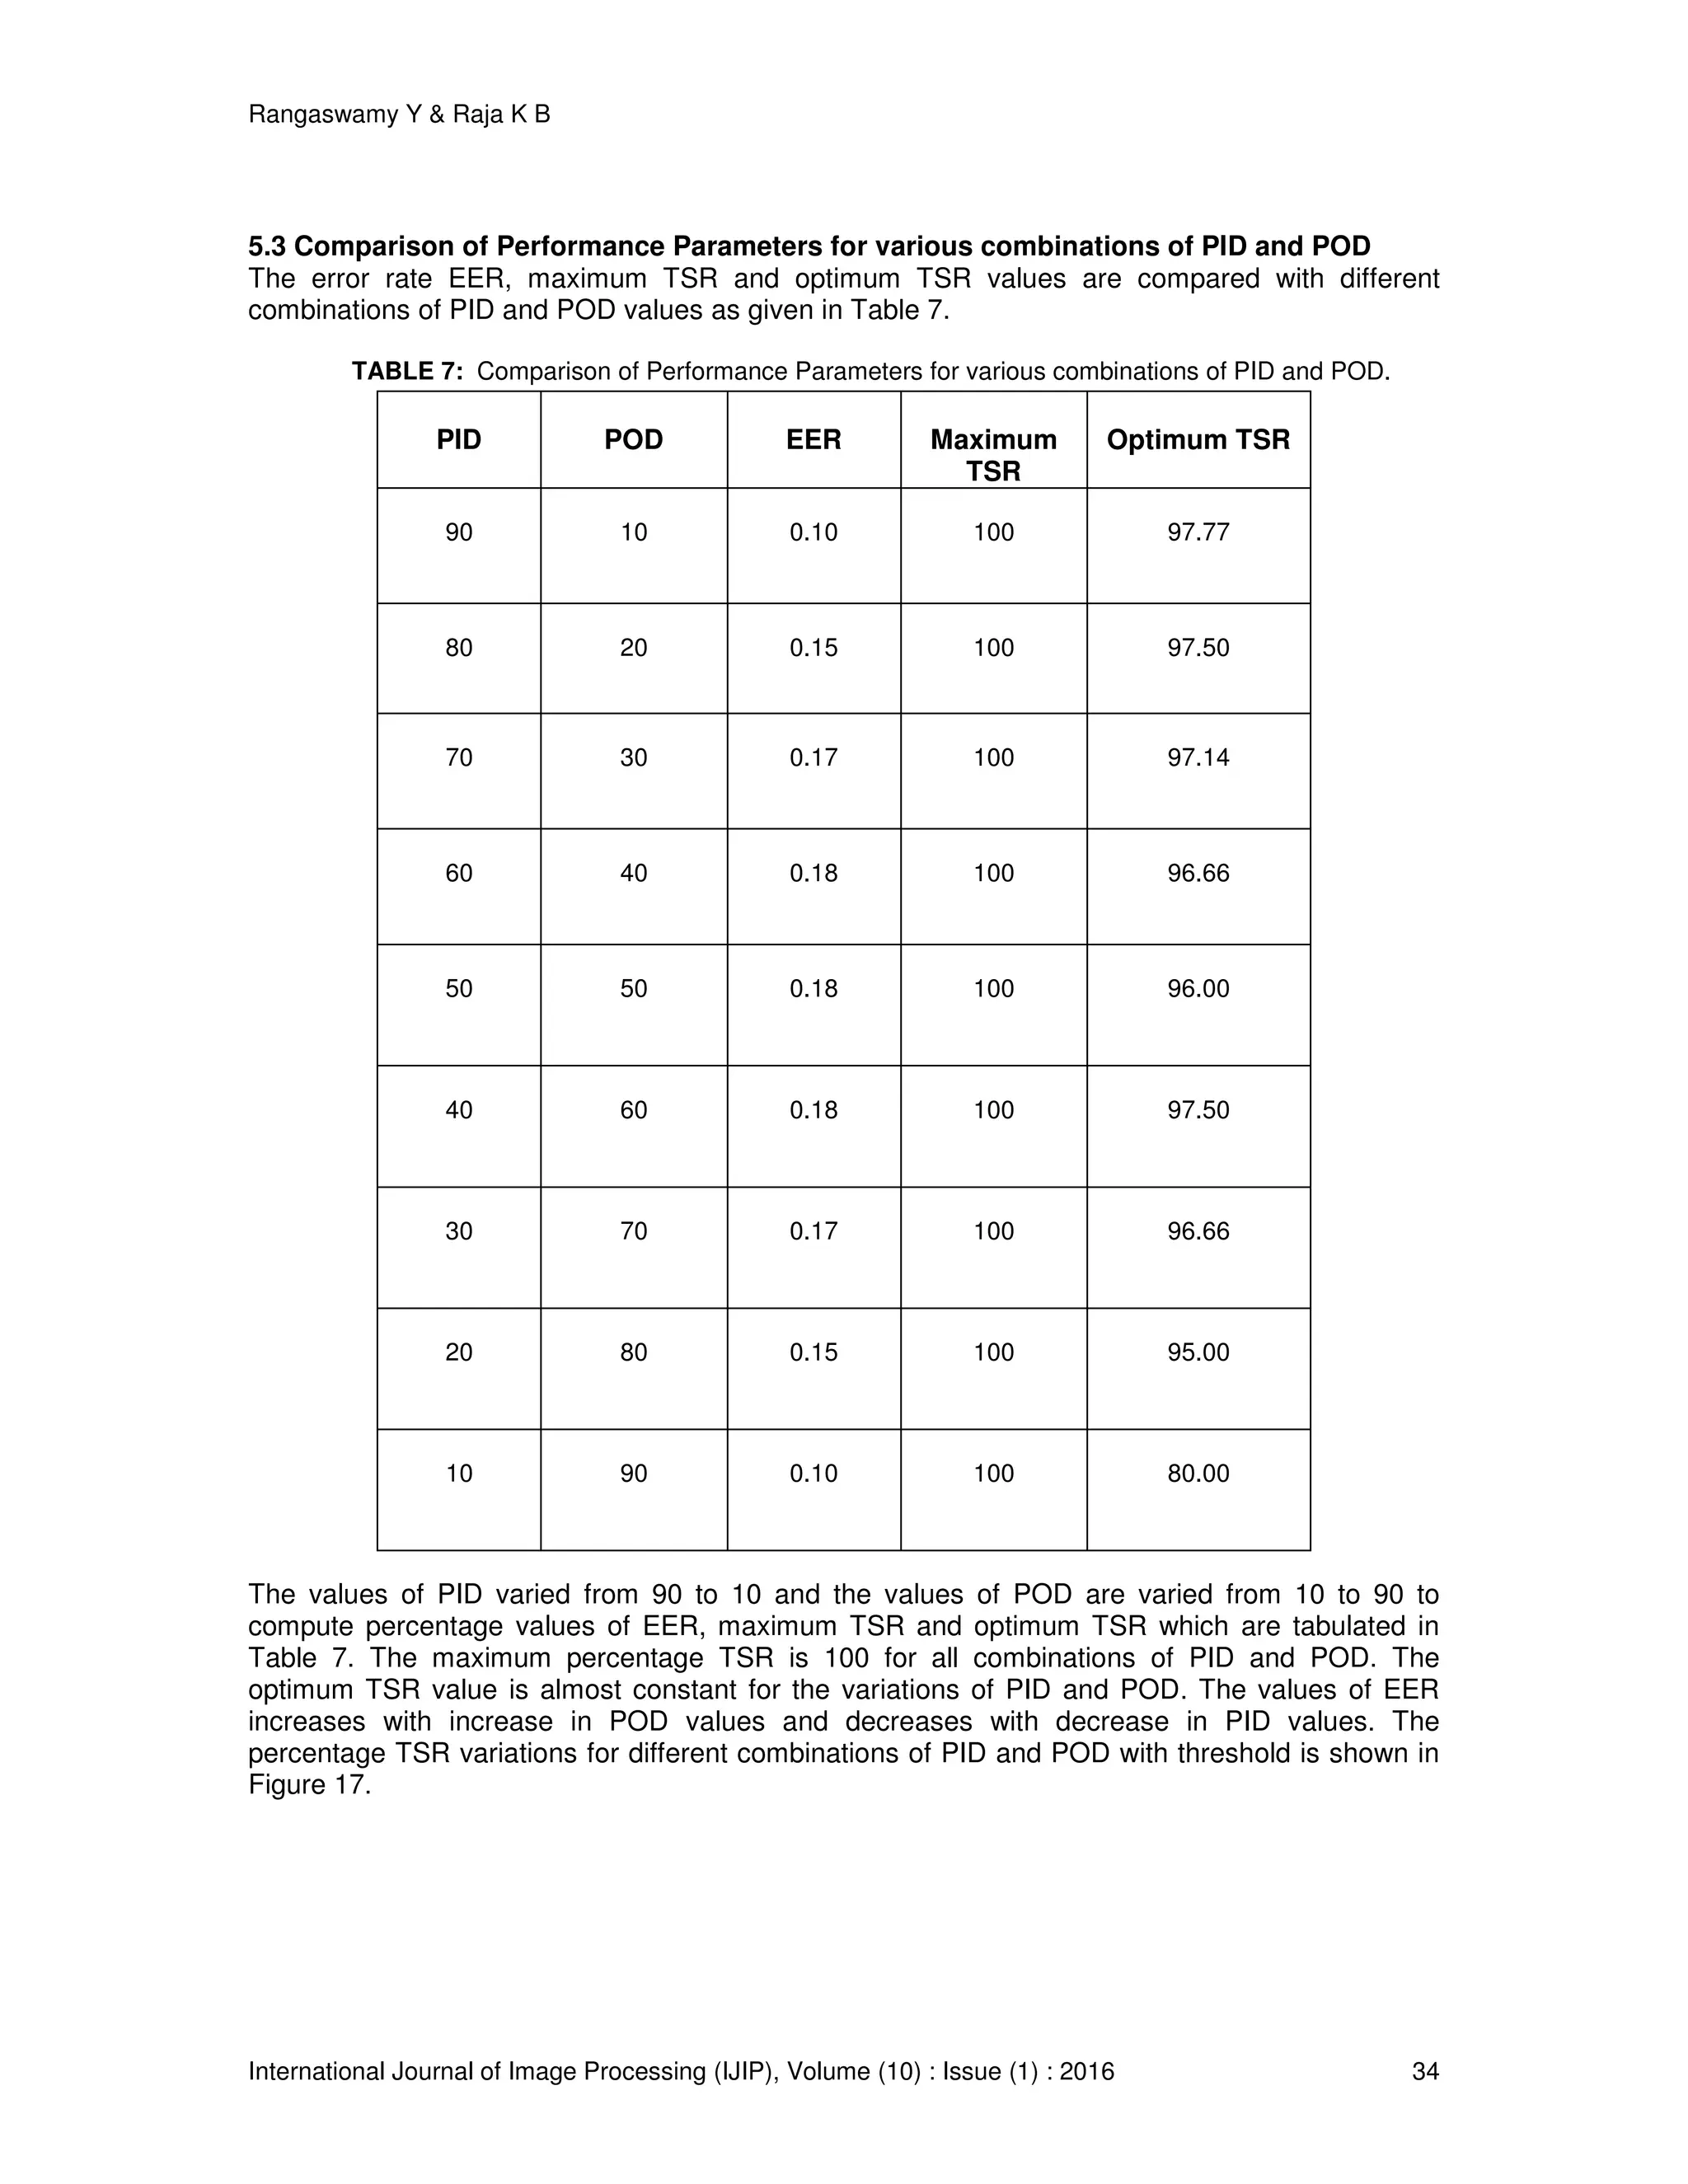
![Rangaswamy Y & Raja K B International Journal of Image Processing (IJIP), Volume (10) : Issue (1) : 2016 35 The percentage TSR is almost zero from 0 to 0.05 threshold. The percentage TSR is 100% for the threshold values above 0.1.The linear variations in TSR is only between threshold values 0.05 and 0.11. FIGURE 17: Variations of TSR with threshold for different combinations of PID and POD. 5.4 Comparison of proposed method with existing methods The Performance Parameters of Proposed method is compared with existing methods and the results are tabulated in Table 8. The values of TSR are better in the case of proposed method compared to existing methods presented by chun and Ajay [20], Sheela and Abhinand [21], Dong et al., [22], W T chun and A Kumar [23] and Khary et al., [24]. TABLE 8: Comparison of TSR of Proposed method with Existing methods. Sl. No. Authors Techniques TSR (%) 1 Chun and Aajay[20] Log Gabor +Gabor Key 92 2 Sheela and Abhinand [21] Hough Gradient canny 95 3 Dong et al.,[22] Weight Map Features 95.22 4 W T Chun and A Kumar[23] Global+Local Features 95 5 Khary et al.,[24] MLBP+HT 96 6 Proposed Method AHE+HE+DWT+Fusion 97.50](https://image.slidesharecdn.com/ijip-1058-160606130649/75/The-Biometric-Algorithm-based-on-Fusion-of-DWT-Frequency-Components-of-Enhanced-Iris-Image-14-2048.jpg)
![Rangaswamy Y & Raja K B International Journal of Image Processing (IJIP), Volume (10) : Issue (1) : 2016 36 The performance of proposed algorithm is better compared to other algorithm for the following reasons. (i) the iris template is created by considering horizontal portion of iris. The vertical portion of iris is eliminated since eye lashes introduce noise. (ii) the iris template intensity values are non uniformly distributed. The AHE and HE are used to distribute intensity values uniformly to enhance quality of iris template. (iii) the DWT is used to enhance further the quality of iris template in transform domain. (iv) the novel concept of straight line fusion of Low and high frequency components of DWT are used to generate final features to identify a person properly. 6. CONCLUSION The iris is an unique biometric trait to identify a person accurately. In this paper the biometric algorithm based on fusion of DWT frequency components of enhanced iris image is proposed.The iris template is enhanced using AHE and HE.The DWT is applied on enhanced iris image to obtain low and high frequency coefficients.The novel concept of straight line fusion on low and high frequency coefficients is used to generate final robust and unique features.The ED is used to compare features of test and database images to compute performance parameters.It is observed that the performance of the proposed algorithm is better compared to existing algorithms. In future the classifiers such as support vector machine and self organized Mapping can be used in matching unit to improve performance parameters. The proposed algorithm can also be implemented using FPGA for real time applications. 7. REFERENCES [1] J. Daugman, “How Iris Recognition Works,” IEEE Transactions on Circuits and Systems for Video Technology, vol. 11, pp.21-30, 2004. [2] L. Ma, T. Tan, Y. Wang and D. Zhang, “Efficient Iris Recognition by Characterizing Key Local Variations,” IEEE Transactions on Image Processing, vol. 13, no. 6, pp. 739–750, 2004. [3] Ahmad Poursaberi and Babak N. Araabi , “A Novel Iris Recognition System using Morphological Edge detector and Wavelet Phase Features,” International Journal on Graphics, Vision and Image Processing,vol. 23, no. 2, pp.1-7, 2005. [4] C R Prashant, Shashikumar B R, K B Raja, K R Venugopal and L M. Patnaik, “High Security Human Recognition System using Iris Images,” International Journal of Recent Trends in Engineering, vol. 1, no. 1, pp 647-652, May 2009. [5] Mrinalini I R, Pratusha B P, Manikantan K and Ramachandran S “Enhance Iris Recognition using Discrete Cosine Transform and Radon Transform,” IEEE International Conference on Electronics and Communication Sustems pp. 1-6, 2015 [6] Gagan R. and Lalitha S. “Elliptical Sector Based DCT Feature Extraction for Iris Recognition,” IEEE International Conference on Electrical, Computer and Communication Technologies, pp.1-5, 2015. [7] Radu P, Sirlantizis K, Howells W G, Hoque S and Deravi F. “Optimizing 2D Gabor Filters for Iris Recognition,” IEEE International Conference on Emerging Security Technologies, pp. 47-50. 2013. [8] Albadarneh A. Albadarneh I. and Alqatawna J. “Iris Recognition System for Secure Authentication based on Texture and Shape features,” IEEE International Conference on Applied Electrical Engineering and Computing Technologies, pp. 1-6, 2015. [9] Nigam A, Krishna V, Bendale A and Gupta P. “Iris Recognition using Block Local Binary Patterns and Relational Measures,” IEEE International Conference on Biometrics, pp. 1-6, 2014.](https://image.slidesharecdn.com/ijip-1058-160606130649/75/The-Biometric-Algorithm-based-on-Fusion-of-DWT-Frequency-Components-of-Enhanced-Iris-Image-15-2048.jpg)
![Rangaswamy Y & Raja K B International Journal of Image Processing (IJIP), Volume (10) : Issue (1) : 2016 37 [10] Isnanto R R, “Iris Recognition Analysis using Biorthogonal Wavelet Transform for Feature Extraction,” IEEE International Conference on Information Technology, Computer and Electrical Engineering, pp. 183-187, 2014. [11] Shashi Kumar D R, K B Raja, R K Chhootaray and Sabyasachi Pattnaik, “PCA based Iris Recognition using DWT,” International Journal Computer Technology and Applications, vol. 2, no. 4, pp. 884-893, 2011. [12] Umer S, Dhara B C, “A Fast Iris Localization using Inversion Transform and Restricted Circular Hough Transform,” IEEE International Conference on Advances in Pattern Recognition, pp.1-6 , 2015. [13] Podder P, Khan T Z, Khan M H, Rahman M M, Ahmed R and Rahaman M S, “ An Efficient Iris Segmentation Model based on Eyelids and Eyelashes Detection in Iris Recognition System,” IEEE International Conference on Computer Communication and Informatics, pp. 1-7, 2015. [14] Yongqiang LI , “Iris Recognition Algorithm based on MMC-SPP,” International Journal of Signal Processing, Image Processing and Pattern Recognition Vol. 8, No. 2, pp. 1-10, 2015. [15] http://www.sinobiometrics.com, CASIA Iris Image Database. [16] http://www.springerimages.com, Springer Analysis of CASIA Database. [17] Sharma D. P. “Intensity Transformation using Contrast Limited Adaptive Histogram Equalization,” International Journal of Engineering Research,vol. 2,no. 4,pp. 282-285, 2013. [18] Rafael C. Gonzalez and Richard E.Woods Digital Image Processing, Prentice Hall, Second Edition, 2002. [19] Mallat S “A Theory for Multiresolution Signal Decomposition: The wavelet Representation,” IEEE Transaction of Pattern Analysis and Machine Intelligence,vol. 11, pp. 674-693,1989. [20] Chun-Wei Tan and Ajay Kumar, “Accurate Iris Recognition at a distance using Stabilized Iris Encoding and Zernike Moments Phase Features,” IEEE Transactions on Image Processing, vol. 23, no. 9, pp. 3962-3974, 2014. [21] Sheela S V and Abhinand P “Iris Detection for Gaze Tracking Using Video Frames,” IEEE International Conference on Advance Computing, pp. 629-633, 2015. [22] Dong W, Sun Z and Tan T “Iris Matching based on Personalized Weight Map,” IEEE Transactions on Pattern Analysis and Machine Intelligence vol. 33, no. 9, pp. 1744–1757, 2011. [23] C.W. Tan and A. Kumar, “Towards Online Iris and Periocular Recognition under Relaxed Imaging Constraints,” IEEE Transactions on Image Processing vol. 22, no. 9, pp. 3751- 3765, 2013. [24] Khary Popplewell, Kaushik Roy, Foysal Ahmad, and Joseph Shelton, “Multispectral Iris Recognition Utilizing HoughTransform and Modified LBP,” IEEE International Conference on Systems, Man, and Cybernetics, pp. 1396-1399, 2014.](https://image.slidesharecdn.com/ijip-1058-160606130649/75/The-Biometric-Algorithm-based-on-Fusion-of-DWT-Frequency-Components-of-Enhanced-Iris-Image-16-2048.jpg)