Download to read offline

![Simulation and Analysis of different MPPT Algorithms for PV System https://iaeme.com/Home/journal/IJEET 27 editor@iaeme.com 1. INTRODUCTION In 2012, over 31gigawatts of solar photovoltaic (PV) capacity was established in the globe, rises expected to 84 GW by 2017 [1]. The technology of Microgrid offers several benefits, including enhanced reliability of service, low initial costs, and decrease dependency on local utilities with the satisfaction of minimum environmental impact& customer the EPIA (European Photovoltaic Industry Association) published a technical report. The Microgrid technology is required to have an interface of power electronic which includes converters or inverters, PWM (Pulse Width Modulation Method) & MPPT control system[2]. In connected grid topology (known as grid-interactive)[3] & in island PV system model[4, 5] it also has the capability to perform. In isolated areas (e.g. remote rural areas), other sources of energy, such as satellite systems, transit, charge plants, and mobile applications, cannot deliver adequate power, a stand-alone PV system mode is economically advantageous. Solar PV cells, unfortunately, have various difficulties, including, the non-linearity among the PV current& o/p voltage (i.e. power and voltage) affecting the level and temperature of the irradiance [6], Particularly addition, the high production costs and low-efficiency conversion in particular when PV is exposed or shaded in part to low irradiance. The MPPT algorithms are therefore intended to address these issues and improve the performance of solar cells. Moreover, the most crucial aspect of controlling the PV generator is these algorithms (to ensure PV generators track their desired MPP. A variety of Maximum power point tracking approaches have been suggested by several scientists. Several of these algorithms show good efficiency in tracking under different conditions. The current algorithms differ, however, according to their complexity of implementation, time response (convergence speed), efficiency, popularity, cost, accuracy & other technical features. Constant voltage procedures [7] means that the desired maximum voltage (Vmpp) while using the constant K (value of K range 0.7 to 0.95), can be achieved by multiplying the required maximum voltage by open-circuit voltages (Voc). However, power losses during measurements [8] are the principal downside of the latter approach. Furthermore, as the voltage at MPP varies with temperature, the working power is never exactly at the Maximum PowerPoint. This approach has a number of advantages, including the application of a single voltage sensor and high performance at variable irradiance owing to the small difference in voltage at the generator’s photovoltaic terminals. The constant current approach has a comparable procedure. Under any particular input irradiance,[9]. The ratio b/w the desired maximum current (Impp) & the short circuit current (Isc) is approximated by this. This approach has the same benefits & drawbacks as the constant voltage Maximum power point tracking. Many other strategies, including such Perturb & Observe (P&O) [10], Hill Climbing (HC) [12], Incremental Conductance (IC) [11] & Ripple Correlation Control (RCC) [13], are dependent on exploiting the gradient of P-V curve to find the maximum power point. The IC technique is frequently employed due to its ease of use (i.e. ease of implantation) & high overall MPPT performance. The method relies on a positive left, a negative right &a zero at the MPP across the voltage derivative. One of the drawbacks of the techniques is the computational complexity necessary to provide acceptable tracking performance under fastly altering irradiance. The Converter is used by the RCC, The MPP signal ripple [13]. The target output will be approached based on changing the operating current at the MPP location. The relatively rapid temporal reaction is one advantage of this technology. The approach is however vulnerable to fluctuations in external disturbances, which means the accuracy of the MPP is weak compared with other MPPT [2]. Due to the simplicity of its application, cheap costs in relation to other ways are most preferred for HC and P&O [14, 15]. HC functions by adjusting the power converter (generally DC/DC Boost converter), This results in perturbation to the o/p power of the photovoltaic generator. The algorithm now monitors the effects and determines the cycle of duty desired direction to reach the MPP. In the same way, the P&O approach functions by perturbing the output voltage of the photovoltaic generator & by analyzing its](https://image.slidesharecdn.com/ijeet1211003-211203132813/75/SIMULATION-AND-ANALYSIS-OF-DIFFERENT-MPPT-ALGORITHMS-FOR-PV-SYSTEM-2-2048.jpg)
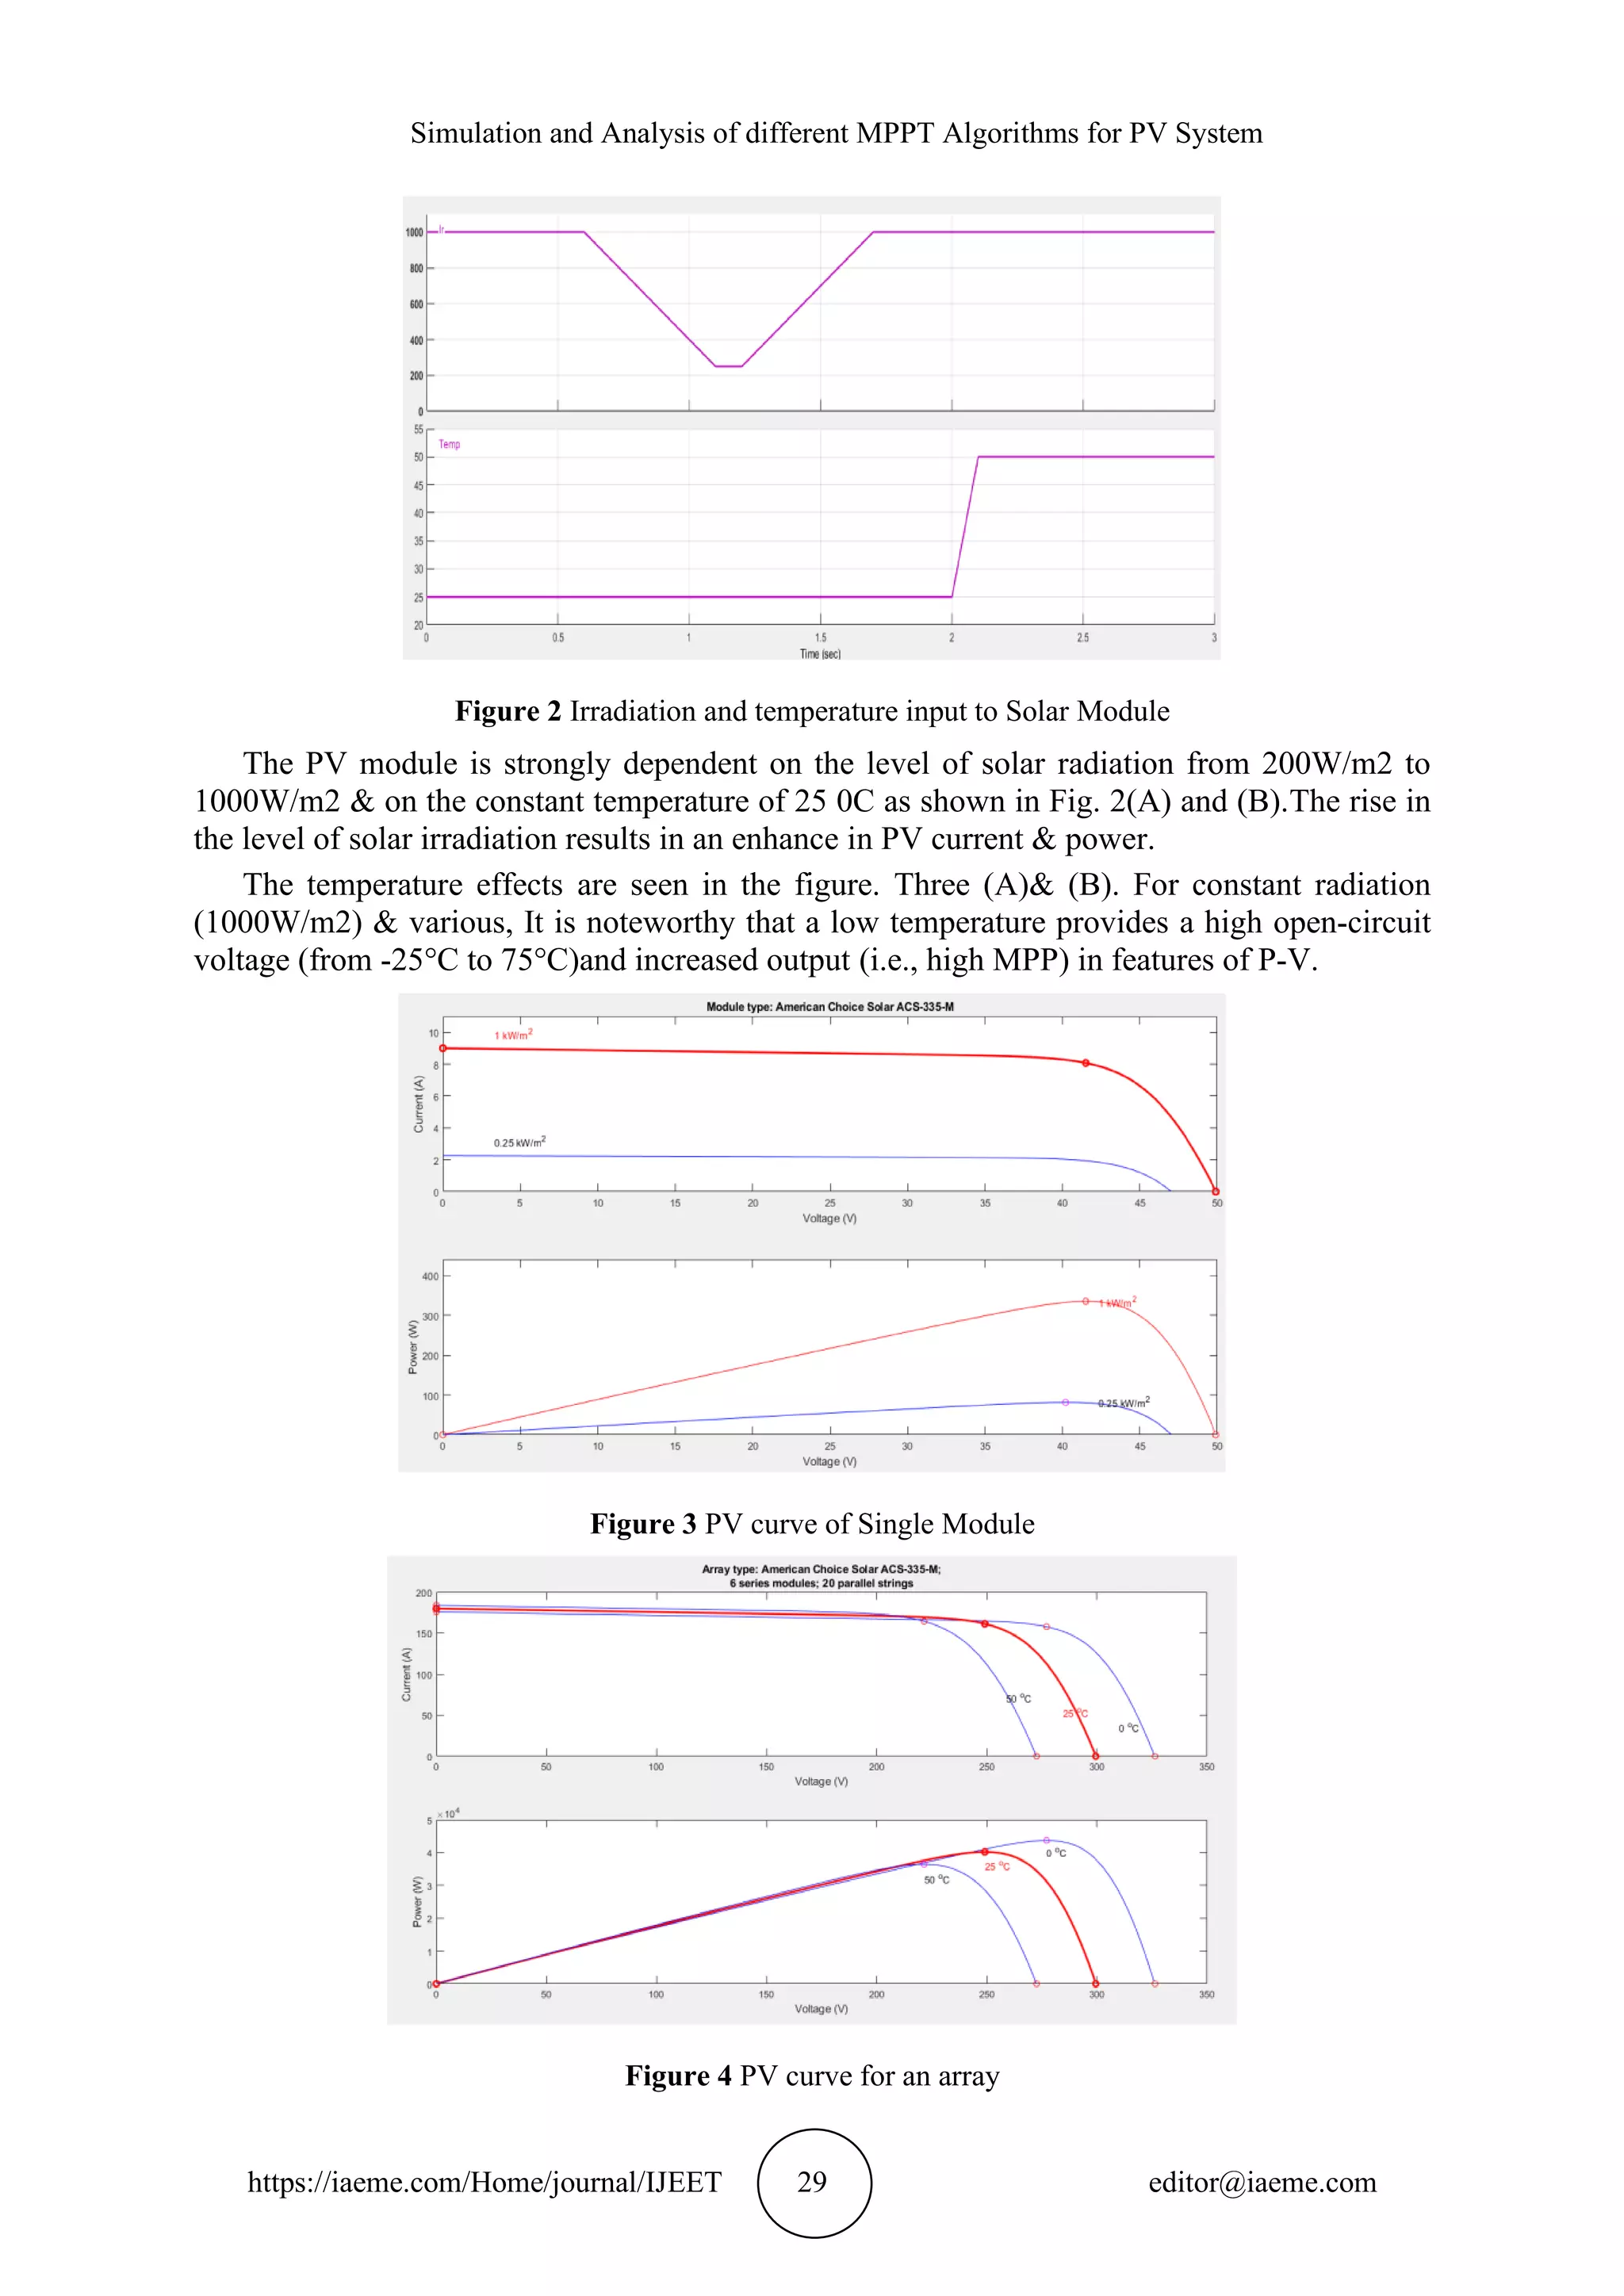
![Dharmendra Yadav, Maneesh Kumar Gupta and Rajnish Bhasker https://iaeme.com/Home/journal/IJEET 28 editor@iaeme.com effect on o/p power. It should be noted that the 2 techniques have common disadvantages like balance around the MPP without accurate tracking. In addition, the inadequate choices of the step size influence system stability, which results in delayed response times and increased power losses. MPPT technology is primarily required to react rapidly to environmental changes, high efficiency, and low static error. In addition, the approach utilized must be system independent parameters, has reasonable complexity &execution cost. FLC is the most common and is considered easy to use and improve efficiency. In this paper, two MPPTs fuzzy logic recently reported with traditional P&O are comparable and discussed. One is the P&O-FLC adaptable and the other one a modified mountain climbing- FLC. Section II will examine the modeling of the PV for further clarification of this study. Section III will present traditional P&O and modified mountain FLC climbing as well as P&O- FLC. 2. SYSTEM DESIGNS 2.1. PV MODELING Clean electrical energy through light conversion (solar irradiation) produces by using PV cells through the photovoltaic effect. No moving parts are necessary for this technique. The equal circuit of an ideal solar cell according to semiconductor theory is a parallel current source with 1 or 2 diodes. This leads to nonlinear properties of current and voltage [17]. parallel resistance of cell Rp and Internal series resistance of cell Rs should be included in the model. Rs is typically quite small and Rp quite large [6]. The mathematical model that describes a PV generator's current-voltage characteristics can be developed by using the single-diode model to depict the equivalent circuit of a solar cell: Ipv = np(Iph − Io(exp (q ( Vpv+RsIpv AKTns ) − 1) − Vpv+RsIpv nsPp ) (1) If Ipv & Vpv represents the o/p power & voltage, ns & np presents the no of solar cells connected by series in parallel, the basic electron load is q (1,602 daily10-19C), Iph is the solar cell luminous current proportional to the level of the irradiance, the I0is diode saturation current, A is the dimensions of the diodes (in Kelvins). Figure 1 The model used for simulations.](https://image.slidesharecdn.com/ijeet1211003-211203132813/75/SIMULATION-AND-ANALYSIS-OF-DIFFERENT-MPPT-ALGORITHMS-FOR-PV-SYSTEM-3-2048.jpg)
![Dharmendra Yadav, Maneesh Kumar Gupta and Rajnish Bhasker https://iaeme.com/Home/journal/IJEET 30 editor@iaeme.com Table 1 The Electrical Characteristics 2.2. DC to DC Boost Converter The DC/DC converter is at the core of the MPPT process. Maximum power to the solar panel load side for maximum power to be converted via the DC/DC converter [11–14]. This process uses the boost converter to alter the o/p voltage by modifying the service cycle to generate high power from the solar array, as exhibited in Figure 2. Use the algorithm of MPPT to adjust the boost converter’s duty cycle. In current continuous mode (CCM), this converter can be developed and simulated using the following equations: Vout = 𝐷𝑉𝑖𝑛 1−𝐷 (2) Lmin= (1−𝐷)2𝐷𝑅 2𝑓 (3) Cmin= 𝐷 𝑉𝑜𝑢𝑡 𝑉𝑅𝑓 (4) Where D is the i/p voltage and o/p voltage ripple voltage, Vin, Vr, f are the input voltage & the load resistance is R, and where D is Vin, Vut, Vr, Figure 5 DC to Dc Boost Converter](https://image.slidesharecdn.com/ijeet1211003-211203132813/75/SIMULATION-AND-ANALYSIS-OF-DIFFERENT-MPPT-ALGORITHMS-FOR-PV-SYSTEM-5-2048.jpg)
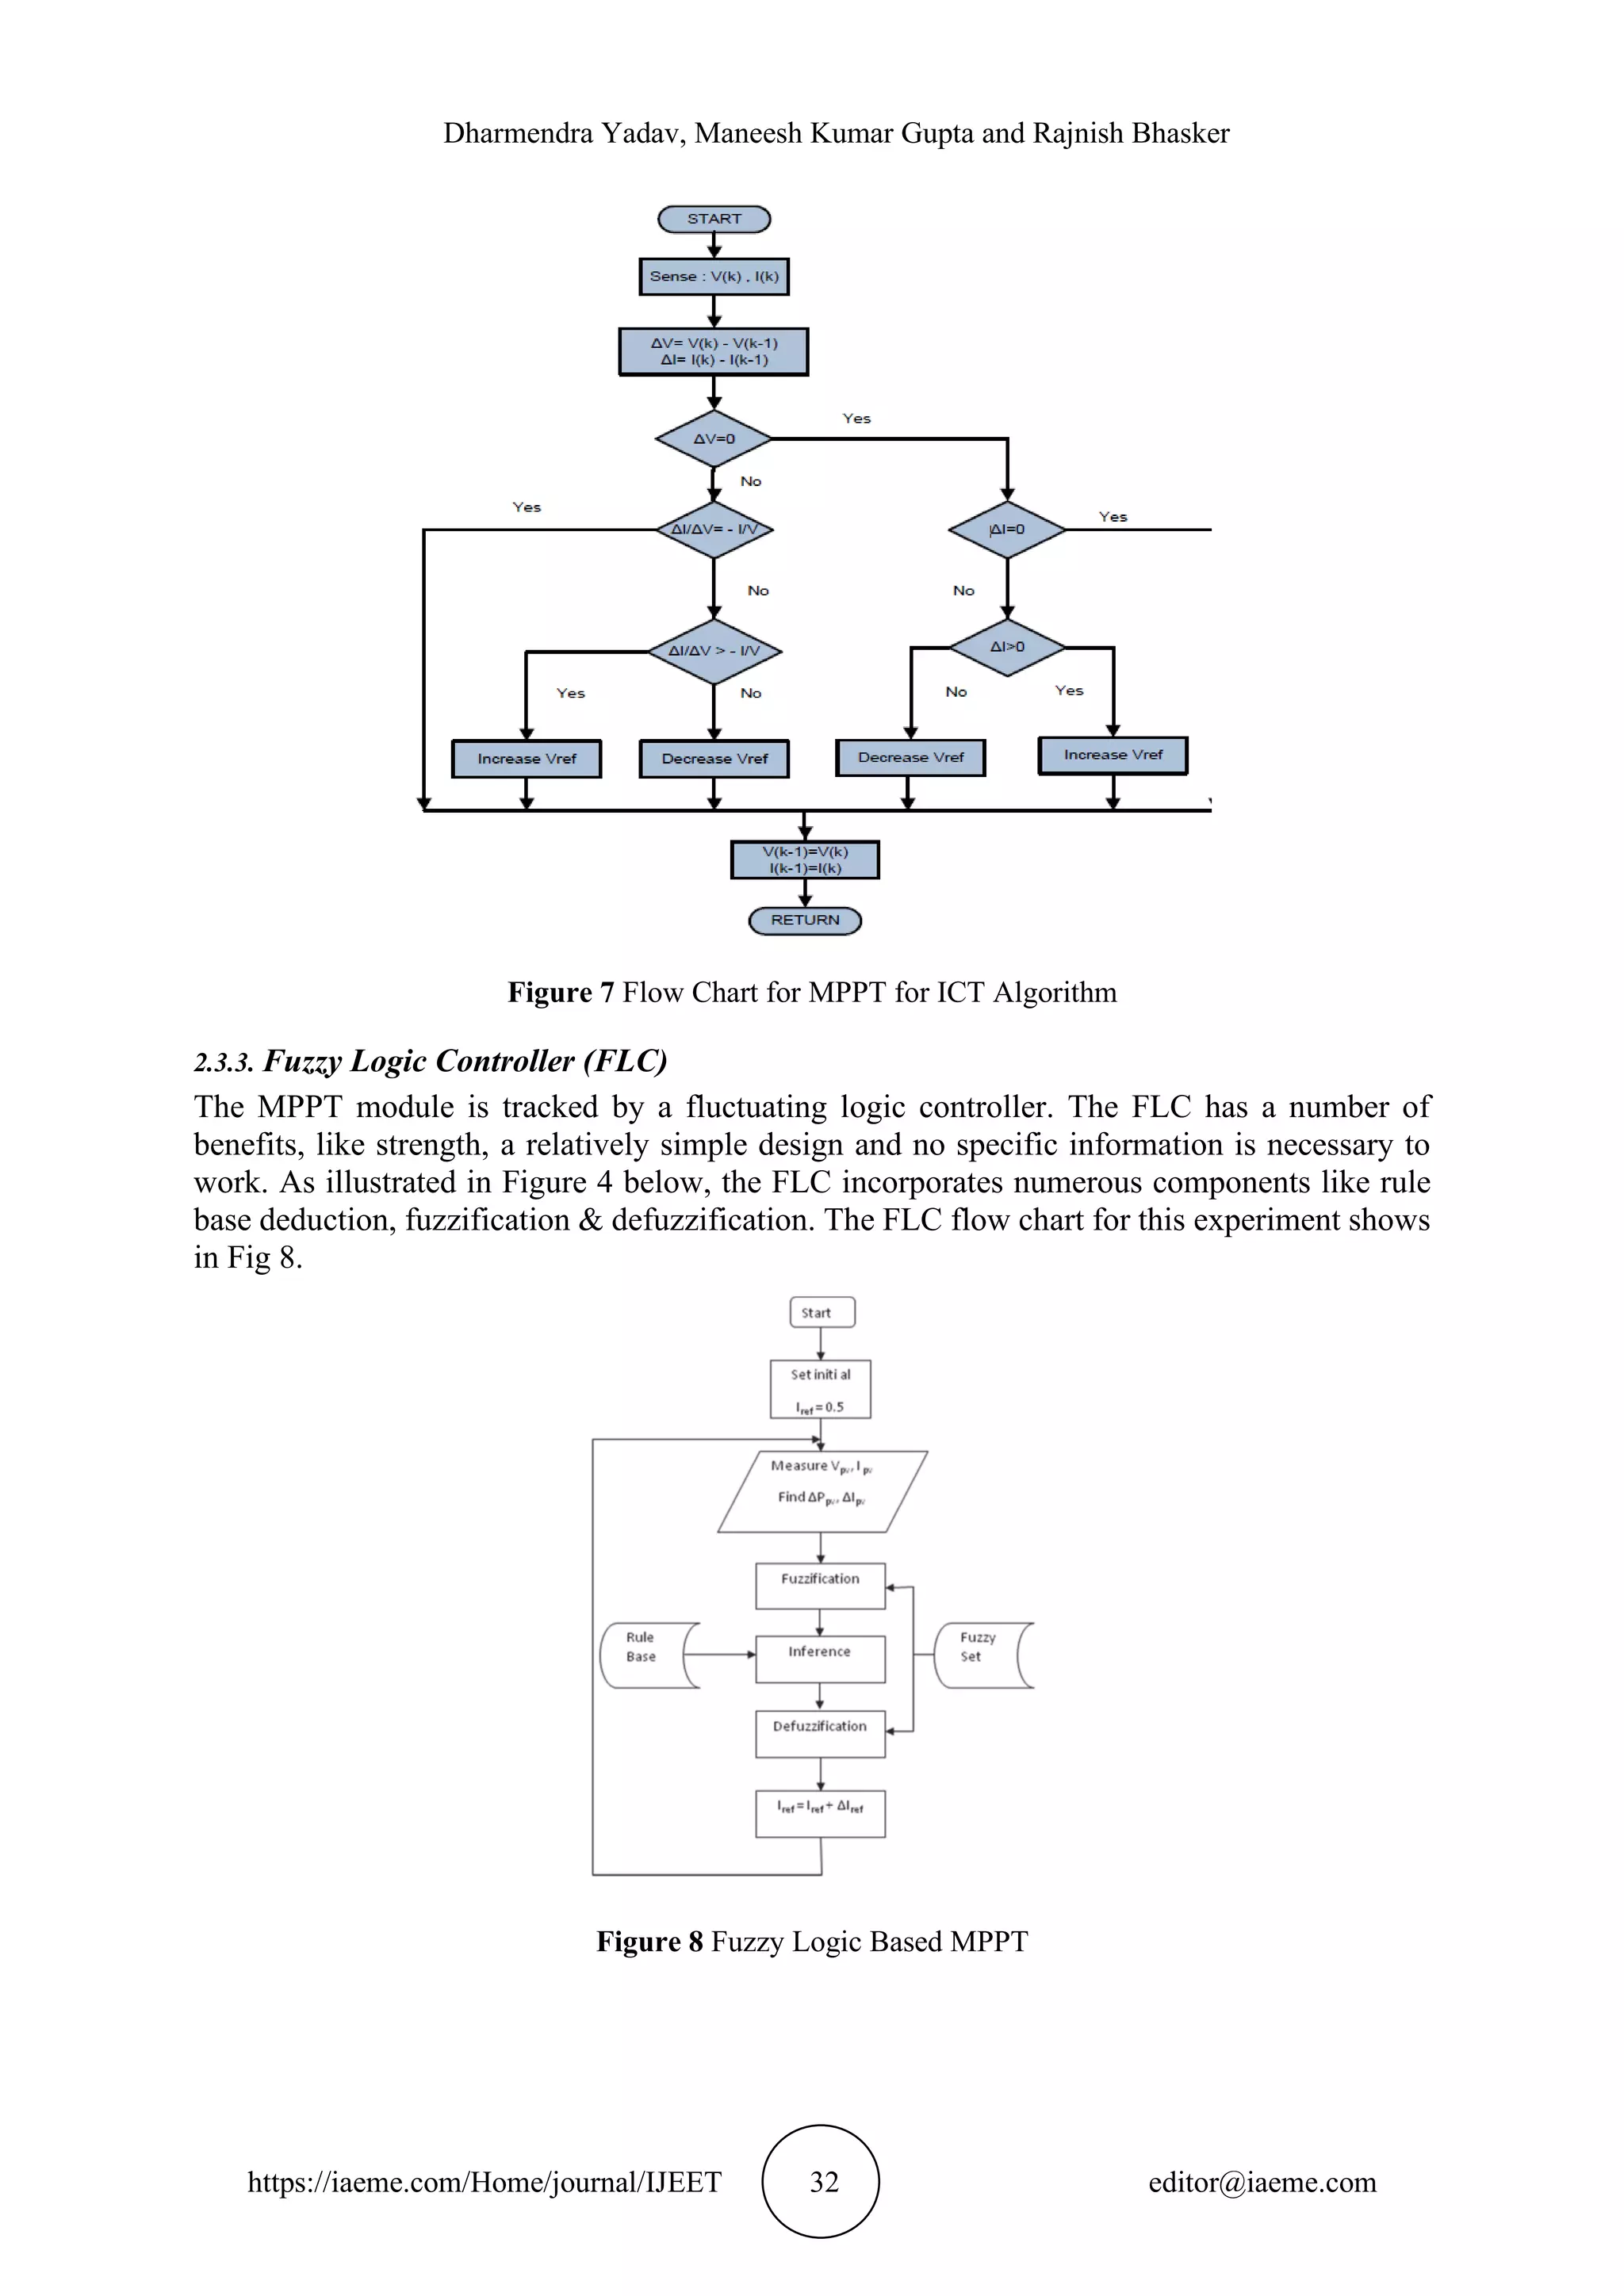
![Simulation and Analysis of different MPPT Algorithms for PV System https://iaeme.com/Home/journal/IJEET 31 editor@iaeme.com 2.3. MPPT Technique 2.3.1. Perturbation & Observation The MPPT approach is used to get the maximum solar panel output and efficiency. It comprises DC-DC converters that connect the load & controller between the photovoltaic panel. The solar modules are non-linear, and they are not fixed electrical sources. This makes it harder to use the energy to provide any load. The goal is to use a boost converter to adjust the duty cycle using an MPPT [1,4,9,13] algorithm. As observed in the PV panel, the MPPT control modifies the resistance by adjusting the working cycle of the boost-converter & therefore forces the Photovoltaic panel to extract maximum Power Point to the load. Several approaches that can efficiently track the MPPT have been developed in present years Figure.6 Perturbation &Observe algorithm based on maximum power point tracking 2.3.2. Incremental Conductance (IC) The PV array's current is proportional to the amount of light it receives. As a result, when the irradiance fluctuates along a slope, the PV current behaves similarly. If the current linearly Changes in this theory, there must be a specified current increment that is ideal for a given (constant) sampling frequency. The current and power both change in the same direction. The current & power don’t smoothly shift when the algorithm is confused, but still utilized by them to detect the MPP shift direction.](https://image.slidesharecdn.com/ijeet1211003-211203132813/75/SIMULATION-AND-ANALYSIS-OF-DIFFERENT-MPPT-ALGORITHMS-FOR-PV-SYSTEM-6-2048.jpg)
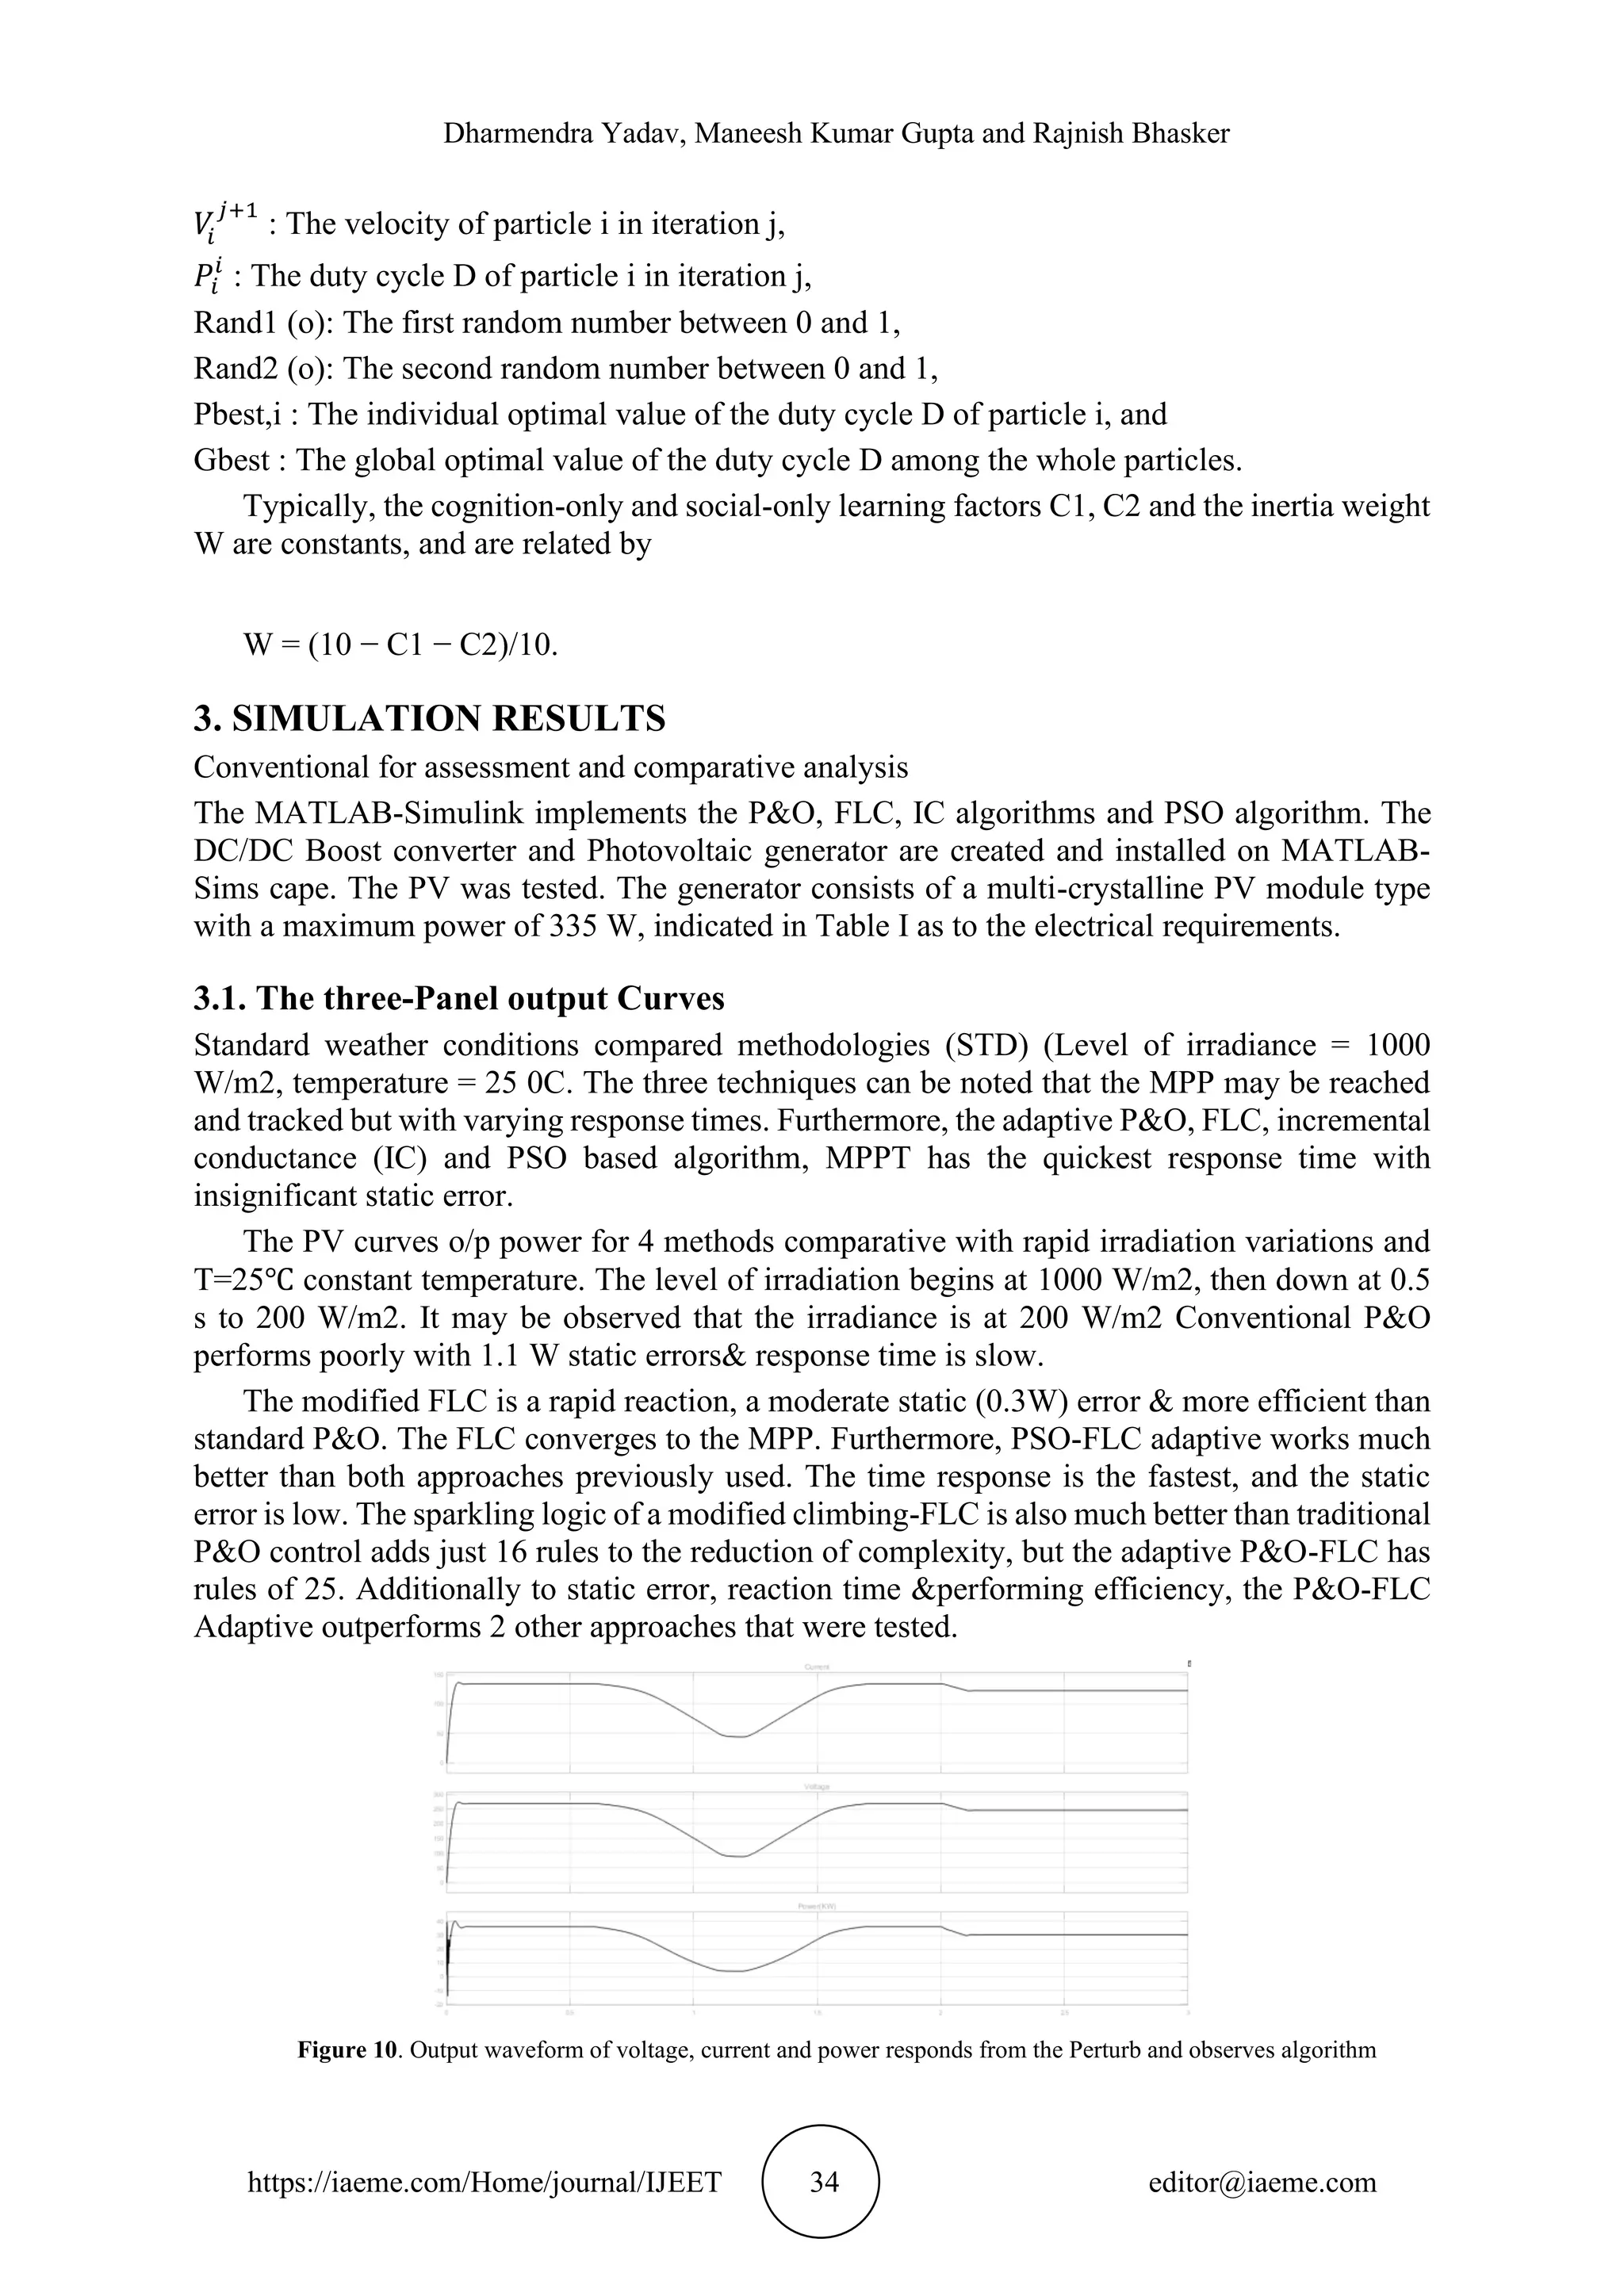
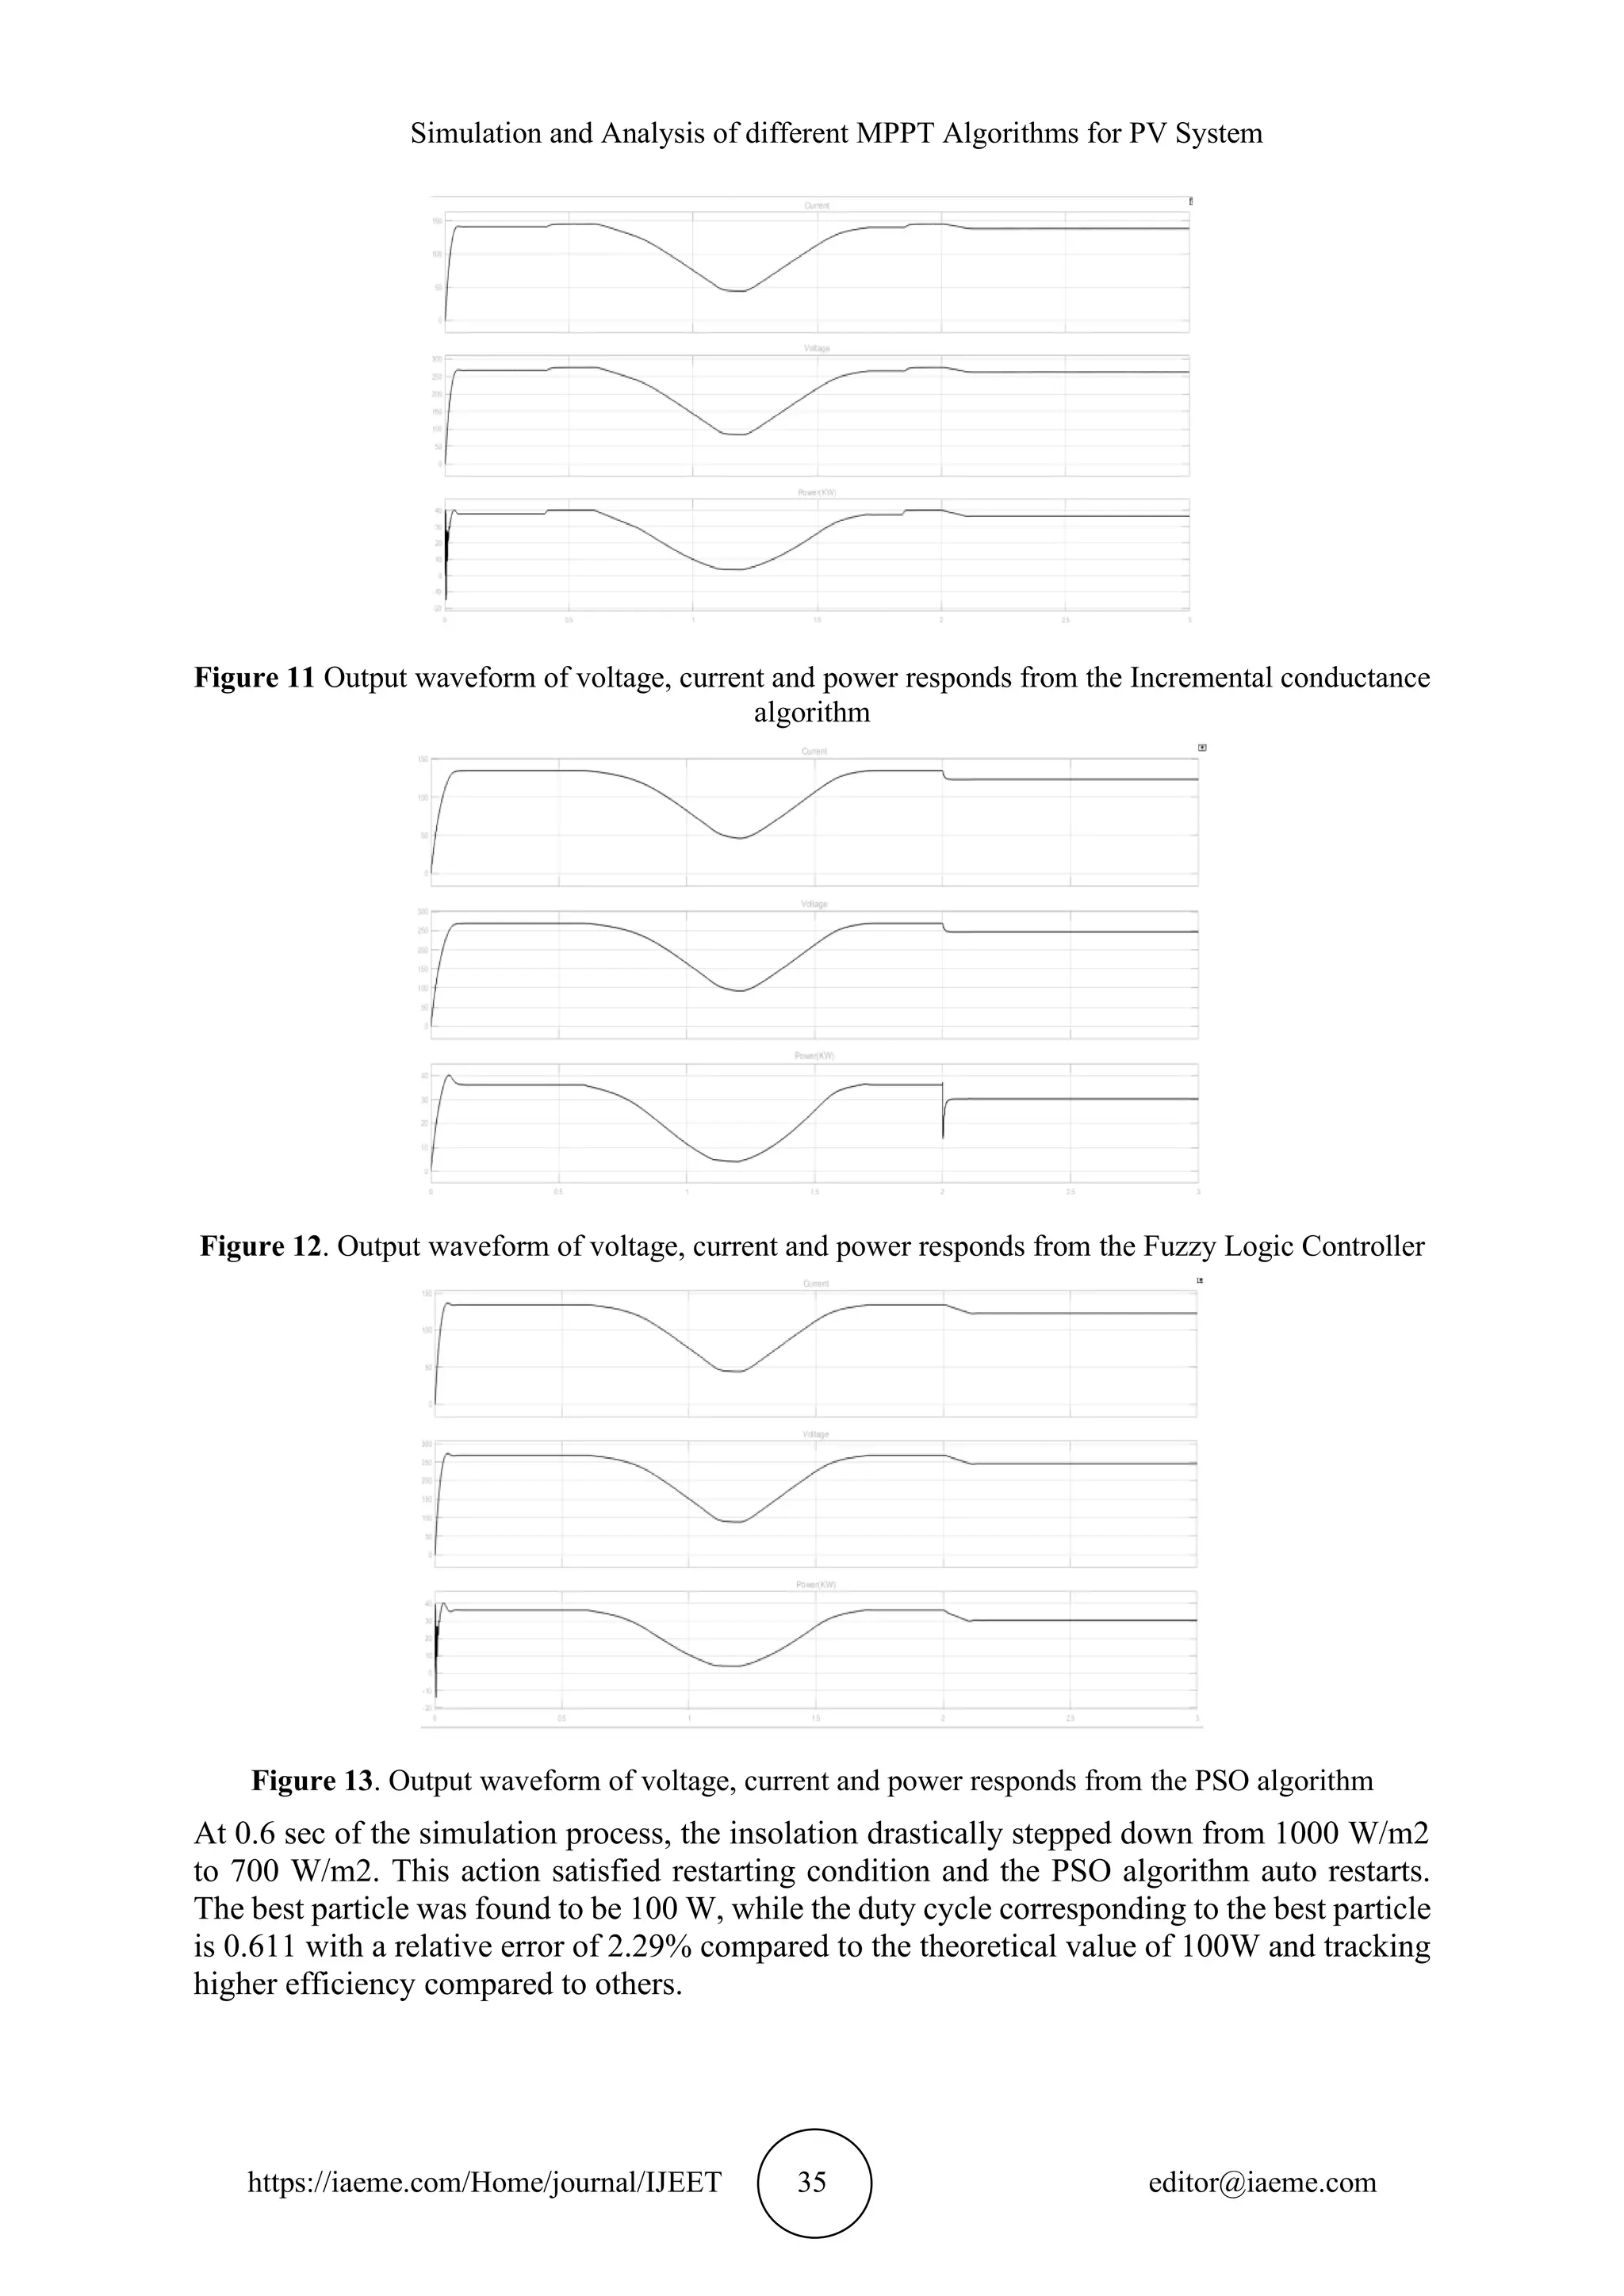
![Dharmendra Yadav, Maneesh Kumar Gupta and Rajnish Bhasker https://iaeme.com/Home/journal/IJEET 36 editor@iaeme.com As per above analysis and its combined wave form stats that the PSO algorithm and fuzzy system are best in among of listed four MPPT algorithm and clearly shown no wide difference in four shown MPPT’s algorithm. Figure 14. Compression result of voltage waveform of P&O, INC, Fuzzy and PSO based algorithm 4. CONCLUSION MATLAB/SIMULINK software employed the paper with the FLC, PSO, INC and P&O technique and the disturbance and observation approach to implement and simulate a photovoltaic (PV) system model. In order to generate power from sunlight, photovoltaic (PV) systems are employed. Instead of the standard energy sources that require fossil fuels and this gives them alternative environmental friendly sources of renewable Manufacture waste & contamination. We use the model to calculate the electrical properties affecting solar temperature, load impedance, solar radiation & photovoltaic system. The developed photovoltaic (PV) system model provides positive outcomes when it comes to identifying the system's current-voltage features, the System's power-voltage features, and MPPT. Finally, it is obvious that the PSO technique has greater benefit than the perturbations and the observation technique when considering the other three approaches applied during the research, as the PSO methodology becomes more stable using the PSO, and the MPPT point oscillation is quite low. REFERENCES [1] M. L. Gaëtan M, Manoël R, Theologitis IT, Myrto P., "Global Market Outlook for Photovoltaics 2013-2017," in Proceedings of the European Photovoltaic Industry Association, Belgium, 2013. [2] B. N. Alajmi, K. H. Ahmed, S. J. Finney, and B. W. Williams, "A Maximum Power Point Tracking Technique for Partially Shaded Photovoltaic Systems in Microgrids," Industrial Electronics, IEEE Transactions on, vol. 60, pp. 1596-1606, 2013. [3] J. C. Vasquez, R. A. Mastromauro, J. M. Guerrero, and M. Liserre, "Voltage Support Provided by a Droop-Controlled Multifunctional Inverter," Industrial Electronics, IEEE Transactions on, vol. 56, pp. 4510-4519, 2009. [4] A. Seon-Ju, P. Jin-woo, C. Il-Yop, M. Seung-Il, K. Sang-Hee, and N. Soon-Ryul, "Power- Sharing Method of Multiple Distributed Generators Considering Control Modes and Configurations of a Microgrid," Power Delivery, IEEE Transactions on, vol. 25, pp. 2007-2016, 2010. [5] G. Diaz, C. Gonzalez-Moran, J. Gomez-Aleixandre, and A. Diez, "Composite Loads in Stand- Alone Inverter-Based Microgrids Modeling Procedure and Effects on Load Margin," Power Systems, IEEE Transactions on, vol. 25, pp. 894-905, 2010.](https://image.slidesharecdn.com/ijeet1211003-211203132813/75/SIMULATION-AND-ANALYSIS-OF-DIFFERENT-MPPT-ALGORITHMS-FOR-PV-SYSTEM-11-2048.jpg)
![Simulation and Analysis of different MPPT Algorithms for PV System https://iaeme.com/Home/journal/IJEET 37 editor@iaeme.com [6] R. Boukenoui, R. Bradai, H. Salhi, and A. Mellit, "Modeling and simulation of photovoltaic strings under partial shading conditions using Matlab/Simscape," in Clean Electrical Power (ICCEP), 2015 International Conference on, 2015, pp. [7] M. A. S. Masoum, H. Dehbonei, and E. F. Fuchs, "Theoretical and experimental analyses of photovoltaic systems with voltage and current-based maximum power-point tracking," Energy Conversion, IEEE Transactions on, vol. 17, pp. 514-522, 2002. [8] T. Esram and P. L. Chapman, "Comparison of photovoltaic array maximum power point tracking techniques," IEEE Transactions on Energy Conversion EC, vol. 22, p. 439, 2007. [9] T. Noguchi, S. Togashi, and R. Nakamoto, "Short-current pulse-based maximum-power-point tracking method for multiple photovoltaic and-converter module system," Industrial Electronics, IEEE Transactions on, vol. 49, pp. 217-223, 2002. [10] A. K. Abdelsalam, A. M. Massoud, S. Ahmed, and P. Enjeti, "High Performance Adaptive Perturb and Observe MPPT Technique for Photovoltaic-Based Microgrids," Power Electronics, IEEE Transactions on, vol. 26, pp. 1010-1021, 2011. [11] A. Safari and S. Mekhilef, "Simulation and Hardware Implementation of Incremental Conductance MPPT With Direct Control Method Using Cuk Converter," Industrial Electronics, IEEE Transactions on, vol. 58, pp. 1154-1161, 2011. [12] S. B. Kjaer, "Evaluation of the “Hill Climbing” and the “Incremental Conductance” Maximum Power Point Trackers for Photovoltaic Power Systems," Energy Conversion, IEEE Transactions on, vol. 27, pp. 922-929, 2012. [13] T. Esram, J. W. Kimball, P. T. Krein, P. L. Chapman, and P. Midya, "Dynamic maximum power point tracking of photovoltaic arrays using ripple correlation control," Power Electronics, IEEE Transactions on, vol. 21, pp. 1282-1291, 2006. [14] A. Mellit and S. A. Kalogirou, "MPPT-based artificial intelligence techniques for photovoltaic systems and their implementation into the field programmable gate array chips: Review of current status and future perspectives," Energy, vol. 70, pp. 1-21, 2014. [15] A. Mellit, H. Rezzouk, A. Messai, and B. Medjahed, "FPGA-based real-time implementation of MPPT-controller for photovoltaic systems," Renewable Energy, vol. 36, pp. 1652-1661, 2011. [16] M. MohdZainuri, M. Radzi, M. Amran, A. C. Soh, and N. Rahim, "Development of adaptive perturb and observe-fuzzy control maximum power point tracking for photovoltaic boost dc-dc converter," Renewable Power Generation, IET, vol. 8, pp. 183-194, 2014. [17] G. Farivar and B. Asaei, "A New Approach for Solar Module Temperature Estimation Using the Simple Diode Model," Energy Conversion, IEEE Transactions on, vol. 26, pp. 1118-1126, 2011. [18] B. N. Alajmi, K. H. Ahmed, S. J. Finney, and B. W. Williams, "Fuzzy-logic-control approach of a modified hill-climbing method for maximum power point in microgrid standalone photovoltaic system," Power Electronics, IEEE Transactions on, vol. 26, pp. 1022-1030, 2011. [19] A. Messai, A. Mellit, A. Guessoum, and S. Kalogirou, "Maximum power point tracking using a GA optimized fuzzy logic controller and its FPGA implementation," Solar Energy, vol. 85, pp. 265-277, 2011.](https://image.slidesharecdn.com/ijeet1211003-211203132813/75/SIMULATION-AND-ANALYSIS-OF-DIFFERENT-MPPT-ALGORITHMS-FOR-PV-SYSTEM-12-2048.jpg)

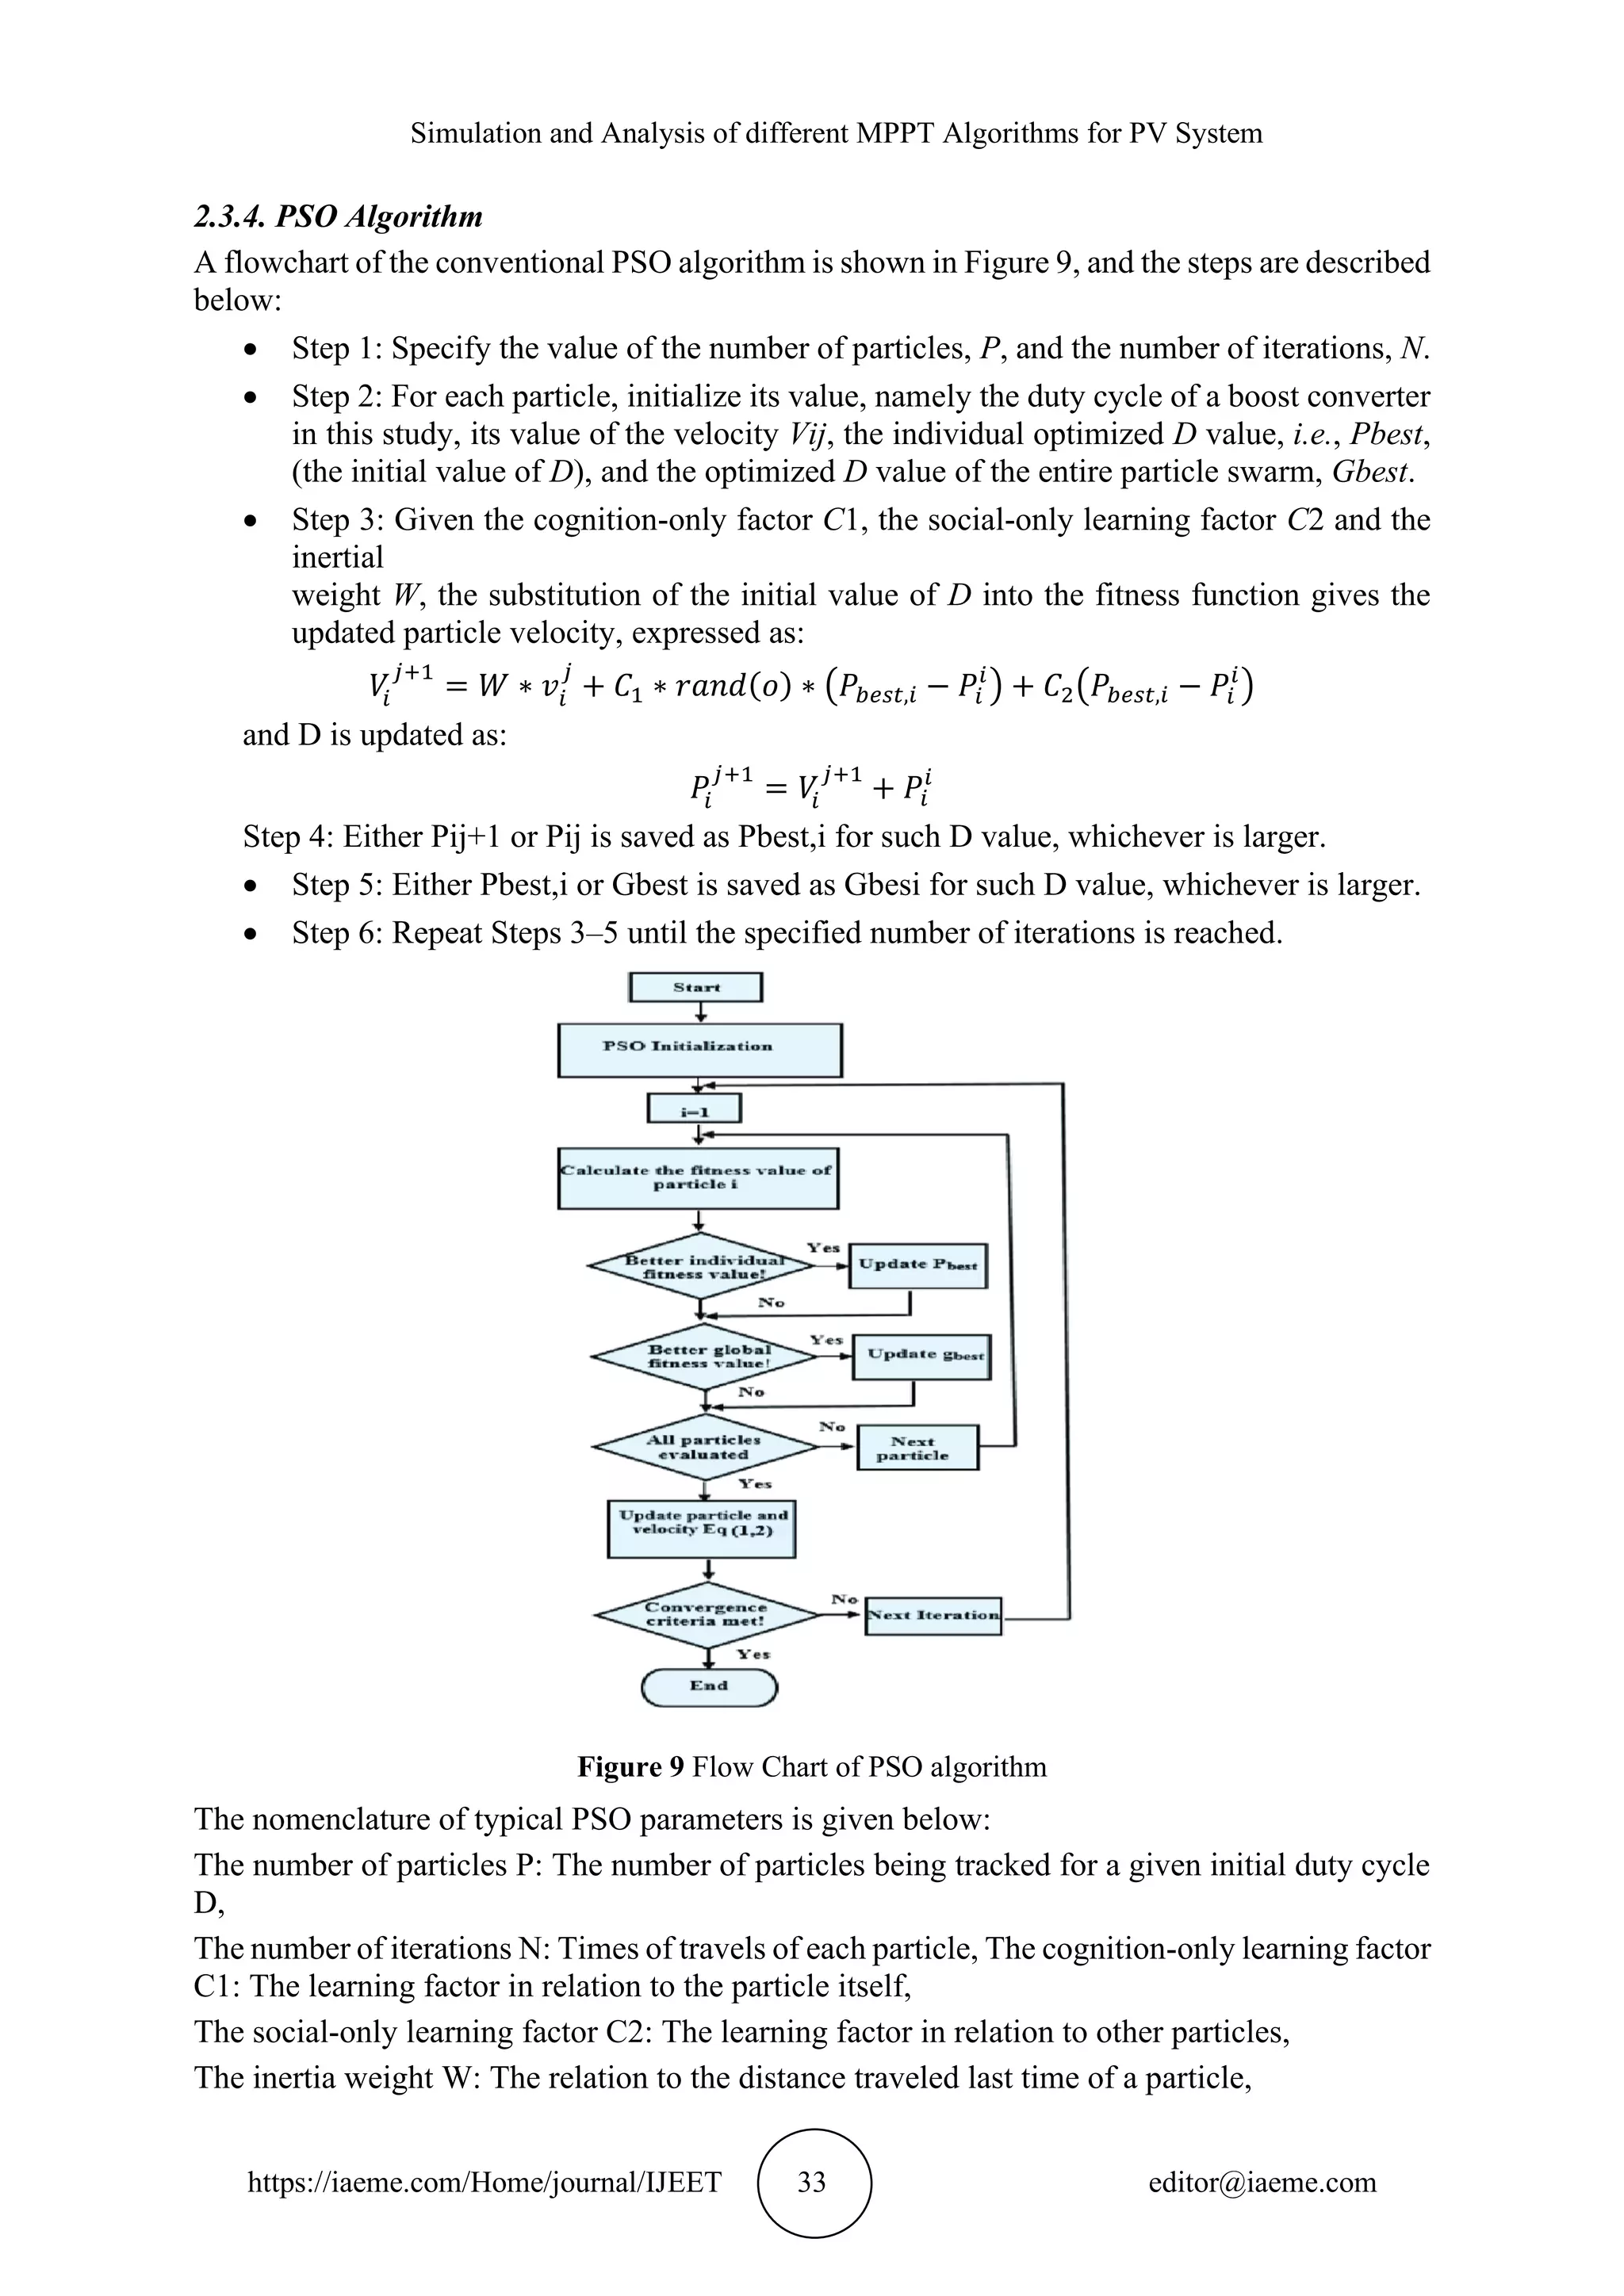
This document summarizes and compares different maximum power point tracking (MPPT) algorithms that can be used for photovoltaic systems. It begins with an introduction to MPPT and its importance for improving PV system performance. It then describes modeling of the PV system and components like the DC-DC boost converter. Four MPPT algorithms are discussed - Perturb and Observe (P&O), Incremental Conductance (IC), Fuzzy Logic Controller (FLC), and Particle Swarm Optimization (PSO). The document provides flowcharts to illustrate how each algorithm works and compares their advantages/disadvantages. Simulation results are presented to demonstrate the ability of these algorithms to track the maximum power point under changing irradiance