Downloaded 494 times


The document provides a detailed overview of memory management considerations when migrating to Java 8, focusing on memory types such as stack, heap, and metaspace, as well as garbage collection methods. It highlights the differences in memory behavior and errors between Java 6, 7, and 8, particularly with the transition from permgen to metaspace. Additionally, the document emphasizes the need for monitoring metaspace and selecting appropriate garbage collection strategies to optimize performance.
An introduction to memory management concepts in the context of Java 8, set by Todd Rader of AppDynamics.
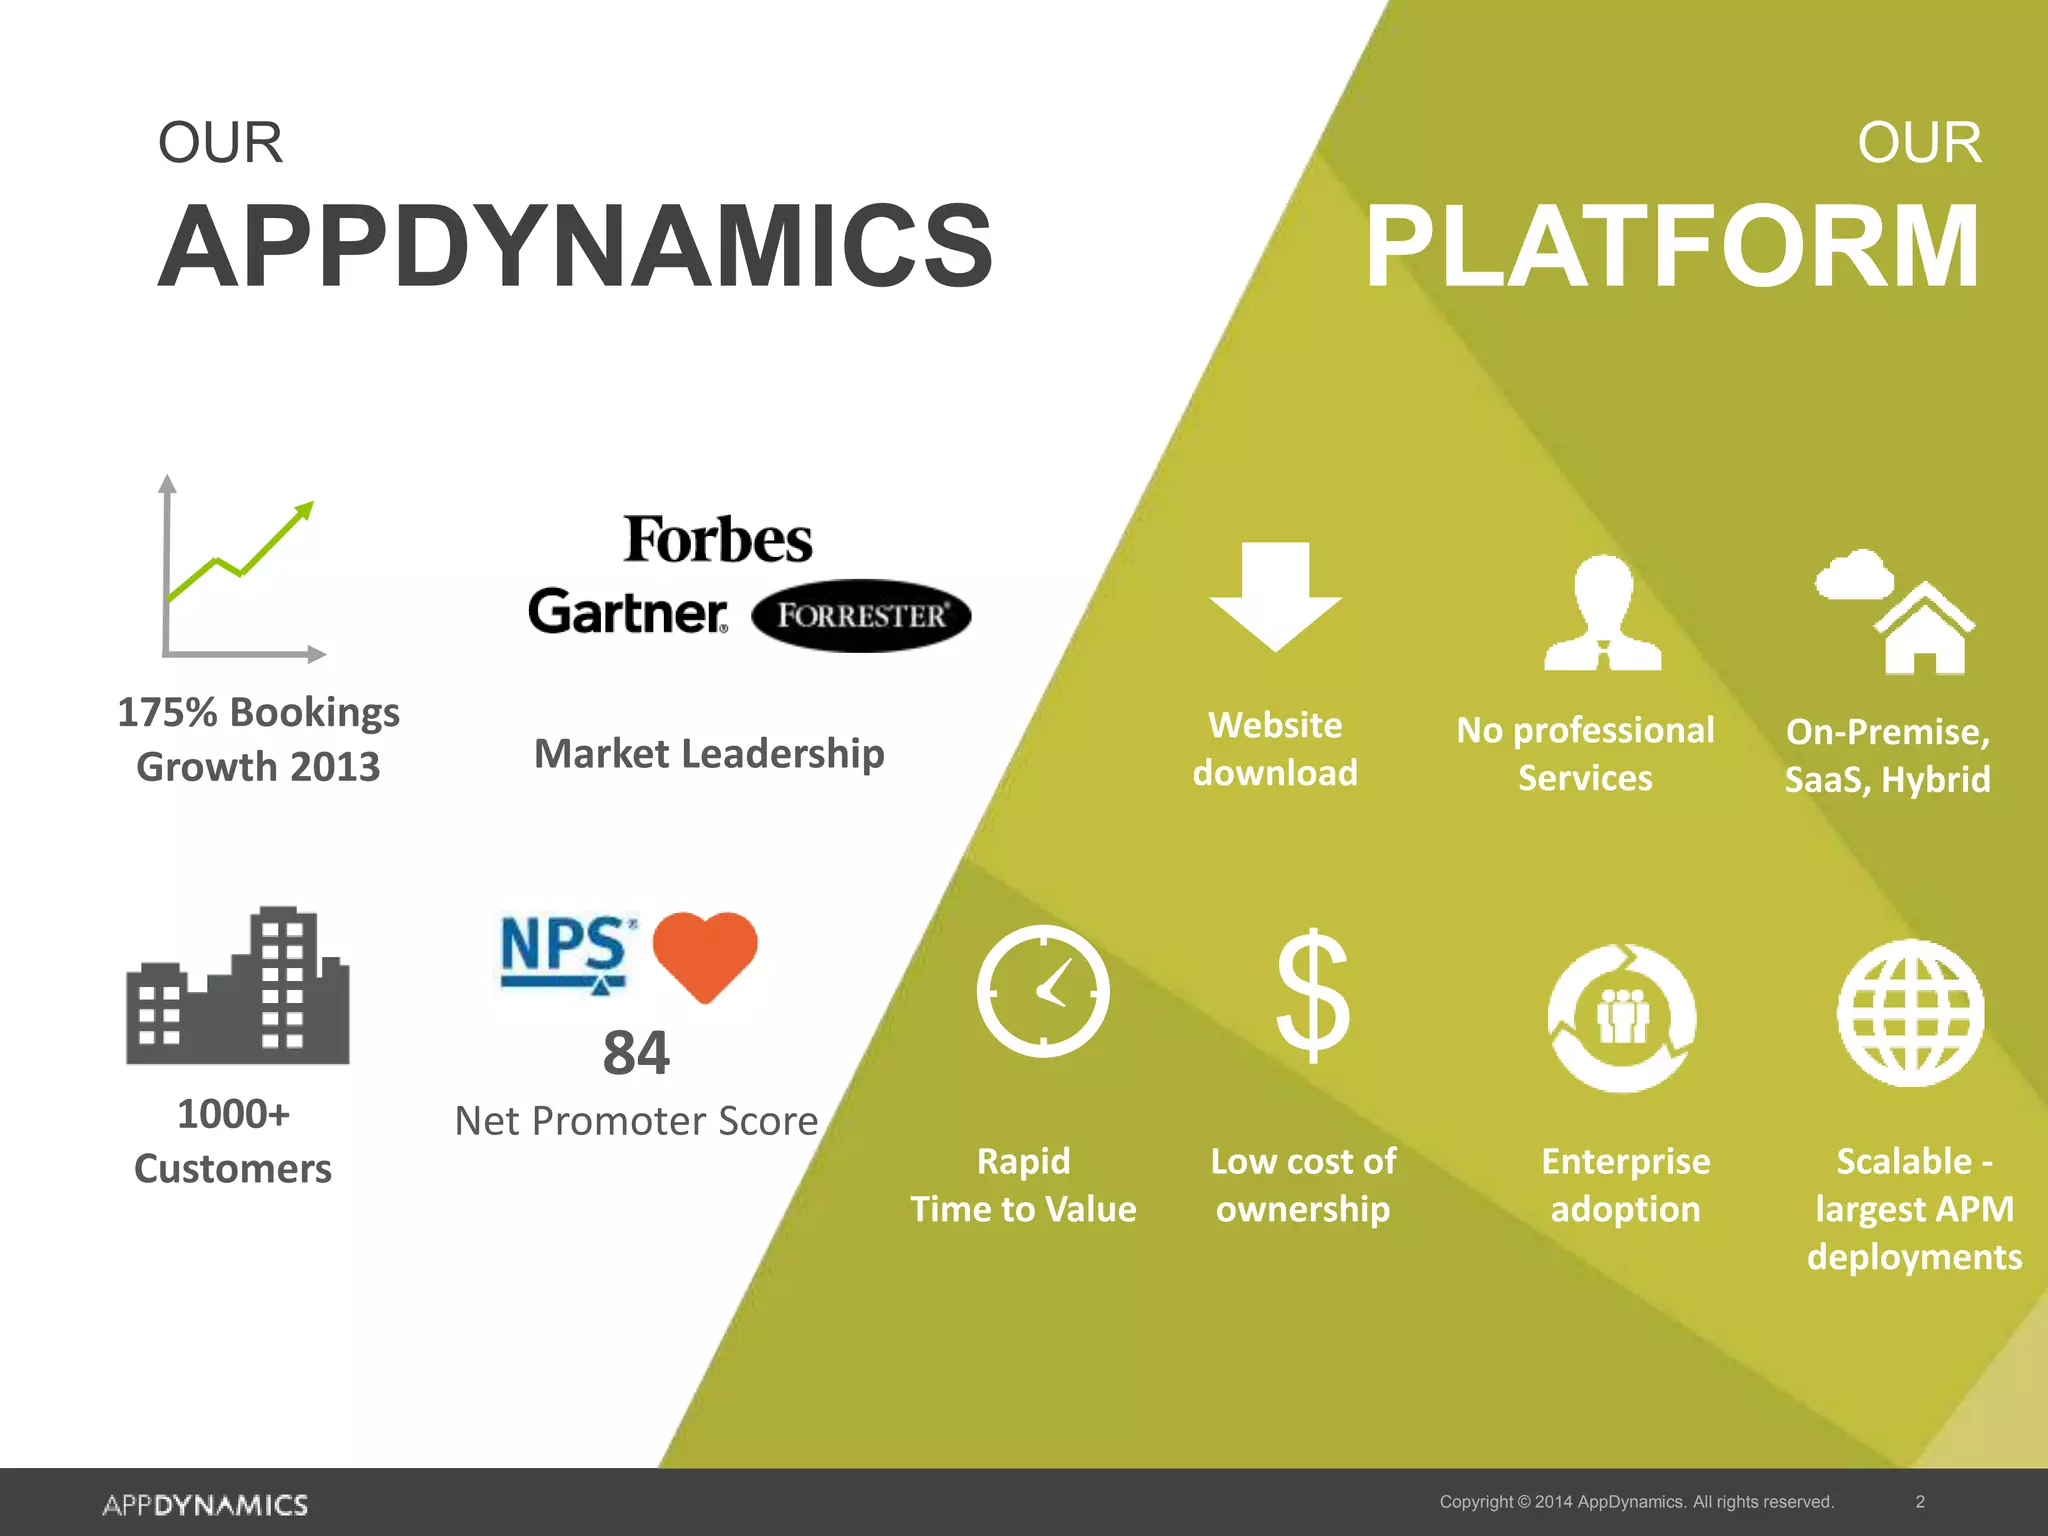
AppDynamics showcases strong market growth with 175% bookings growth in 2013 and over 1000 customers; highlights low ownership costs and enterprise adoption.
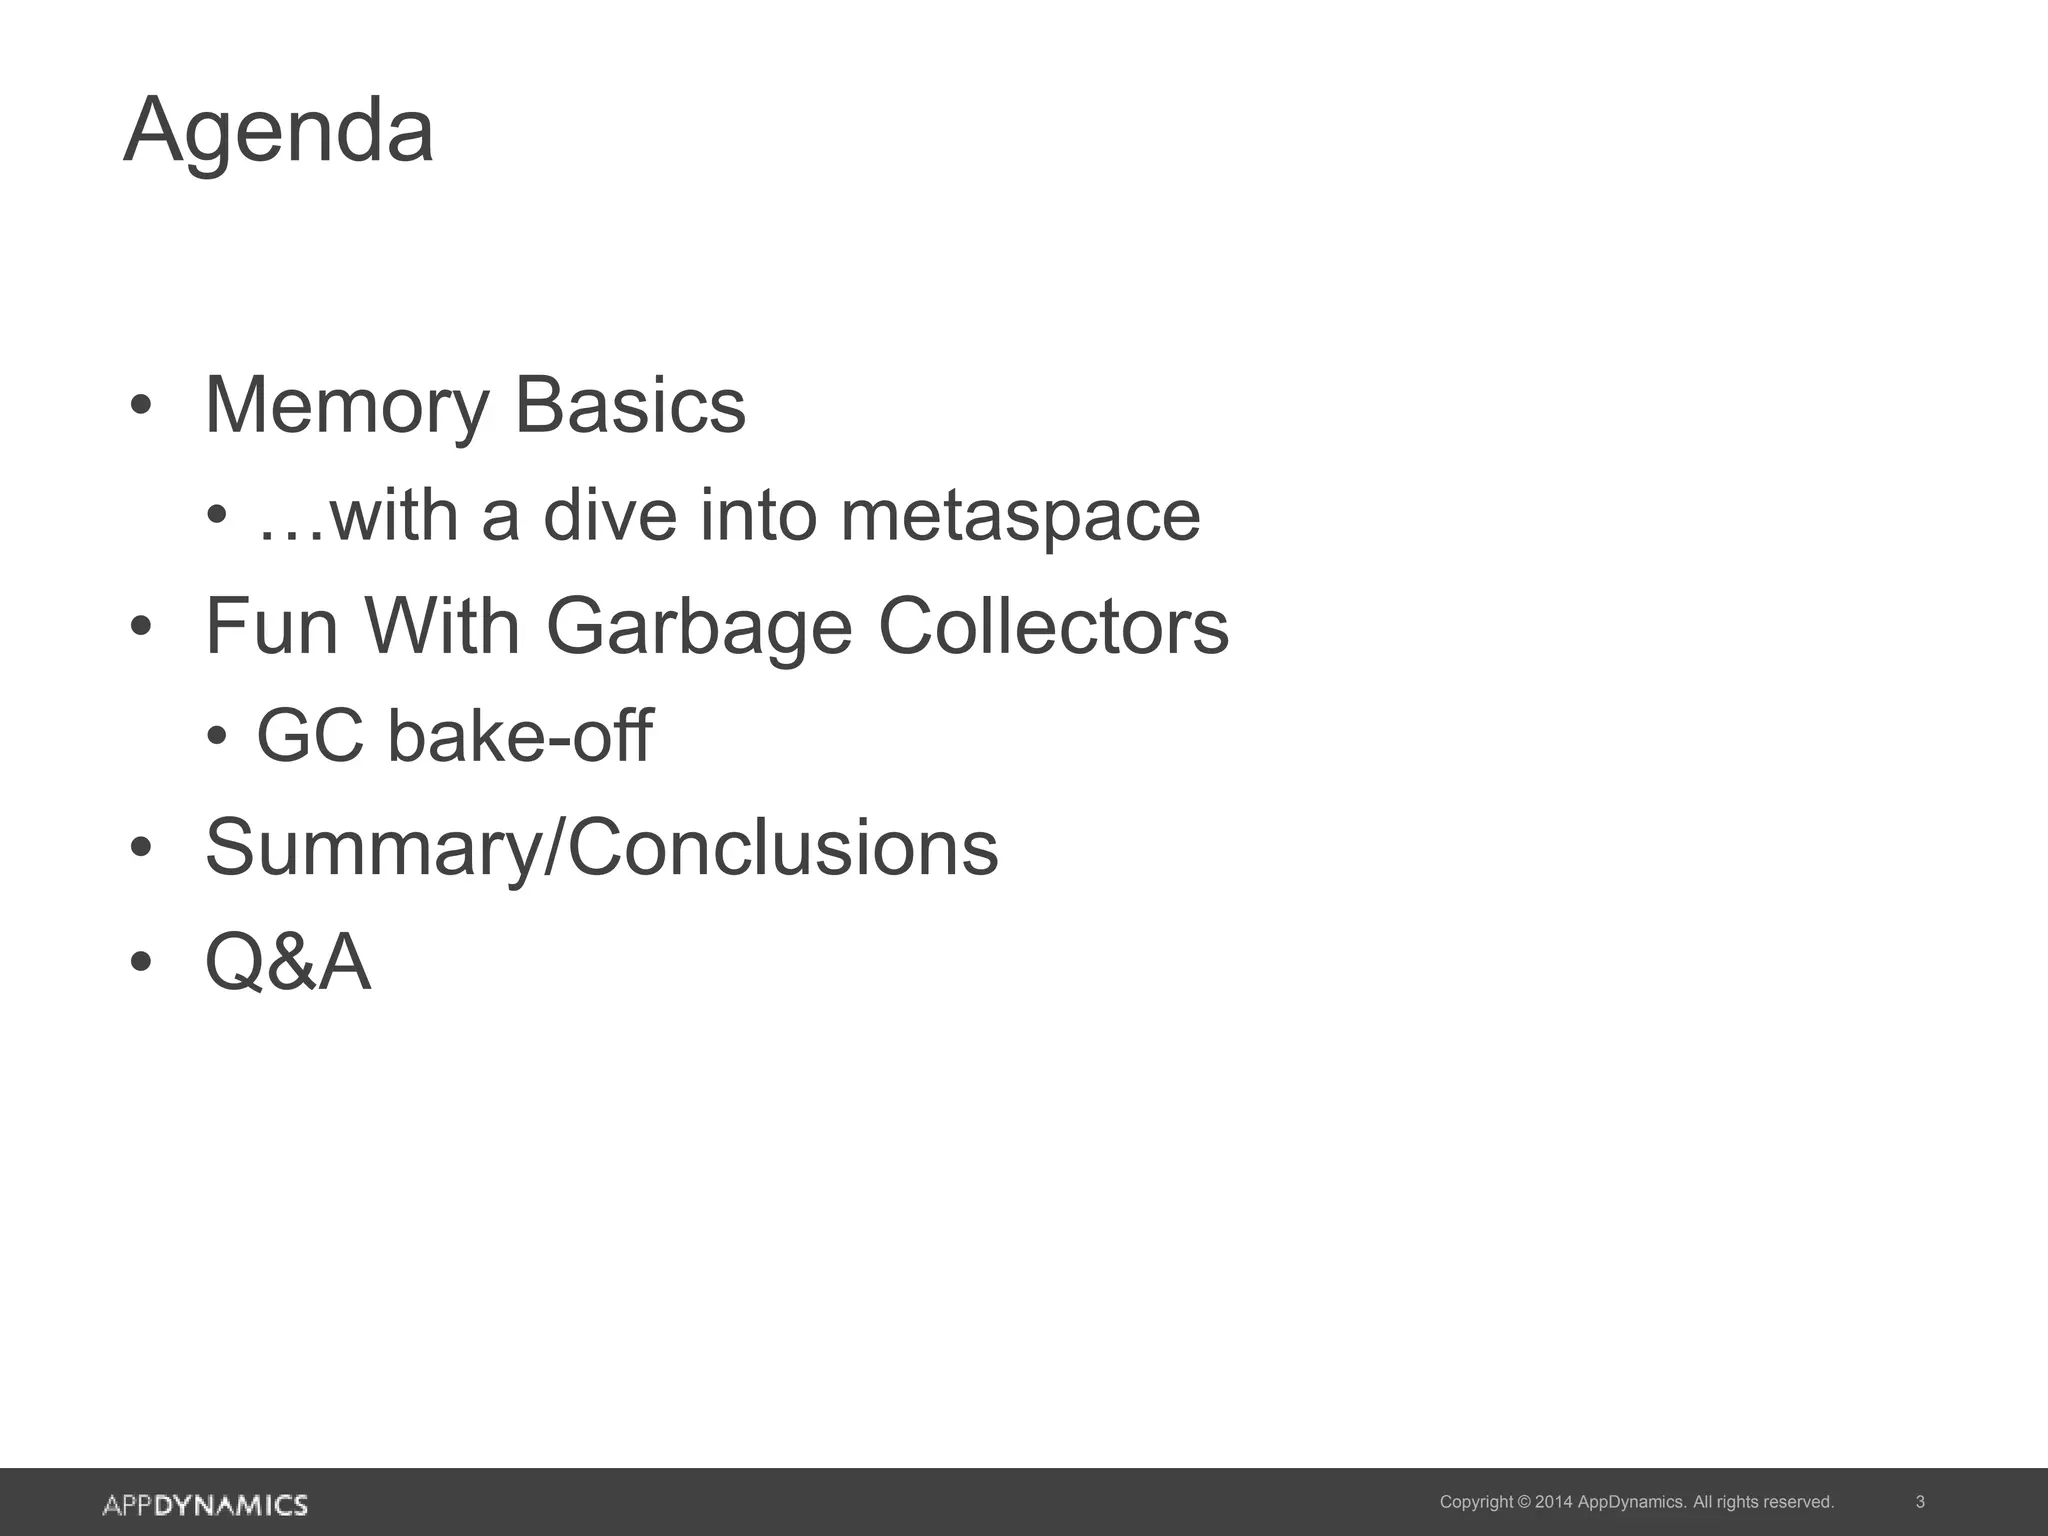
Outline of topics including memory basics, garbage collectors, a bake-off comparison, summary, and Q&A session.
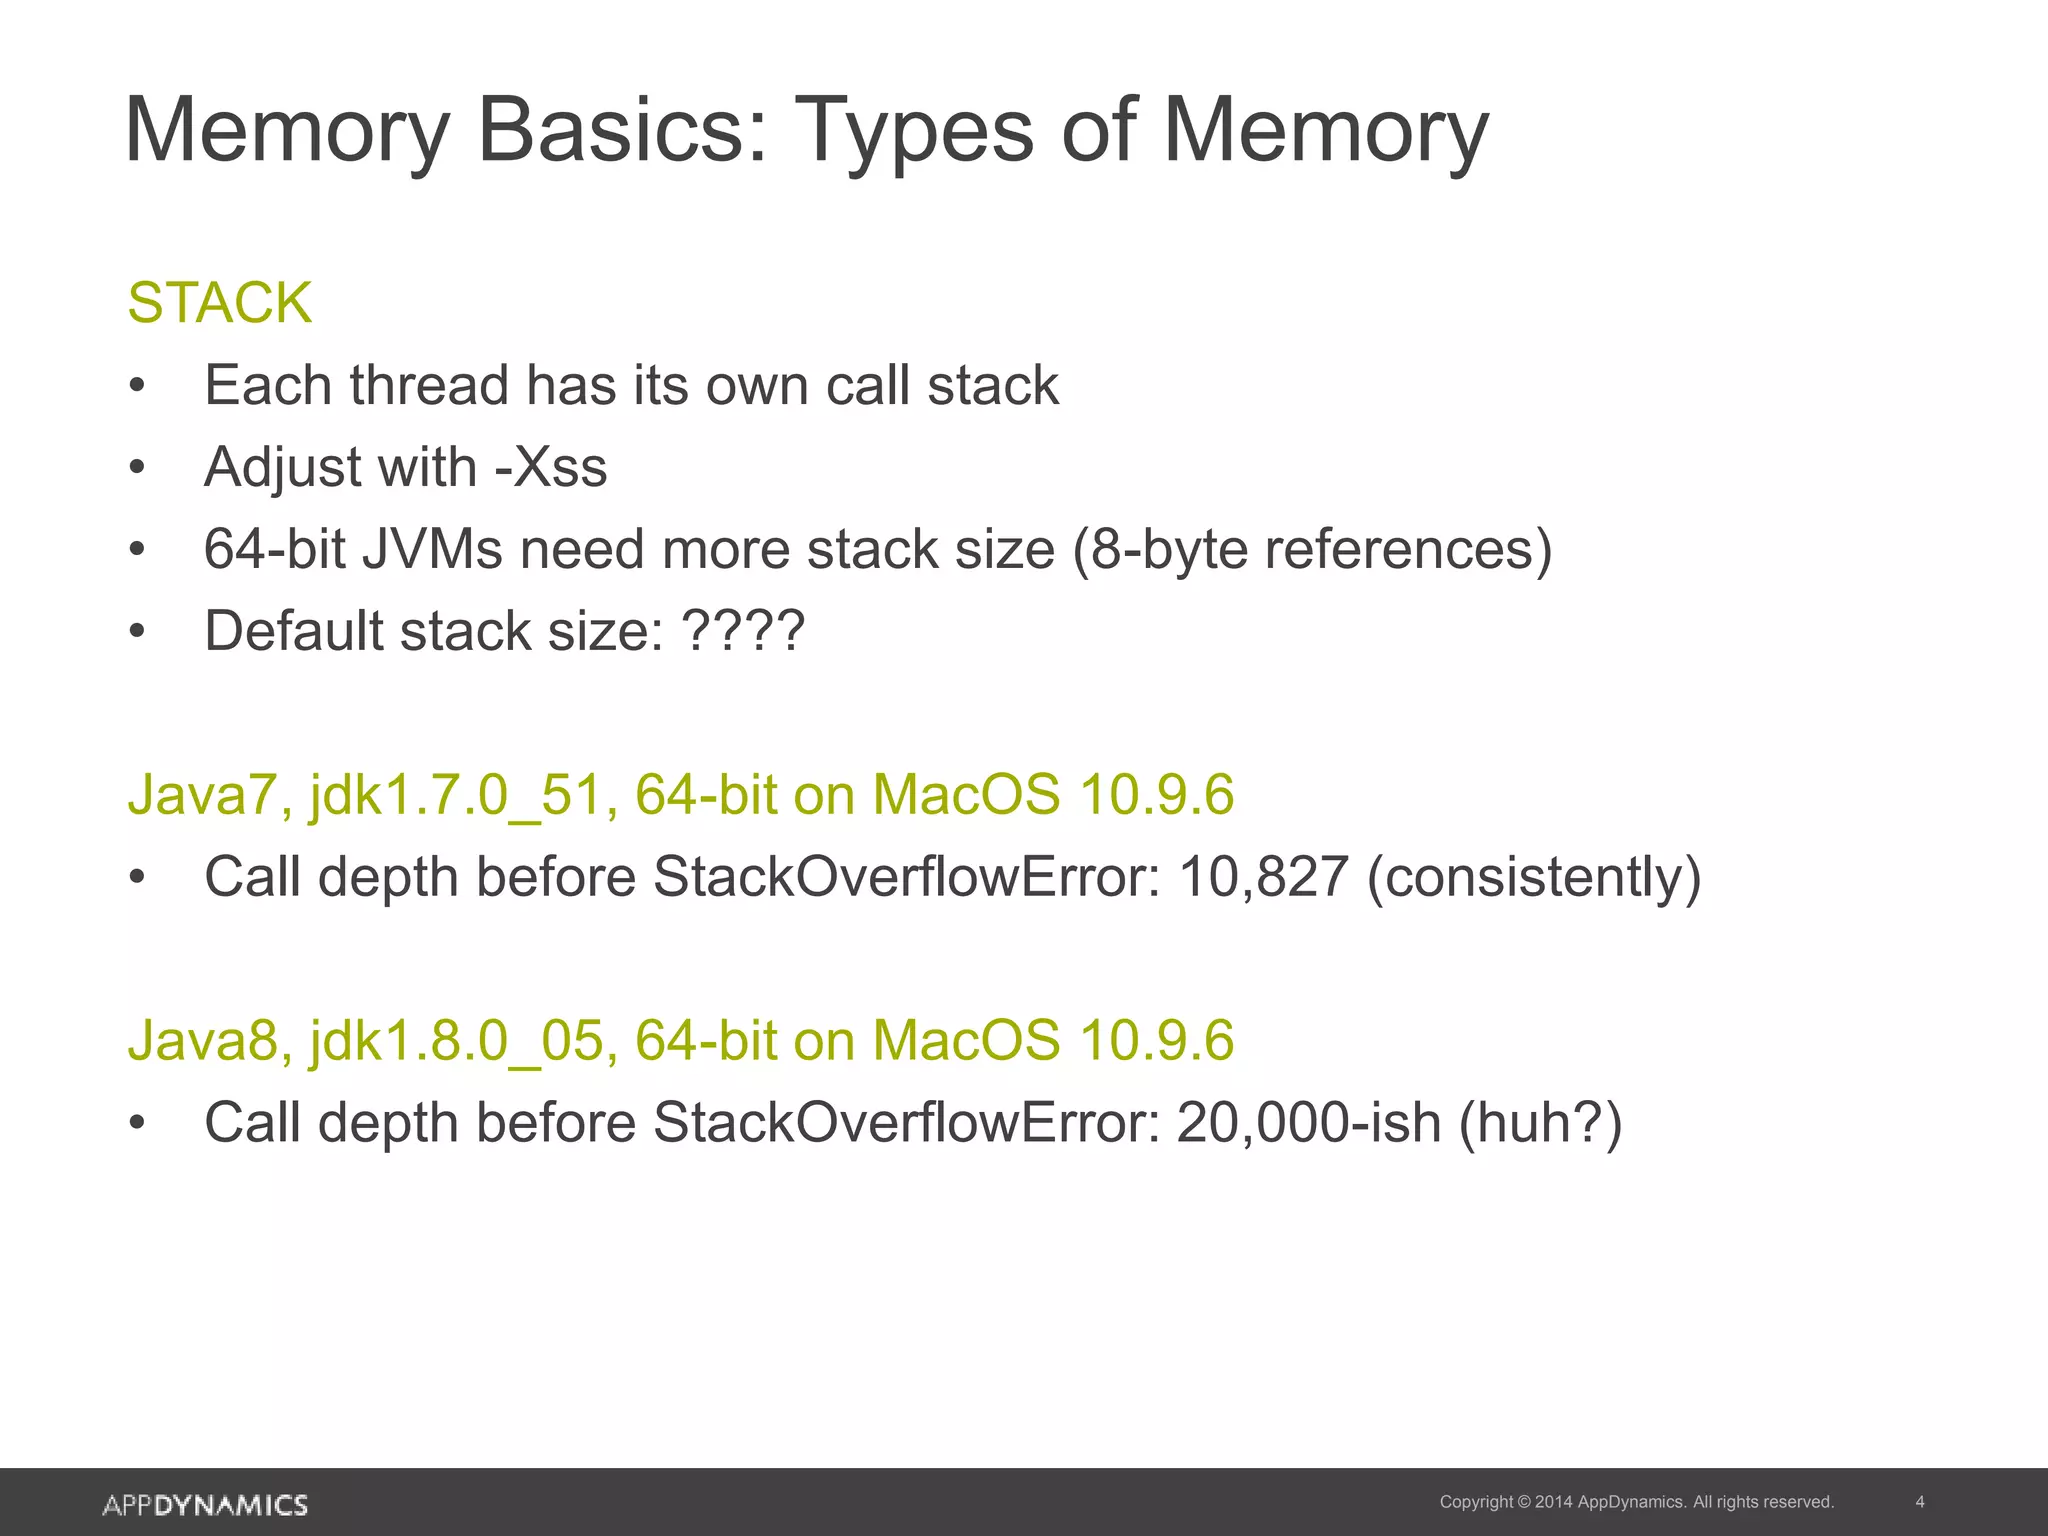
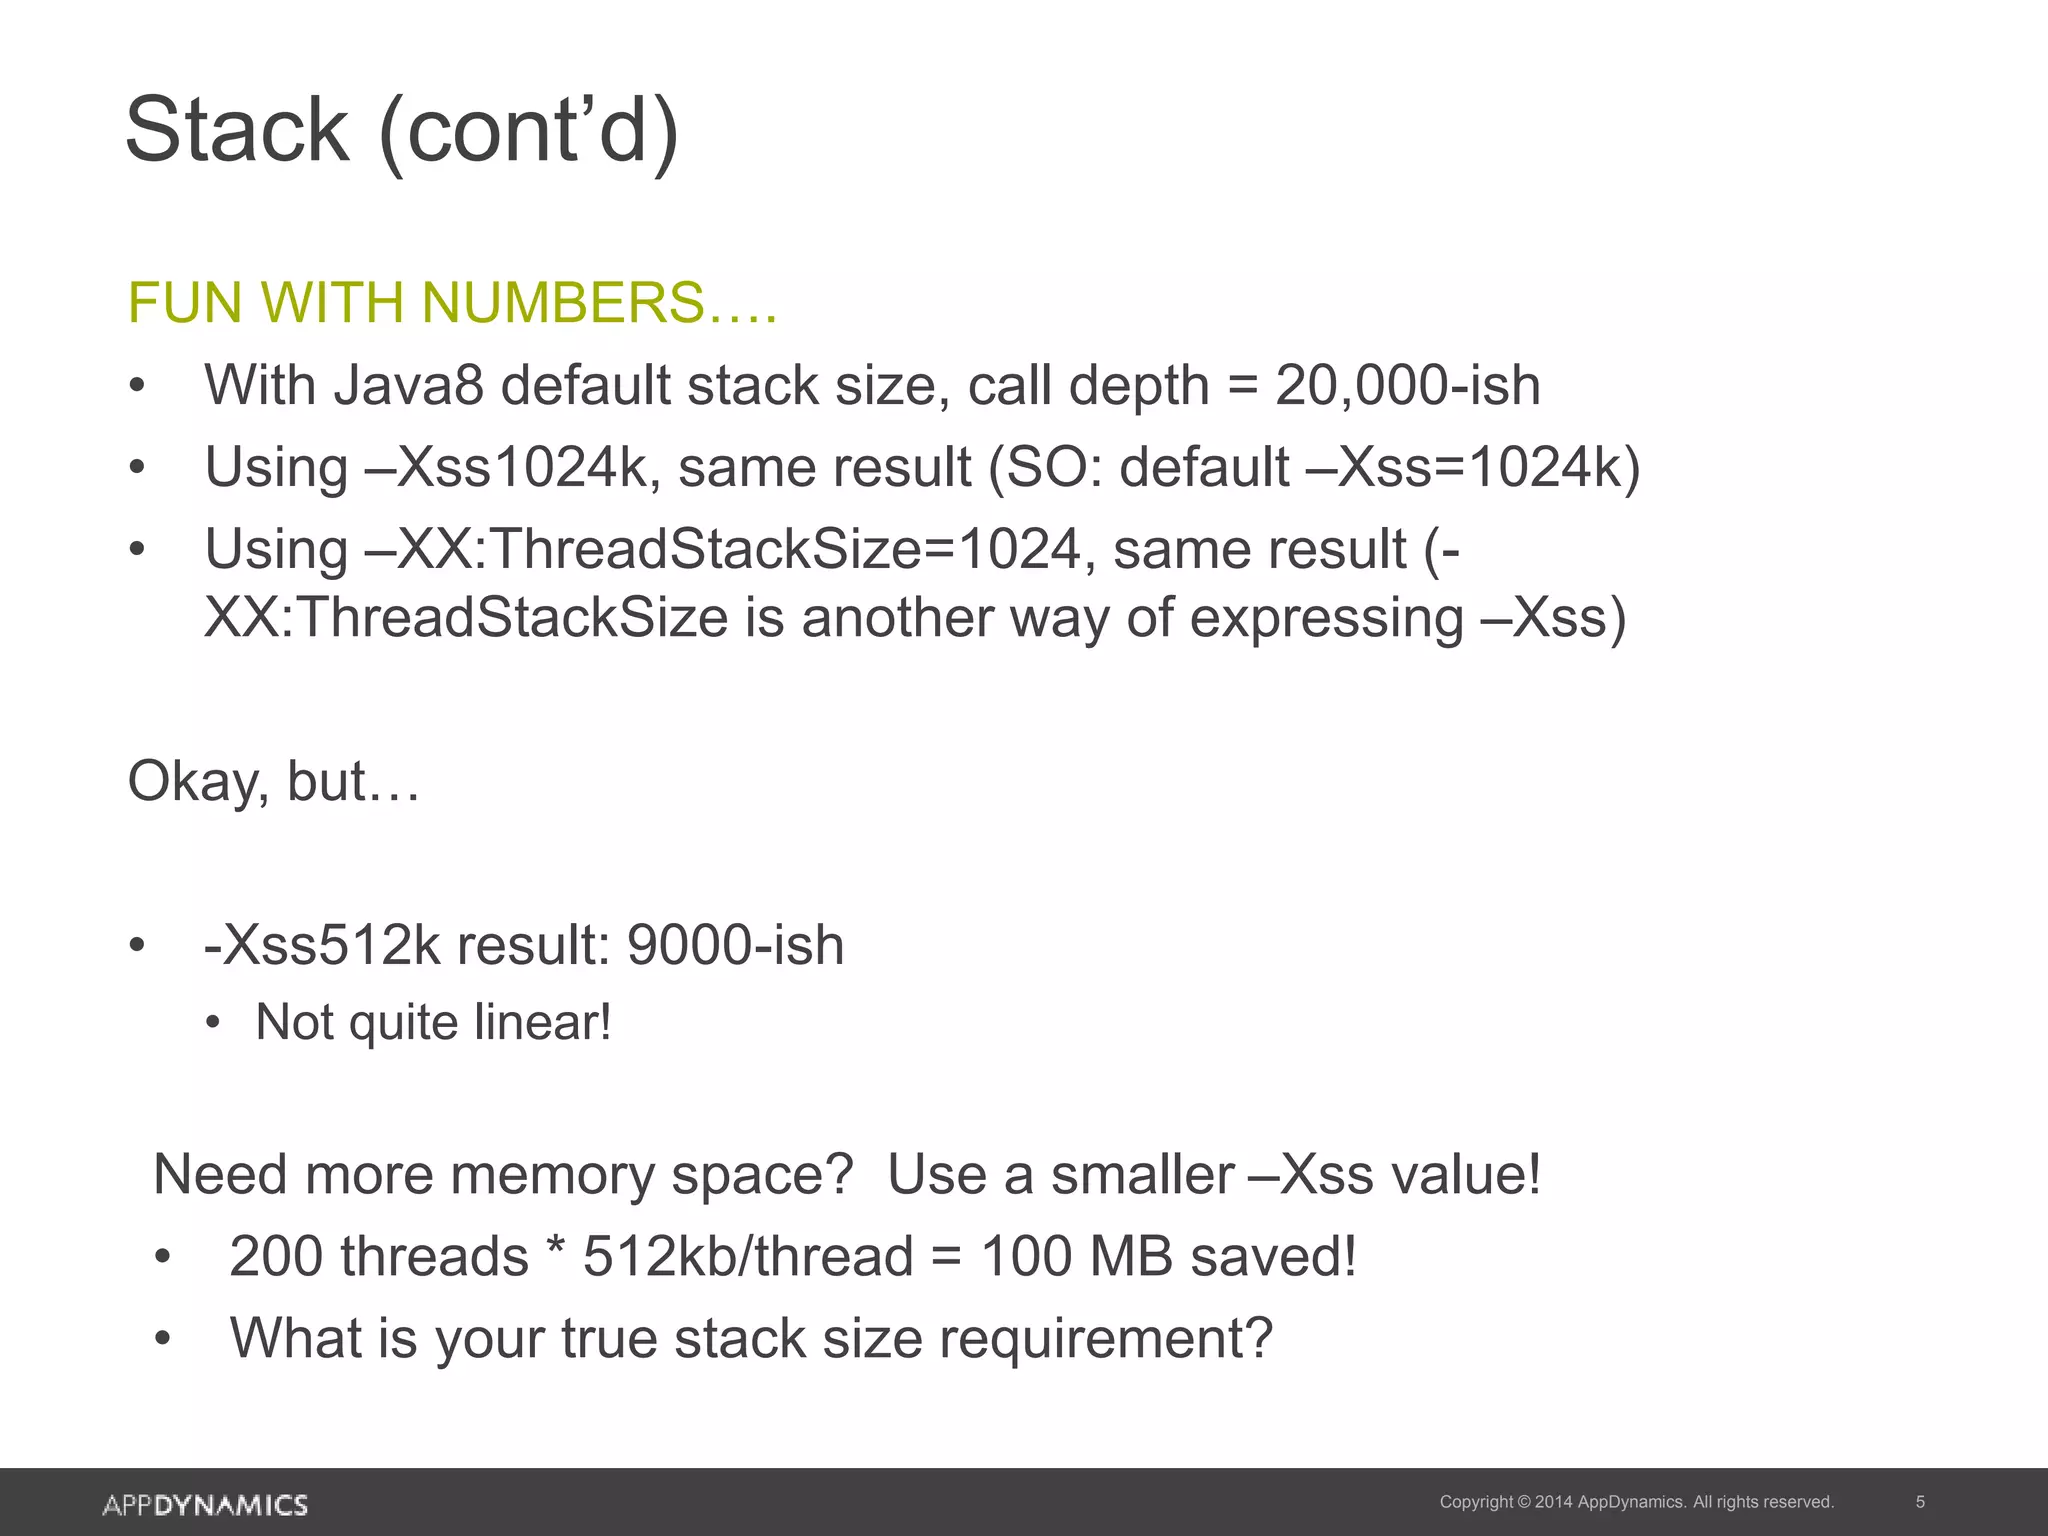
Description of stack memory in Java, including call stack per thread, stack size adjustments, and observed call depth before StackOverflowError.
Insights into stack size adjustments and their impact on performance, with specific examples showing potential memory savings.
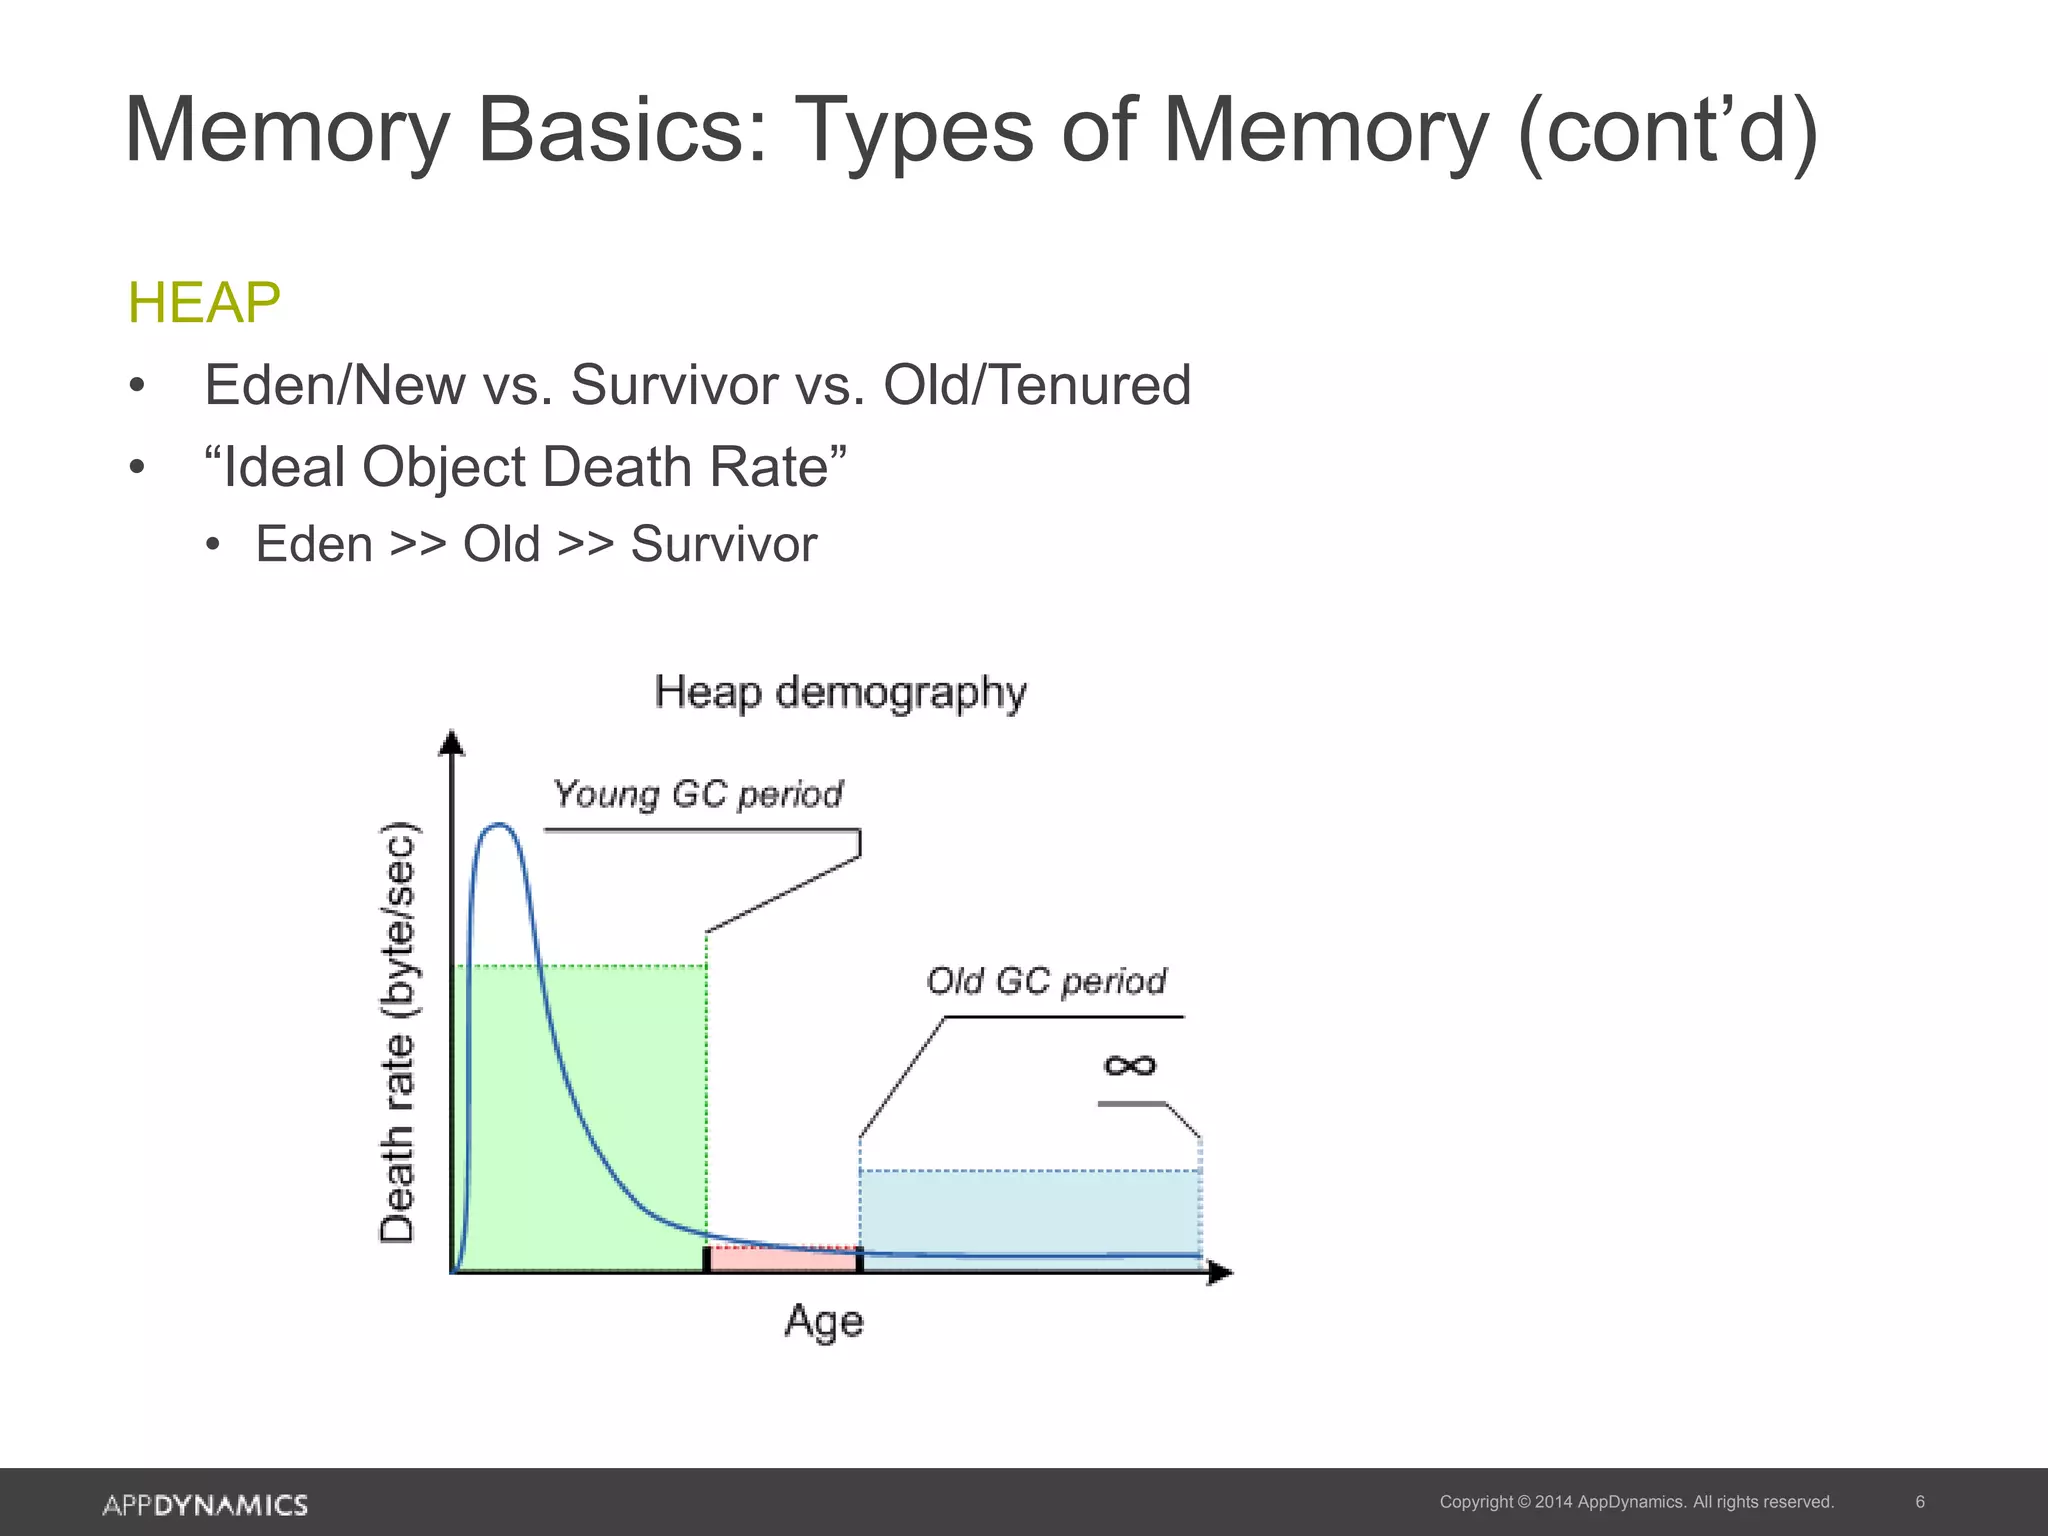
Overview of heap memory structure, including Eden, Survivor, and Old/Tenured generations.
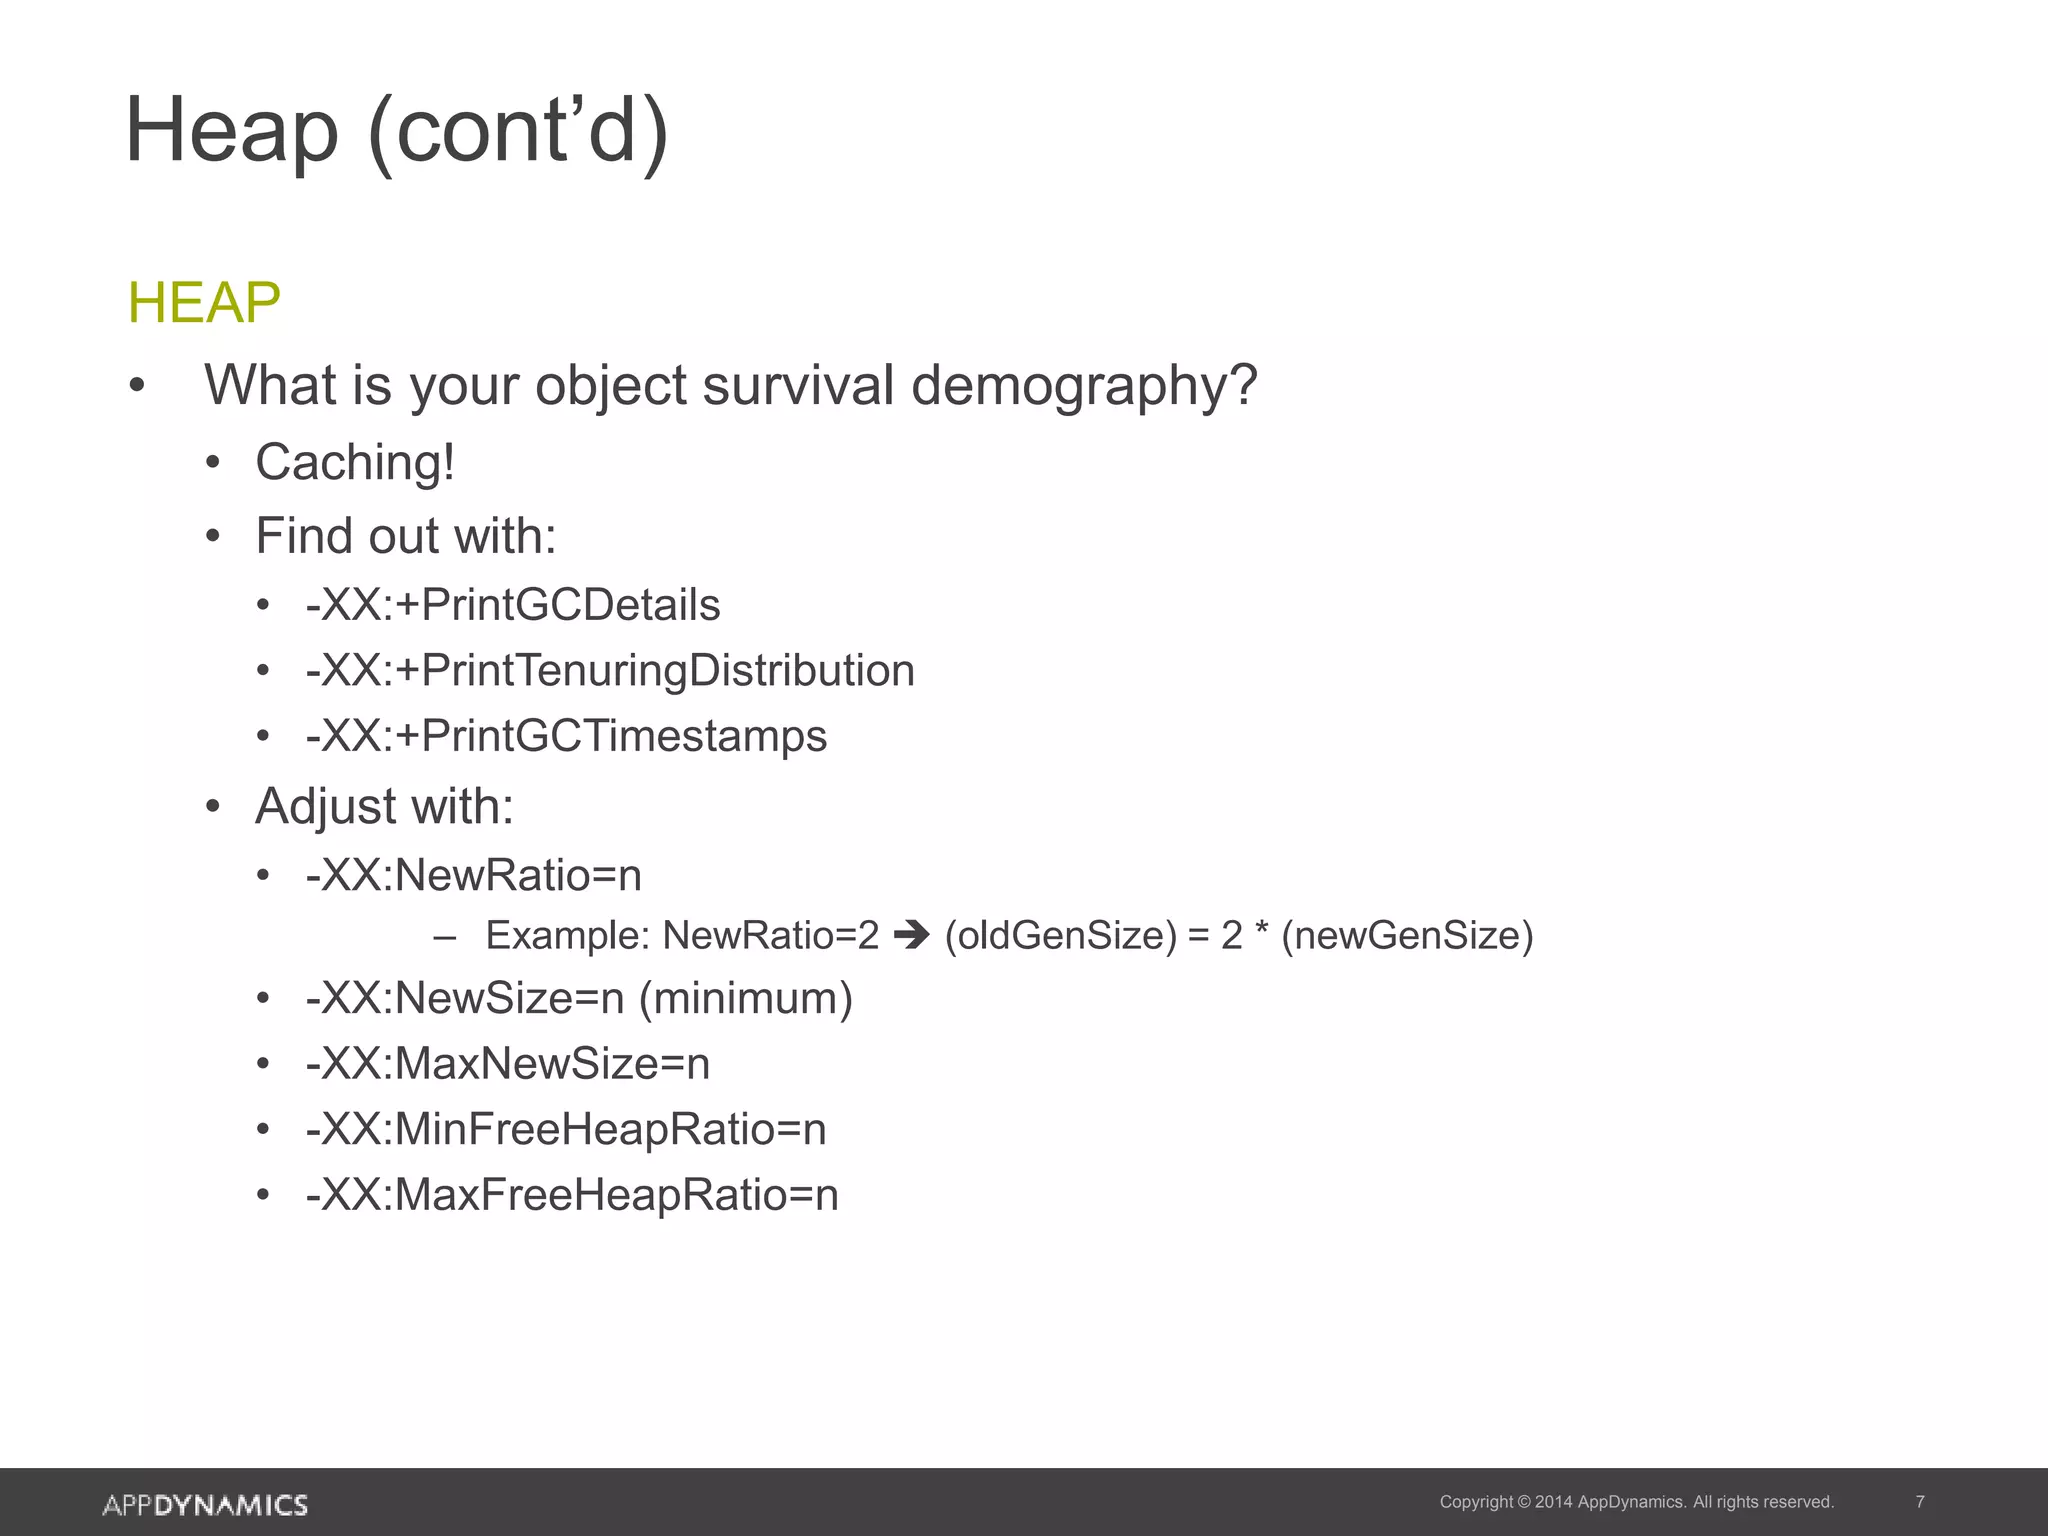
Analysis of object survival demographics in heap memory and tools to monitor and adjust heap settings.
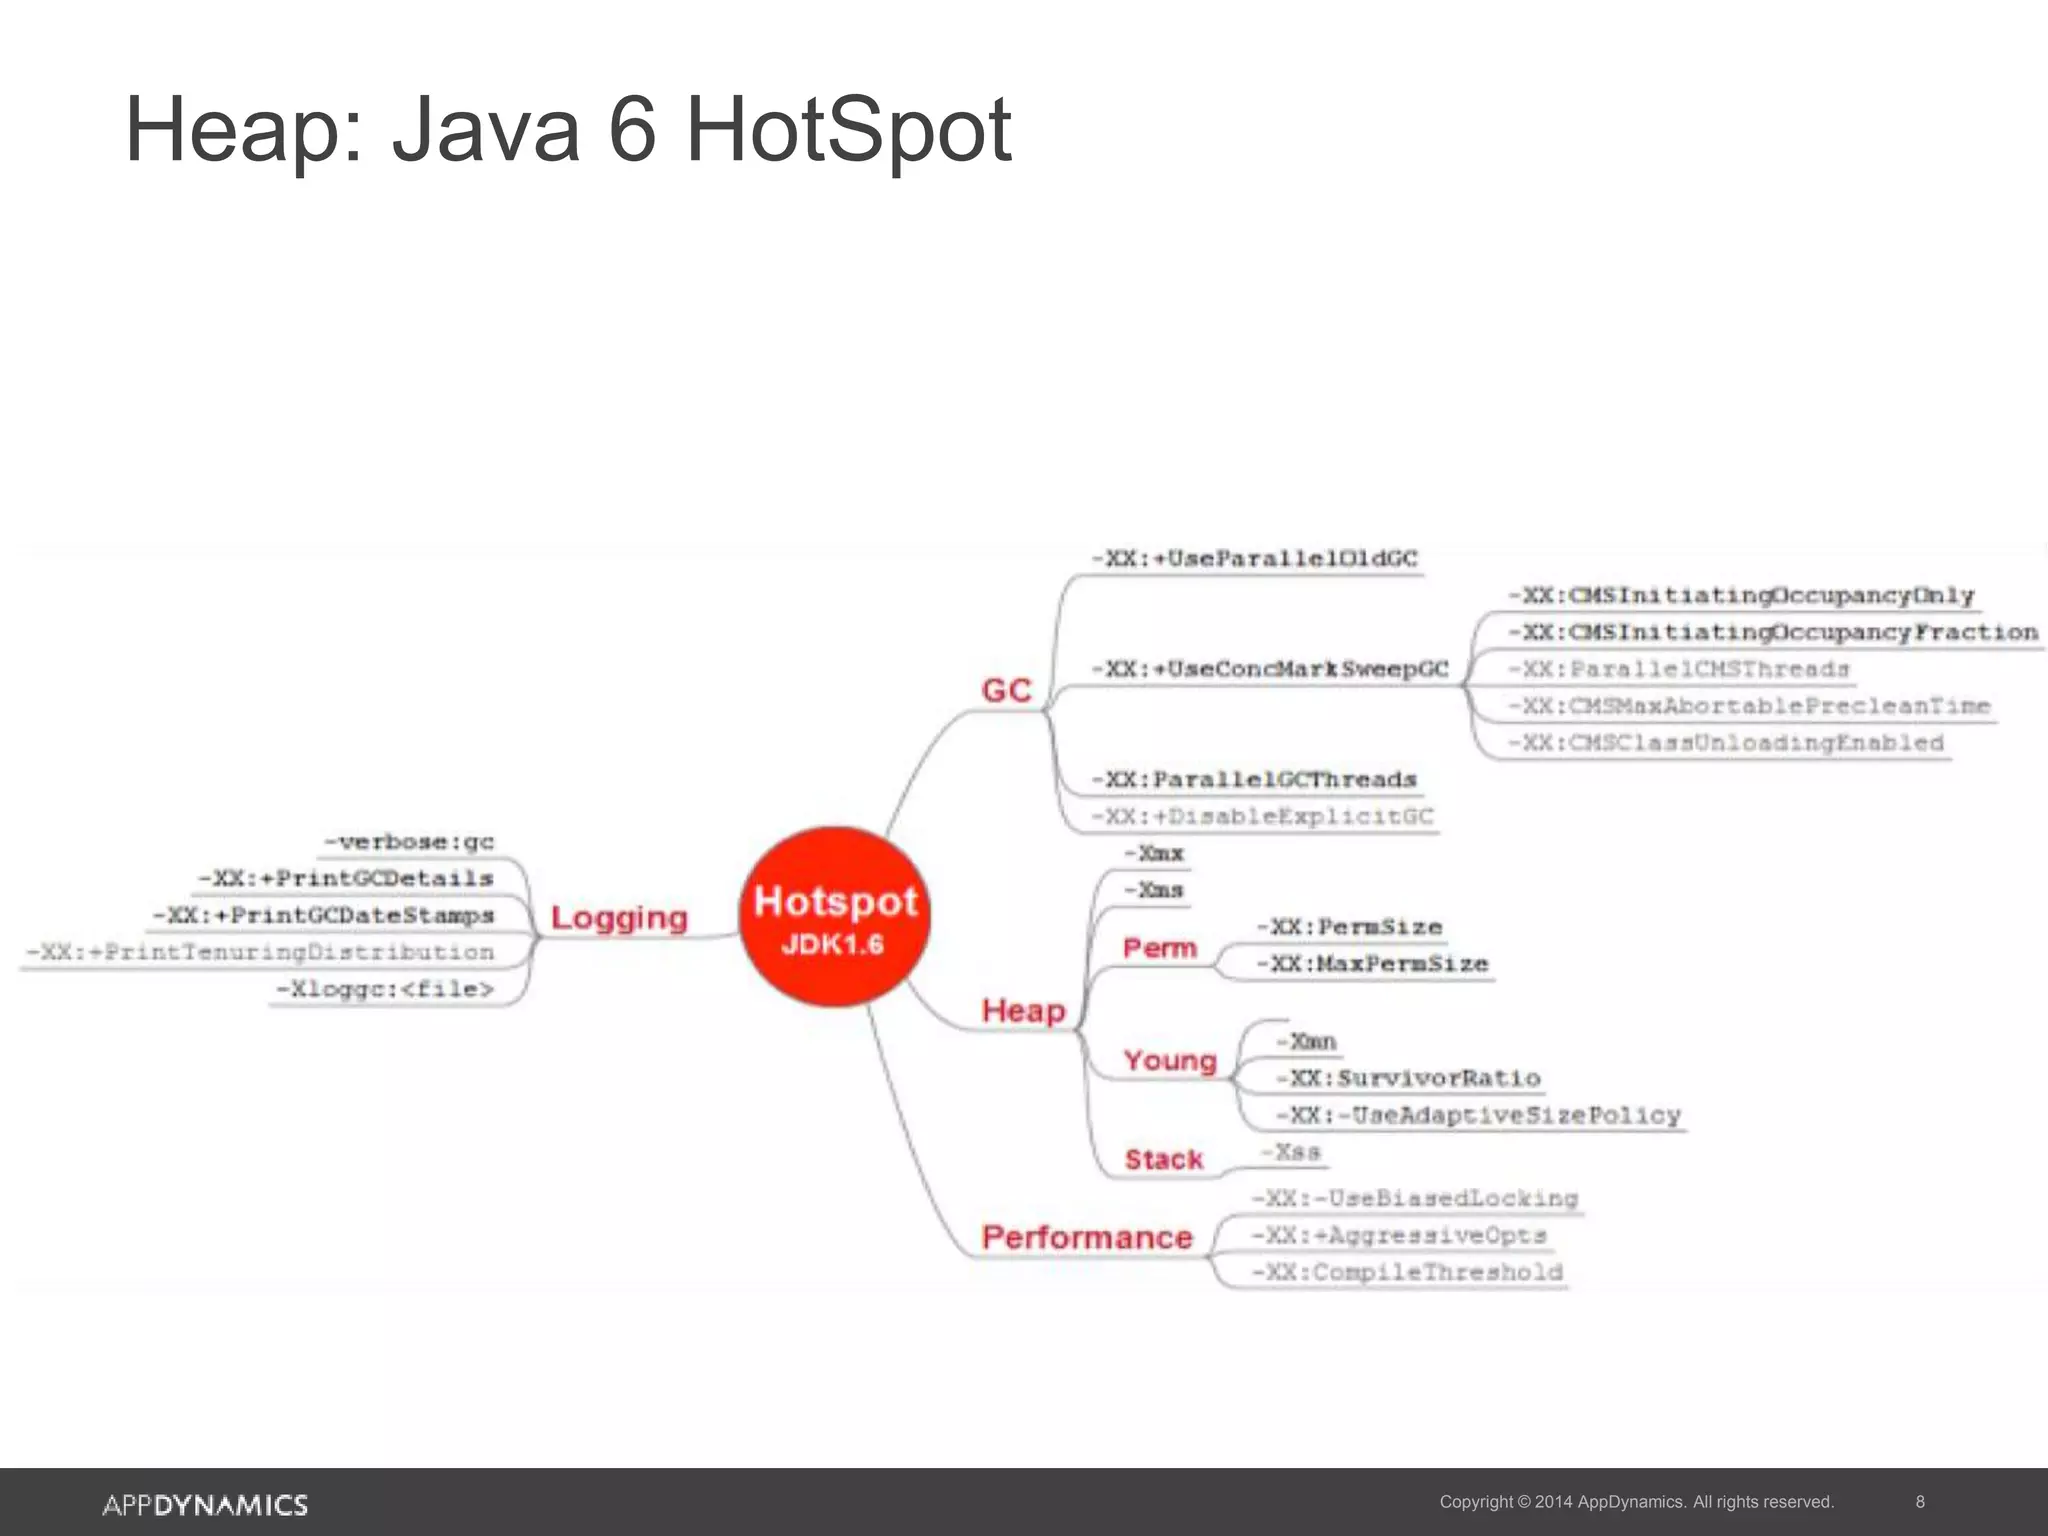
Visual representation of memory management in Java 6 HotSpot.
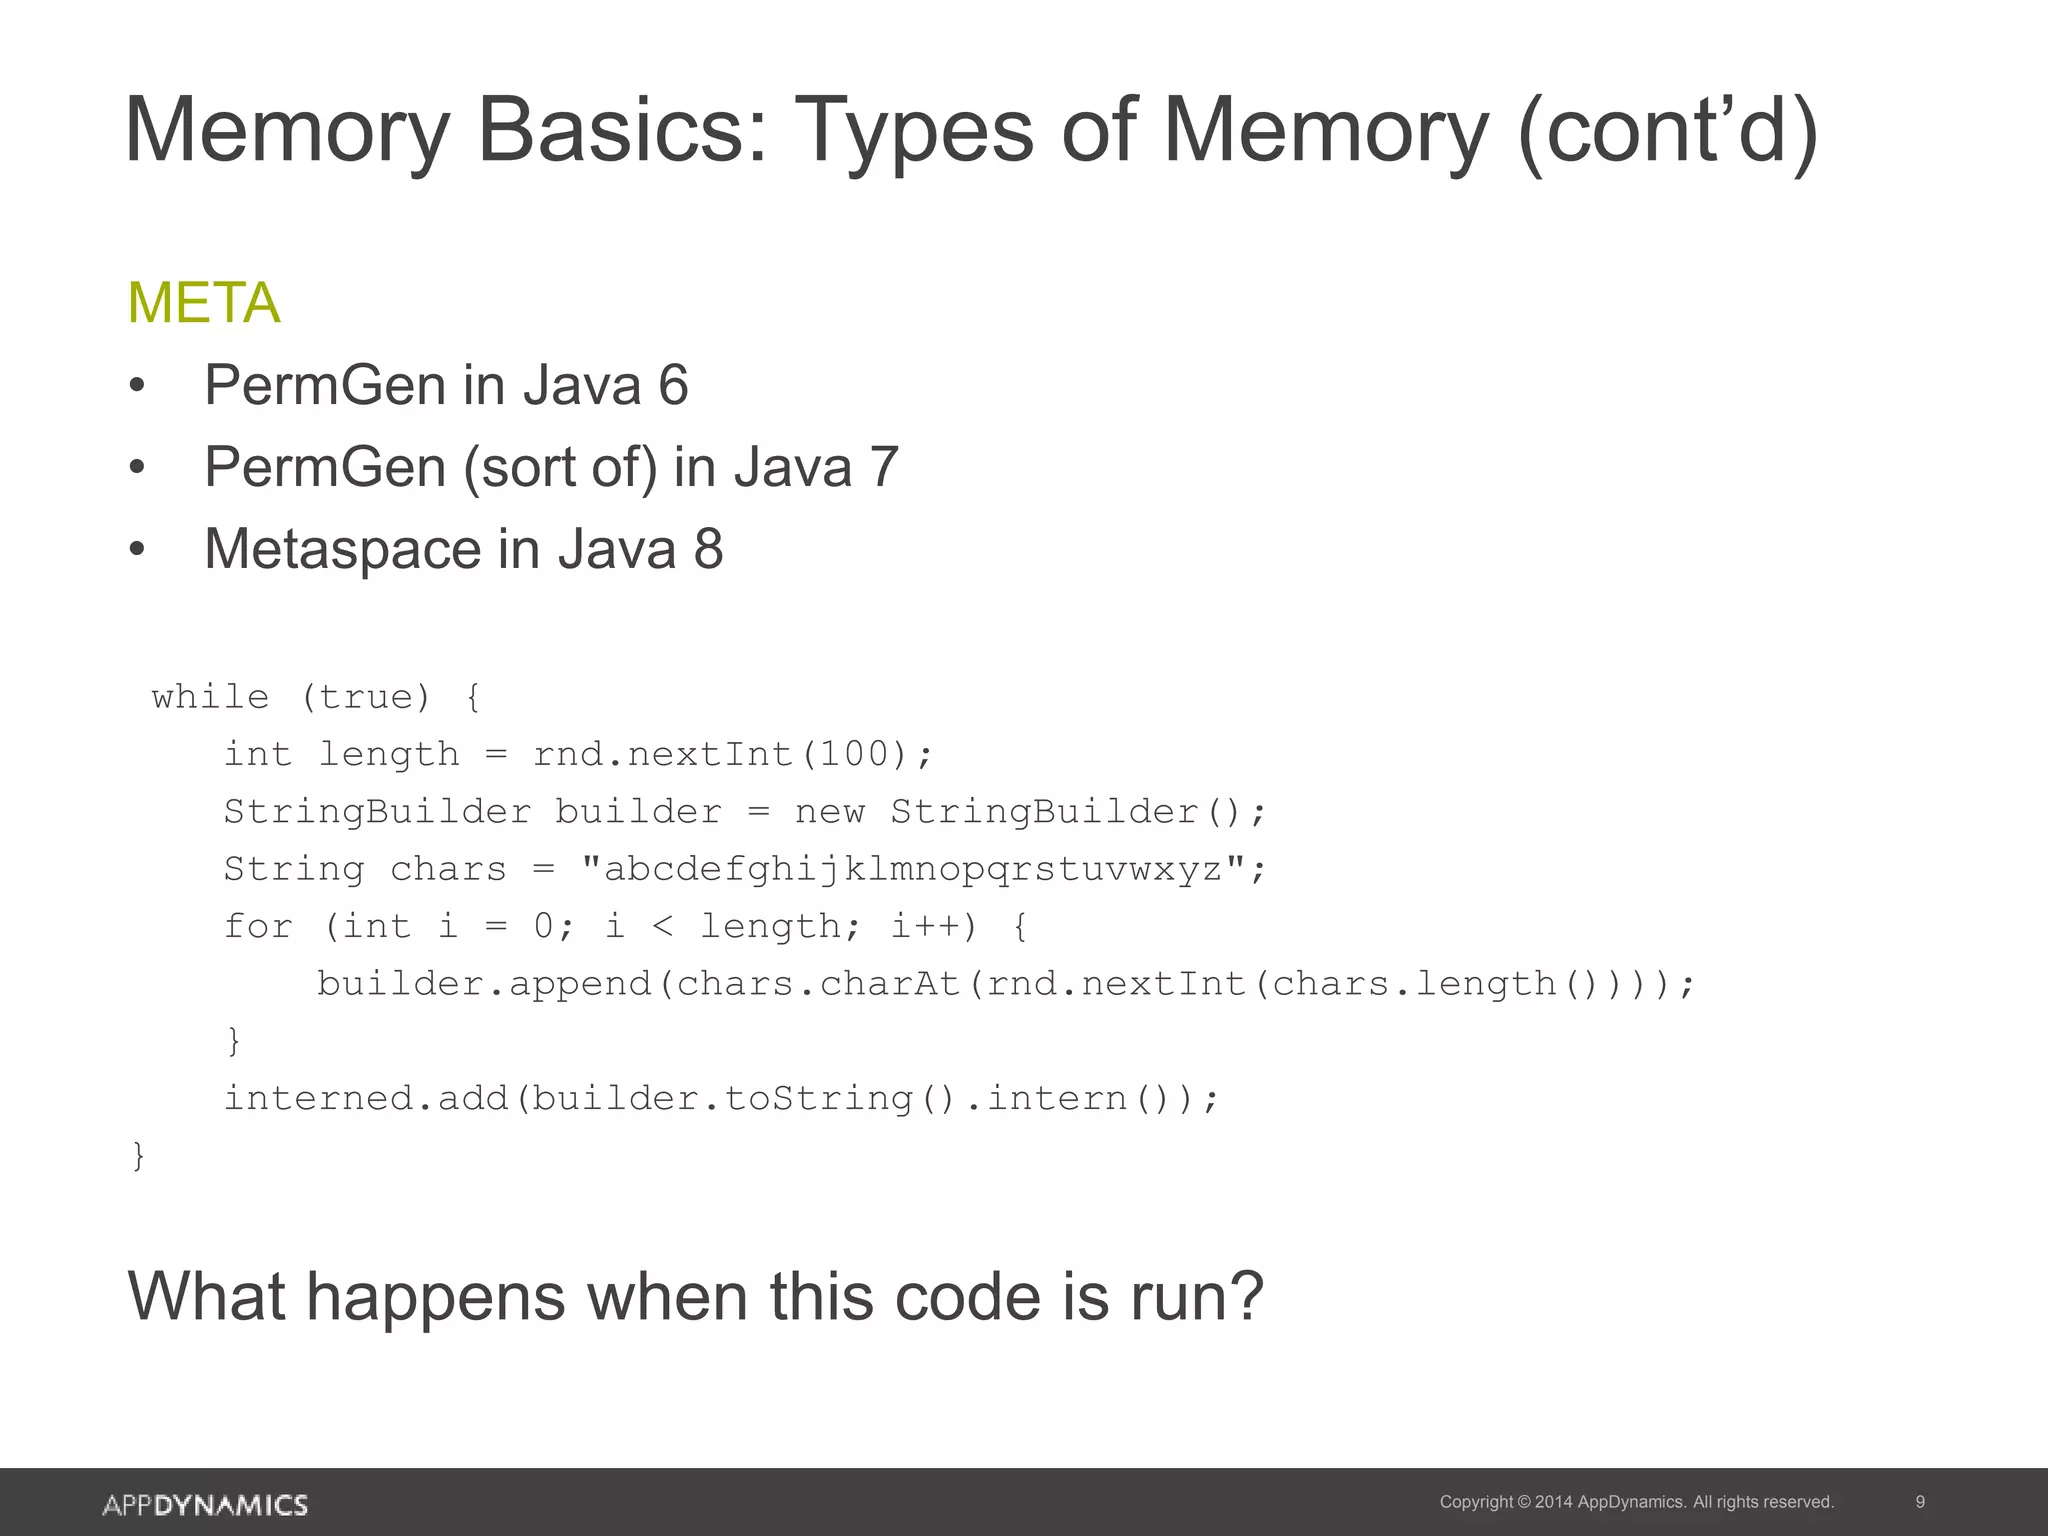
Explanation of PermGen and Metaspace across Java versions, illustrating changes in memory management.
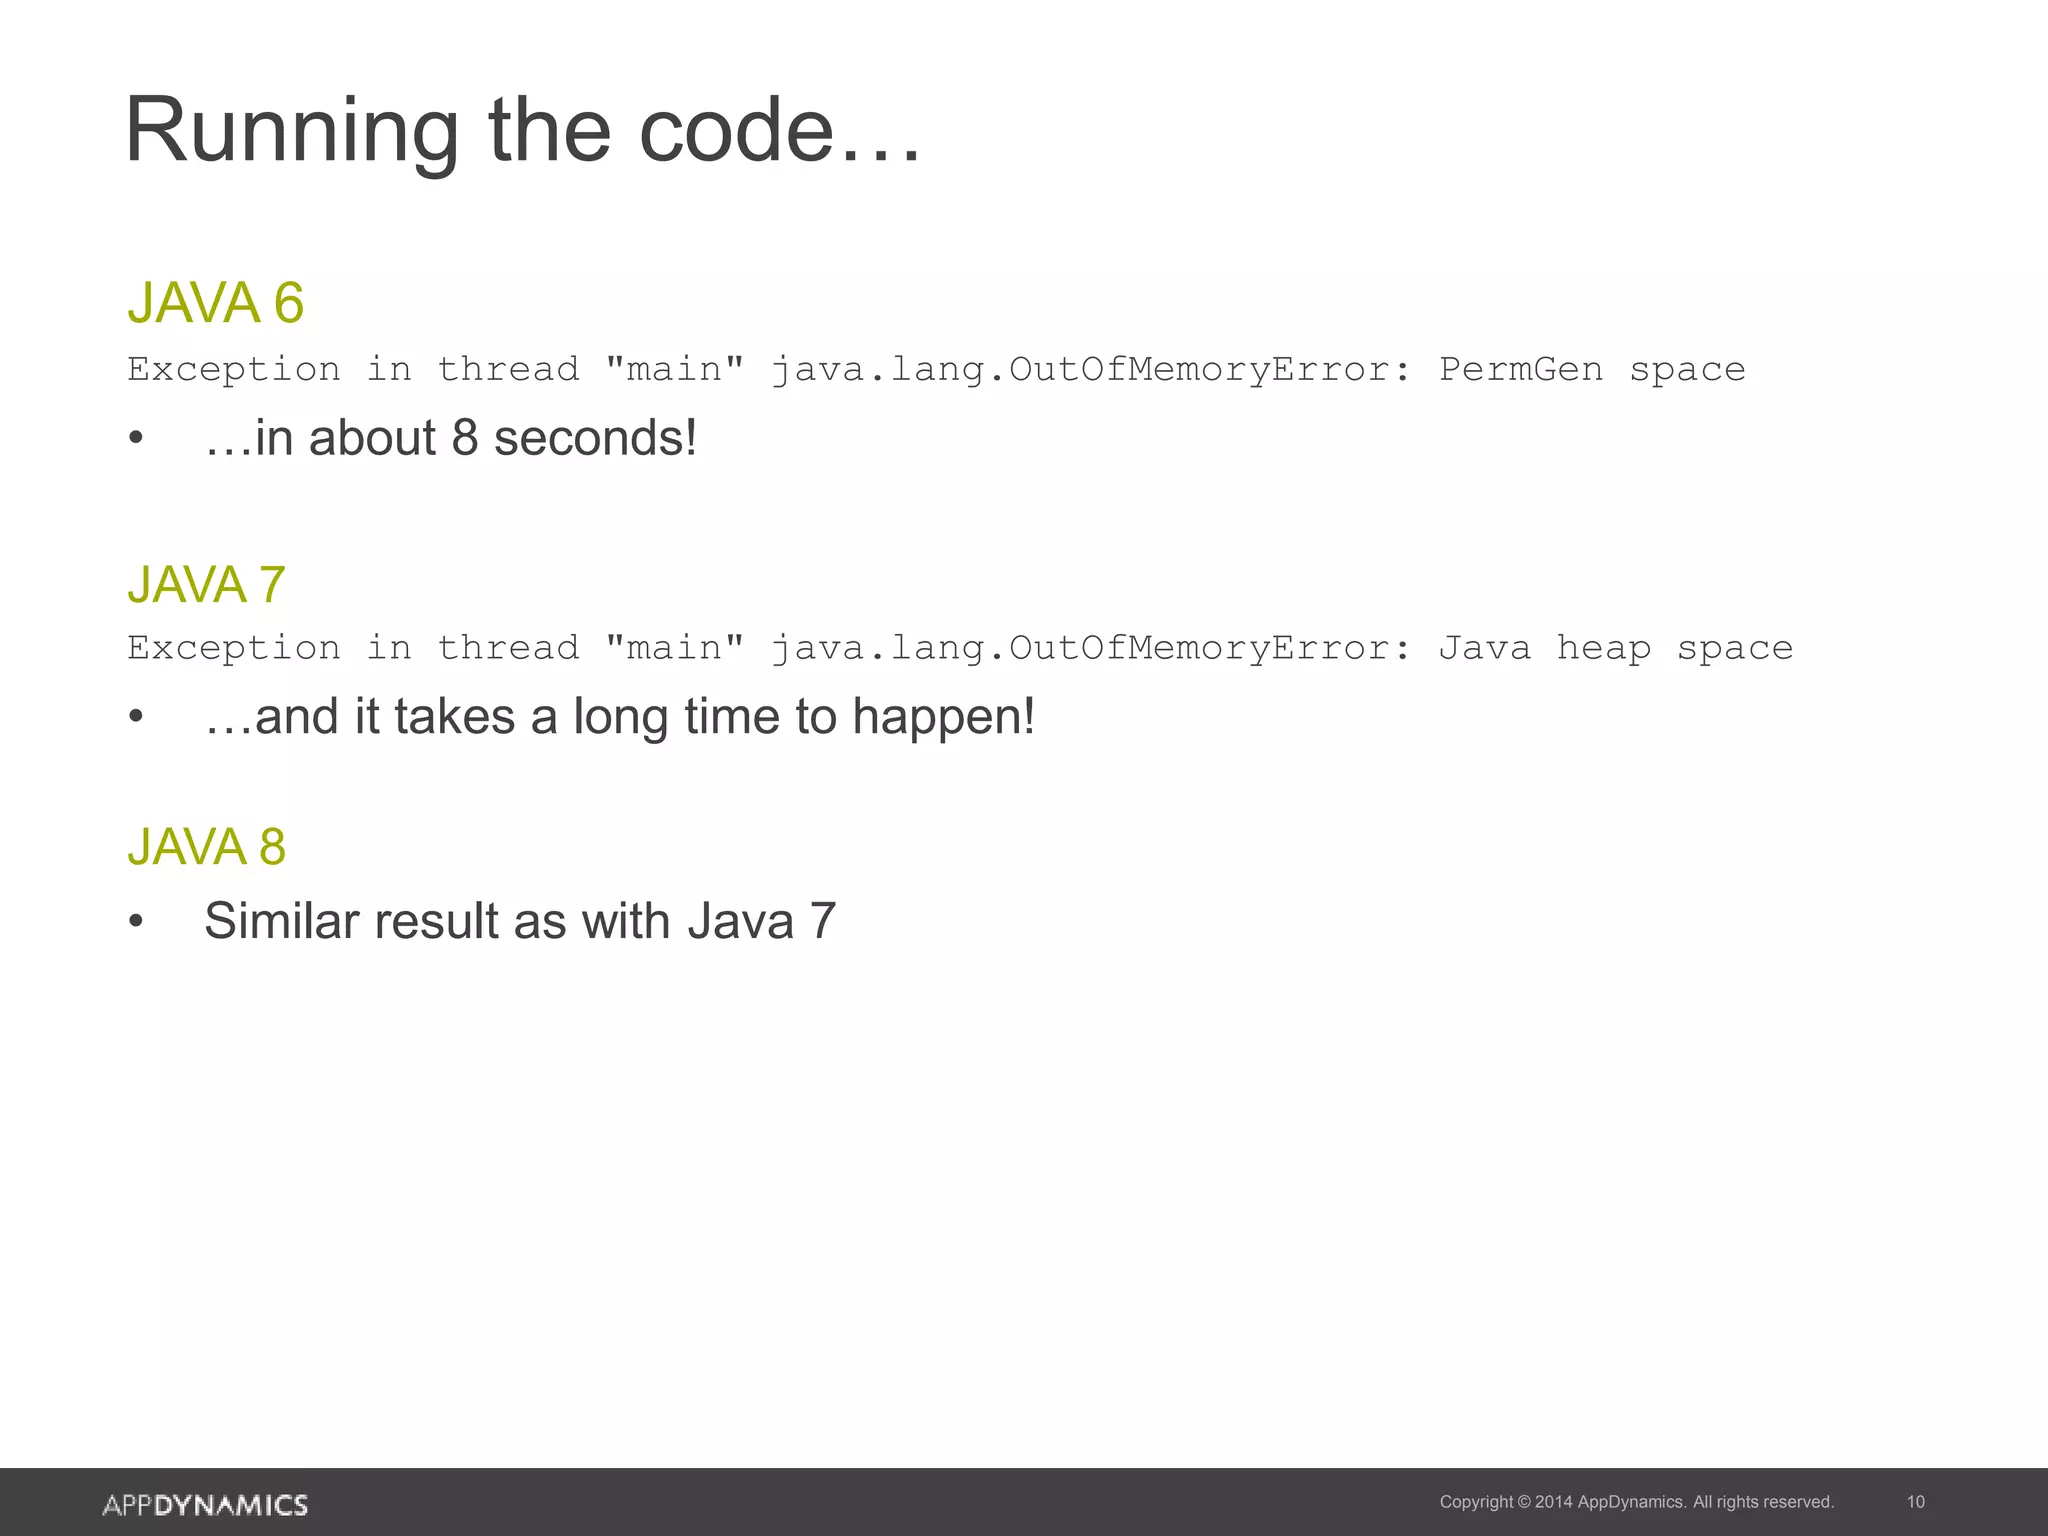
Illustration of various OutOfMemoryError scenarios encountered in Java 6, 7, and 8 related to memory allocation.
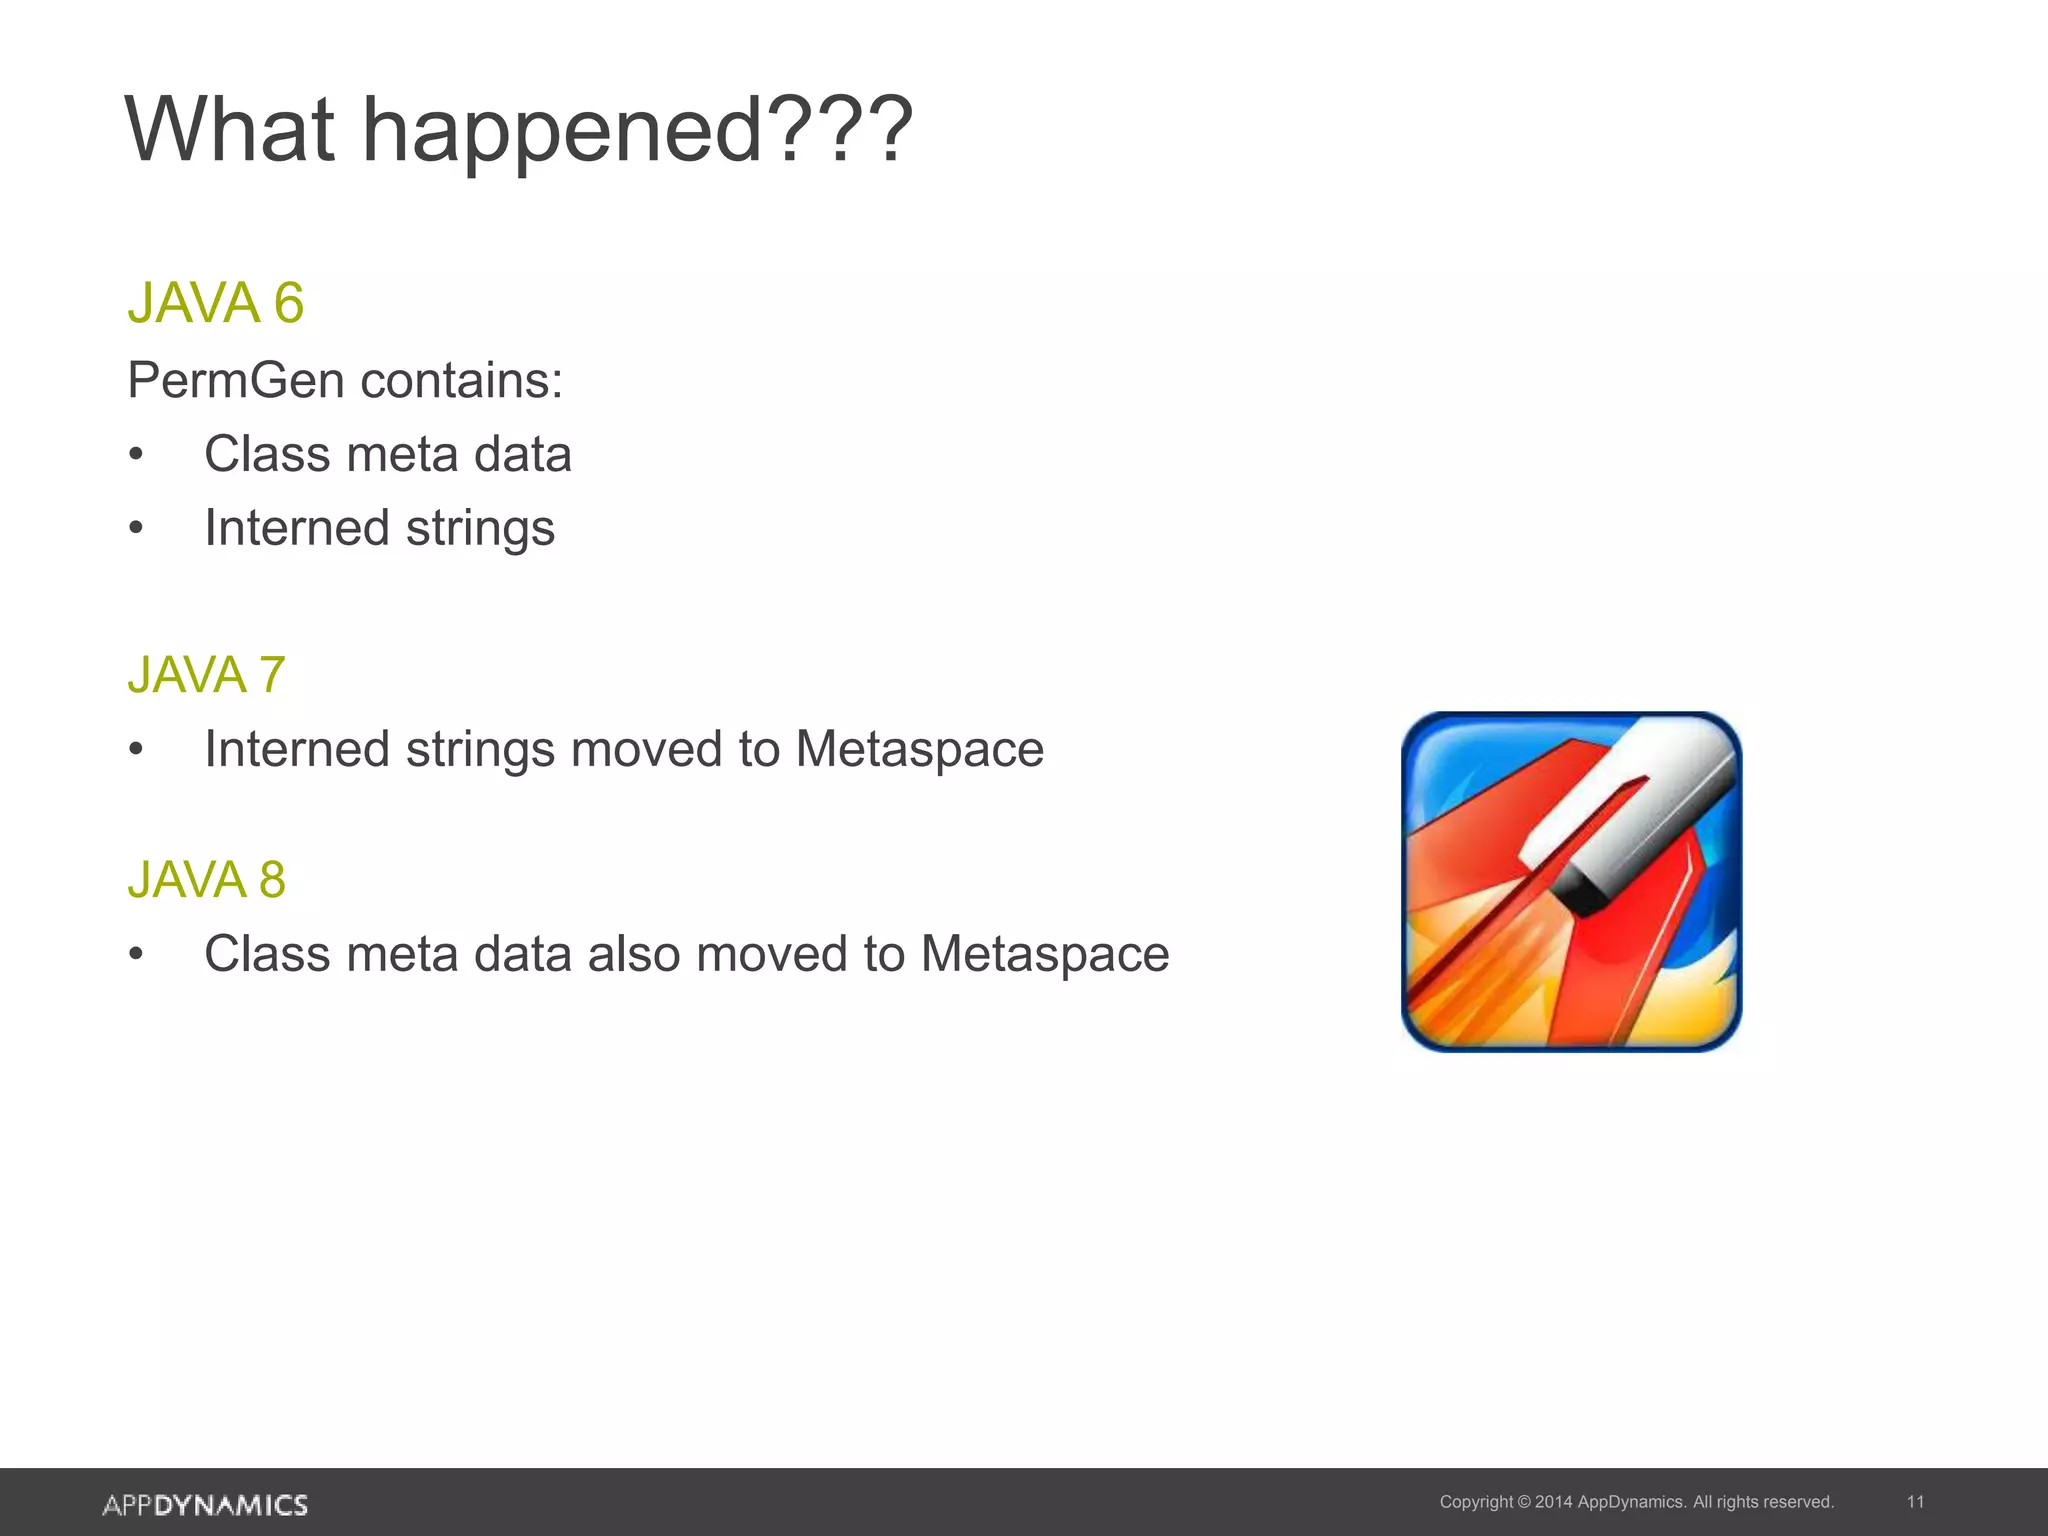
Details on how metadata handling was transitioned from PermGen to Metaspace in Java 7 and 8.
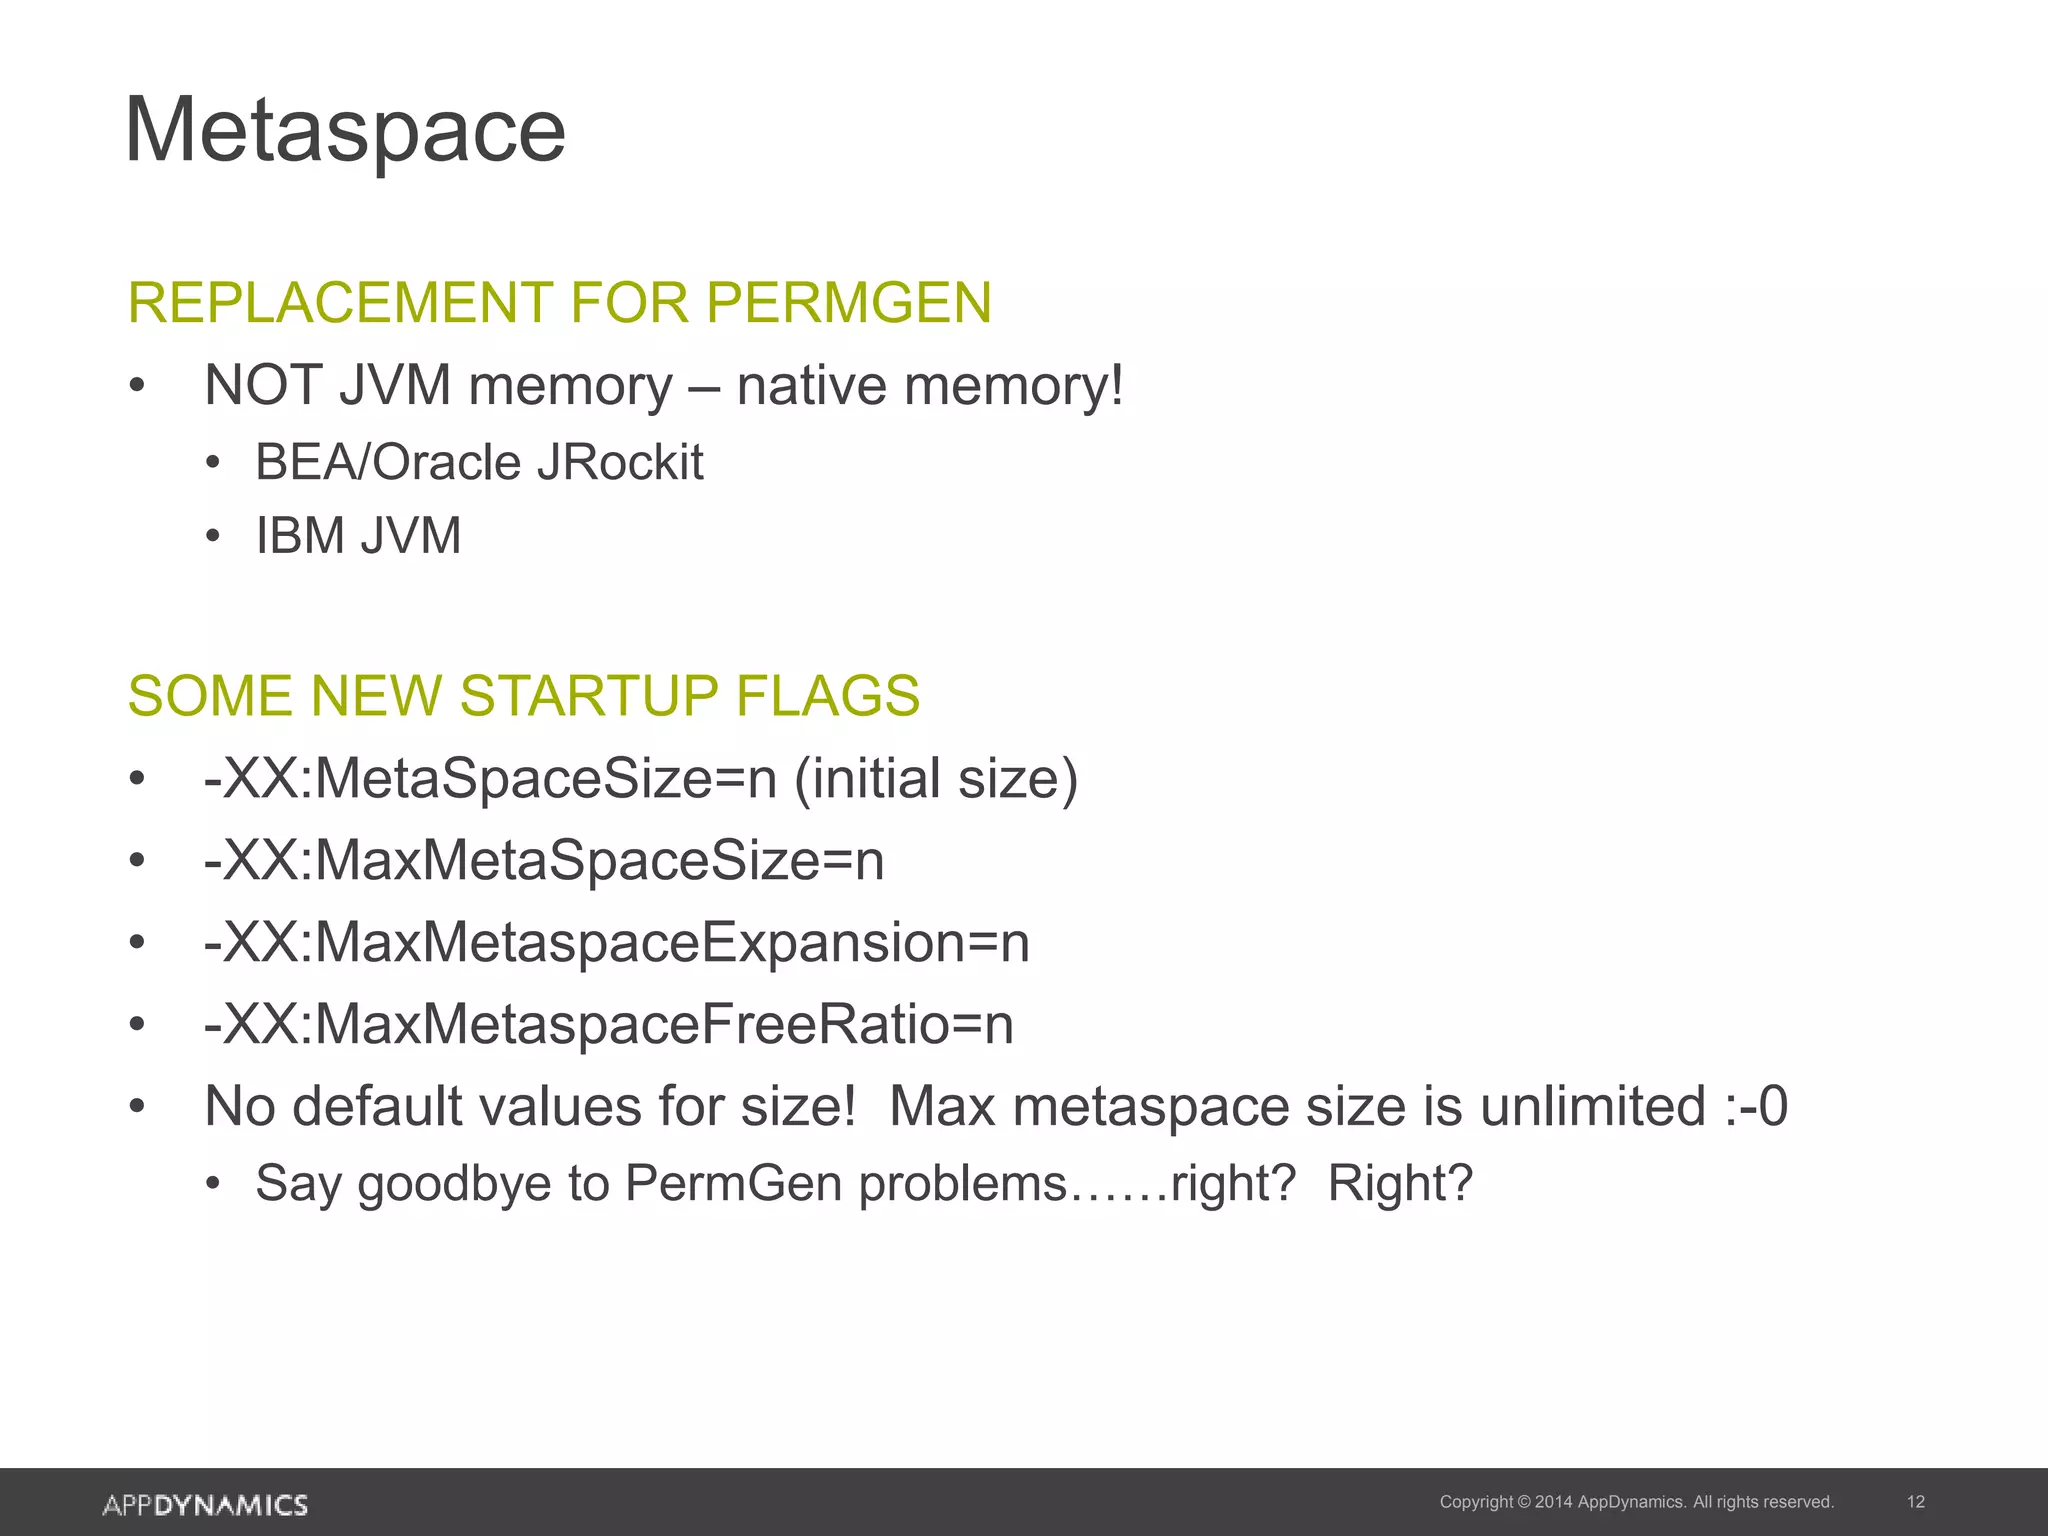
Replacement of PermGen with Metaspace in Java 8 and related startup flags and memory management considerations.
Introduction of new memory pool objects in Java 8, making old PermGen flags obsolete.
Consequences of Metaspace errors and need for monitoring to prevent memory leaks affecting the entire system.
Available tools and support for monitoring Metaspace in Java 8, including JMX and JVisualVM.
Brief mention of direct memory usage in Java via sun.misc.Unsafe, indicating its exclusion from in-depth discussion.
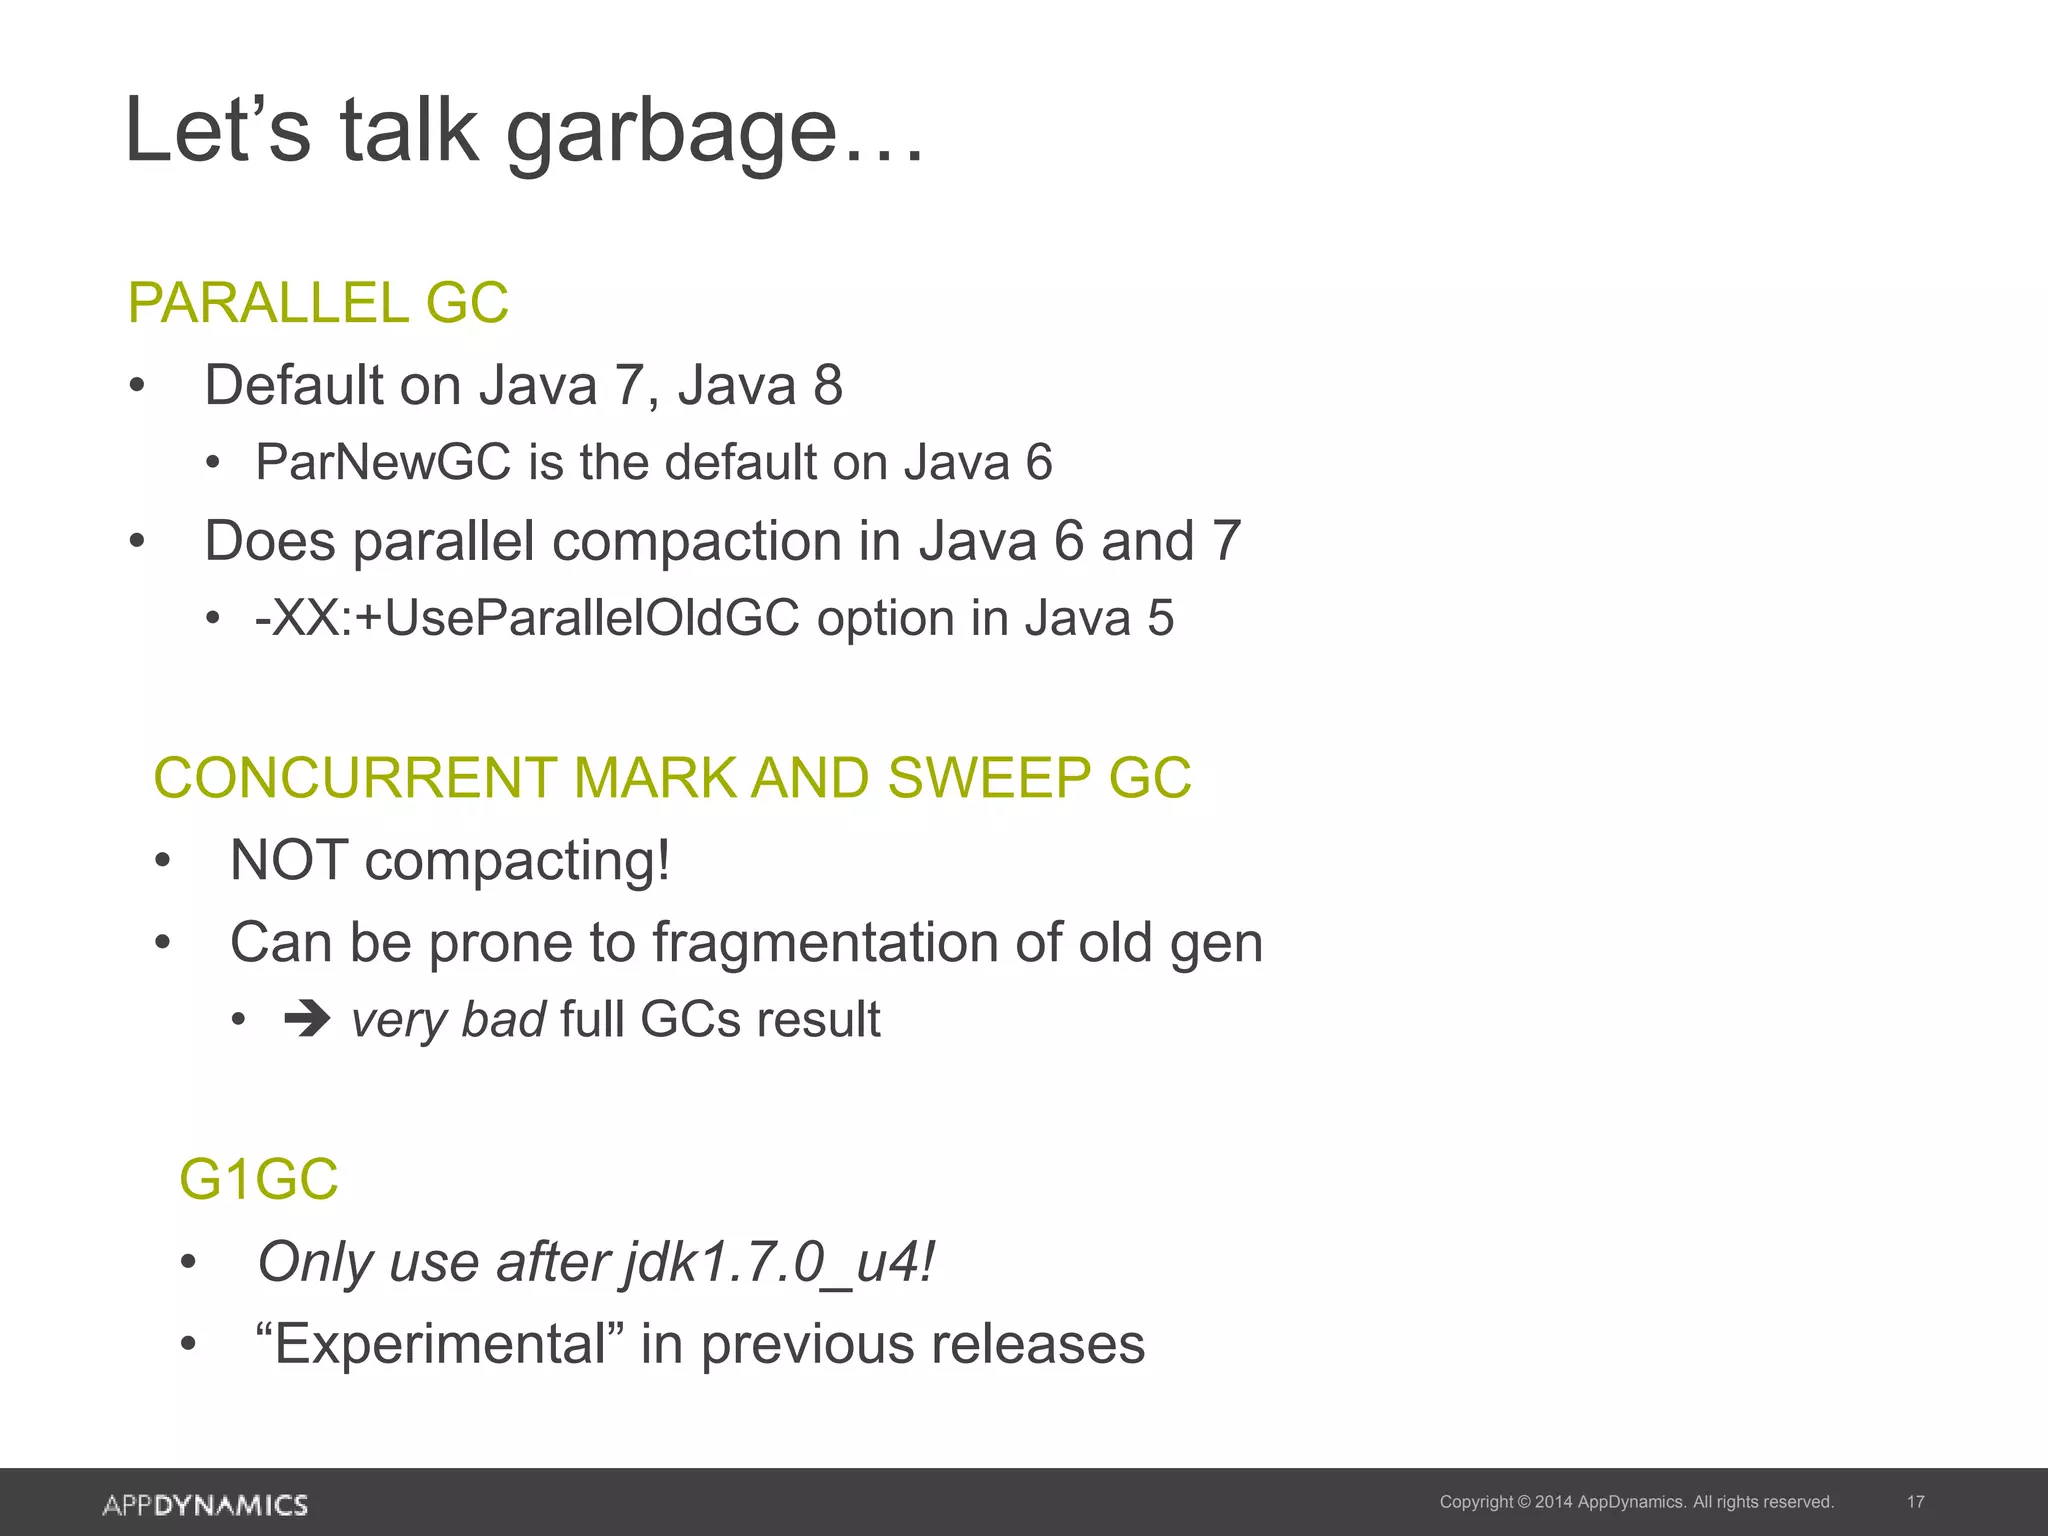
Overview of garbage collection strategies, highlighting default settings for Java 7 and 8, including Parallel GC.
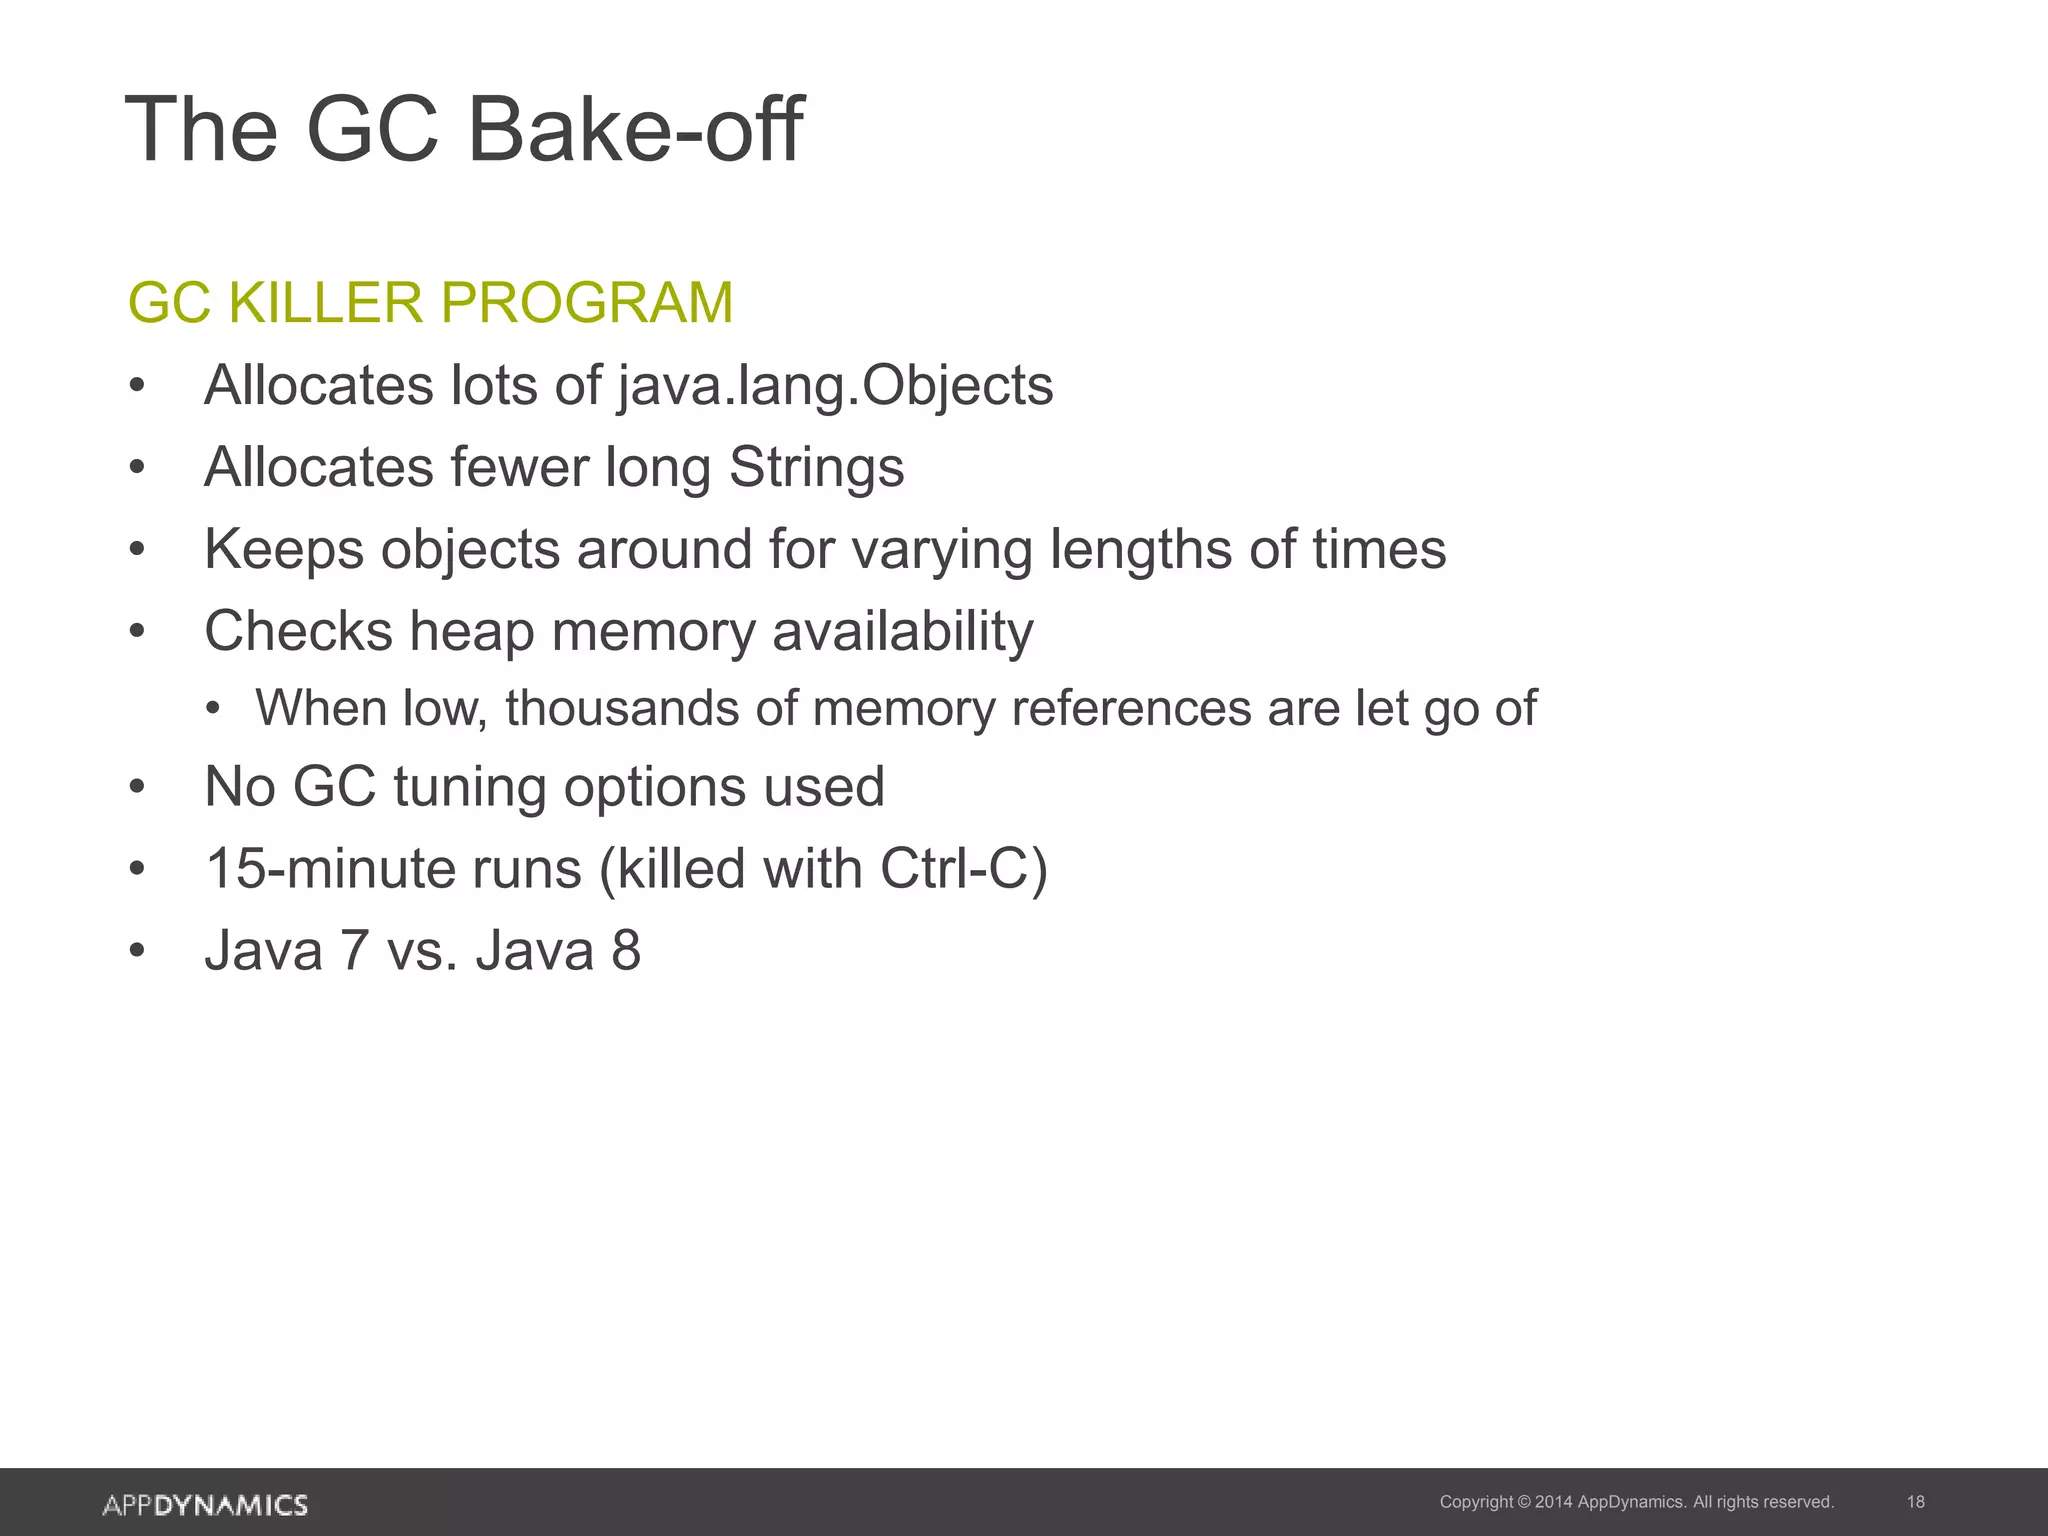
Description of a GC performance testing program that compares different GC strategies on Java's performance.
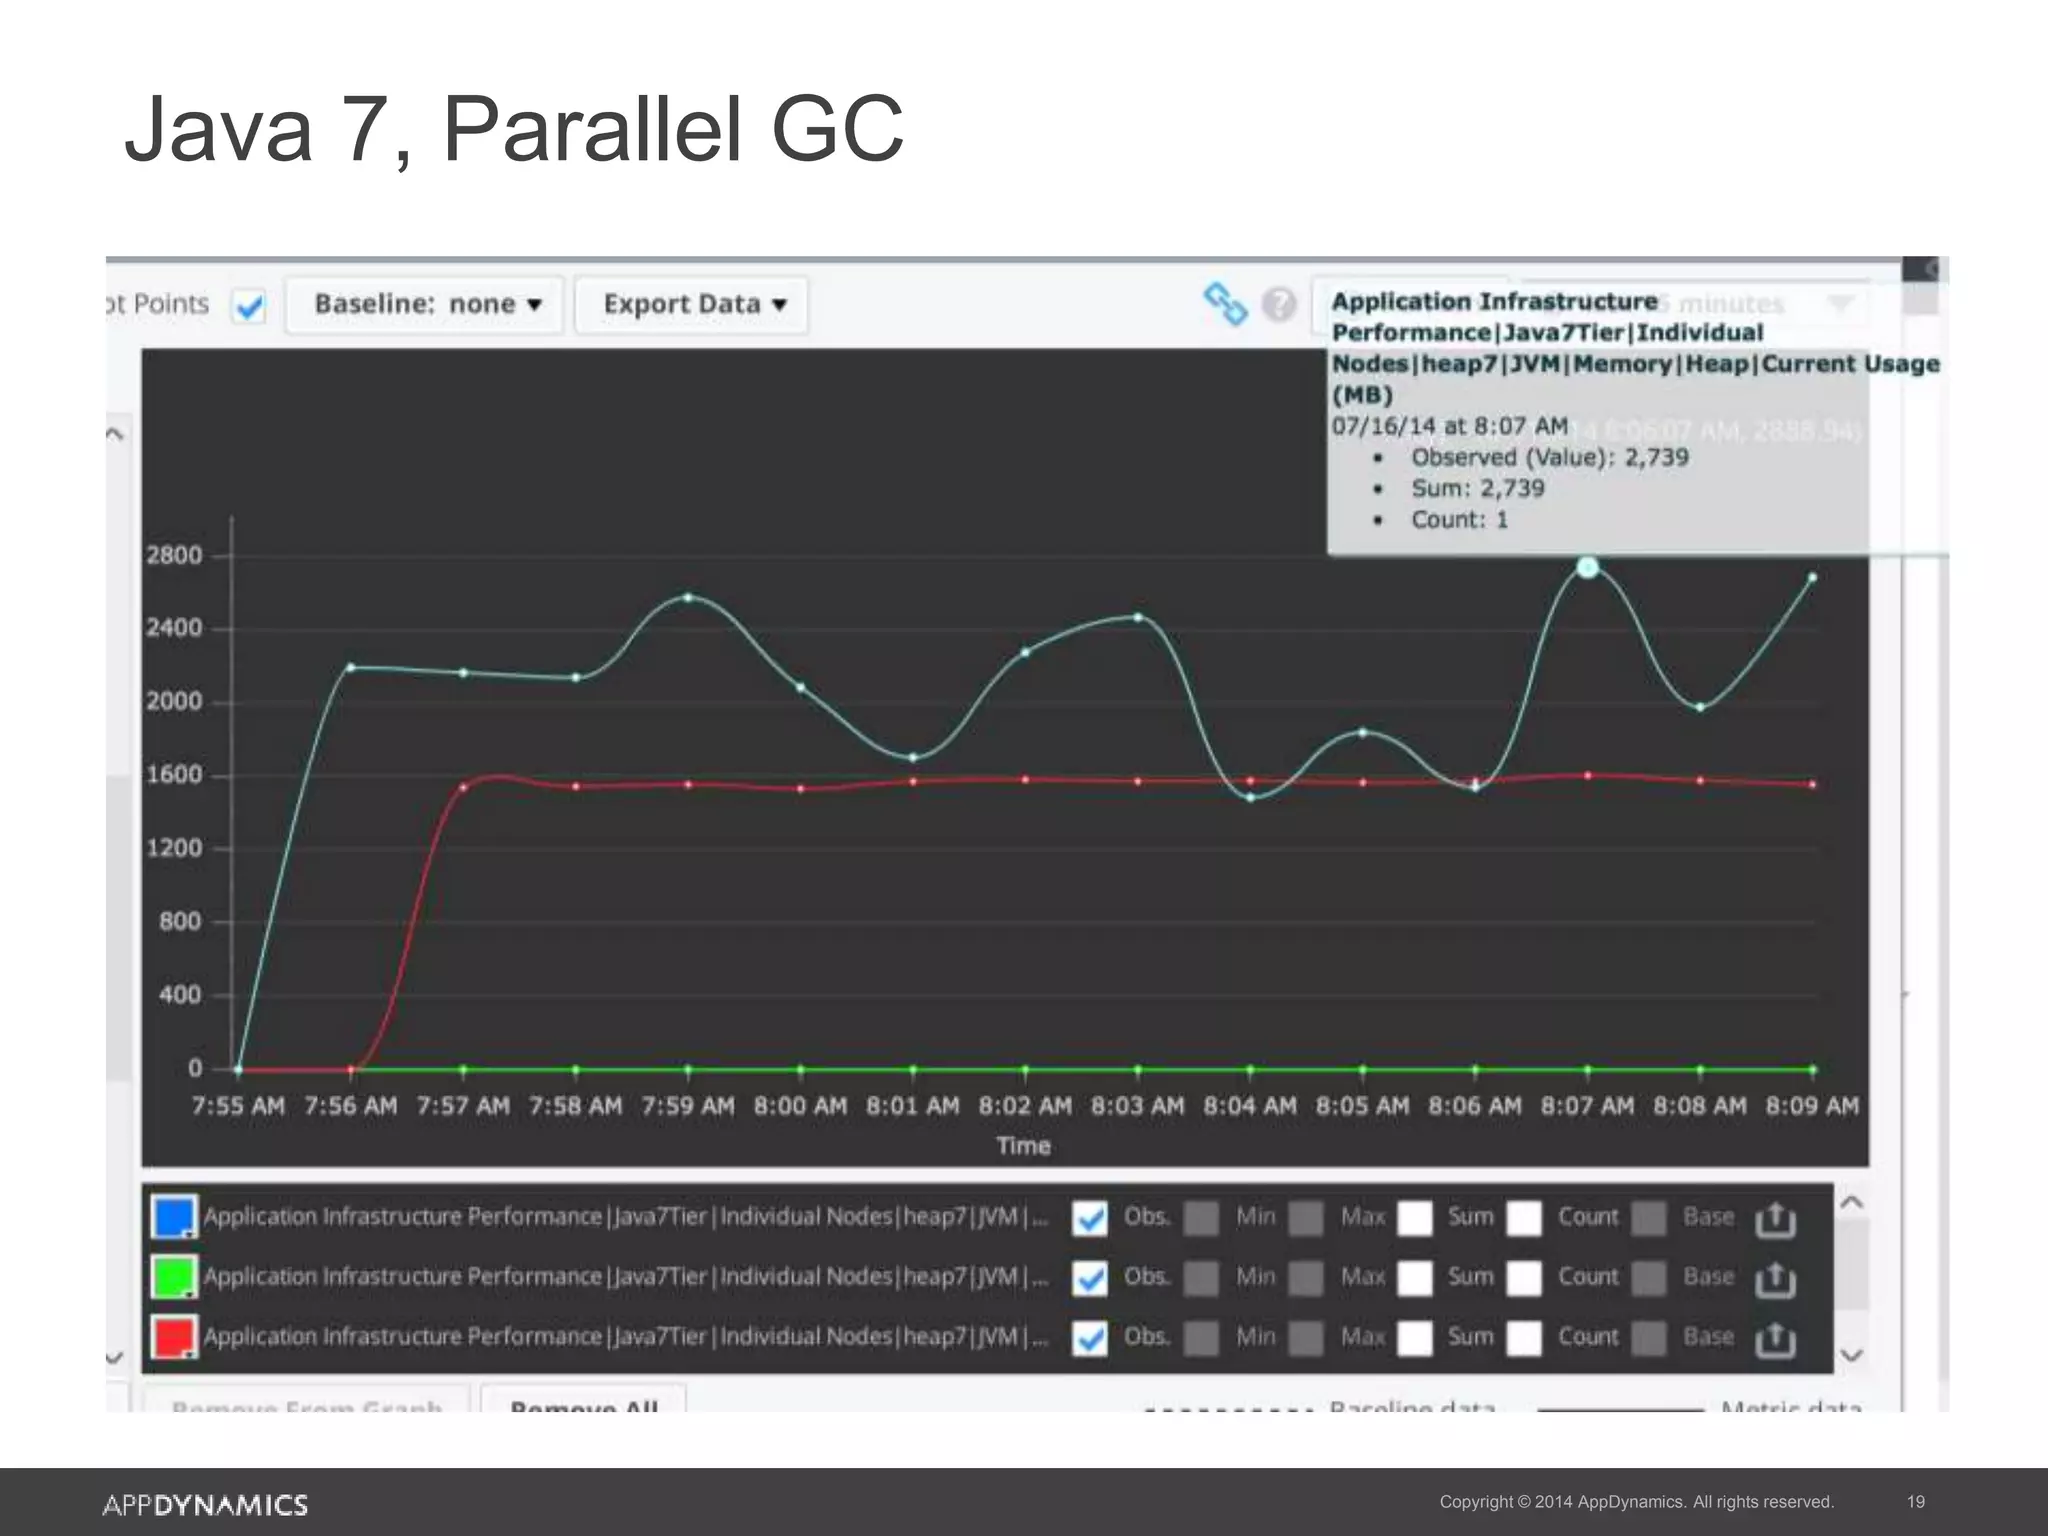
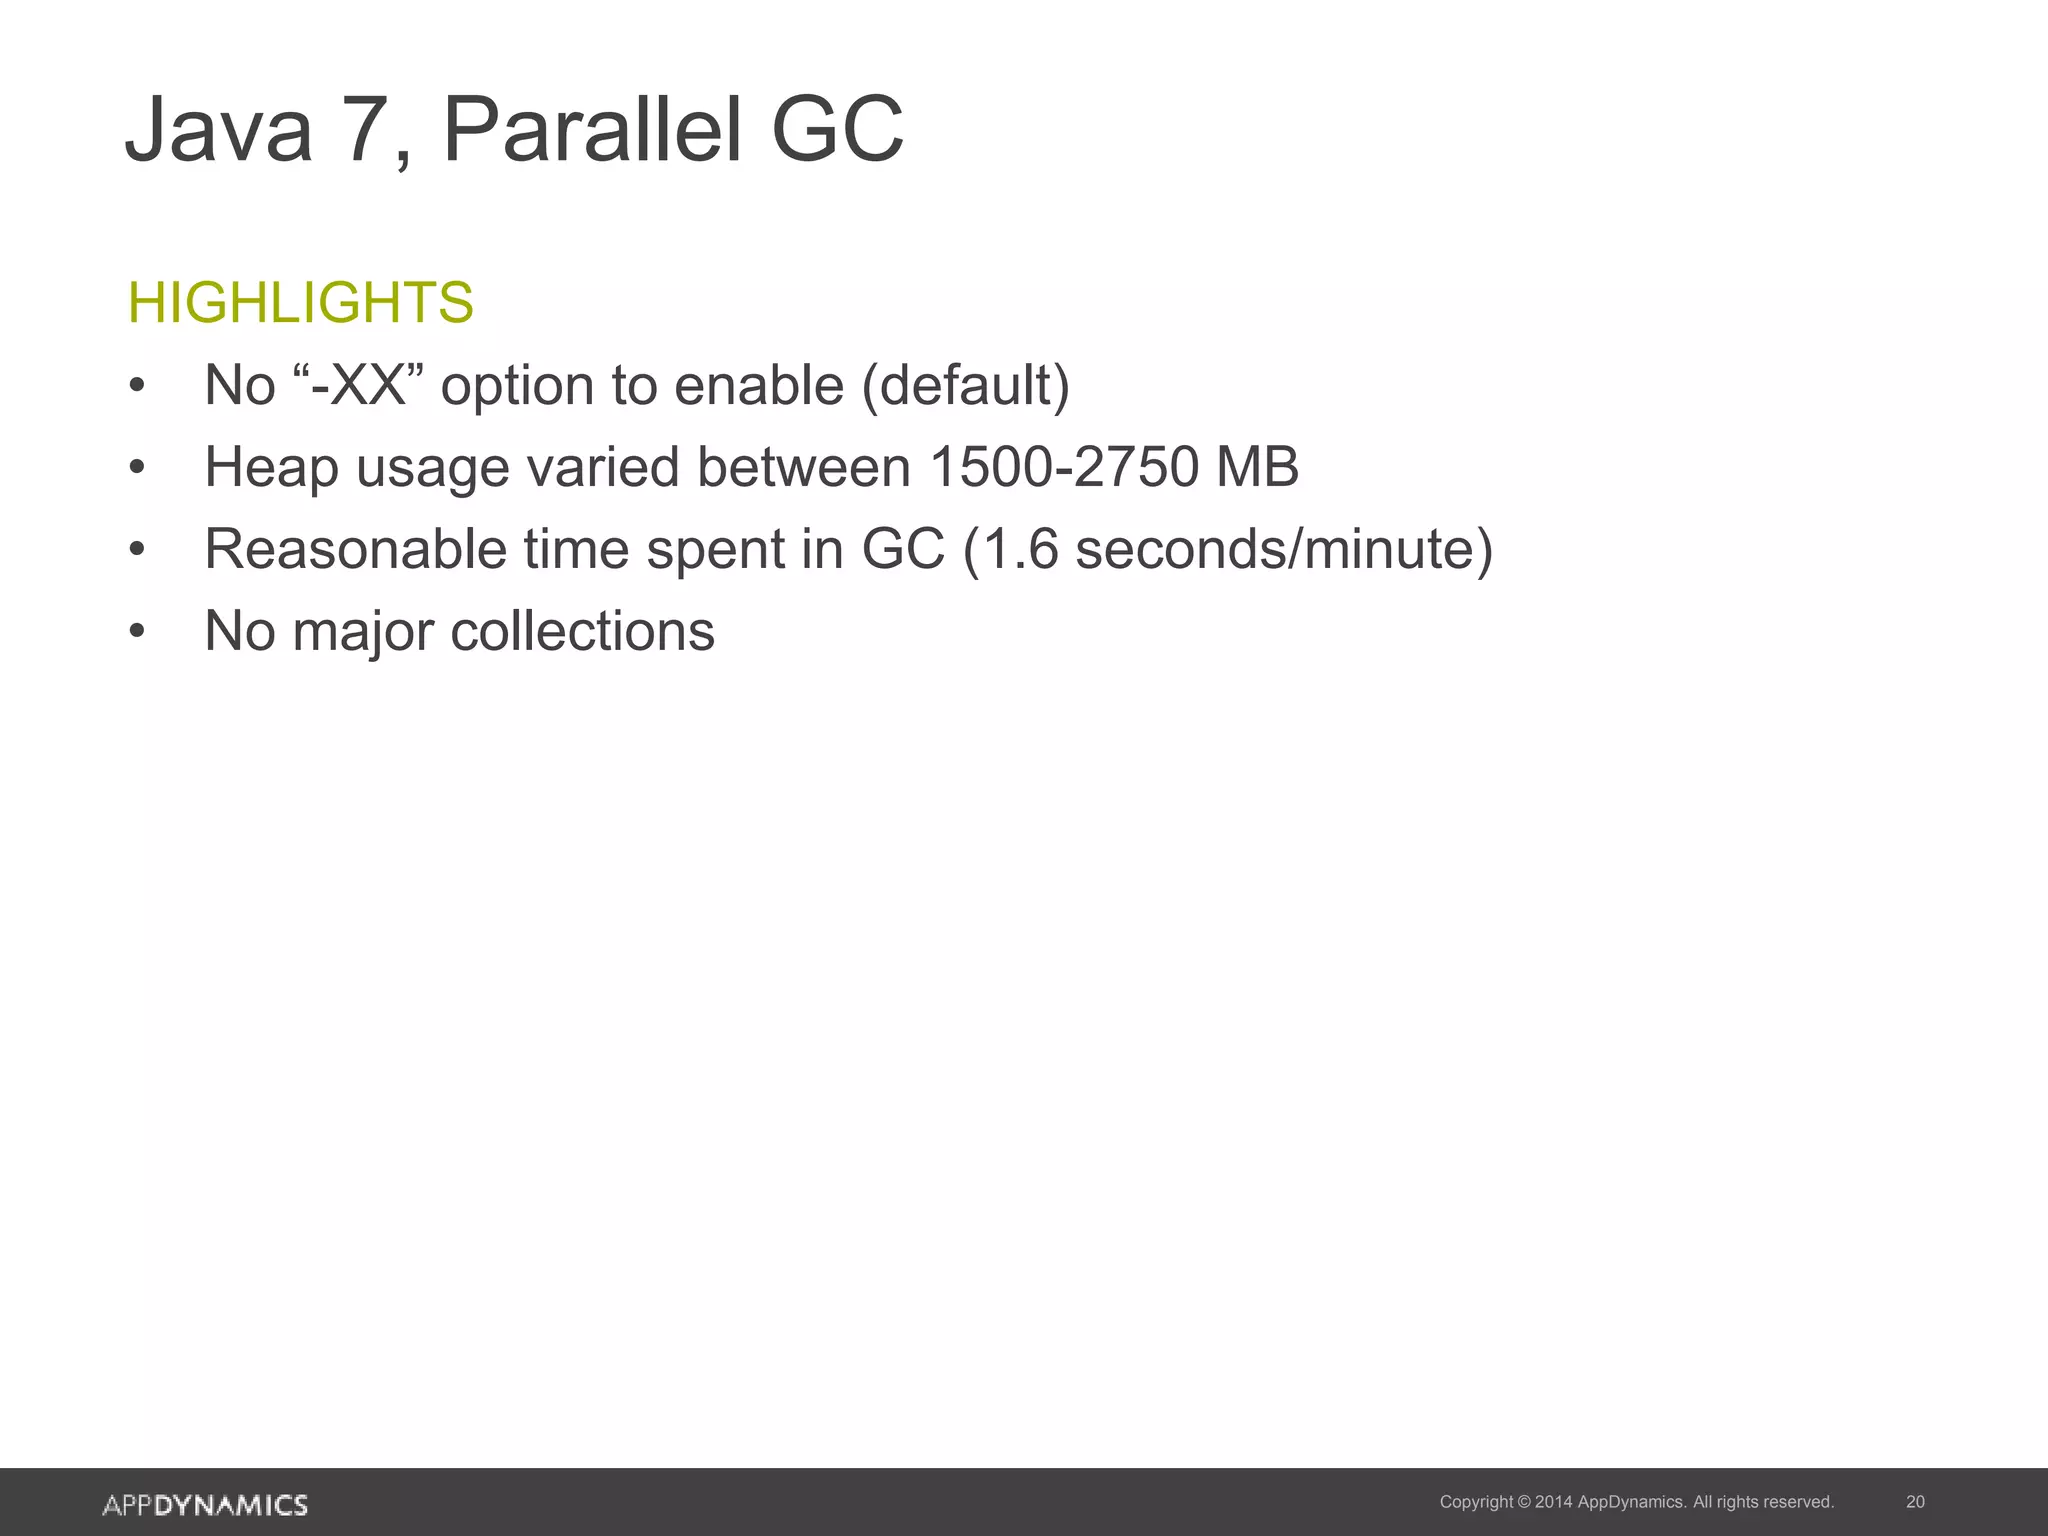
Performance results from Java 7's Parallel GC in terms of heap usage and garbage collection times.
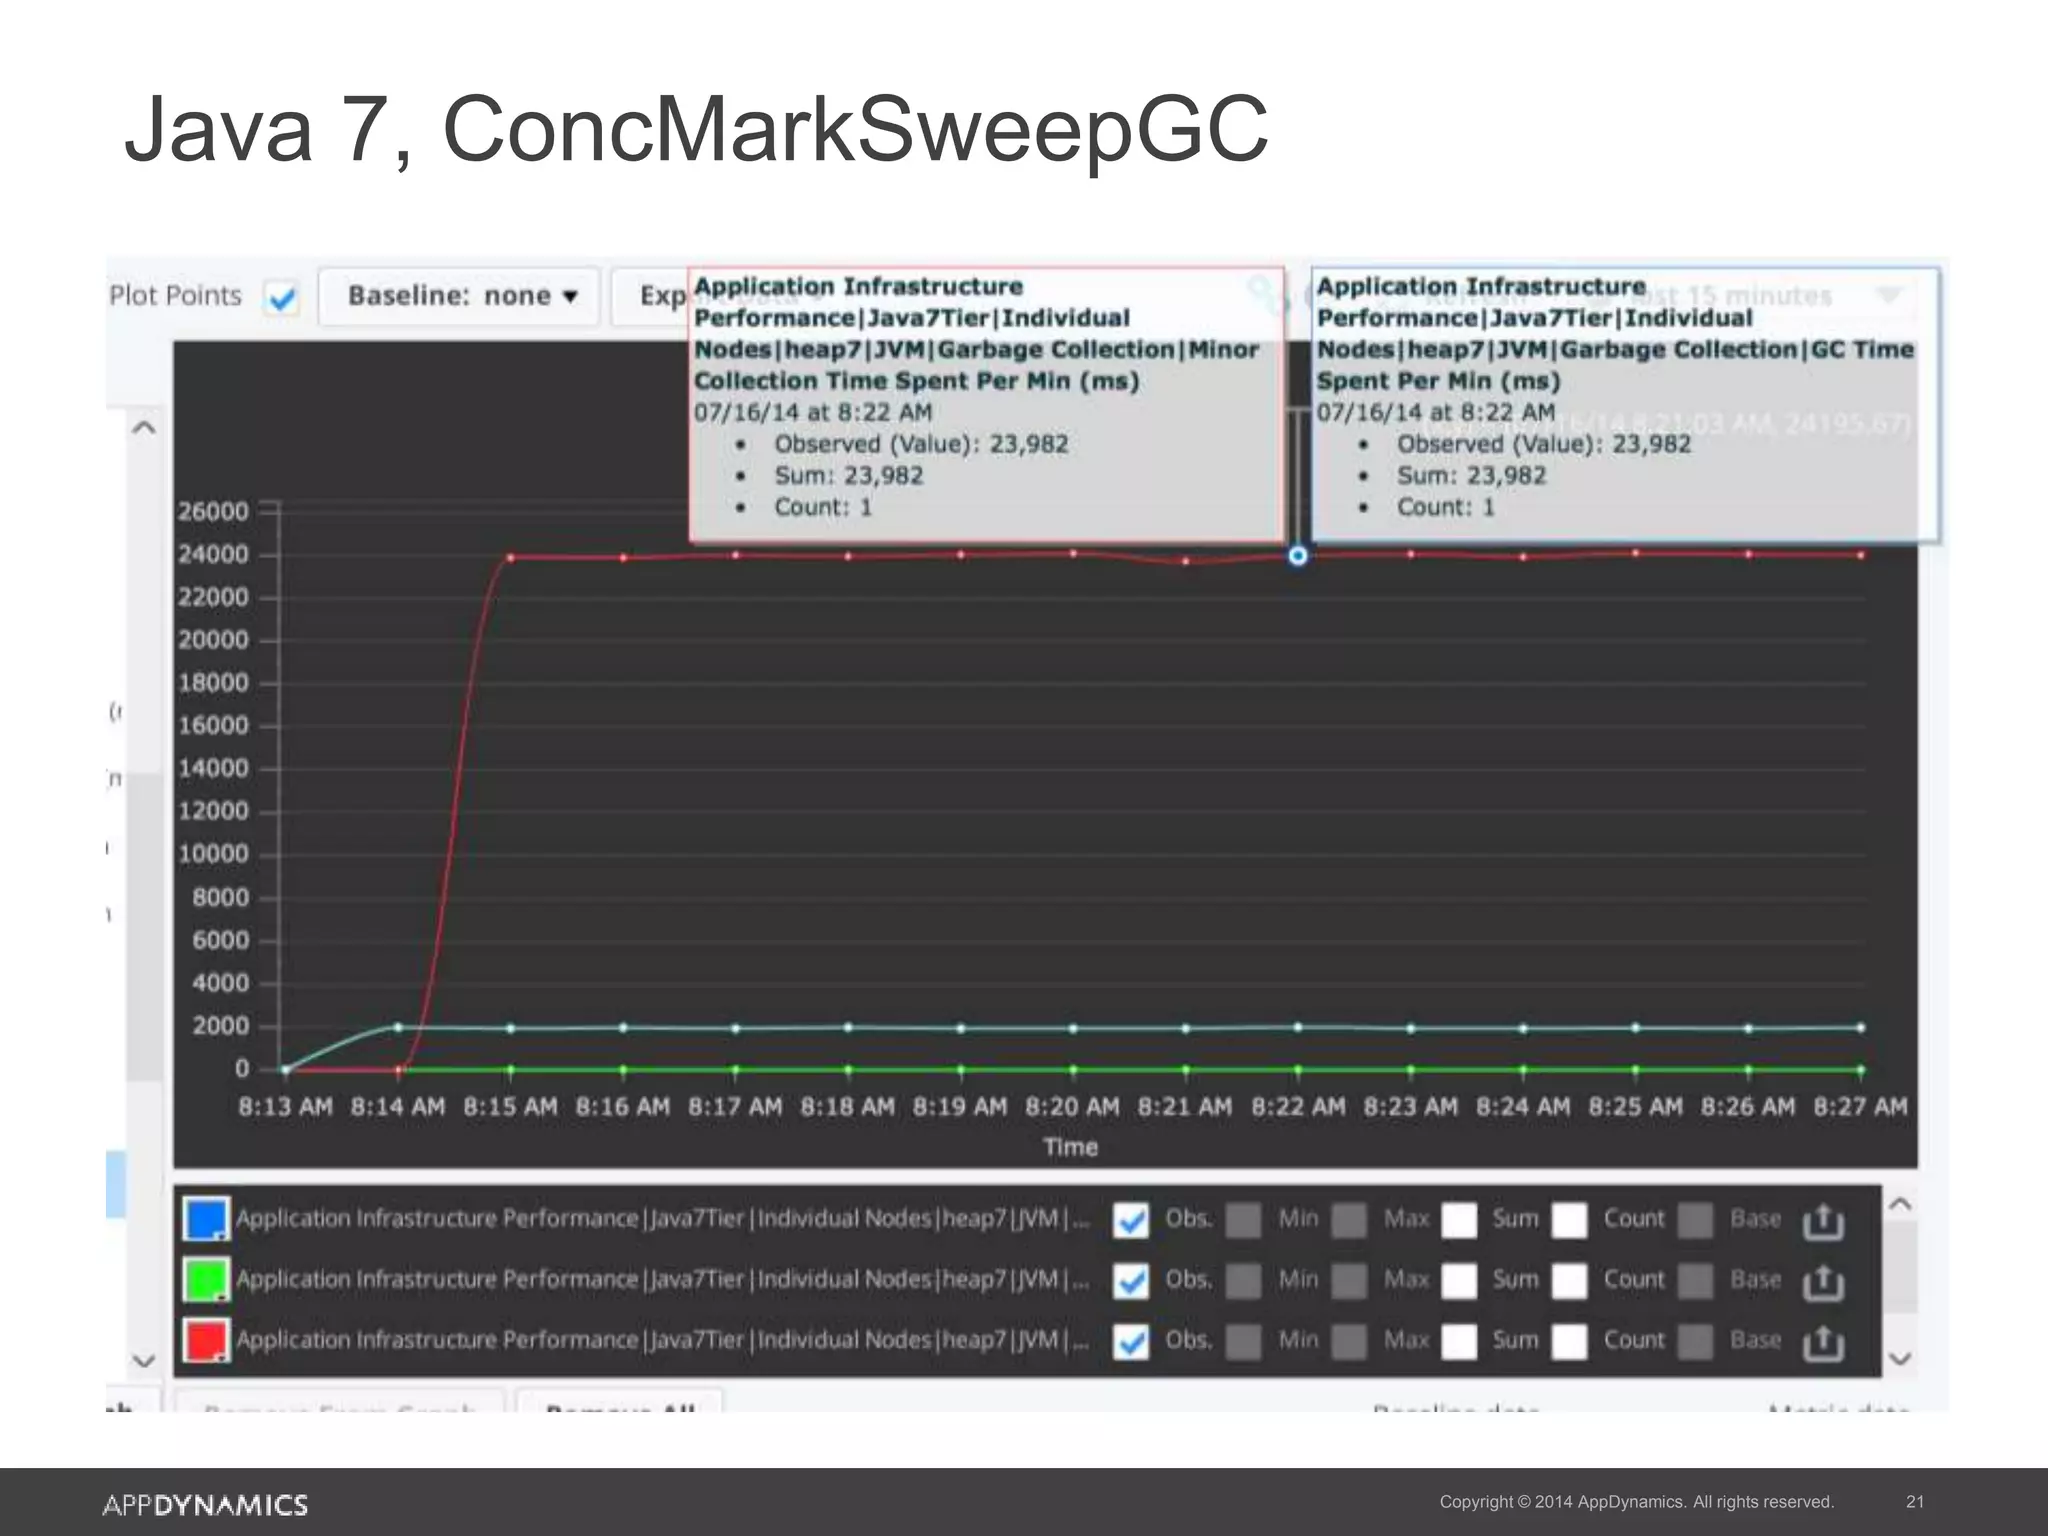
Examination of Concurrent Mark-Sweep GC performance in Java 7, highlighting memory usage and garbage collection metrics.
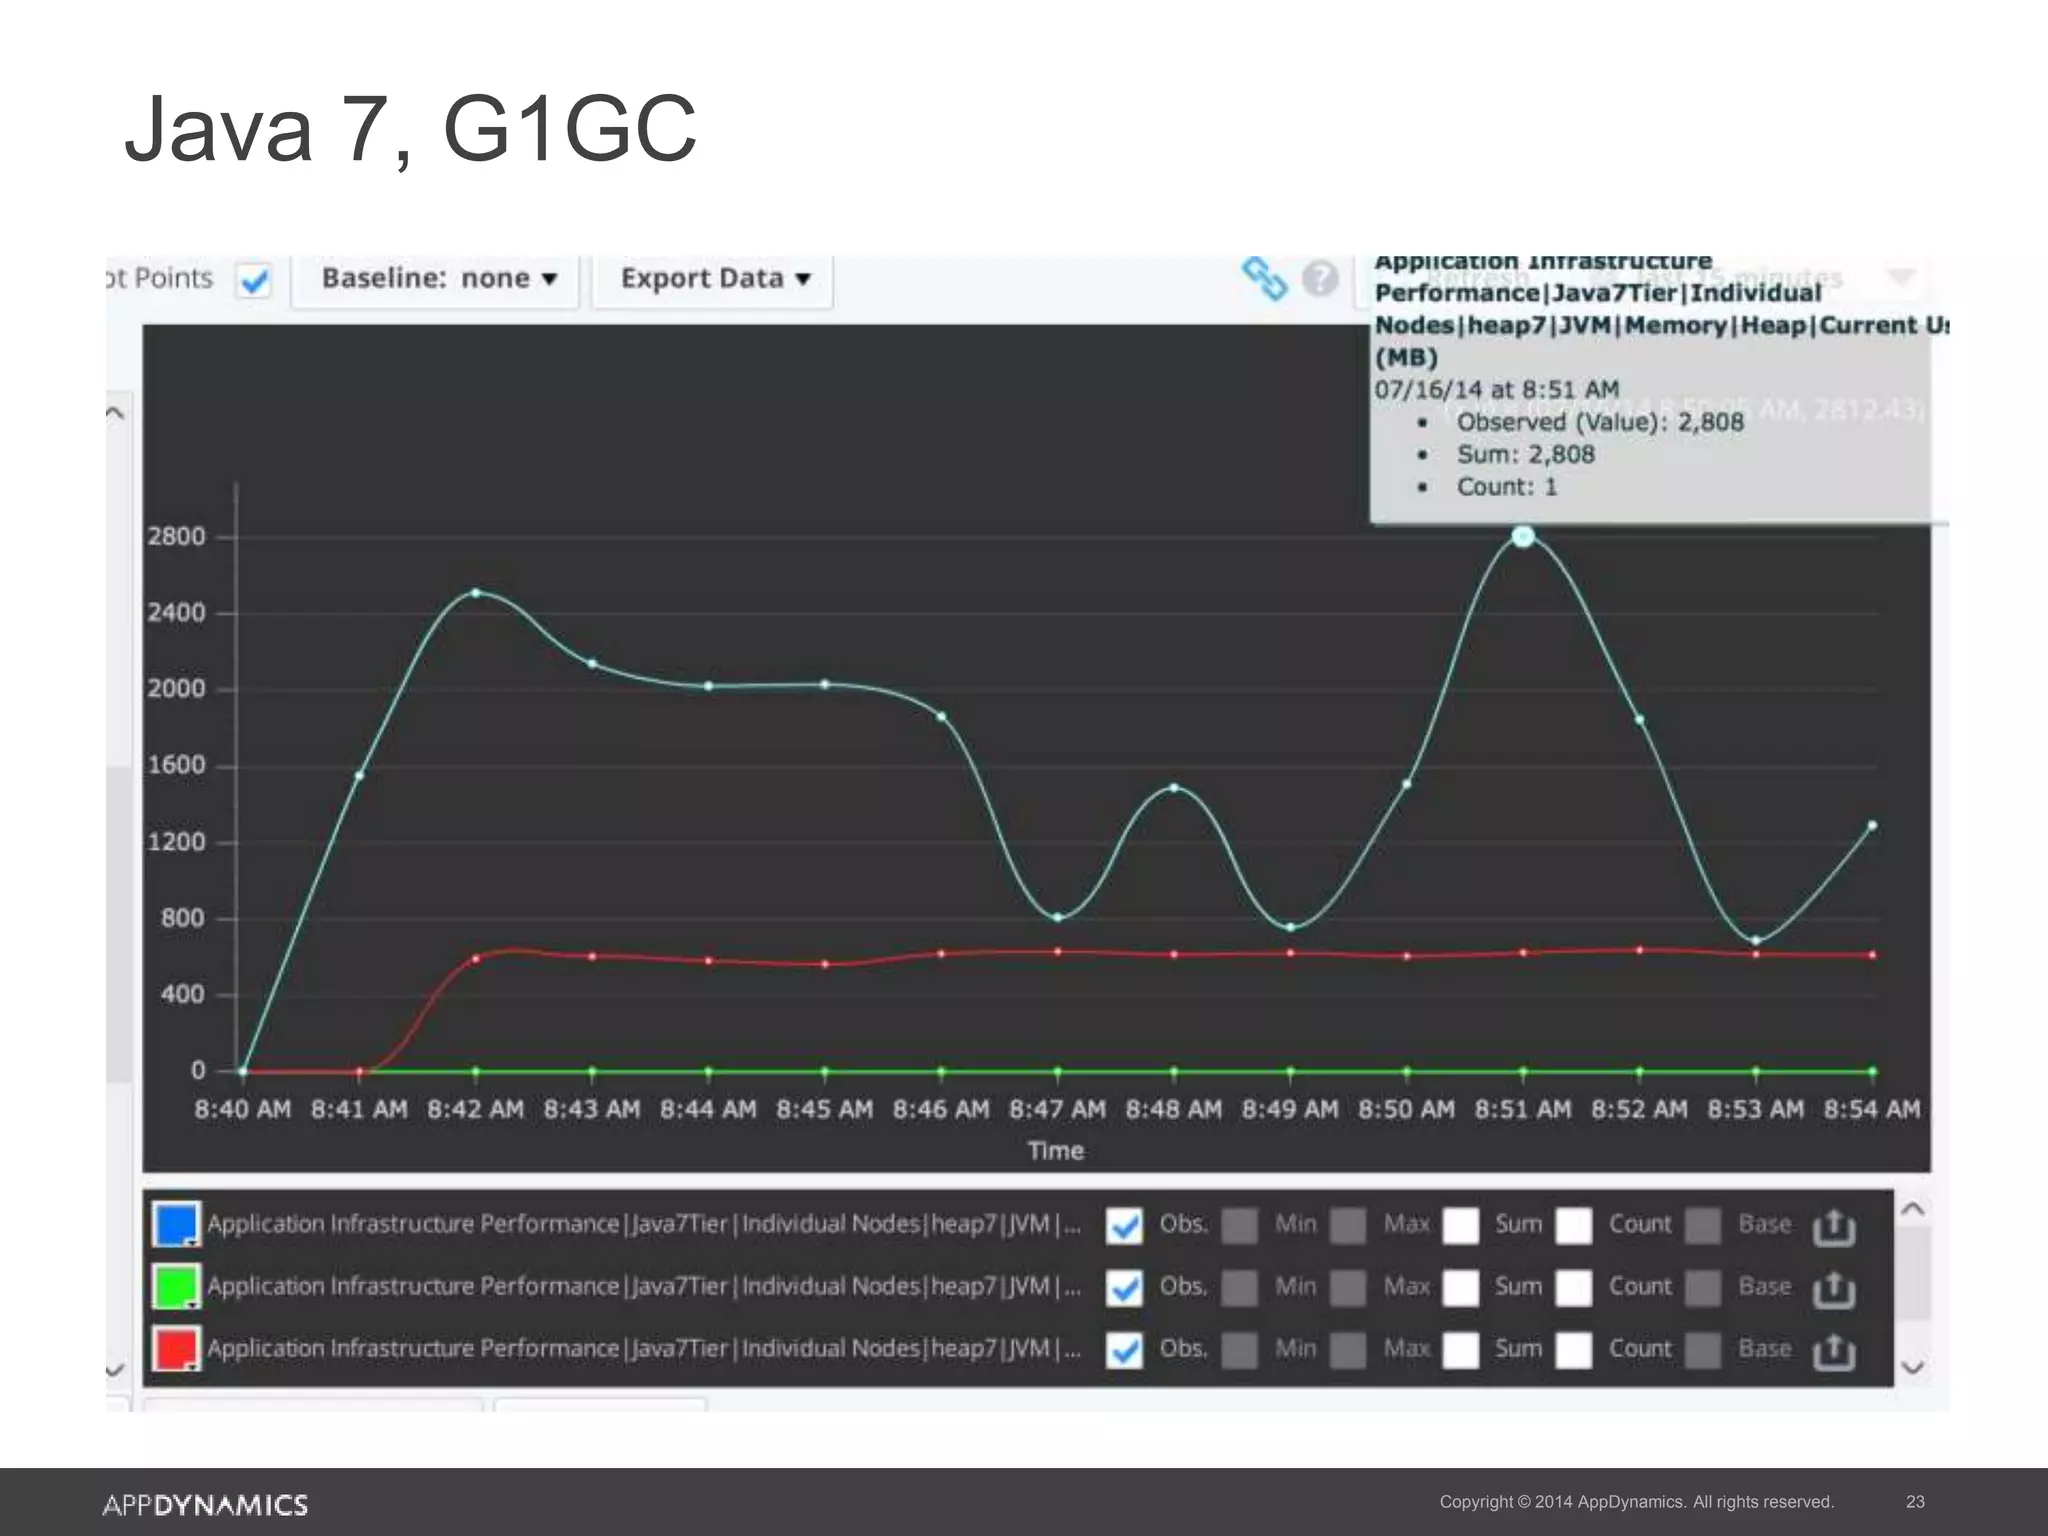
Review of G1GC performance in Java 7 and comparison against other GC strategies.
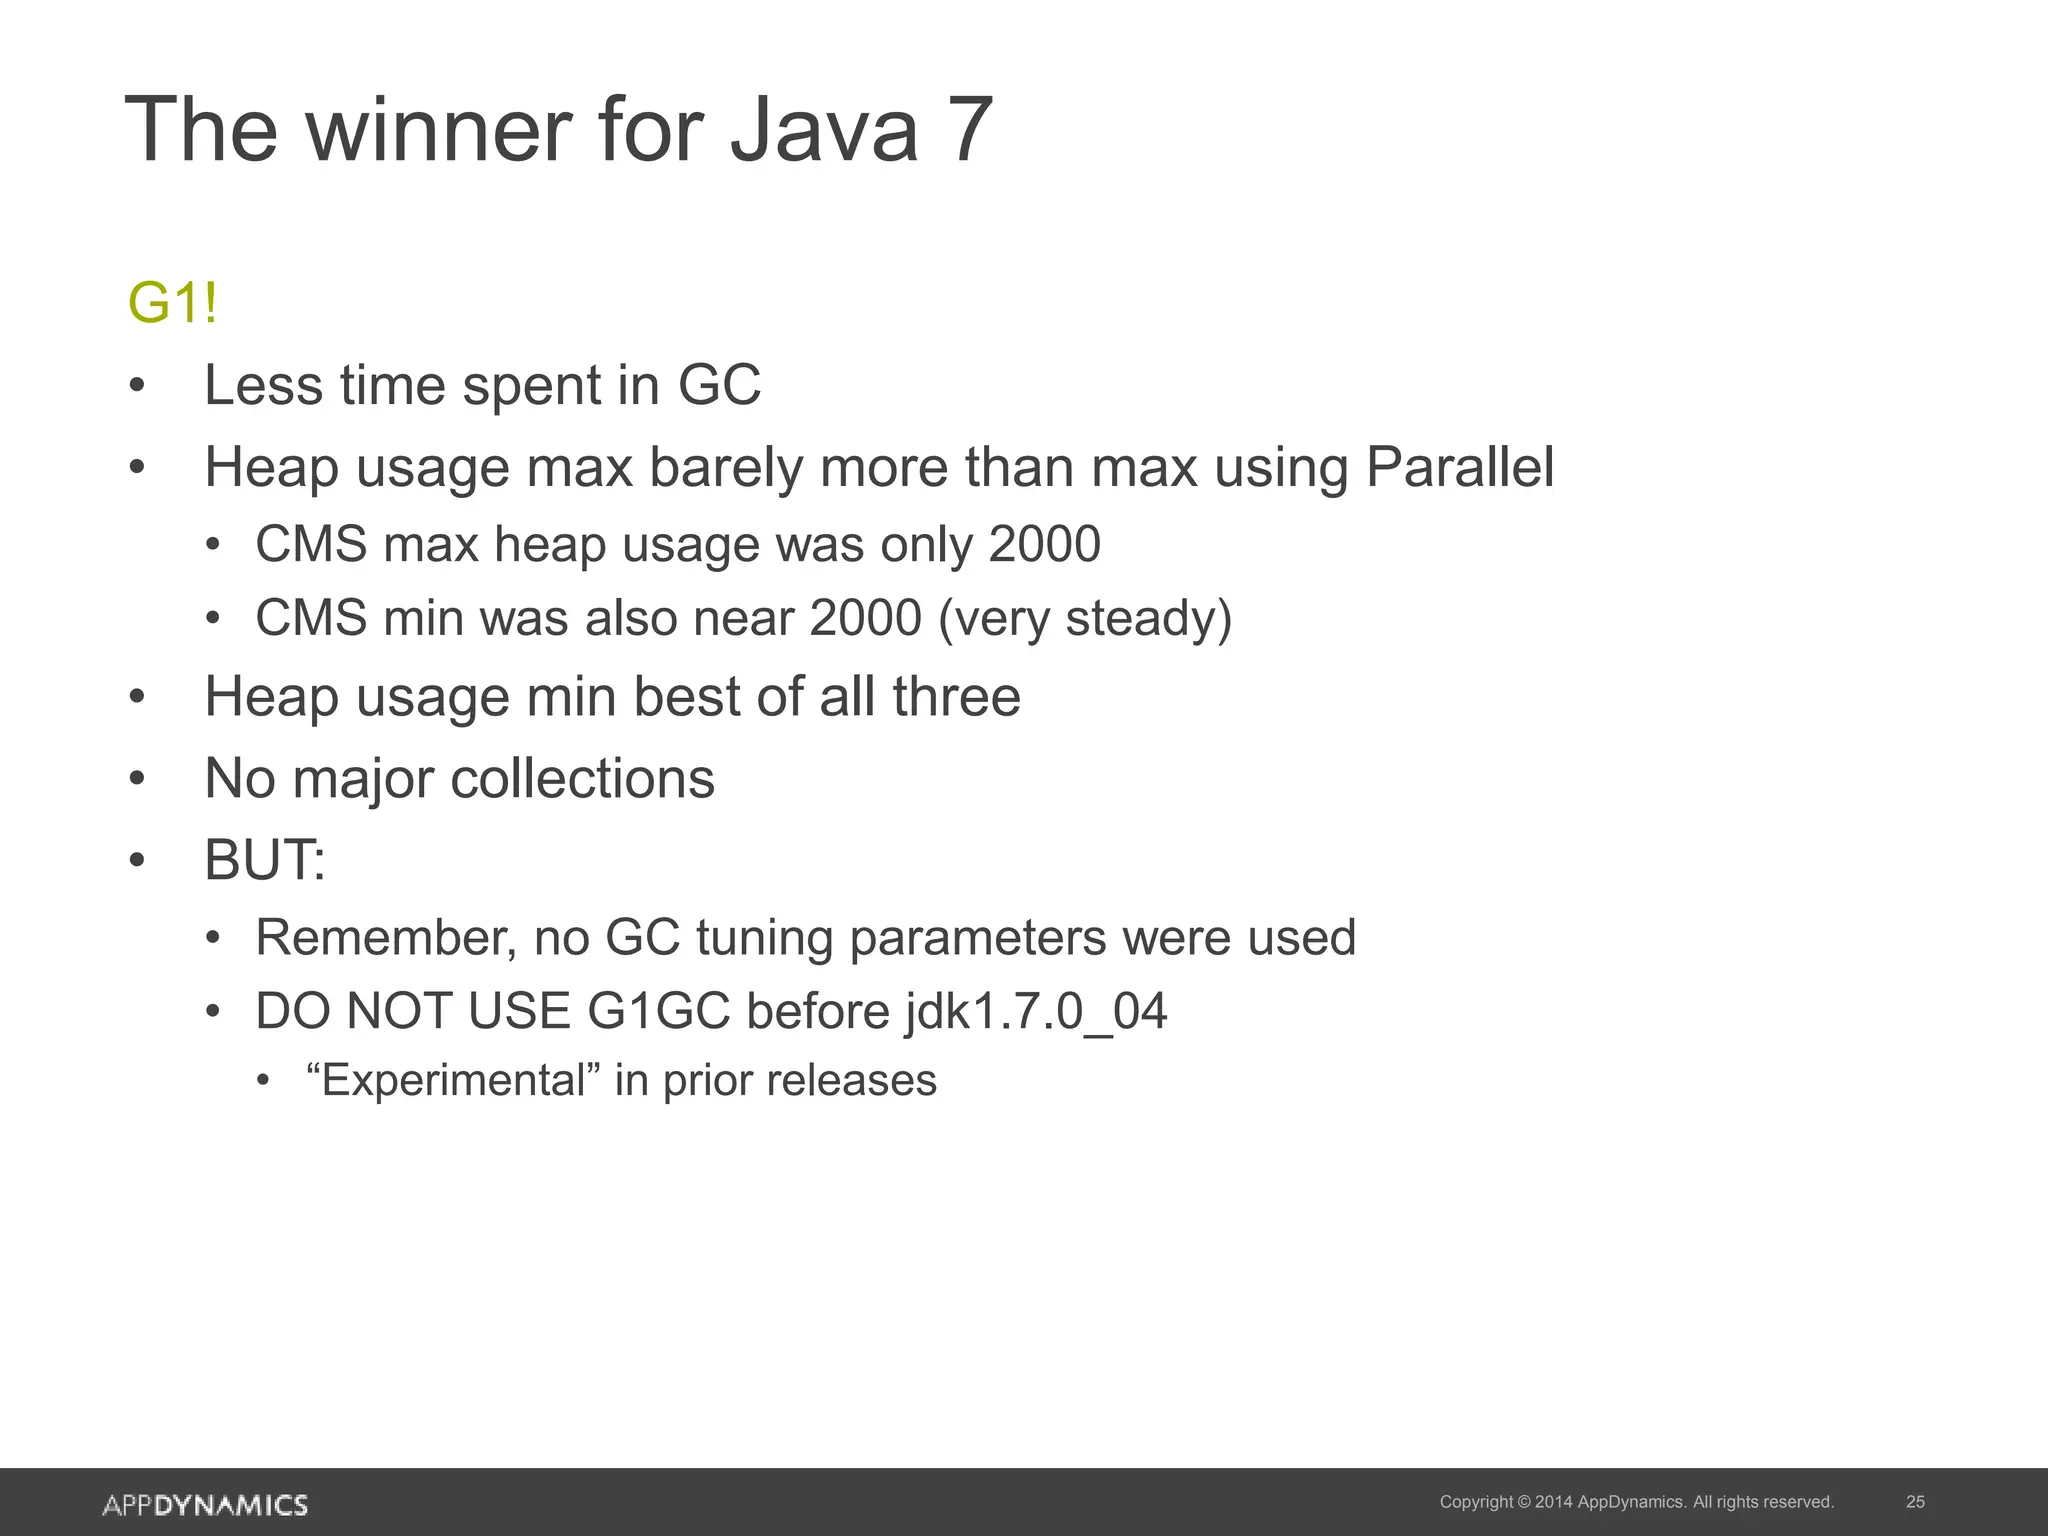
Conclusion on G1GC as the best GC strategy in Java 7, based on performance in extensive testing.
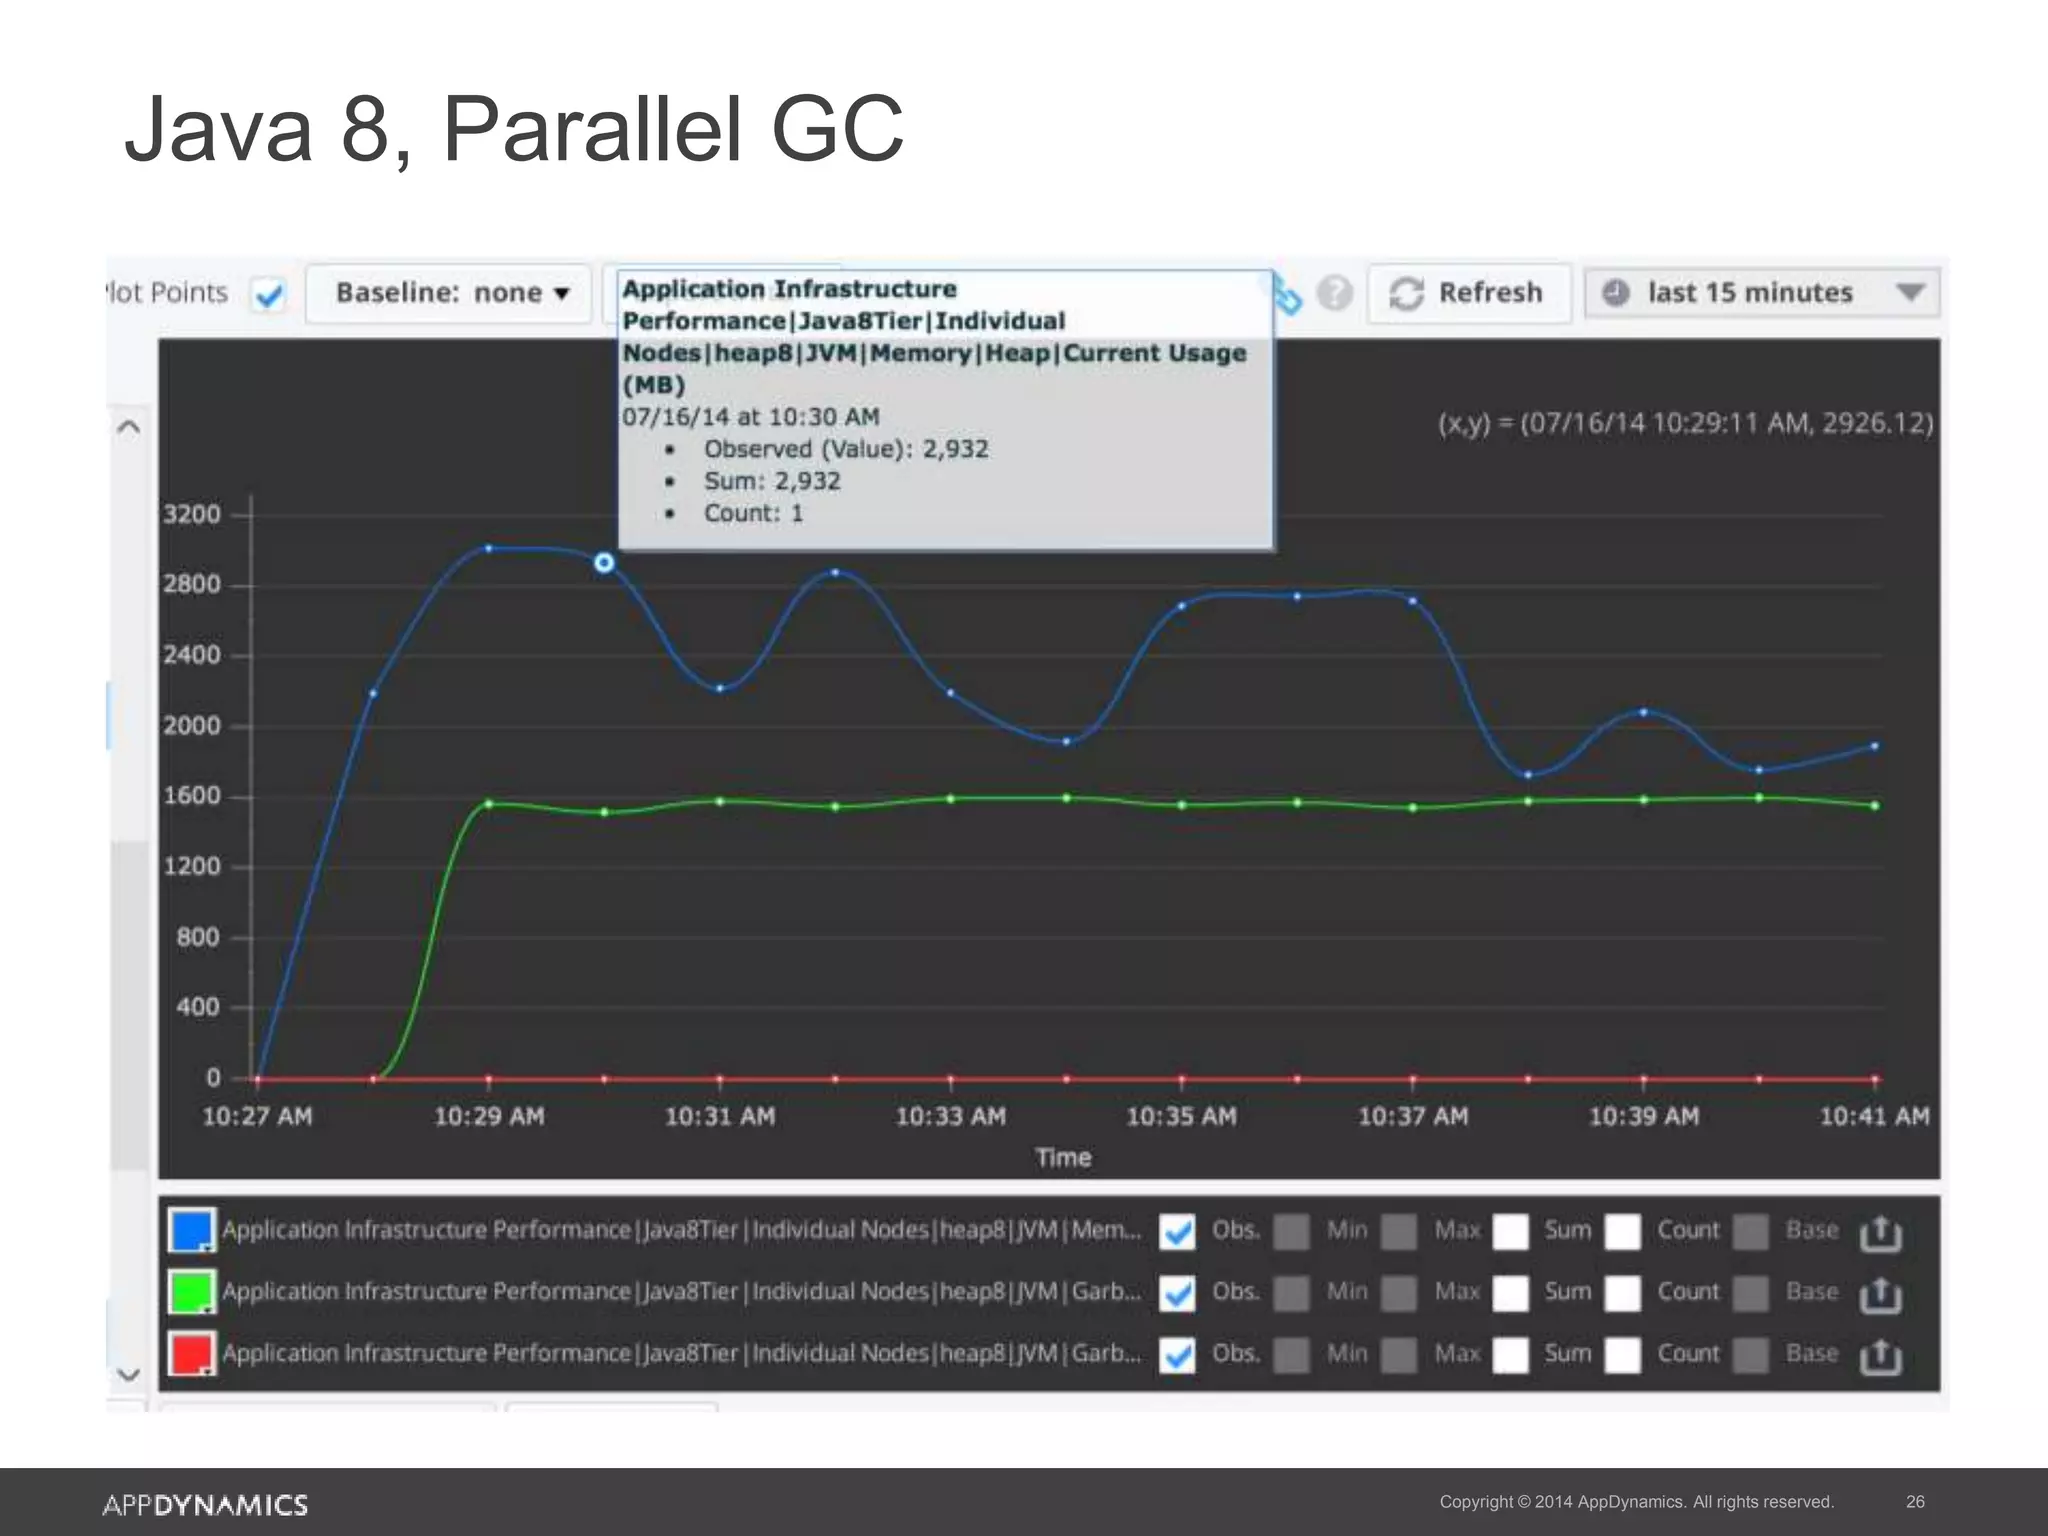
Introduction to earlier findings with Java 8’s Parallel GC performance metrics.
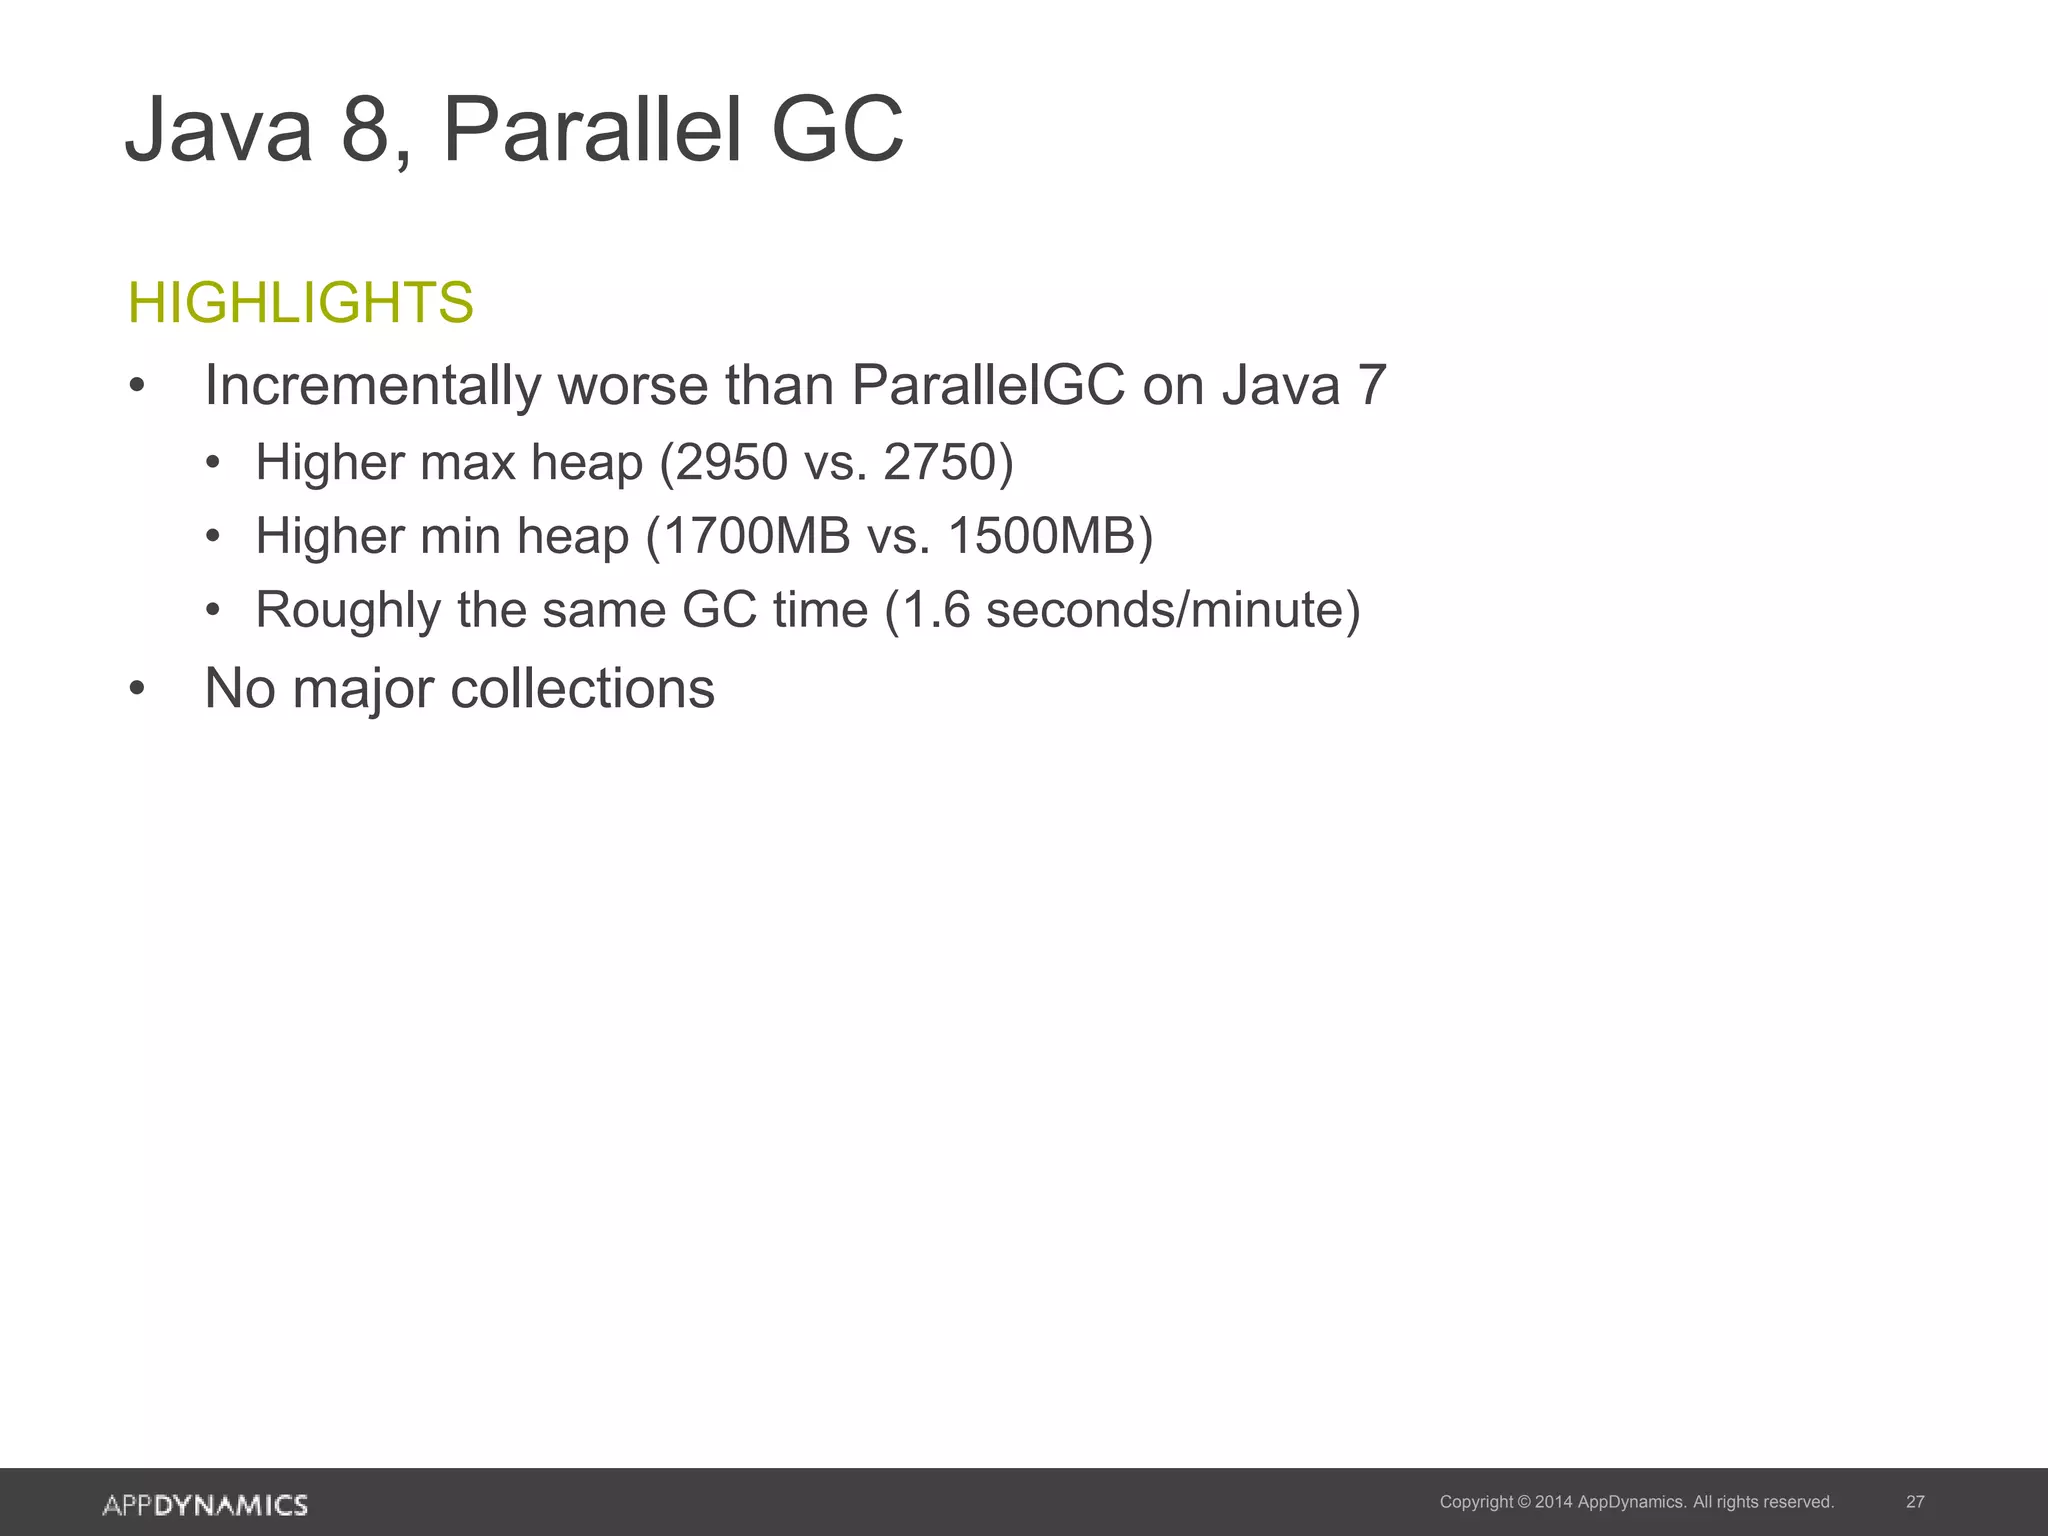
Analysis of Java 8's Parallel GC performance, including heap usage and garbage collection times.
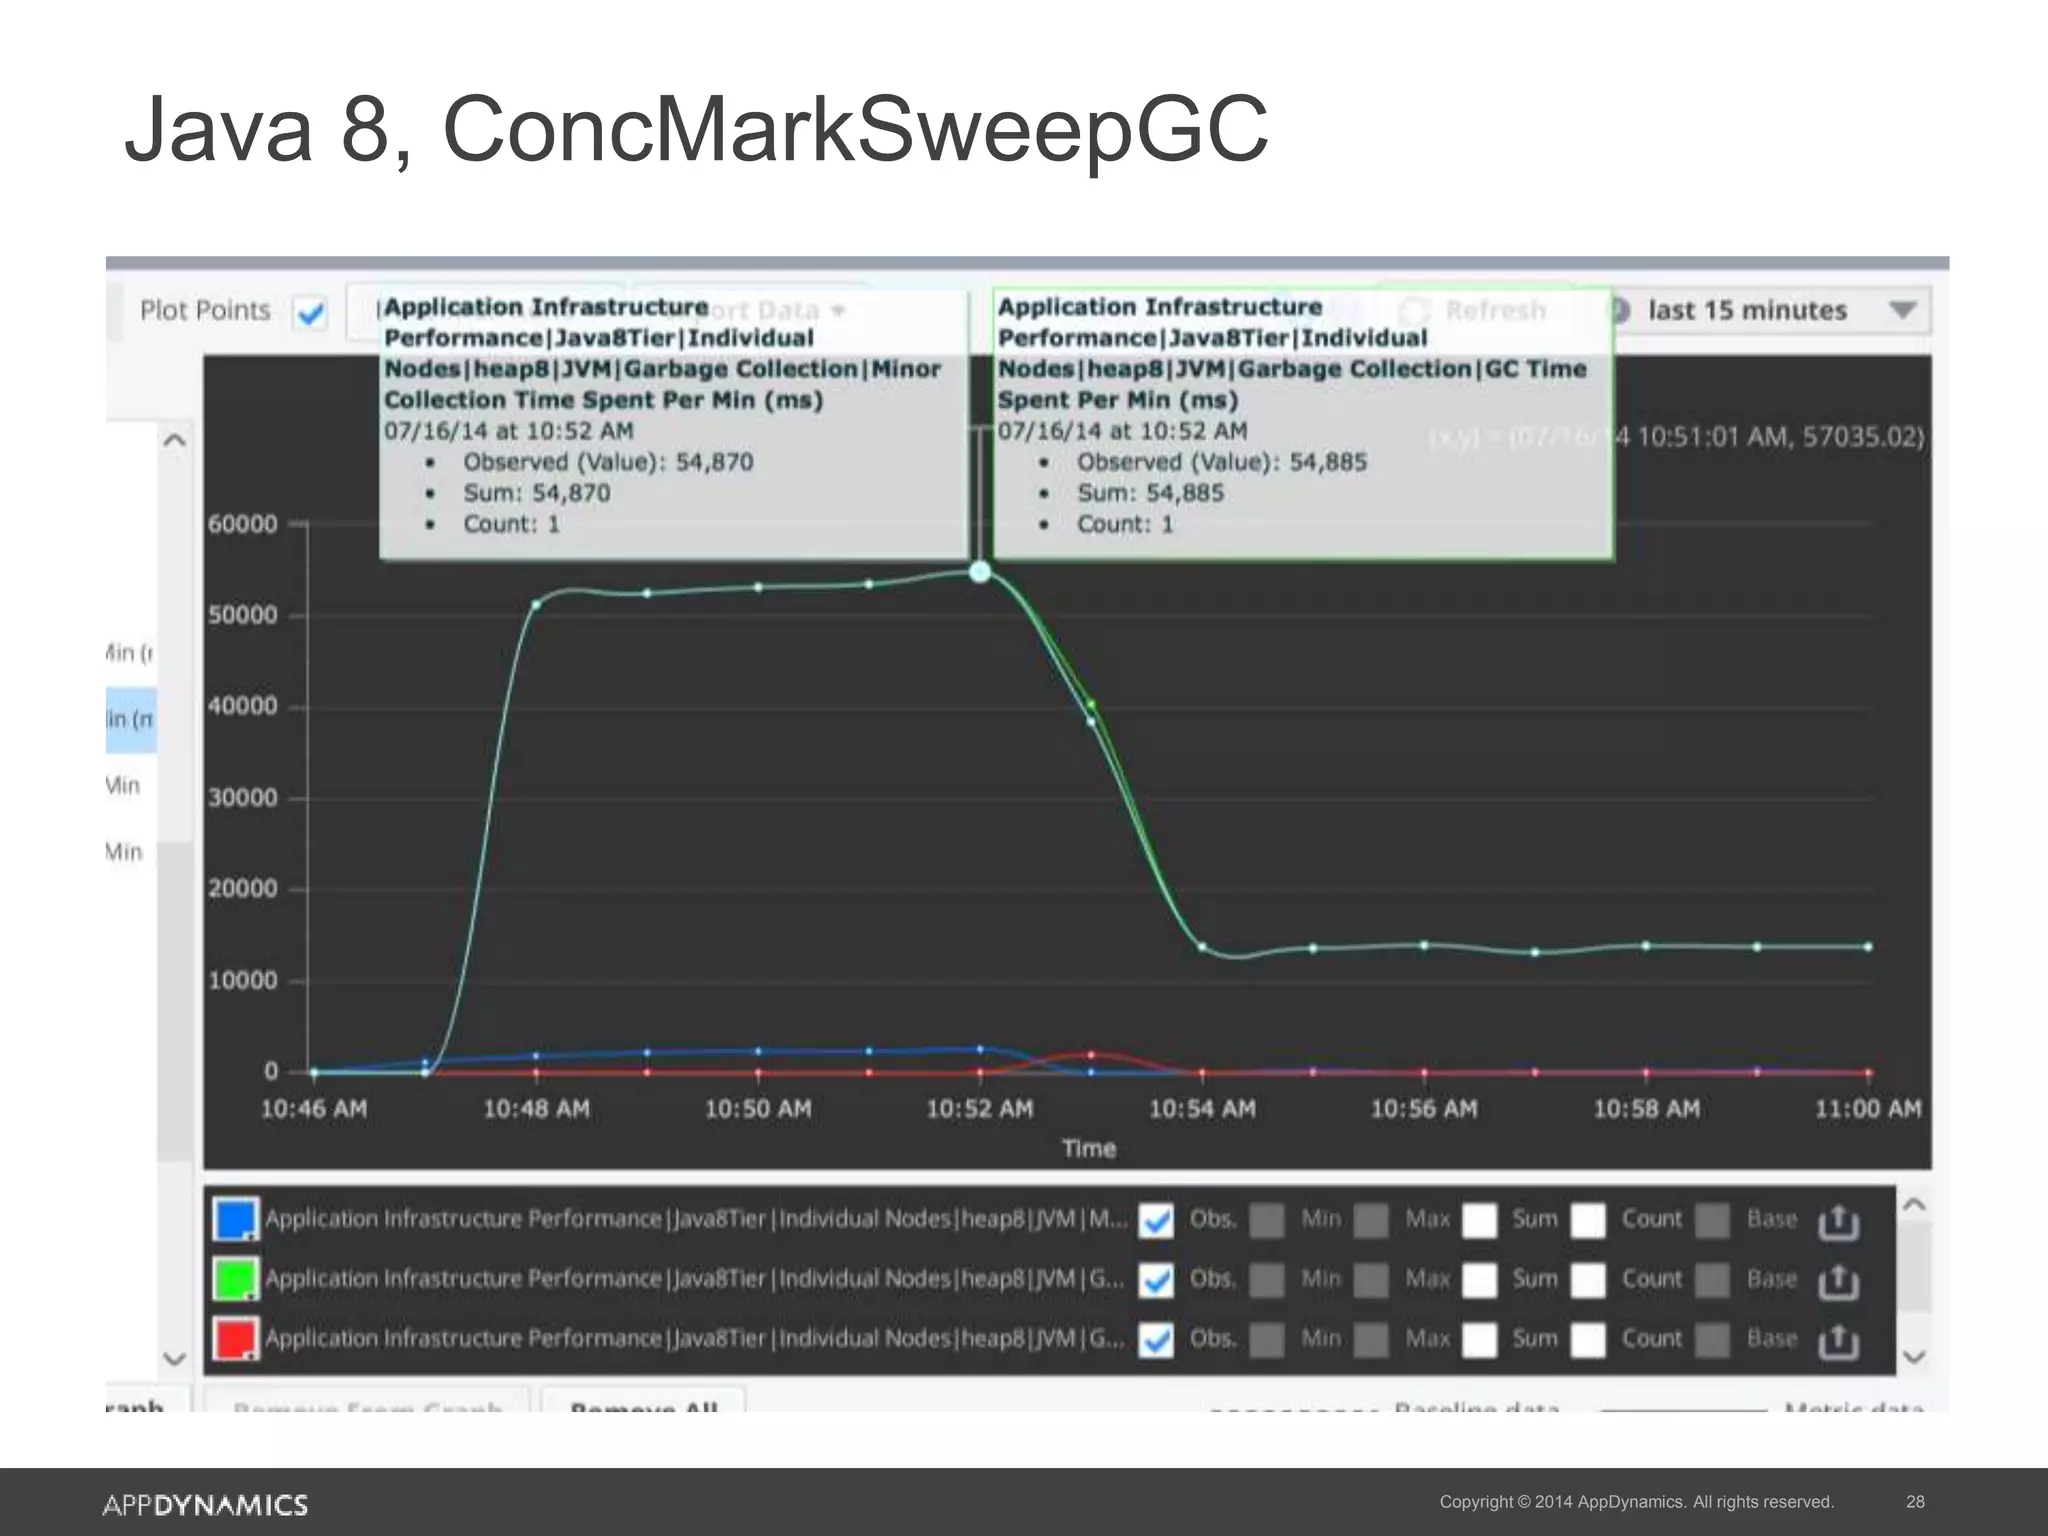
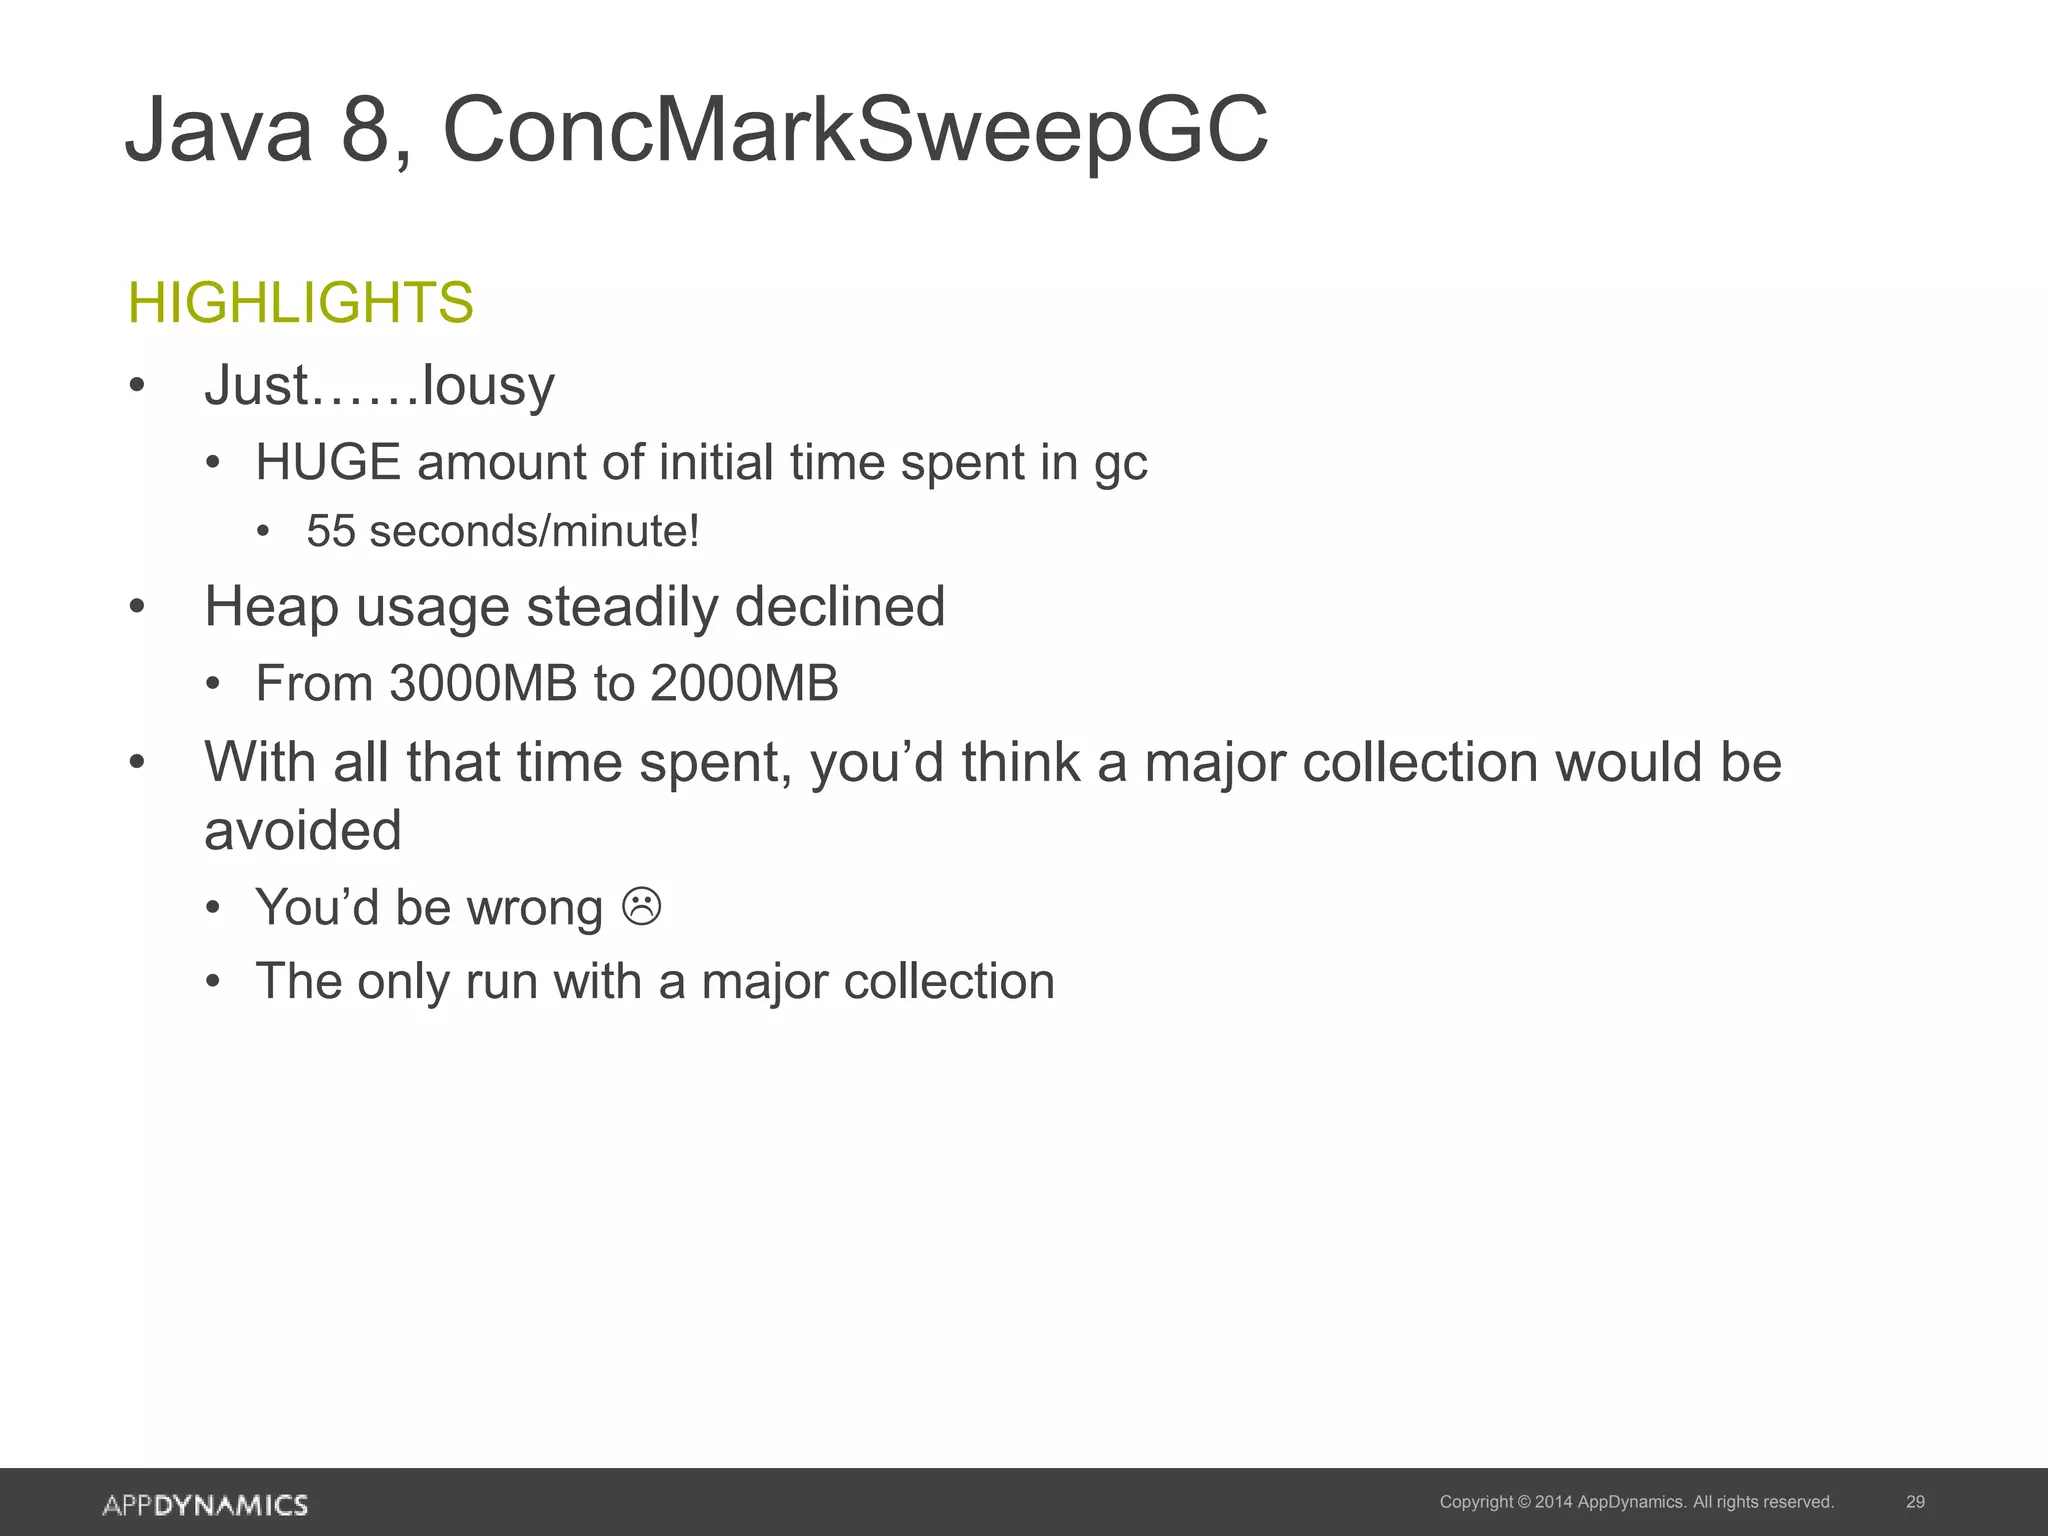
Discussion on the performance of ConcMarkSweep GC in Java 8 revealing significant issues.
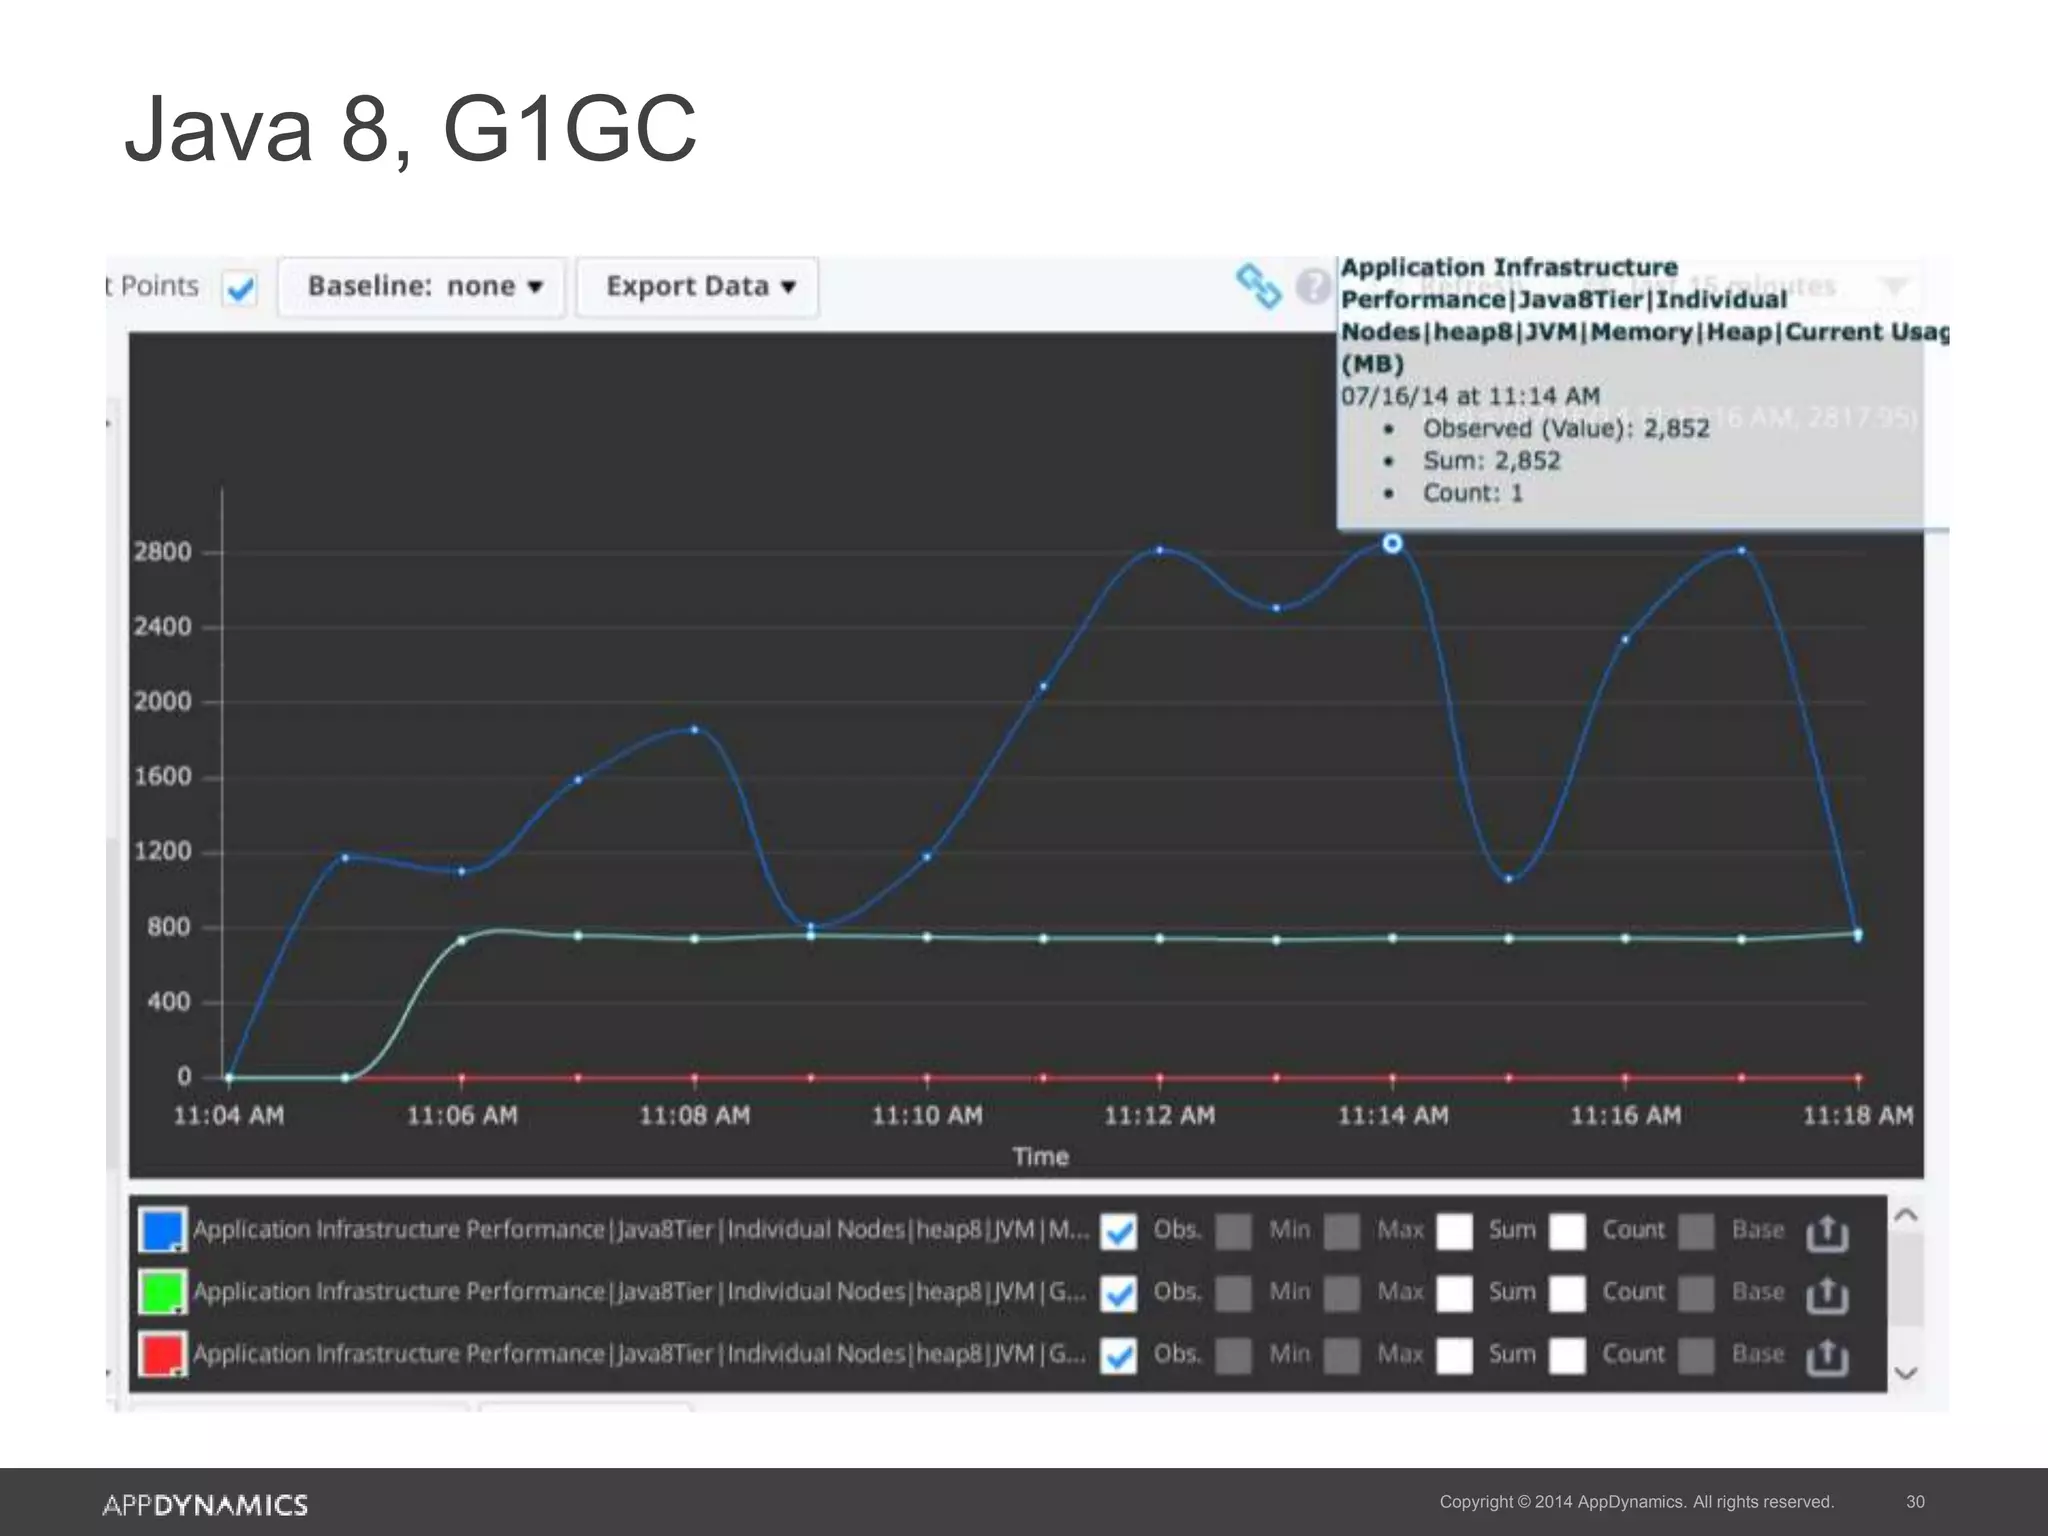
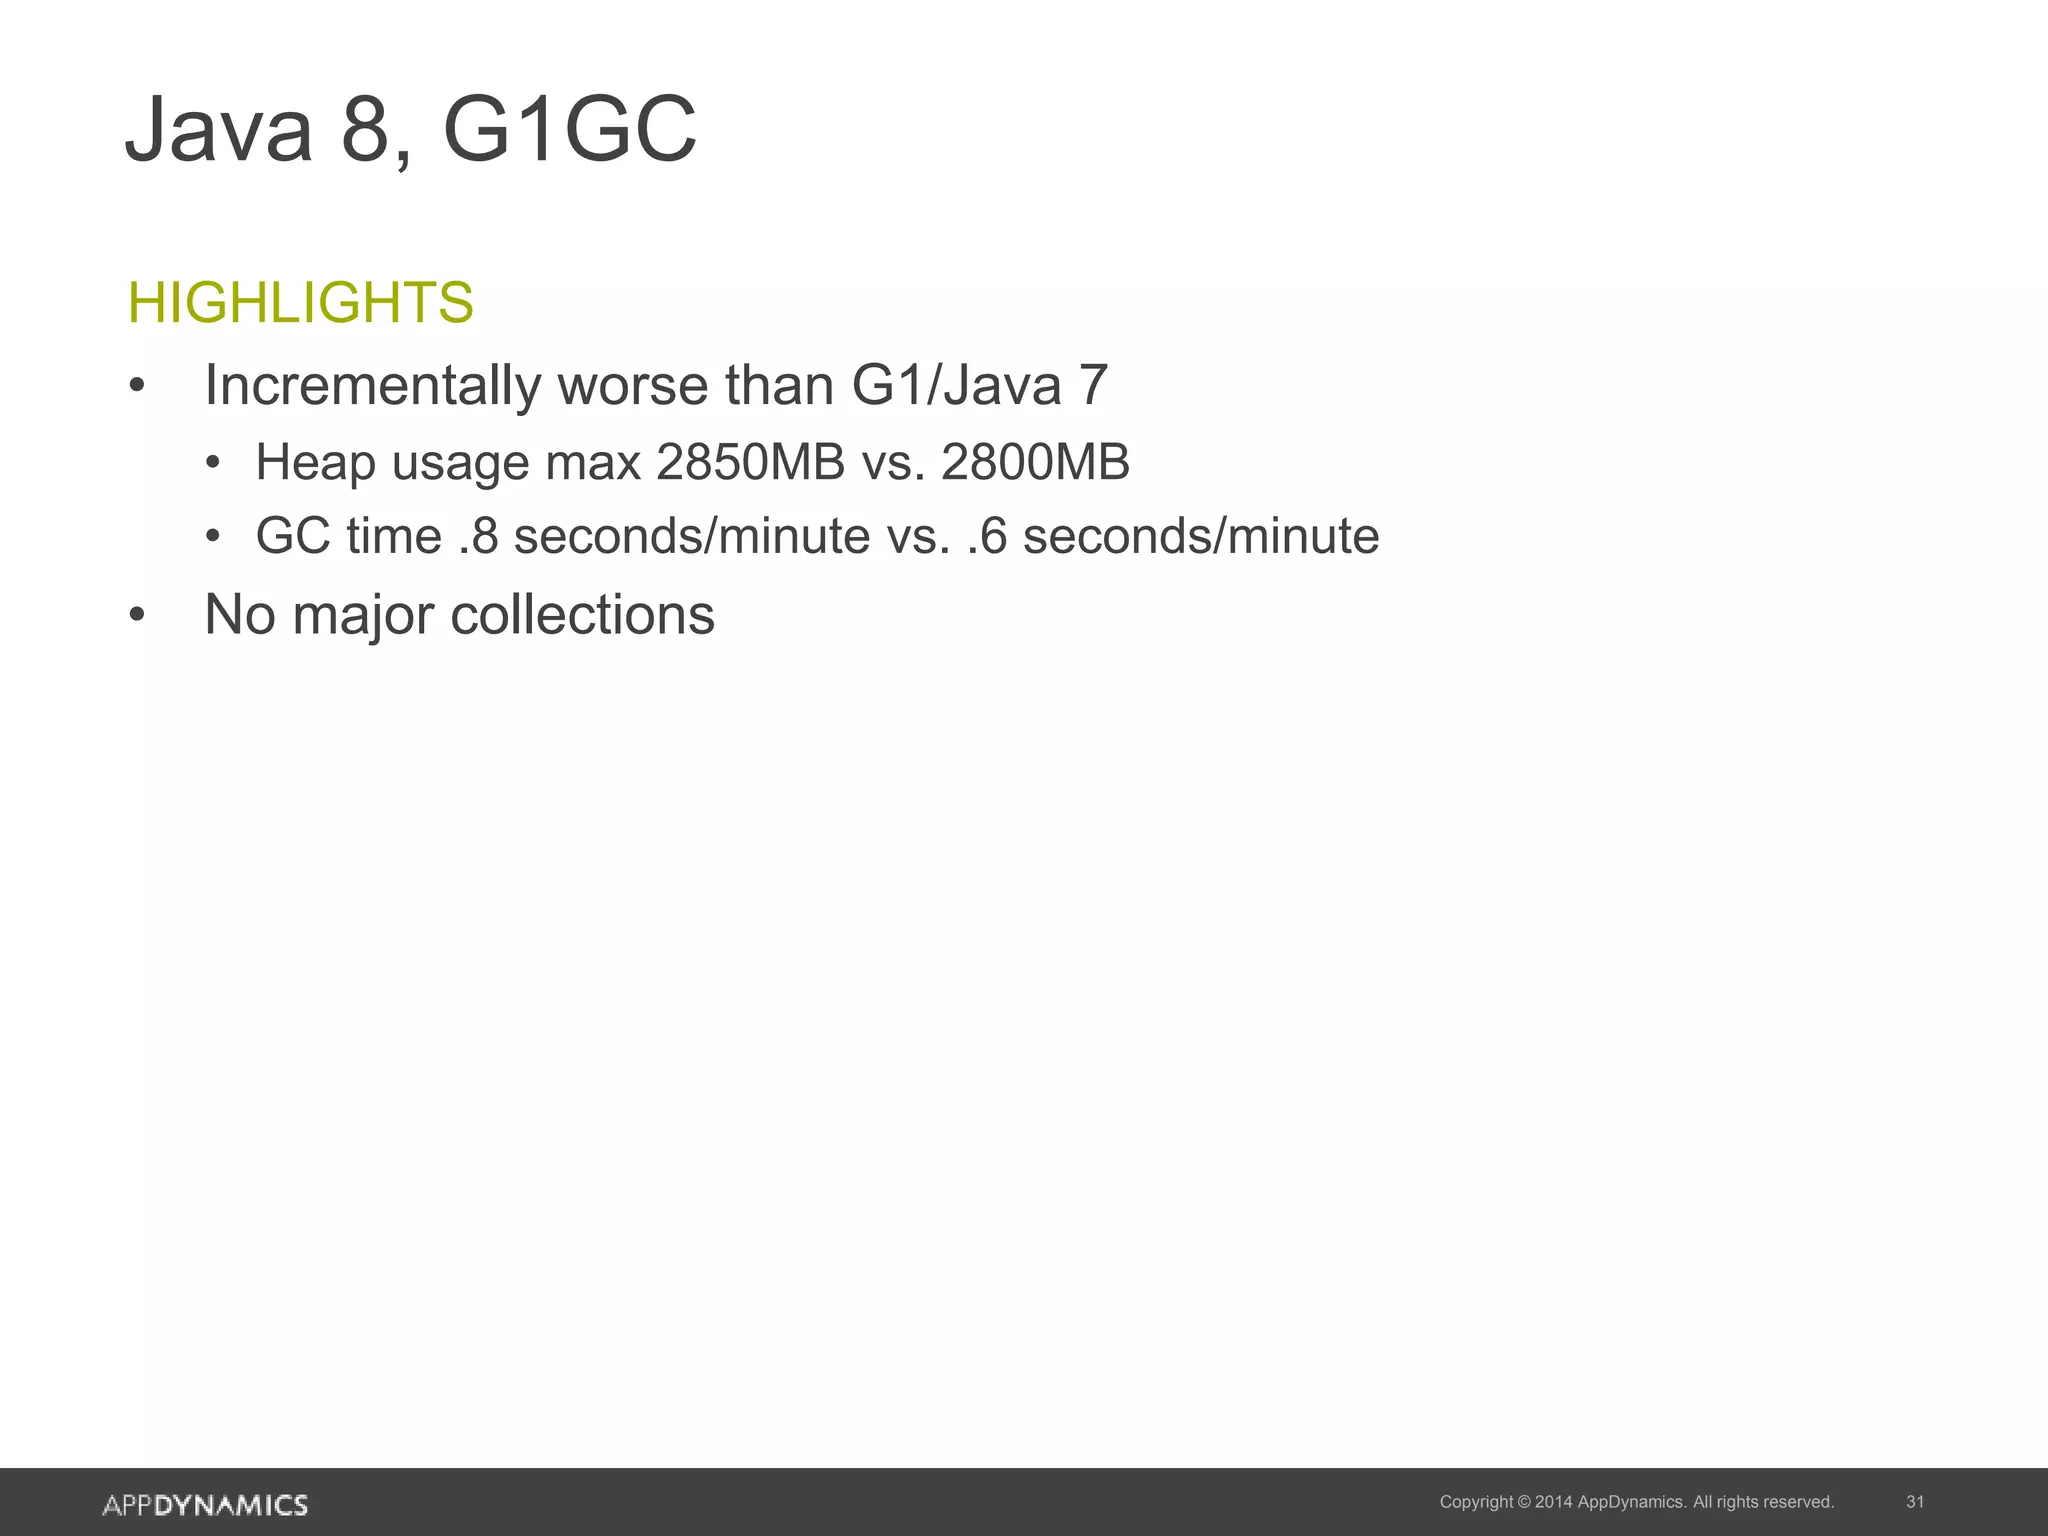
Performance highlights of G1GC in Java 8 compared to Java 7.
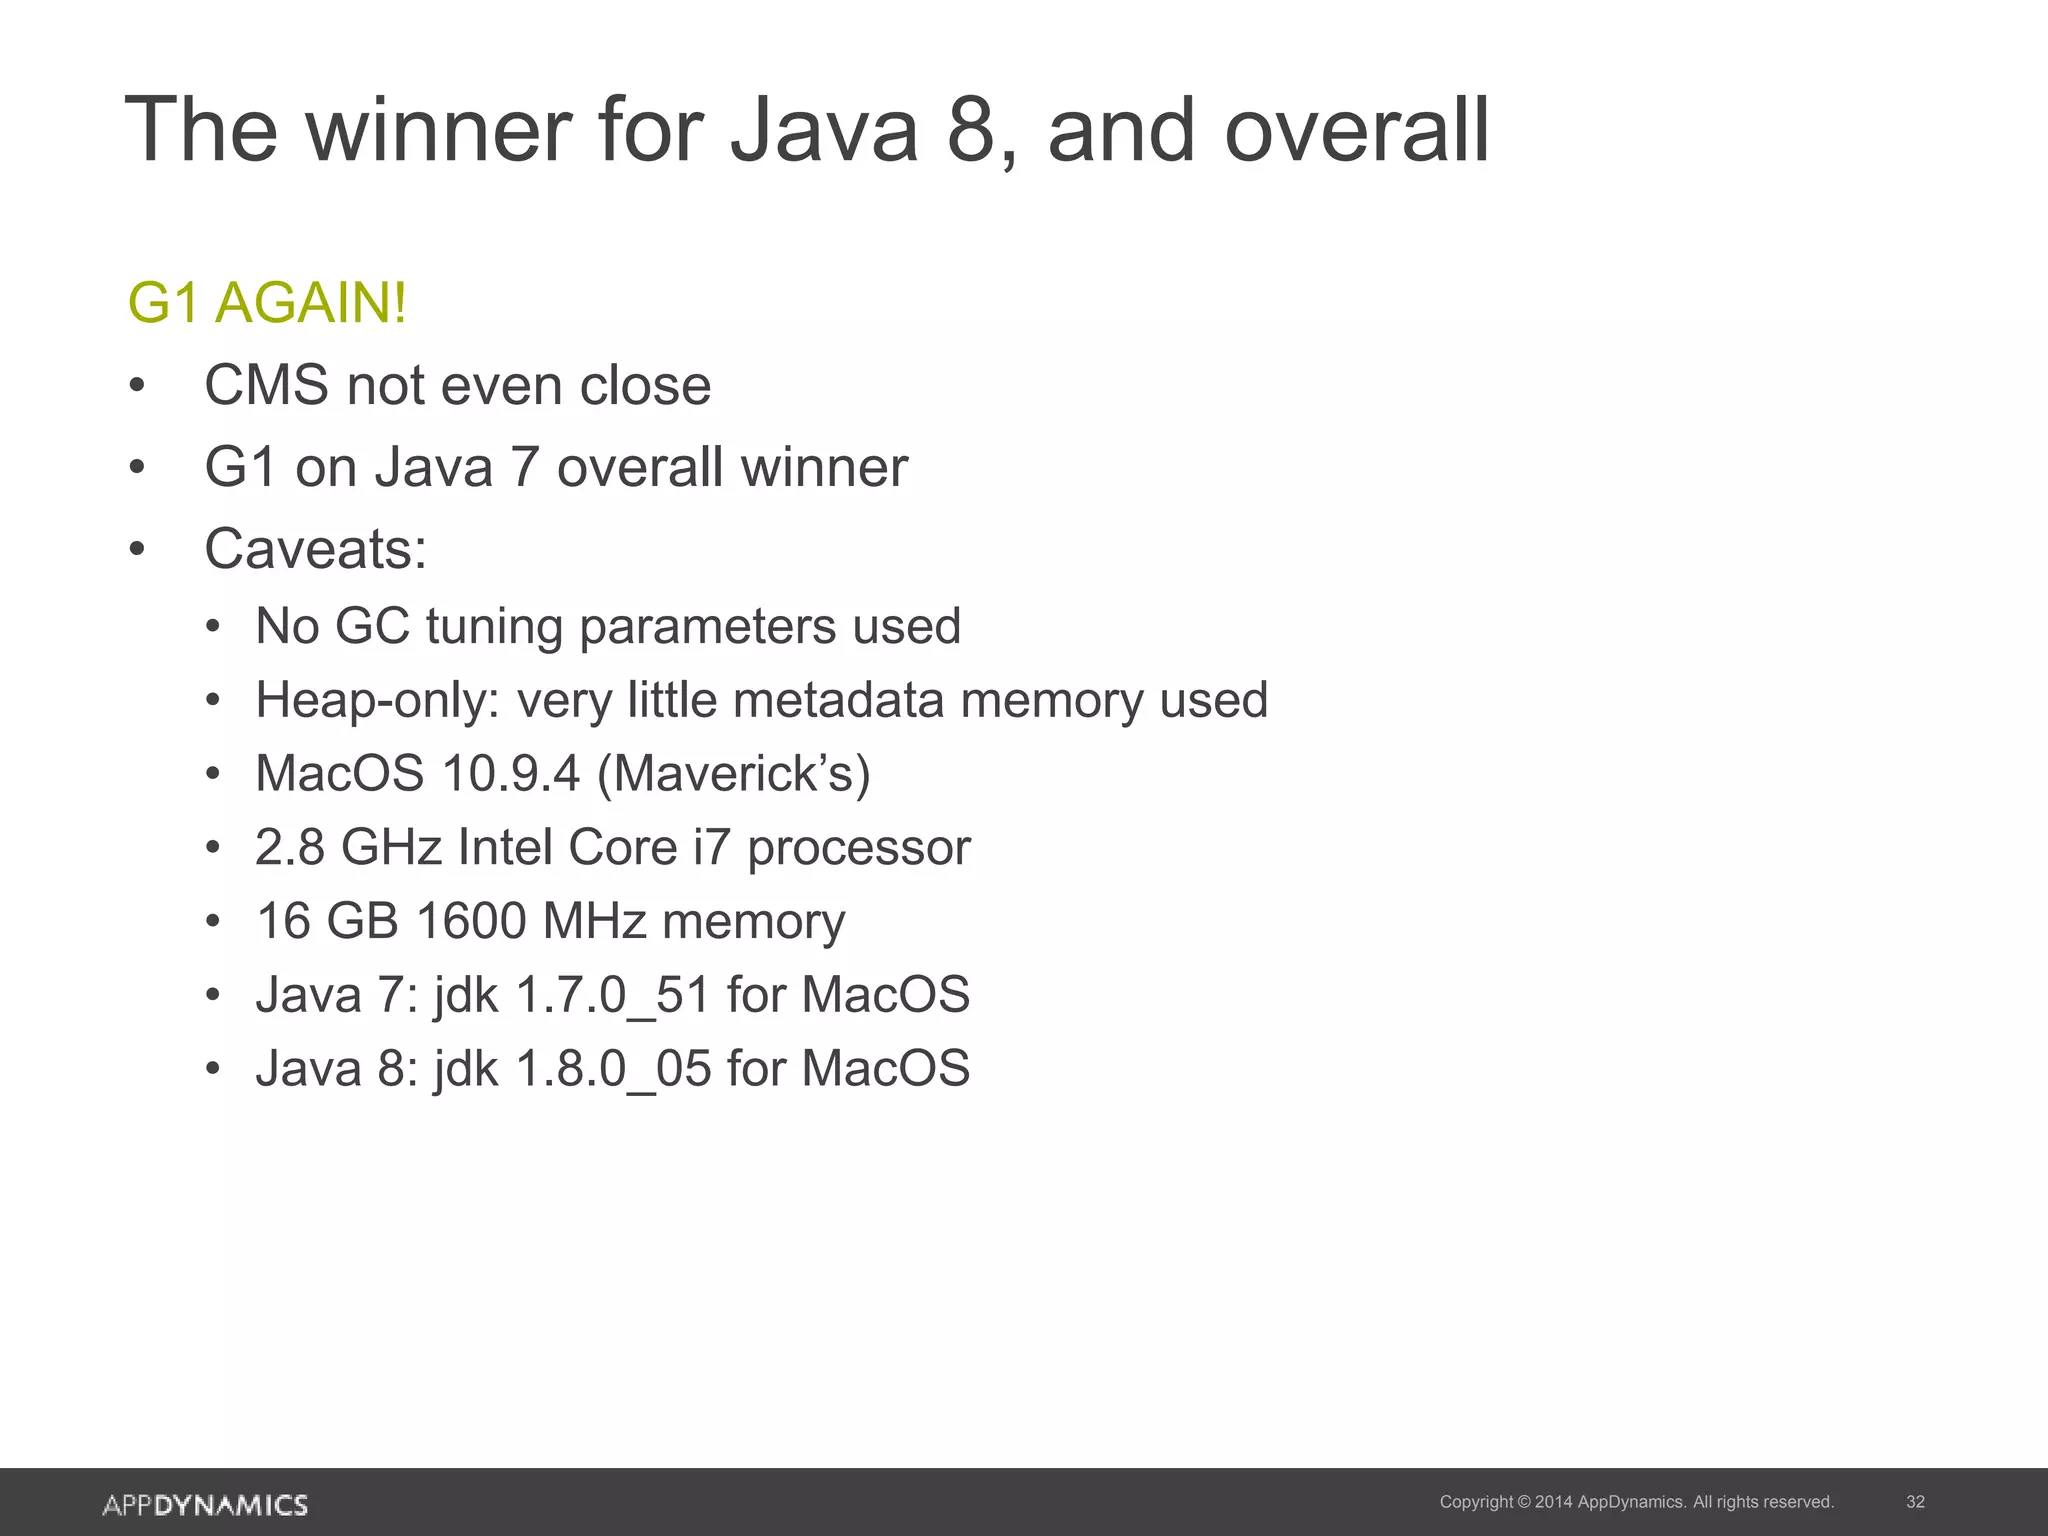
Final analysis declaring G1GC as the overall best GC strategy in both Java 7 and Java 8.
Brief insights into the complexity and number of GC tuning parameters available in Java.
Key points summarizing best practices for monitoring, managing memory, and understanding garbage collectors.
Information on how to access a free trial of AppDynamics services.
Conclusion and expression of gratitude to attendees of the presentation.