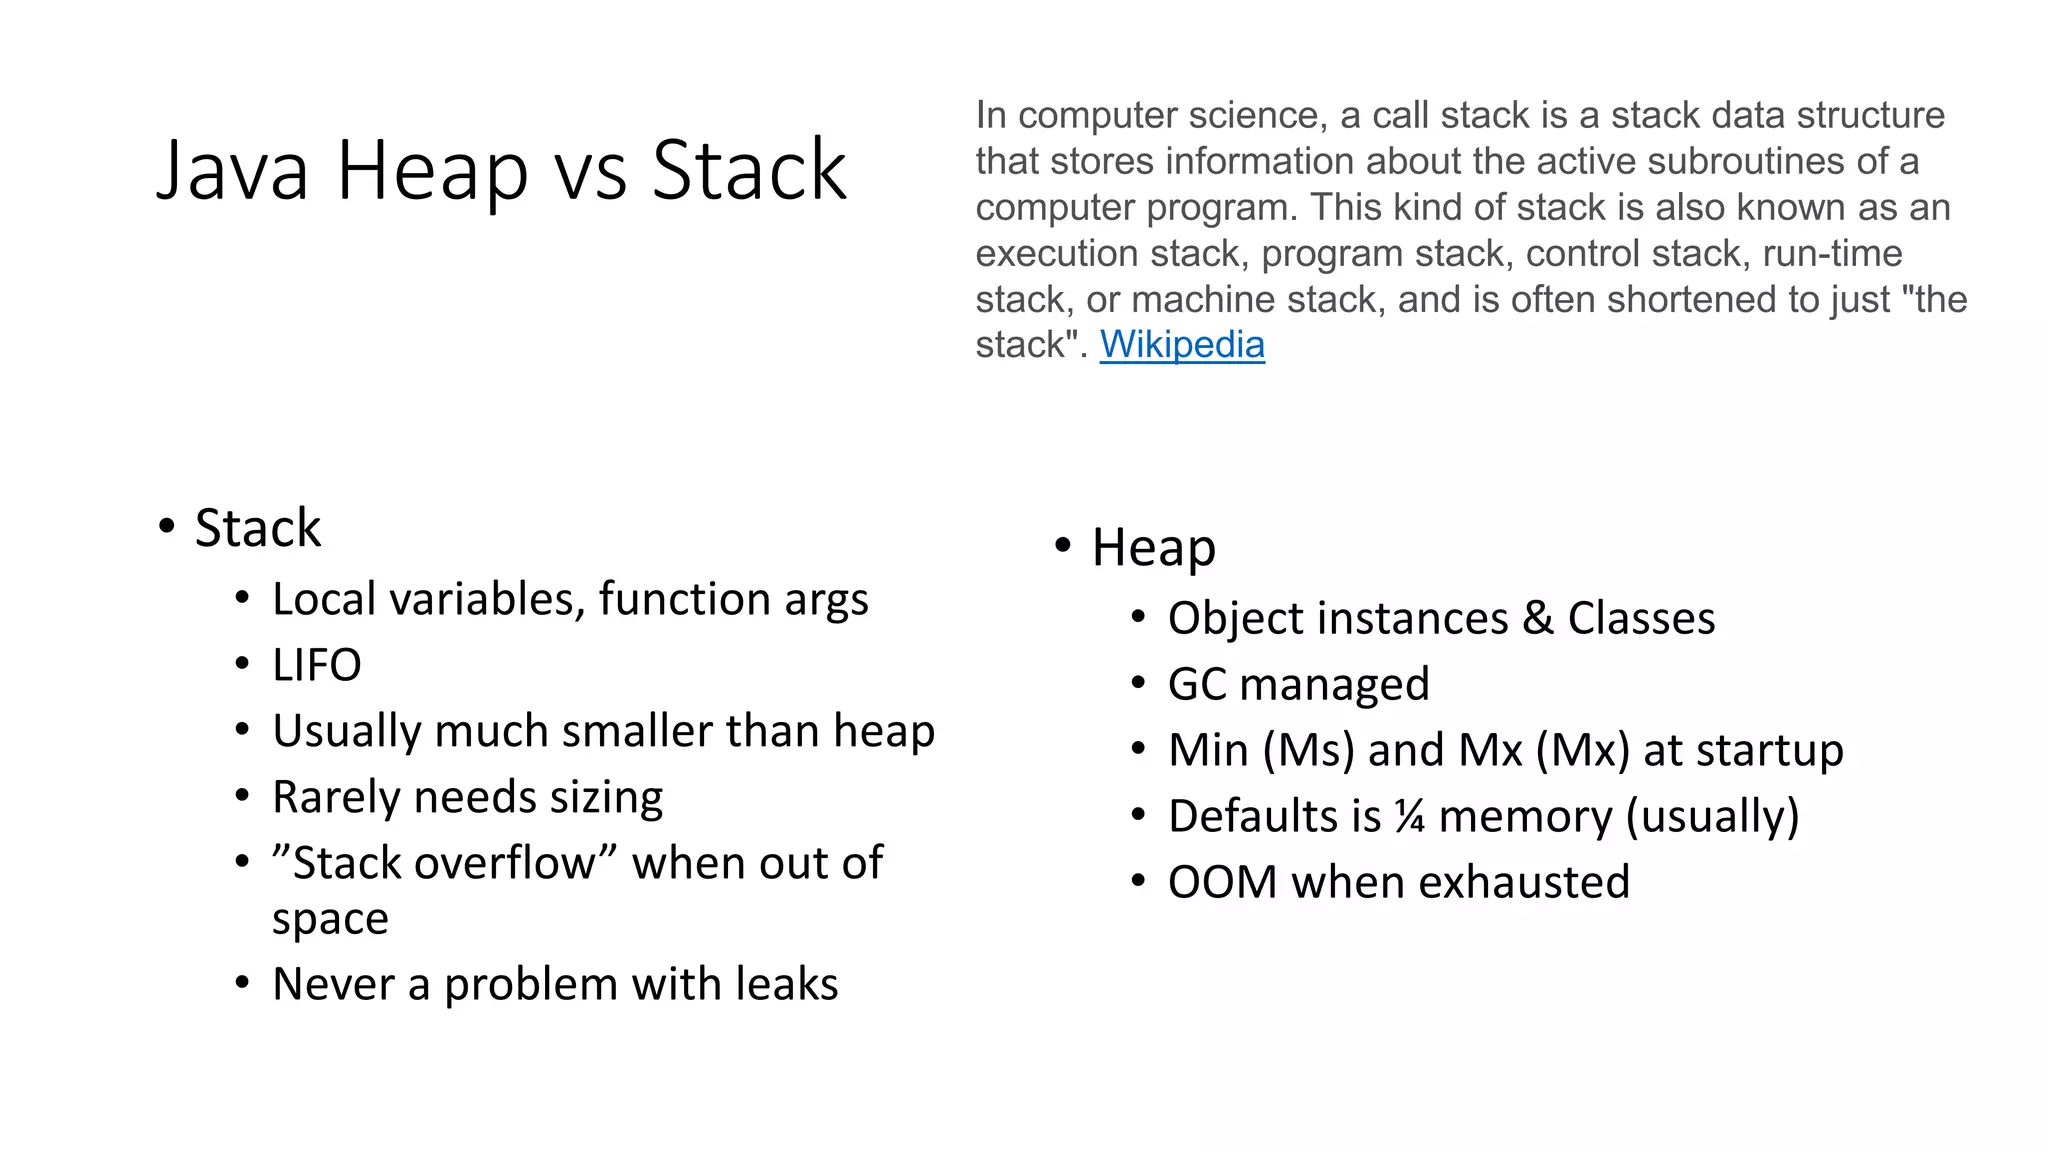
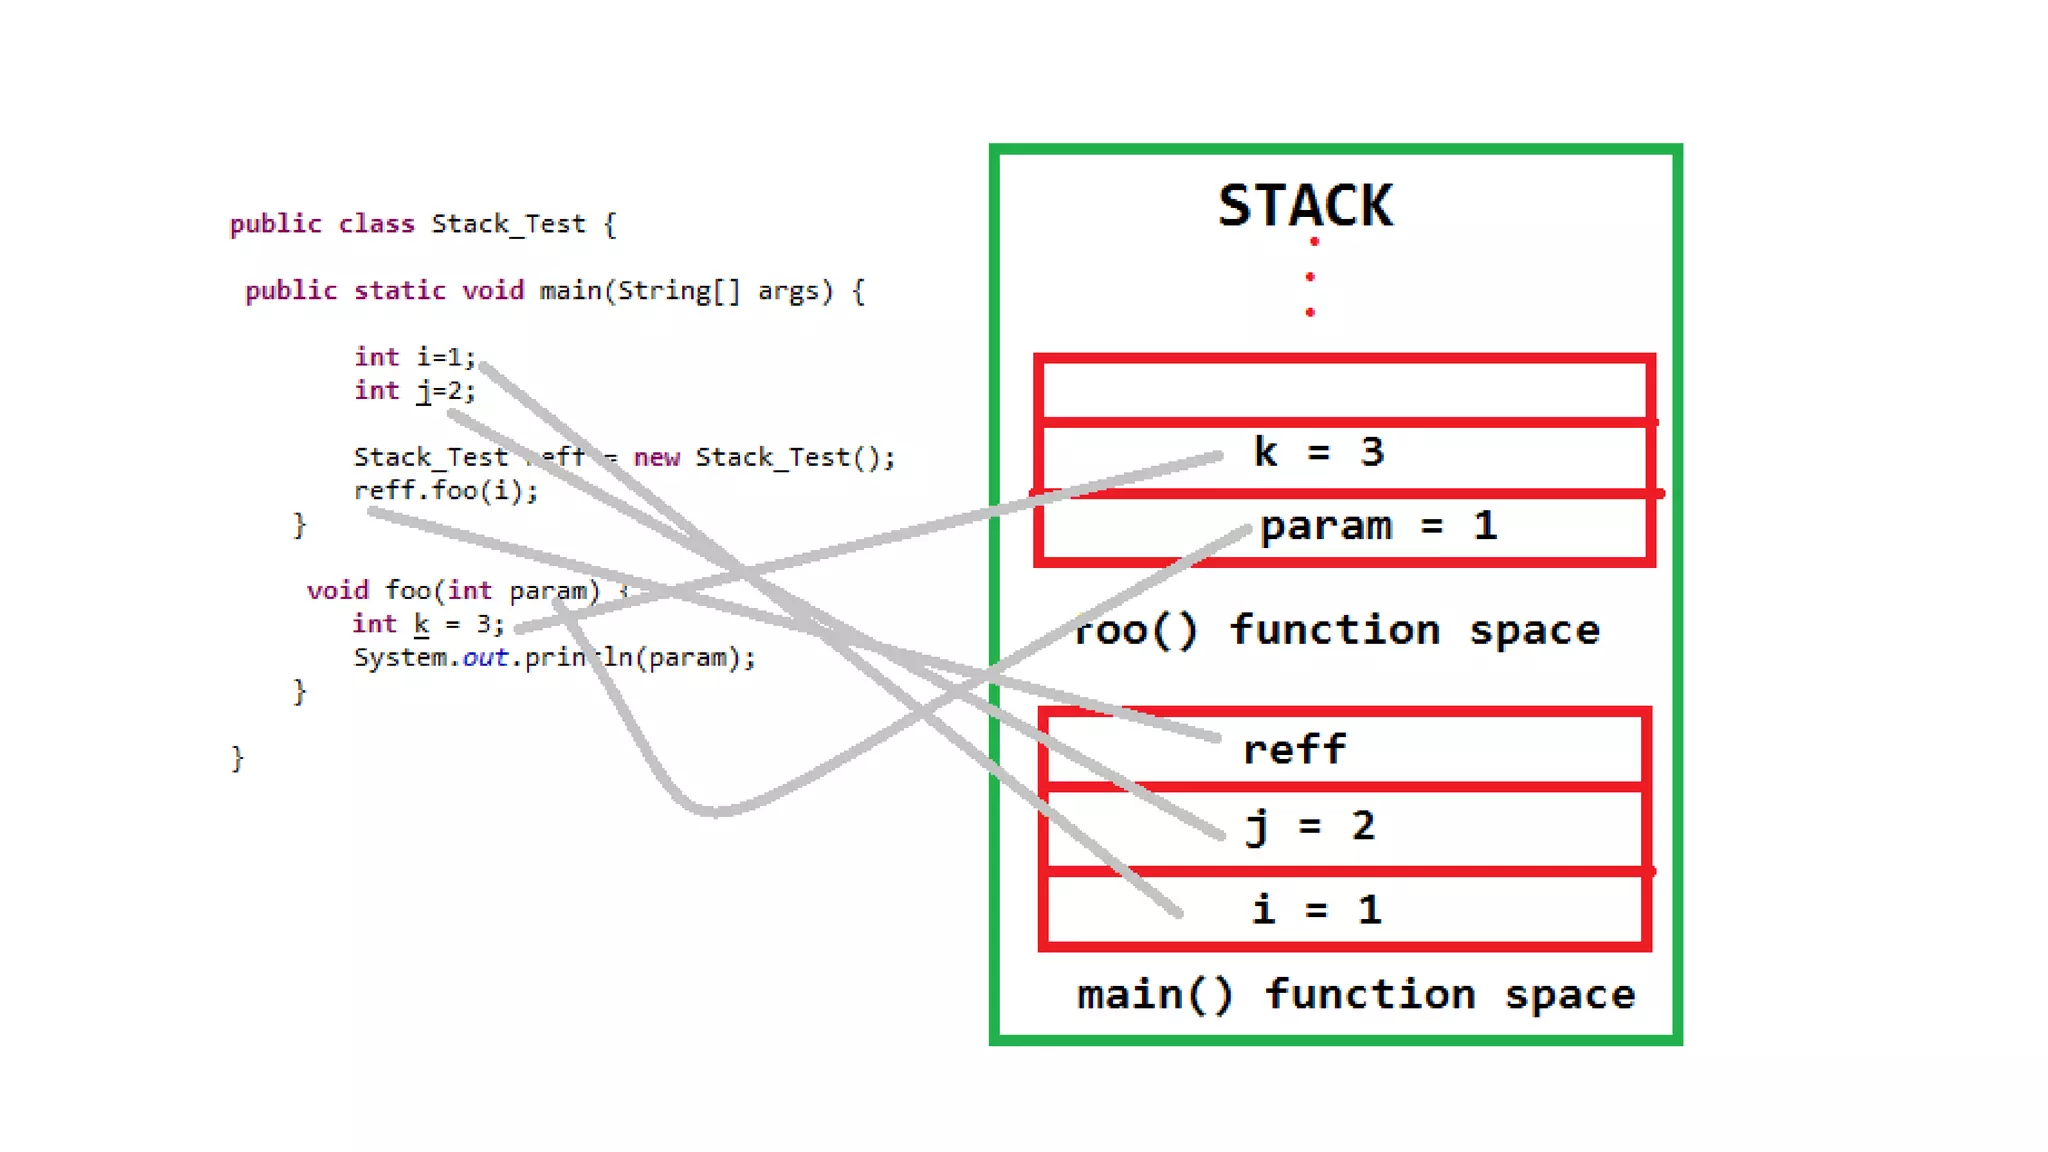
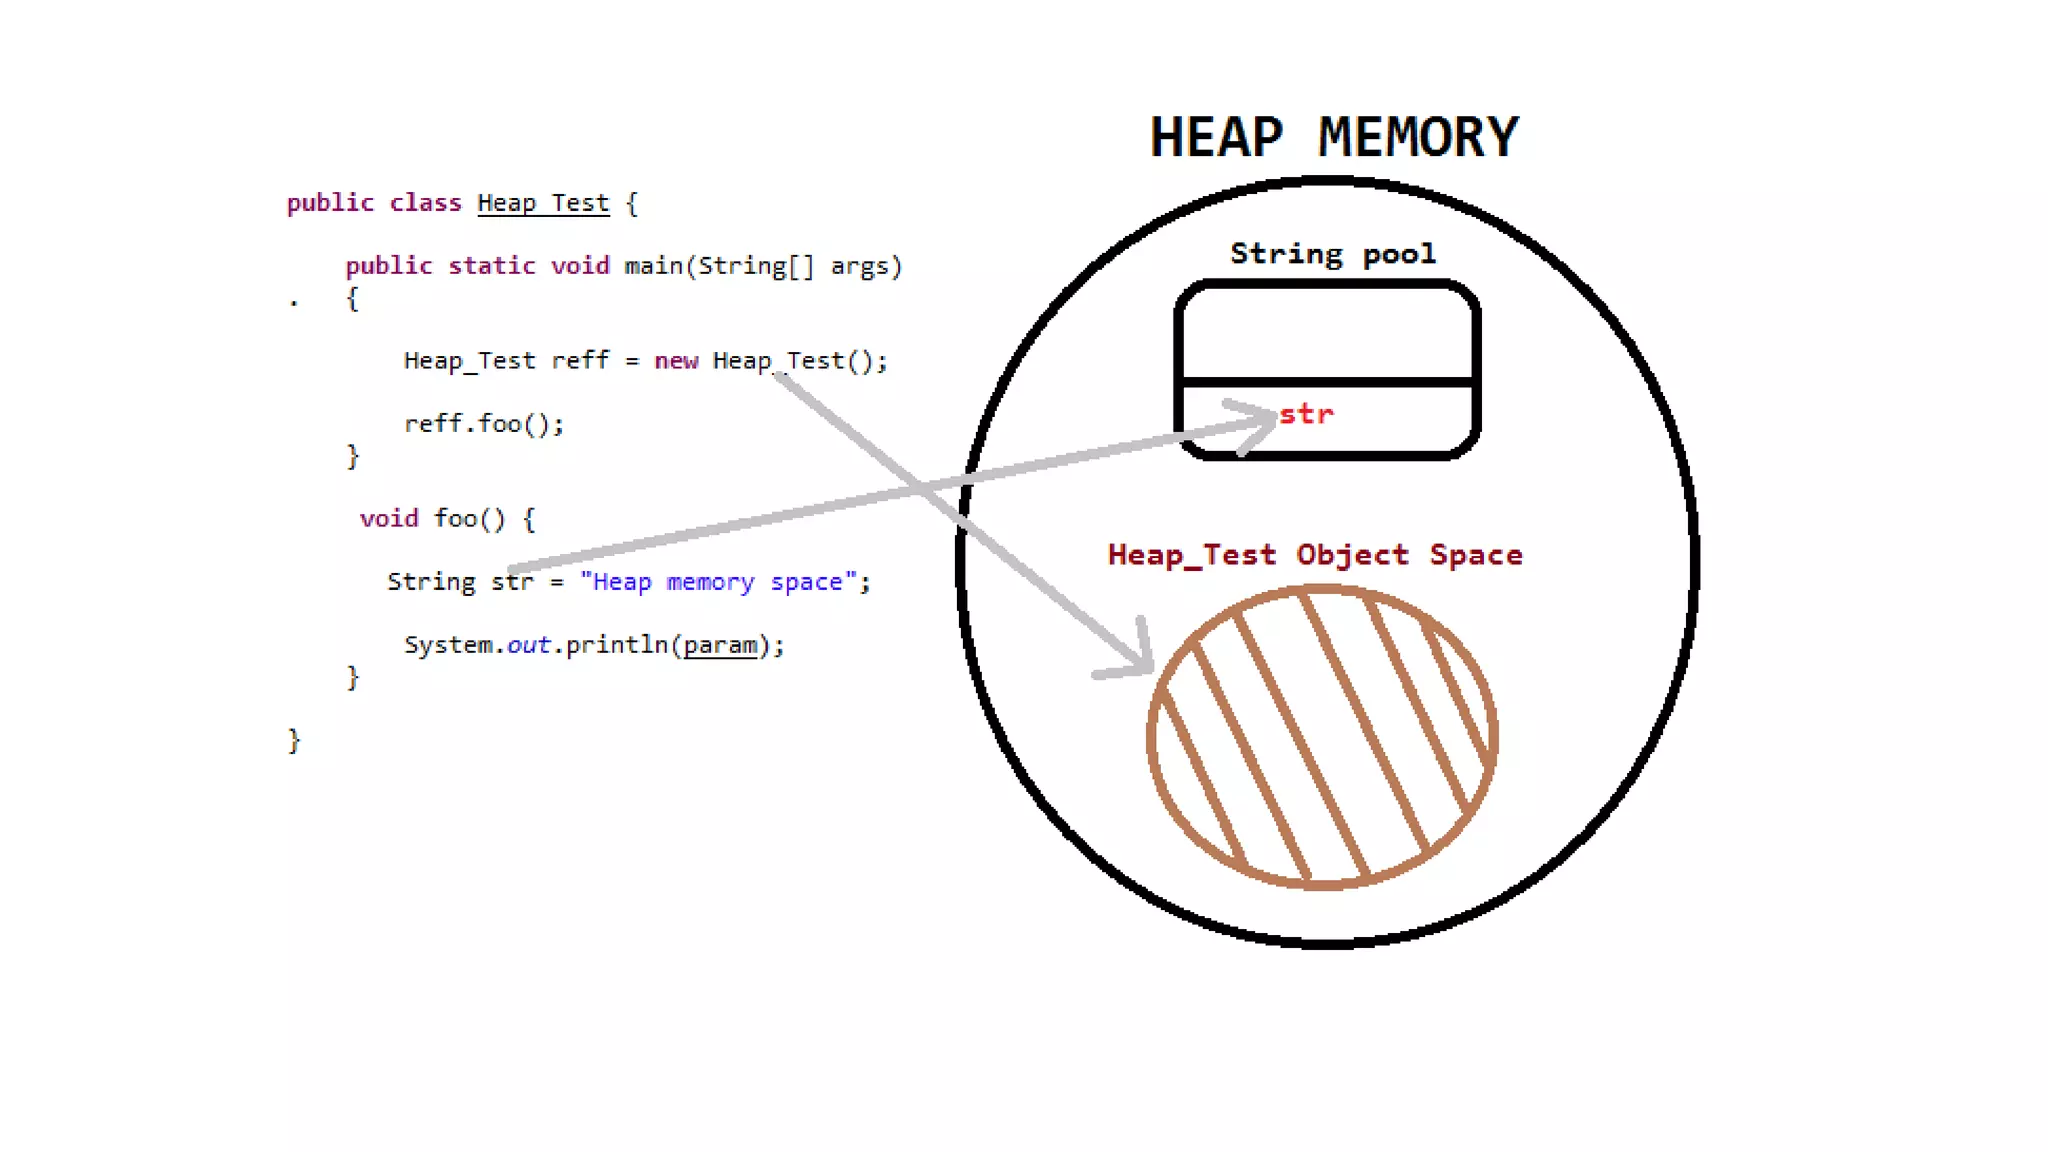
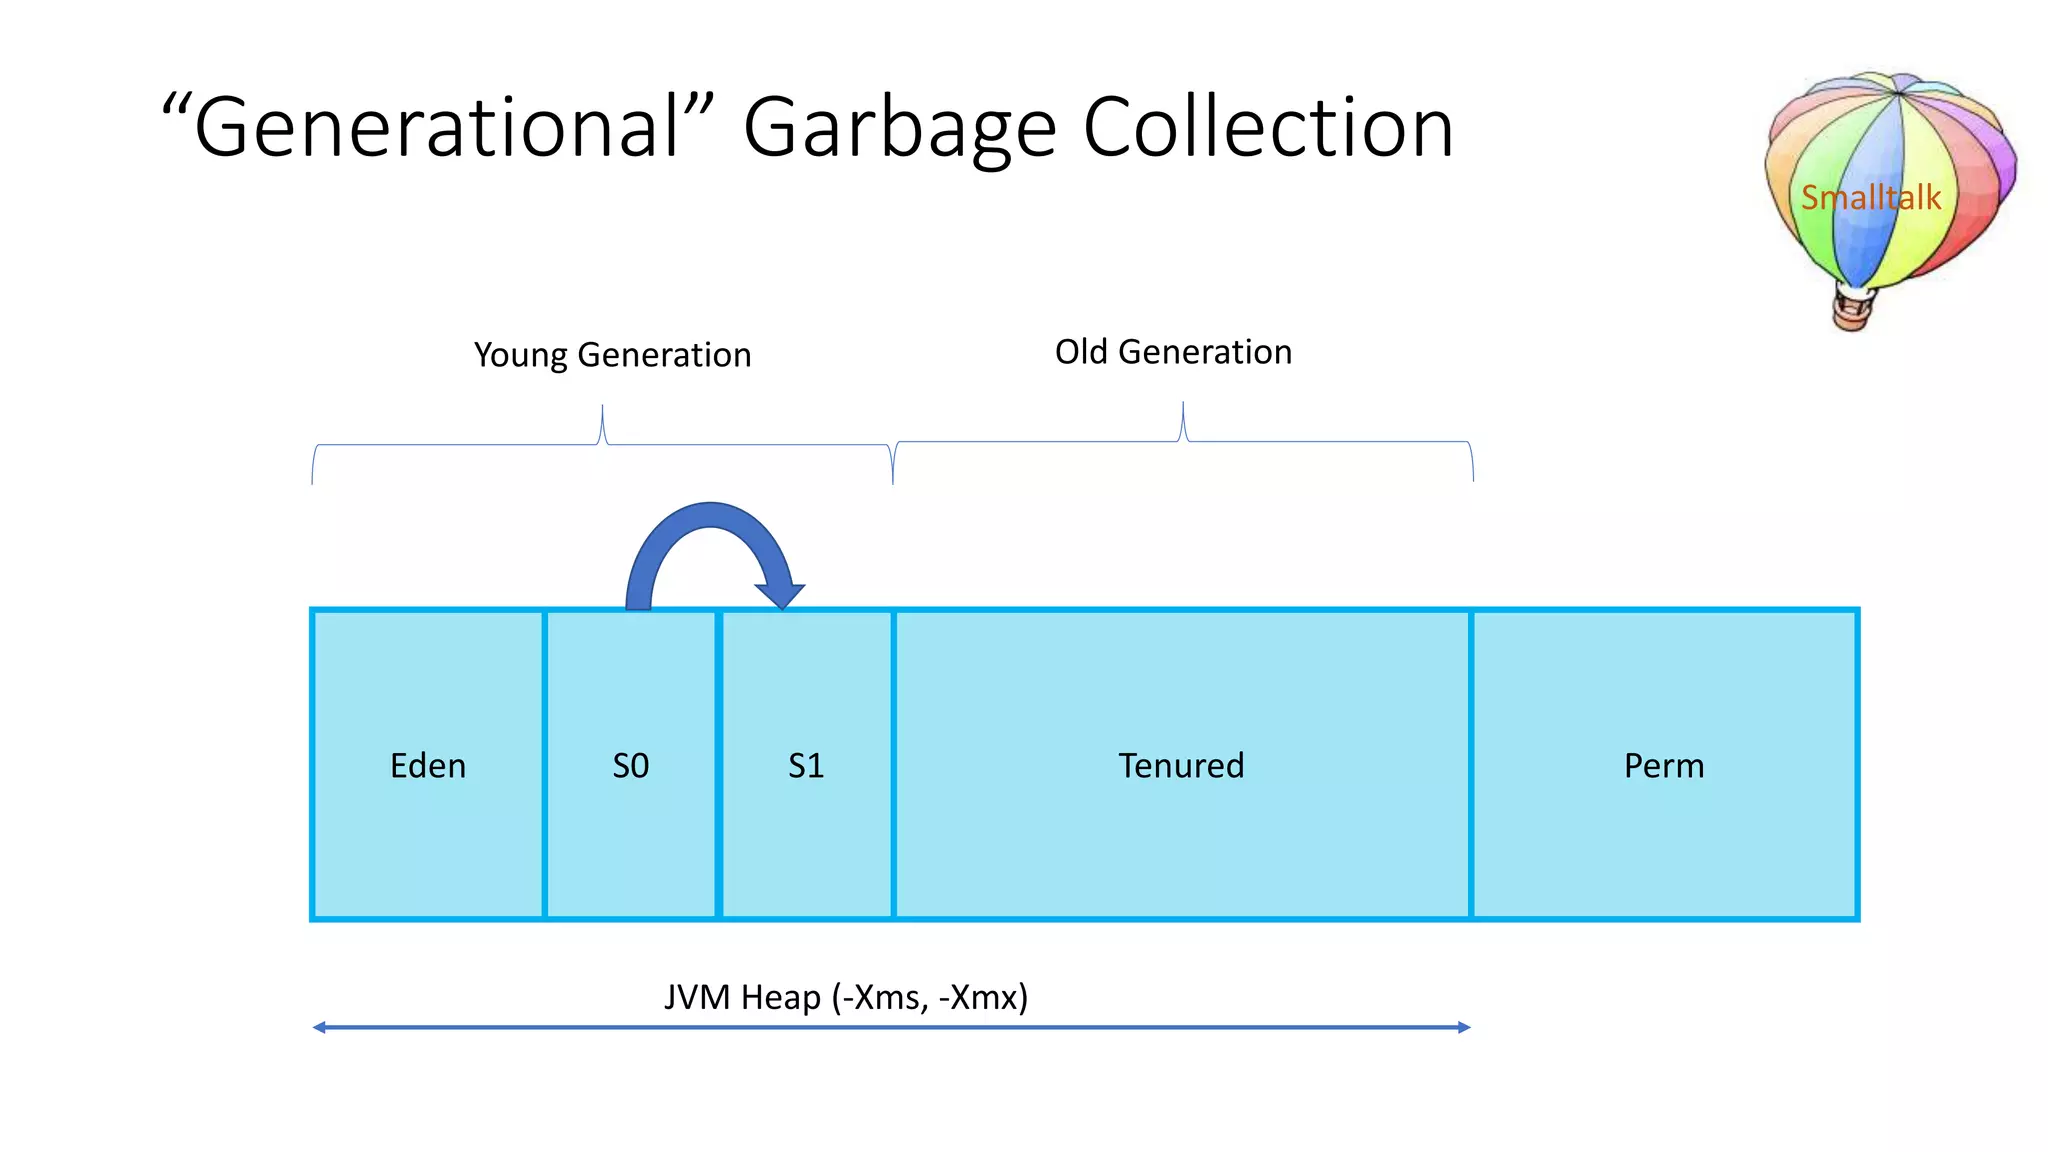
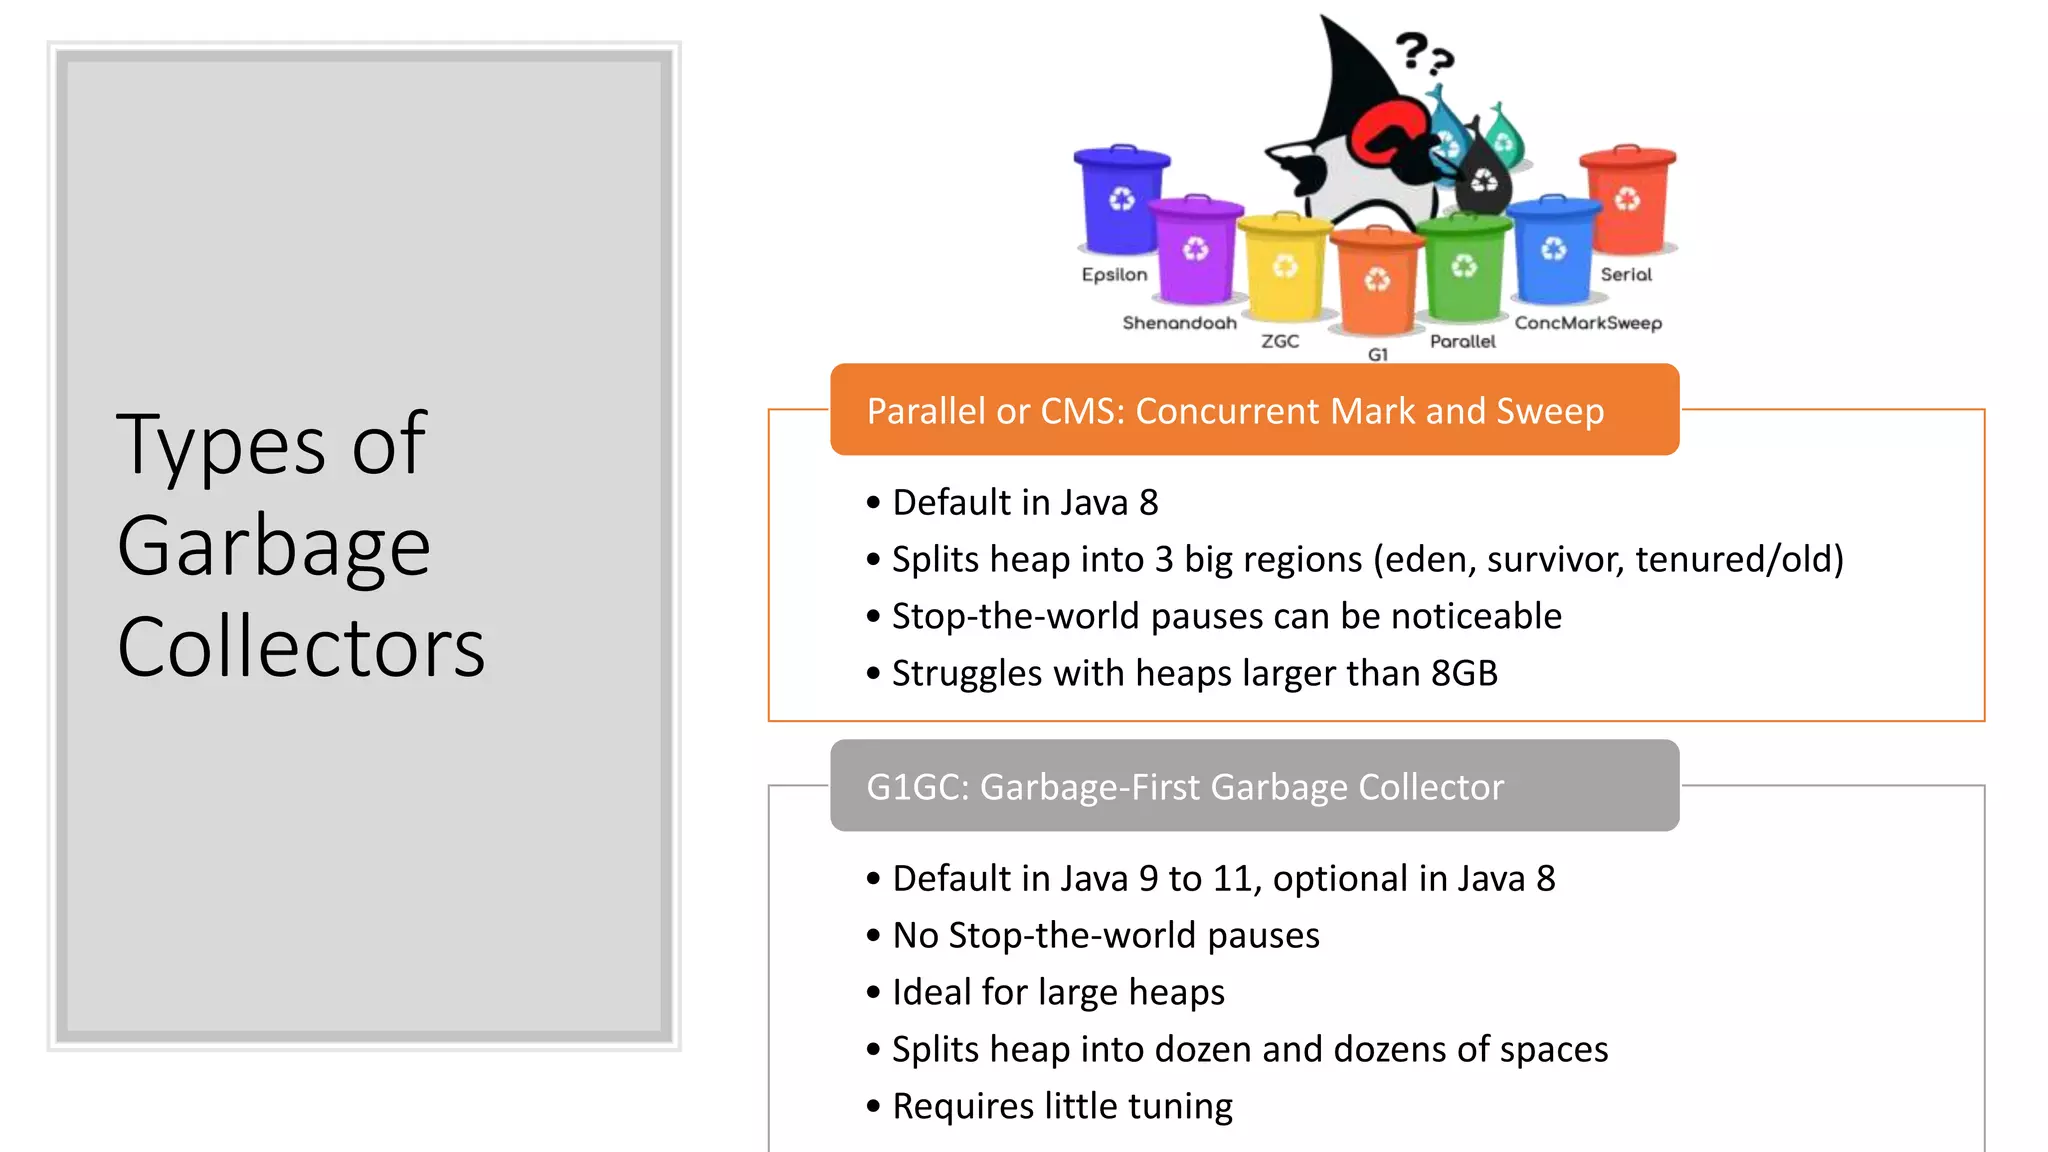
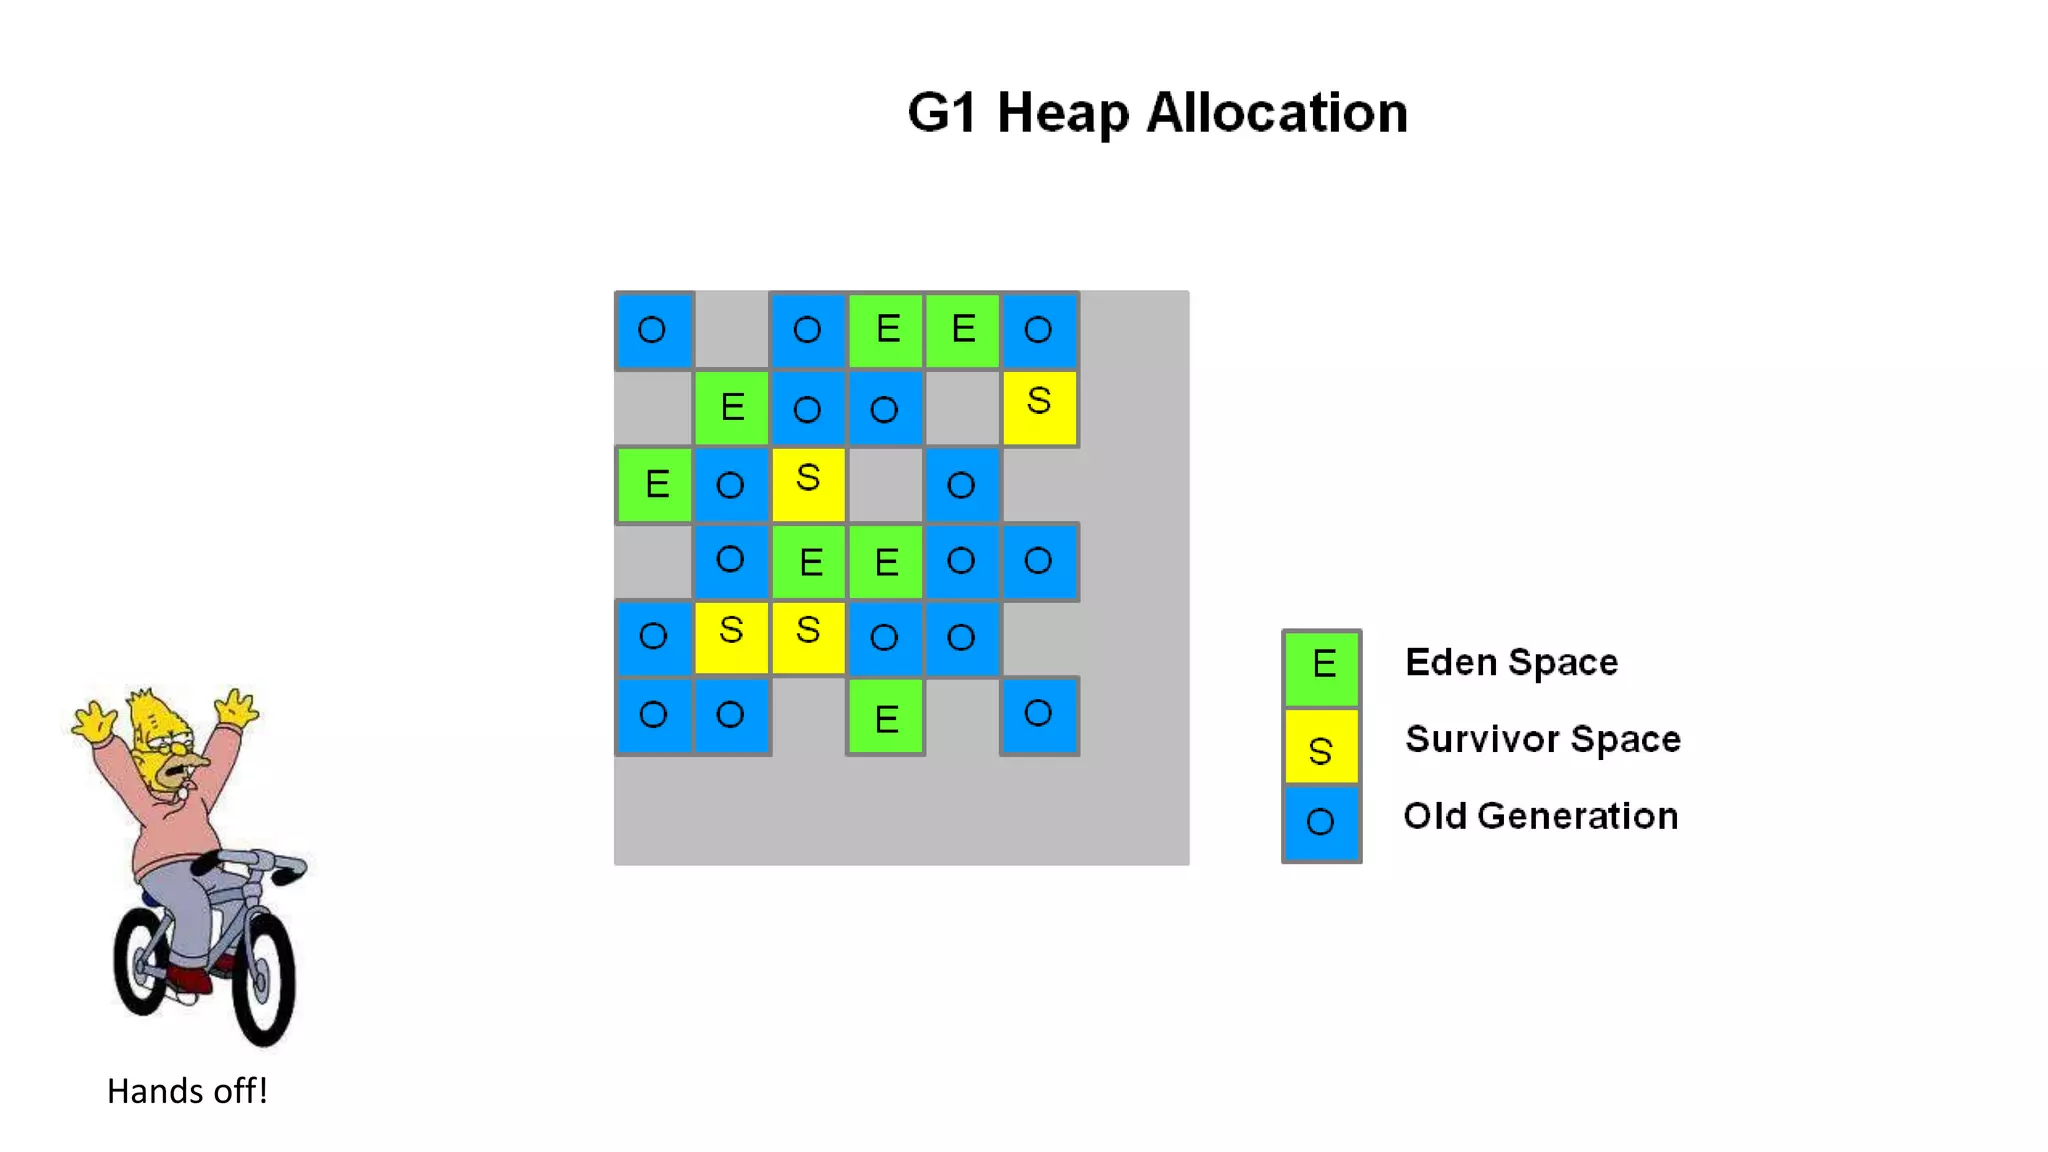
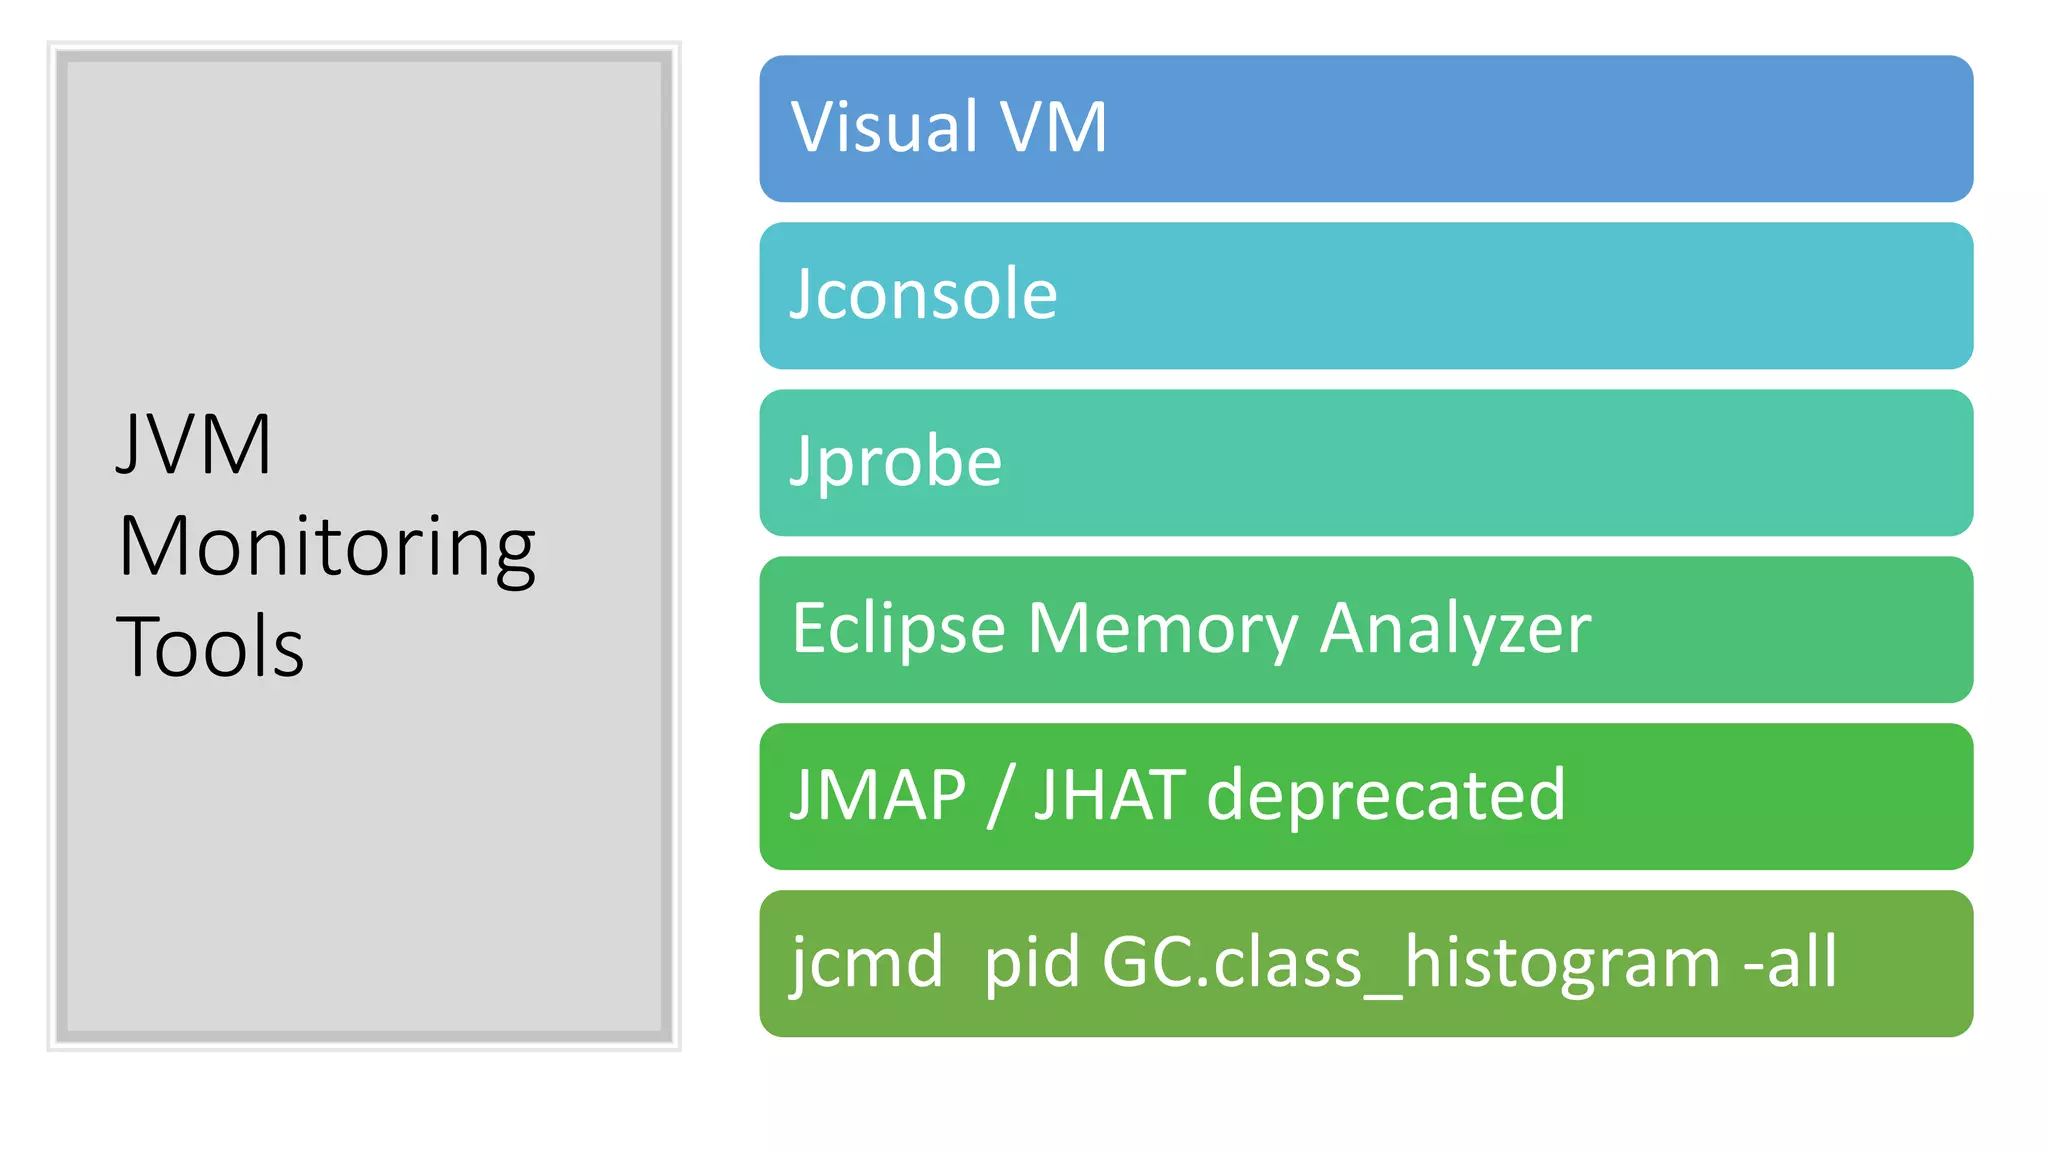
Visual VM, GC and the JVM Brad Schoening bschoeni@gmail.com
Java Heap vs Stack • Stack • Local variables, function args • LIFO • Usually much smaller than heap • Rarely needs sizing • ”Stack overflow” when out of space • Never a problem with leaks • Heap • Object instances & Classes • GC managed • Min (Ms) and Mx (Mx) at startup • Defaults is ¼ memory (usually) • OOM when exhausted In computer science, a call stack is a stack data structure that stores information about the active subroutines of a computer program. This kind of stack is also known as an execution stack, program stack, control stack, run-time stack, or machine stack, and is often shortened to just "the stack". Wikipedia
Eden S0 Tenured Perm S1 JVM Heap (-Xms, -Xmx) Young Generation Old Generation “Generational” Garbage Collection Smalltalk
Heap Size maximum heap size: • Smaller of 1/4th of the physical memory or 1GB • You can override this default using the -Xmx command-line option • Java compressedOOps • 32bits used w/heap < ~32GB • Use 31GB max for short pointers • See Why 35GB Heap is Less Than 32GB in https://blog.codecentric.de/en/2014/02/35gb-heap-less-32gb-java-jvm- memory-oddities/
Types of Garbage Collectors • Default in Java 8 • Splits heap into 3 big regions (eden, survivor, tenured/old) • Stop-the-world pauses can be noticeable • Struggles with heaps larger than 8GB Parallel or CMS: Concurrent Mark and Sweep • Default in Java 9 to 11, optional in Java 8 • No Stop-the-world pauses • Ideal for large heaps • Splits heap into dozen and dozens of spaces • Requires little tuning G1GC: Garbage-First Garbage Collector
Hands off!
Java Memory ‘leak’ • A Memory Leak in Java is when there are objects present in the heap that are no longer used, but the garbage collector is unable to remove them from memory and, thus they are unnecessarily maintained. • GC removes unreferenced objects periodically, but it never collects the objects that are still being referenced • Symptoms of a Memory Leak: • Application crashes • OutOfMemoryError error in the application log
JVM Monitoring Tools Visual VM Jconsole Jprobe Eclipse Memory Analyzer JMAP / JHAT deprecated jcmd pid GC.class_histogram -all

Java garbage collection, jvm, visual vm

  • 1.
    Visual VM, GC andthe JVM Brad Schoening bschoeni@gmail.com
  • 2.
    Java Heap vsStack • Stack • Local variables, function args • LIFO • Usually much smaller than heap • Rarely needs sizing • ”Stack overflow” when out of space • Never a problem with leaks • Heap • Object instances & Classes • GC managed • Min (Ms) and Mx (Mx) at startup • Defaults is ¼ memory (usually) • OOM when exhausted In computer science, a call stack is a stack data structure that stores information about the active subroutines of a computer program. This kind of stack is also known as an execution stack, program stack, control stack, run-time stack, or machine stack, and is often shortened to just "the stack". Wikipedia
  • 5.
    Eden S0 TenuredPerm S1 JVM Heap (-Xms, -Xmx) Young Generation Old Generation “Generational” Garbage Collection Smalltalk
  • 6.
    Heap Size maximum heapsize: • Smaller of 1/4th of the physical memory or 1GB • You can override this default using the -Xmx command-line option • Java compressedOOps • 32bits used w/heap < ~32GB • Use 31GB max for short pointers • See Why 35GB Heap is Less Than 32GB in https://blog.codecentric.de/en/2014/02/35gb-heap-less-32gb-java-jvm- memory-oddities/
  • 7.
    Types of Garbage Collectors • Defaultin Java 8 • Splits heap into 3 big regions (eden, survivor, tenured/old) • Stop-the-world pauses can be noticeable • Struggles with heaps larger than 8GB Parallel or CMS: Concurrent Mark and Sweep • Default in Java 9 to 11, optional in Java 8 • No Stop-the-world pauses • Ideal for large heaps • Splits heap into dozen and dozens of spaces • Requires little tuning G1GC: Garbage-First Garbage Collector
  • 8.
  • 9.
    Java Memory ‘leak’ •A Memory Leak in Java is when there are objects present in the heap that are no longer used, but the garbage collector is unable to remove them from memory and, thus they are unnecessarily maintained. • GC removes unreferenced objects periodically, but it never collects the objects that are still being referenced • Symptoms of a Memory Leak: • Application crashes • OutOfMemoryError error in the application log
  • 10.
    JVM Monitoring Tools Visual VM Jconsole Jprobe Eclipse MemoryAnalyzer JMAP / JHAT deprecated jcmd pid GC.class_histogram -all