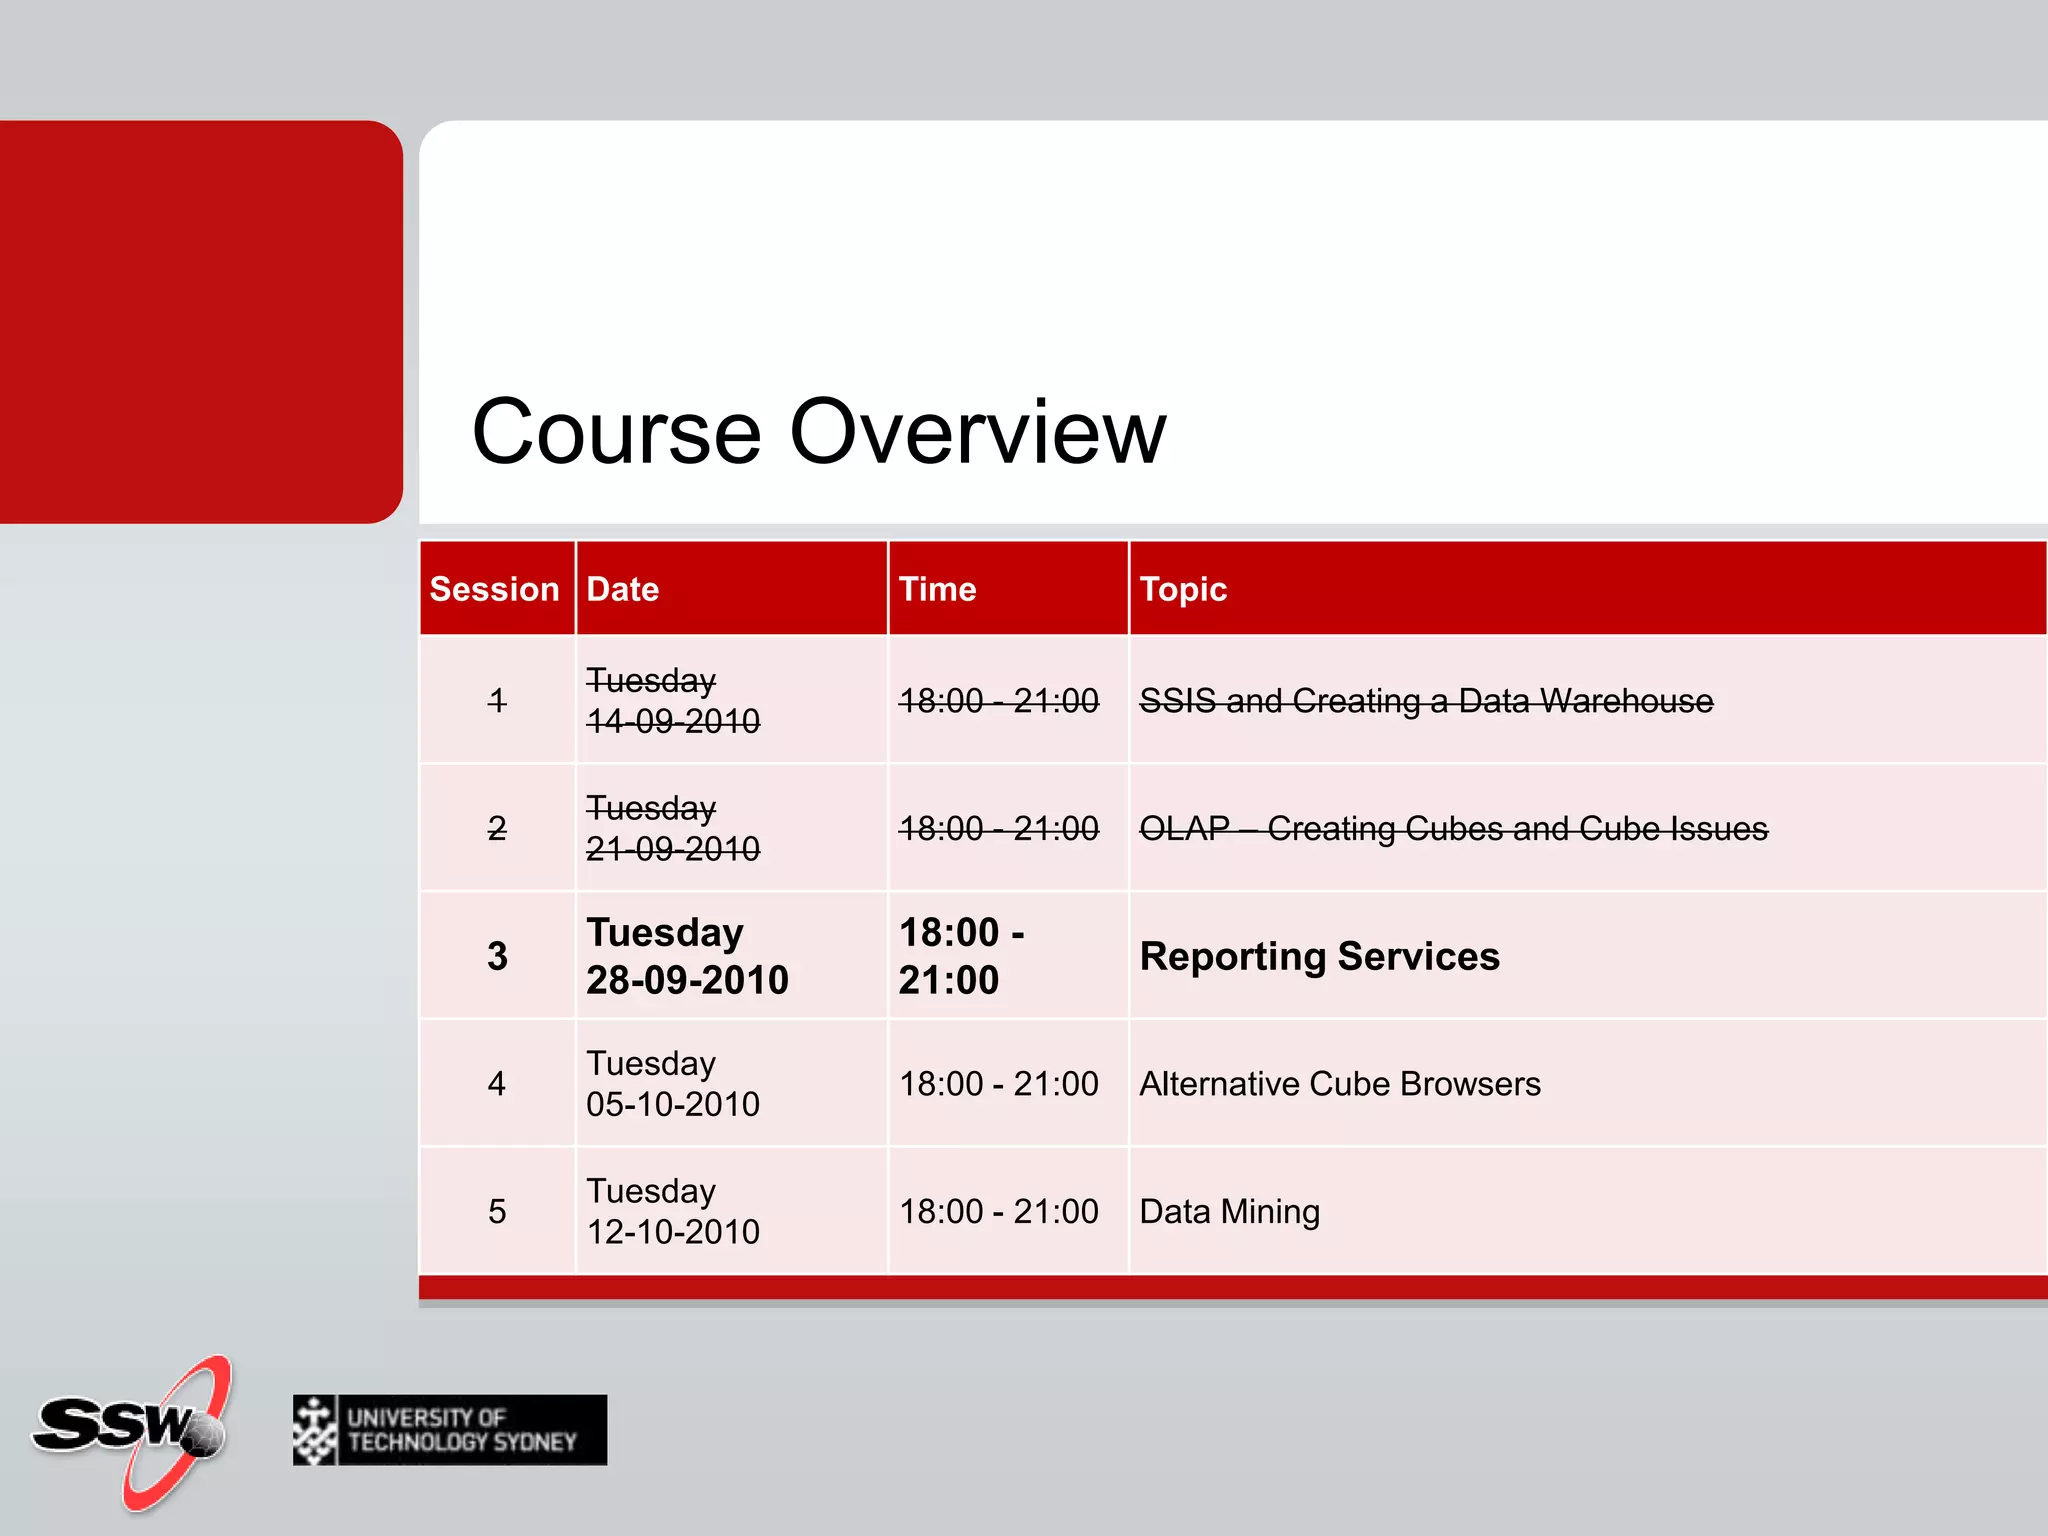
SQL Server 2008 for Business IntelligenceUTS Short Course
Peter GfaderSpecializes in C# and .NET (Java not anymore)TestingAutomated testsAgile, ScrumCertified Scrum TrainerTechnology aficionado SilverlightASP.NETWindows Forms
Admin StuffAttendanceYou initial sheetHands On LabYou get me to initial sheetHomeworkCertificate At end of 5 sessionsIf I say if you have completed successfully 
Course WebsiteCourse Timetable & Materialshttp://www.ssw.com.au/ssw/Events/2010UTSSQL/Resourceshttp://sharepoint.ssw.com.au/Training/UTSSQL/
Course Overview
Last week(s)CubesWhat is a cube?Measures/Facts?Dimensions?Hierarchies?Time Dimensions?Cube Browser?Why?
Where does the cube live?Why do we need to provide "Impersonation Information" in our Data Source?What is a dimension hierarchy?Homework
Session 3: Tonight’s AgendaWhat is SQL Reporting Services?Steps in Creating a ReportDemo: Creating a ReportHands on Lab
Why are we doing this?
Business Intelligence DefinedBusiness intelligence (BI) is a broad category of applications and technologies for gathering, storing, analyzing, and providing access to data to help enterprise users make better business decisions.Answer questions
The plan
Step by step to BICreate Data WarehouseCopy data to data warehouse Create OLAP CubesCreate ReportsDo some Data MiningDiscovering a Relationship that was not obviousPredict future events (e.g. targeting and forecasting)
SSRS
What is SQL Server Reporting?Reporting platform Traditional Interactive reports Scalable and manageable server infrastructureIntegrated with SharePointOffice applicationsBrowser and other familiar tools Single platform and tools for all types of structured data RelationalHierarchicalMultidimensional
SQL Server BI PlatformReporting ServicesManagement ToolsDevelopment ToolsAnalysis ServicesOLAP & Data MiningIntegrationServicesETLSQL ServerRelational Engine
ManagementDeliveryAuthoringReporting LifecycleReporting Services is an open and extensible platform supporting the authoring, management and delivery of rich, interactive reports to the entire enterprise.
Report Authoring
Report AuthoringReports are defined in Report Definition Language (RDL), a documented XML schemaUse Microsoft or 3rd party tools that support RDL Create single reports from multiple data sources(SQL, OLE DB, ODBC, Oracle, and .NET data providers)More info on the RDL spec: www.microsoft.com/sql/reporting
Report Authoring - ControlsData regionsTablix (New in SQL 2008) TableList (like Access)MatrixChartGaugeSubreportsImagesCustom Controls
TablixGeneralized layout report itemGrouped and Detail data
Tablix - TableUse a table to display detail dataOrganize the data in row groups, or both. The Table template contains three columns with a table header row and a details row for data.
Tablix - MatrixUse a matrix to display aggregated data summariesGrouped in rows and columns, similar to a PivotTable or crosstab. The number of rows and columns for groups is determined by the number of unique values for each row and column groups
Tablix - ListUse a list to create a free-form layout. You are not limited to a grid layout, but can place fields freely inside the list. You can use a list to design a form for displaying many dataset fields or as a container to display multiple data regions side by side for grouped data.
Charts
Charts
Charts
Gauge
Interactive reports
Drill-through ReportsStart in Report Builder Get the data you want In report properties choose Allow users to drill to this report option Optionally customize in Report Designer
Document mapsCollapse / ExpandActionsInteractivity
Report Management
Report ManagementReport definitions, folders, and resources are published and managed in a reporting web serviceManaged reports can be executed either on-demand or via schedule and can be cached for consistency and performanceScalable & Extensible server architecture
SQL Server Reporting Architecture
Report Manager
Configuration Manager
Report Delivery
Report DeliveryTraditional (paper) and interactive (web) reportsOn-demand (“pull”) or event-based (“push”) deliveryChoose from multiple formats (HTML, Excel, PDF, XML, Word)Deliver reports to many devices (e-mail, file share, etc.)Ad-hoc Reporting
SSRS and SSAS – Working TogetherStandard reportsAd hoc reportsDetail reportsSSASSSRSIntuitive reporting
Interactive analysis
High performance
Powerful calculations
Detail reporting
Standard reporting
Ad hoc reporting
Flexible deliverySSAS and Reporting ServicesData LayerSSASPresentation LayerUnifiedDimensionalModelETLDB1Interactive reportingUDMDB2DWStandard reportingDB3multiple data sources supportedAd hoc reportingDimensional schema = intuitive reporting
SSAS for better performance and business metrics
UDM serves many reporting needsReport Builder
Report Builder v2
It’s fantastic but….It doesn’t ship with SQL 2008It is part of SP1http://www.microsoft.com/downloads/details.aspx?familyid=DBDDC9B6-6E19-4D4B-9309-13F62901B0D5&displaylang=en
Report Builder v3Only for SQL Server R2http://www.microsoft.com/downloads/en/details.aspx?FamilyID=d3173a87-7c0d-40cc-a408-3d1a43ae4e33&displaylang=en
Report generation
Server side
Server side

Reports with SQL Server Reporting Services

  • 1.
    SQL Server 2008for Business IntelligenceUTS Short Course
  • 2.
    Peter GfaderSpecializes inC# and .NET (Java not anymore)TestingAutomated testsAgile, ScrumCertified Scrum TrainerTechnology aficionado SilverlightASP.NETWindows Forms
  • 3.
    Admin StuffAttendanceYou initialsheetHands On LabYou get me to initial sheetHomeworkCertificate At end of 5 sessionsIf I say if you have completed successfully 
  • 4.
    Course WebsiteCourse Timetable& Materialshttp://www.ssw.com.au/ssw/Events/2010UTSSQL/Resourceshttp://sharepoint.ssw.com.au/Training/UTSSQL/
  • 5.
  • 6.
    Last week(s)CubesWhat isa cube?Measures/Facts?Dimensions?Hierarchies?Time Dimensions?Cube Browser?Why?
  • 7.
    Where does thecube live?Why do we need to provide "Impersonation Information" in our Data Source?What is a dimension hierarchy?Homework
  • 8.
    Session 3: Tonight’sAgendaWhat is SQL Reporting Services?Steps in Creating a ReportDemo: Creating a ReportHands on Lab
  • 9.
    Why are wedoing this?
  • 10.
    Business Intelligence DefinedBusinessintelligence (BI) is a broad category of applications and technologies for gathering, storing, analyzing, and providing access to data to help enterprise users make better business decisions.Answer questions
  • 11.
  • 12.
    Step by stepto BICreate Data WarehouseCopy data to data warehouse Create OLAP CubesCreate ReportsDo some Data MiningDiscovering a Relationship that was not obviousPredict future events (e.g. targeting and forecasting)
  • 13.
  • 14.
    What is SQLServer Reporting?Reporting platform Traditional Interactive reports Scalable and manageable server infrastructureIntegrated with SharePointOffice applicationsBrowser and other familiar tools Single platform and tools for all types of structured data RelationalHierarchicalMultidimensional
  • 15.
    SQL Server BIPlatformReporting ServicesManagement ToolsDevelopment ToolsAnalysis ServicesOLAP & Data MiningIntegrationServicesETLSQL ServerRelational Engine
  • 16.
    ManagementDeliveryAuthoringReporting LifecycleReporting Servicesis an open and extensible platform supporting the authoring, management and delivery of rich, interactive reports to the entire enterprise.
  • 17.
  • 18.
    Report AuthoringReports aredefined in Report Definition Language (RDL), a documented XML schemaUse Microsoft or 3rd party tools that support RDL Create single reports from multiple data sources(SQL, OLE DB, ODBC, Oracle, and .NET data providers)More info on the RDL spec: www.microsoft.com/sql/reporting
  • 19.
    Report Authoring -ControlsData regionsTablix (New in SQL 2008) TableList (like Access)MatrixChartGaugeSubreportsImagesCustom Controls
  • 20.
    TablixGeneralized layout reportitemGrouped and Detail data
  • 21.
    Tablix - TableUsea table to display detail dataOrganize the data in row groups, or both. The Table template contains three columns with a table header row and a details row for data.
  • 22.
    Tablix - MatrixUsea matrix to display aggregated data summariesGrouped in rows and columns, similar to a PivotTable or crosstab. The number of rows and columns for groups is determined by the number of unique values for each row and column groups
  • 23.
    Tablix - ListUsea list to create a free-form layout. You are not limited to a grid layout, but can place fields freely inside the list. You can use a list to design a form for displaying many dataset fields or as a container to display multiple data regions side by side for grouped data.
  • 24.
  • 25.
  • 26.
  • 27.
  • 28.
  • 29.
    Drill-through ReportsStart inReport Builder Get the data you want In report properties choose Allow users to drill to this report option Optionally customize in Report Designer
  • 30.
    Document mapsCollapse /ExpandActionsInteractivity
  • 31.
  • 32.
    Report ManagementReport definitions,folders, and resources are published and managed in a reporting web serviceManaged reports can be executed either on-demand or via schedule and can be cached for consistency and performanceScalable & Extensible server architecture
  • 33.
  • 34.
  • 35.
  • 36.
  • 37.
    Report DeliveryTraditional (paper)and interactive (web) reportsOn-demand (“pull”) or event-based (“push”) deliveryChoose from multiple formats (HTML, Excel, PDF, XML, Word)Deliver reports to many devices (e-mail, file share, etc.)Ad-hoc Reporting
  • 38.
    SSRS and SSAS– Working TogetherStandard reportsAd hoc reportsDetail reportsSSASSSRSIntuitive reporting
  • 39.
  • 40.
  • 41.
  • 42.
  • 43.
  • 44.
  • 45.
    Flexible deliverySSAS andReporting ServicesData LayerSSASPresentation LayerUnifiedDimensionalModelETLDB1Interactive reportingUDMDB2DWStandard reportingDB3multiple data sources supportedAd hoc reportingDimensional schema = intuitive reporting
  • 46.
    SSAS for betterperformance and business metrics
  • 47.
    UDM serves manyreporting needsReport Builder
  • 48.
  • 49.
    It’s fantastic but….Itdoesn’t ship with SQL 2008It is part of SP1http://www.microsoft.com/downloads/details.aspx?familyid=DBDDC9B6-6E19-4D4B-9309-13F62901B0D5&displaylang=en
  • 50.
    Report Builder v3Onlyfor SQL Server R2http://www.microsoft.com/downloads/en/details.aspx?FamilyID=d3173a87-7c0d-40cc-a408-3d1a43ae4e33&displaylang=en
  • 51.
  • 52.
  • 53.
  • 54.
    Reportviewer Control in"local mode"ASP.NETWindows FormsSilverlightWPFClient side
  • 55.
  • 56.
    All about theReportViewer controlhttp://www.gotreportviewer.com/Community site with reports to learn fromhttp://www.reportsurfer.com/Resources
  • 57.
    SQL Server UG6/10/2010 - lunch time - CityDelivering BI to the Masses at Microsoft Using CBI (Consolidated BI) Top 10 Challenges (Sanjay Soni)http://www.sqlserver.org.au/Usergroups
  • 58.
    SummaryWhat is ReportingServices?Steps in Creating a ReportDemo: Creating a ReportHands on Labhttp://www.ssw.com.au/ssw/Standards/Rules/RulesToBetterSQLReportingServices.aspx
  • 59.
  • 60.
    Thank You!Gateway CourtSuite 10 81 - 91 Military Road Neutral Bay, Sydney NSW 2089 AUSTRALIA ABN: 21 069 371 900 Phone: + 61 2 9953 3000 Fax: + 61 2 9953 3105 info@ssw.com.auwww.ssw.com.au

Editor's Notes

  • #2 Click to add notesPeter Gfader shows SQL Server
  • #3 Java current version 1.6 Update 171.7 released next year 2010Dynamic languages Parallel computingMaybe closures
  • #54 Click to add notesPeter Gfader shows SQL Server