Download as PDF, PPTX


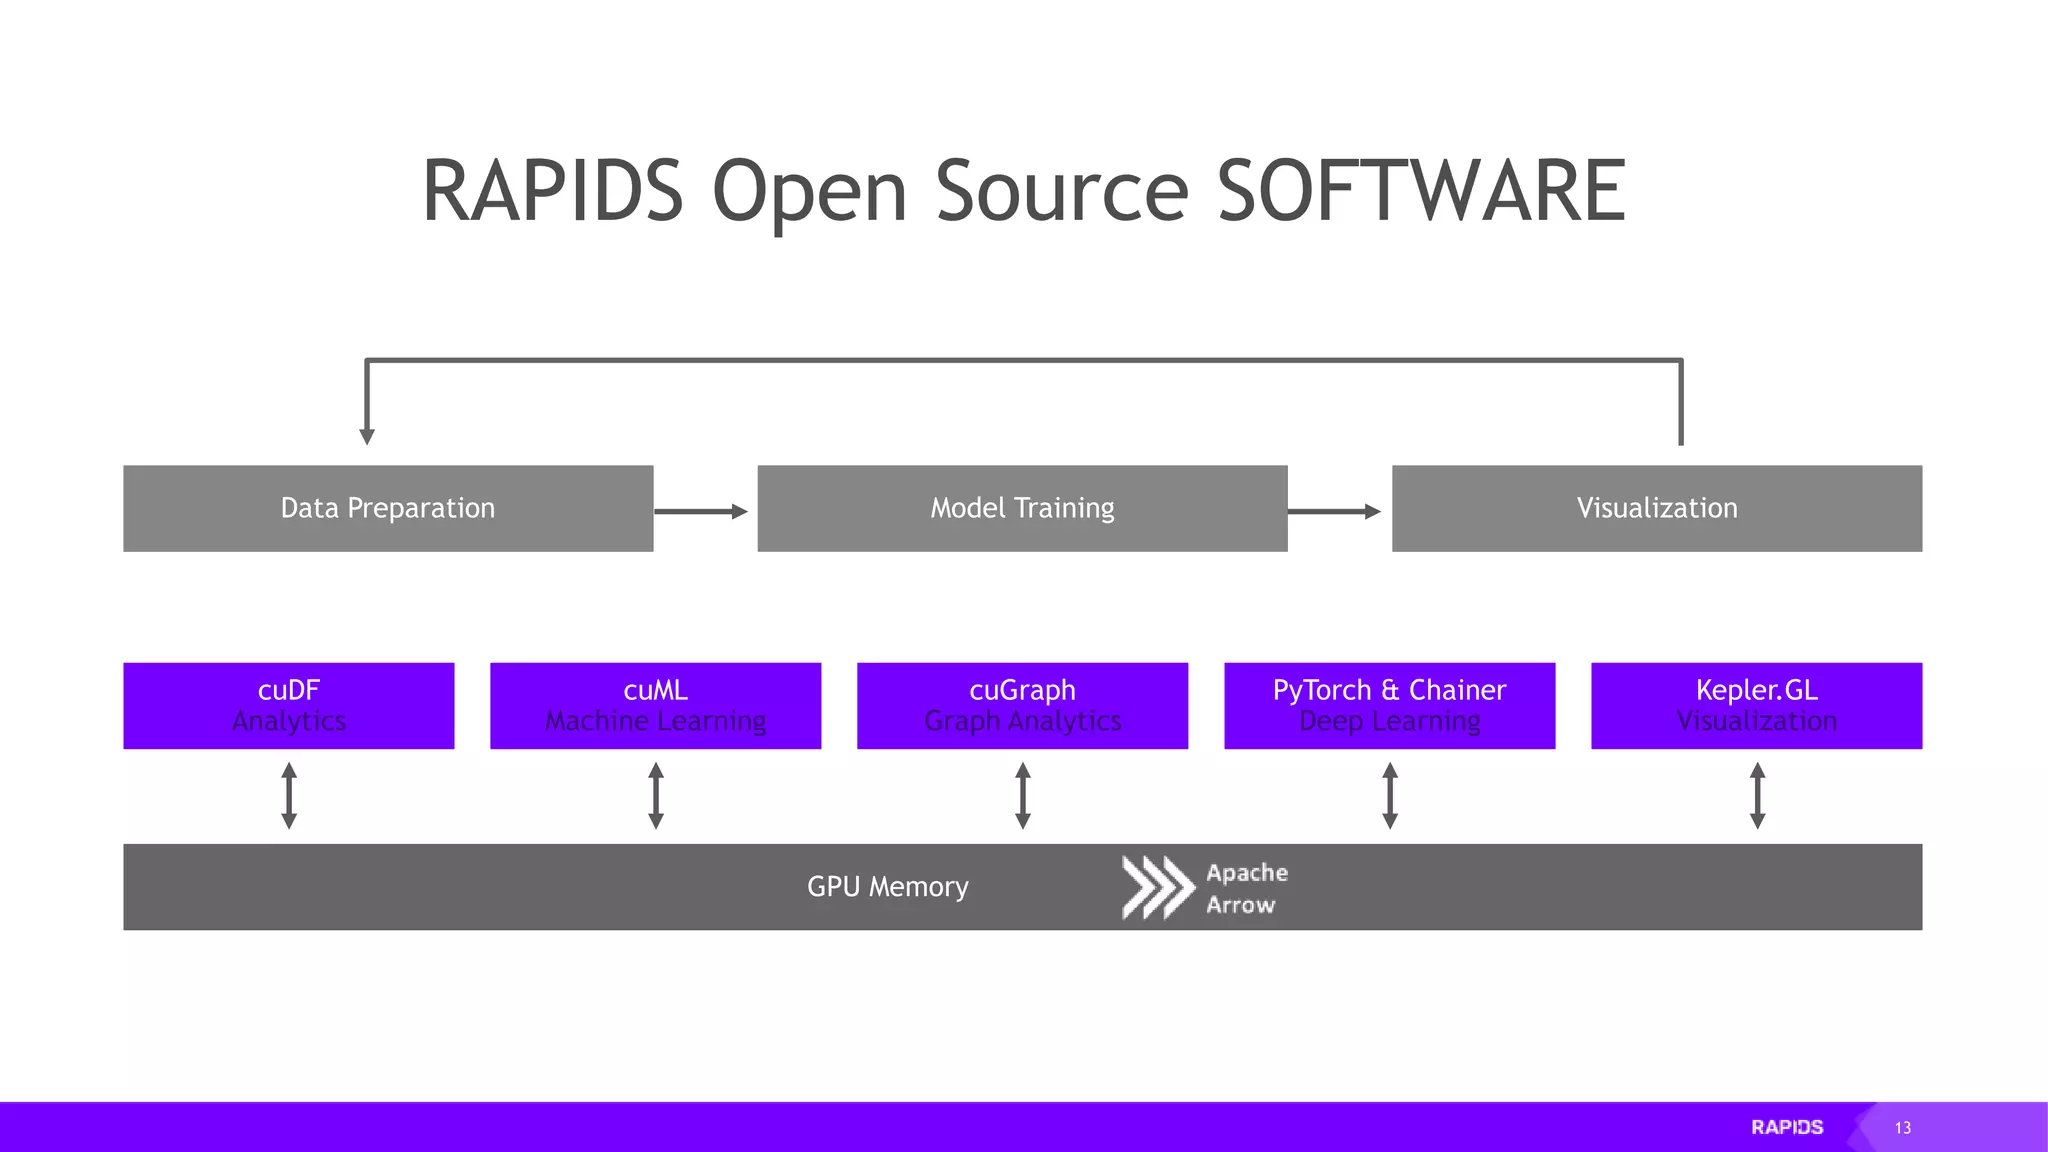

![20 RAPIDS: OPEN GPU DATA SCIENCE Following the Pandas API for optimal code reuse Data Preparation VisualizationModel Training CUDA PYTHON DASK DL FRAMEWORKS CUDNN RAPIDS CUMLCUDF CUGRAPH APACHE ARROW Pandas-like import pandas as pd import cudf … df = pd.read_csv('foo.csv', names=['index', 'A'], dtype=['date', 'float64']) gdf = cudf.read_csv('foo.csv', names=['index', 'A'], dtype=['date', 'float64’]) … # eventually majority of pandas features will be available in cudf](https://image.slidesharecdn.com/mddatasciencemeetuprapids-190316025246/75/RAPIDS-Open-GPU-accelerated-Data-Science-20-2048.jpg)
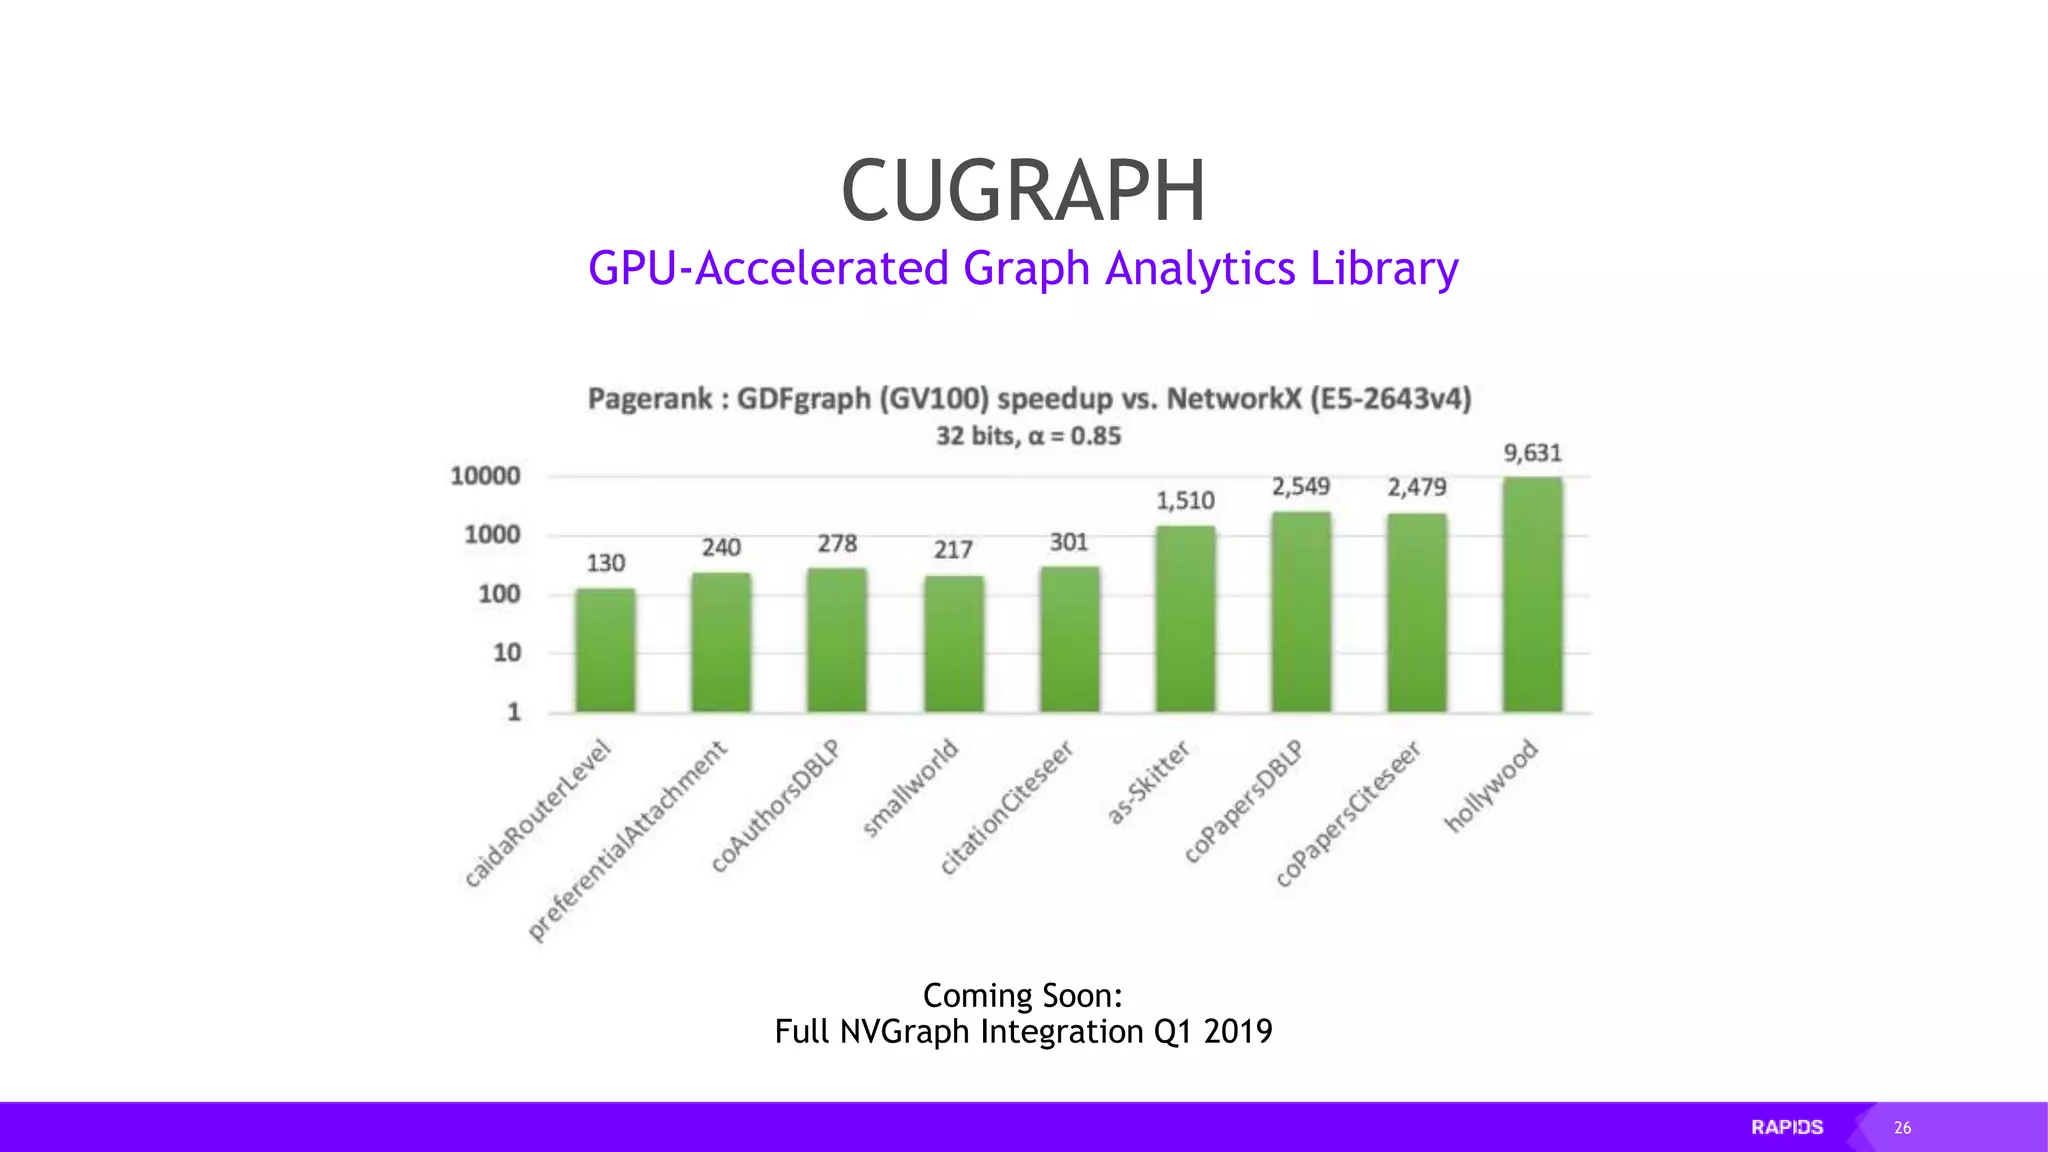
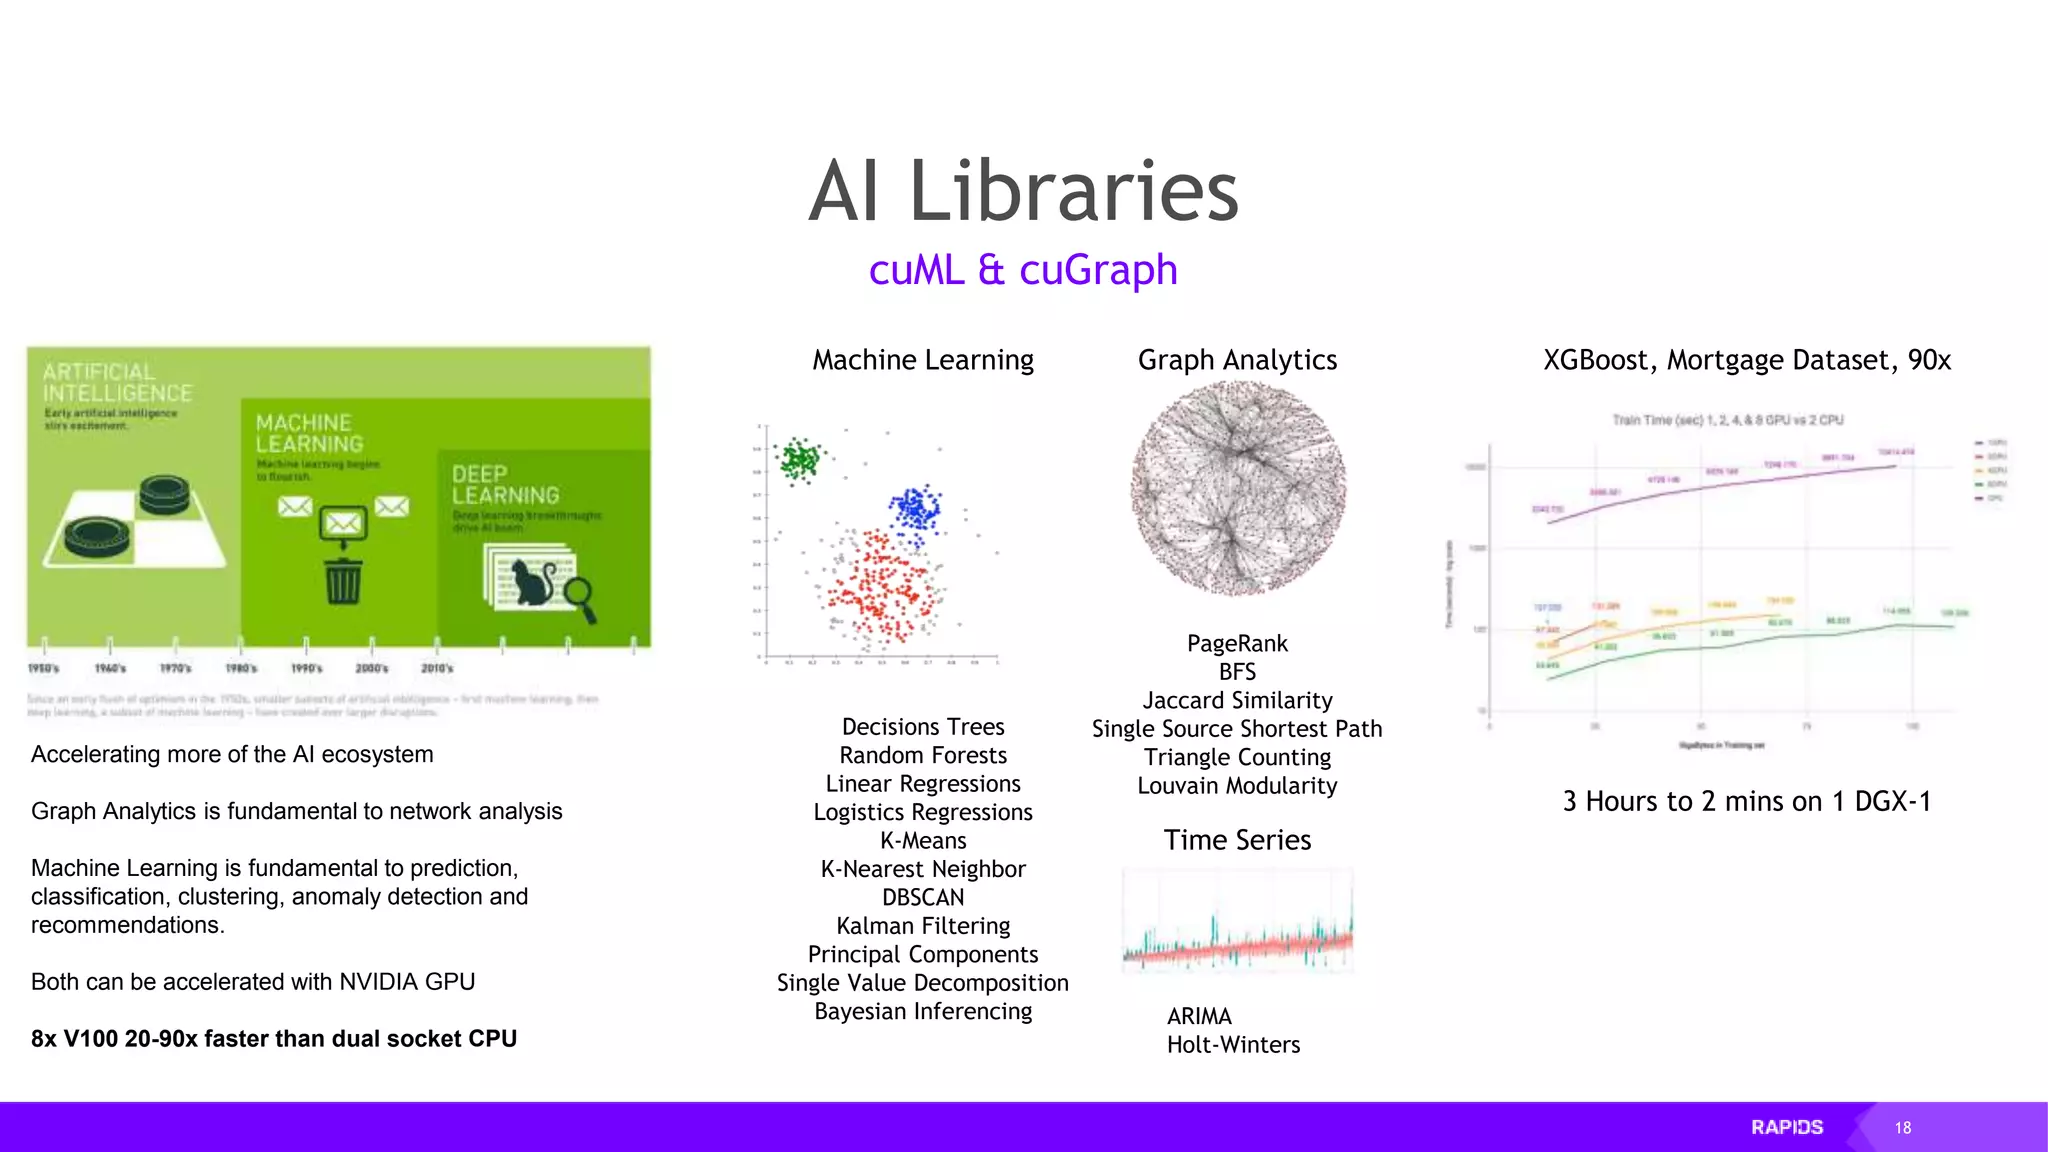
![27 Early cugraph benchmarks NVGRAPH methods (not currently in cuGraph) 100 billion TEPS (single GPU) Can reach 300 billion TEPS on MG (4 GPUs) with hand-tuning PageRank (SG) on graph with 5.5m edges and 51k nodes with RAPIDS CPU (GraphFrames, Spark) [576 GB memory, 384 vcores]: 172 seconds GPU (cuGraph, V100) [32 GB memory, 5120 CUDA cores]: 671 ms Speed-up of 256x For large graphs, there are huge parallelization benefits](https://image.slidesharecdn.com/mddatasciencemeetuprapids-190316025246/75/RAPIDS-Open-GPU-accelerated-Data-Science-27-2048.jpg)


![52 Dimensionality Reduction Code Example import cudf df = cudf.read_csv("iris/iris.data") df.columns=['sepal_len', 'sepal_wid', 'petal_len', 'petal_wid', 'class'] df.dropna(how="all", inplace=True) labels = df["class"] df = df.drop(["class"], axis = 1).astype(np.float32) Load CSV & Preprocess](https://image.slidesharecdn.com/mddatasciencemeetuprapids-190316025246/75/RAPIDS-Open-GPU-accelerated-Data-Science-52-2048.jpg)
![53 Dimensionality Reduction Code Example import cudf df = cudf.read_csv("iris/iris.data") df.columns=['sepal_len', 'sepal_wid', 'petal_len', 'petal_wid', 'class'] df.dropna(how="all", inplace=True) labels = df["class"] df = df.drop(["class"], axis = 1).astype(np.float32) sepal_len sepal_wid petal_len petal_wid 0 5.1 3.5 1.4 0.2 1 4.9 3.0 1.4 0.2 2 4.7 3.2 1.3 0.2 3 4.6 3.1 1.5 0.2 4 5.0 3.6 1.4 0.2 Load CSV & Preprocess](https://image.slidesharecdn.com/mddatasciencemeetuprapids-190316025246/75/RAPIDS-Open-GPU-accelerated-Data-Science-53-2048.jpg)
![54 Dimensionality Reduction Code Example import cudf df = cudf.read_csv("iris/iris.data") df.columns=['sepal_len', 'sepal_wid', 'petal_len', 'petal_wid', 'class'] df.dropna(how="all", inplace=True) labels = df["class"] df = df.drop(["class"], axis = 1).astype(np.float32) from cuml import PCA pca = PCA(n_components=df.shape[1]) pca.fit(df) print("Explained var %: %s': " % pca.explained_variance_ratio_) first_two = sum(pca.explained_variance_ratio_[0:2]) print("nFirst two: %f" % first_two) sepal_len sepal_wid petal_len petal_wid 0 5.1 3.5 1.4 0.2 1 4.9 3.0 1.4 0.2 2 4.7 3.2 1.3 0.2 3 4.6 3.1 1.5 0.2 4 5.0 3.6 1.4 0.2 Load CSV & Preprocess Explore Variance](https://image.slidesharecdn.com/mddatasciencemeetuprapids-190316025246/75/RAPIDS-Open-GPU-accelerated-Data-Science-54-2048.jpg)
![55 Dimensionality Reduction Code Example import cudf df = cudf.read_csv("iris/iris.data") df.columns=['sepal_len', 'sepal_wid', 'petal_len', 'petal_wid', 'class'] df.dropna(how="all", inplace=True) labels = df["class"] df = df.drop(["class"], axis = 1).astype(np.float32) from cuml import PCA pca = PCA(n_components=df.shape[1]) pca.fit(df) print("Explained var %: %s': " % pca.explained_variance_ratio_) first_two = sum(pca.explained_variance_ratio_[0:2]) print("nFirst two: %f" % first_two) sepal_len sepal_wid petal_len petal_wid 0 5.1 3.5 1.4 0.2 1 4.9 3.0 1.4 0.2 2 4.7 3.2 1.3 0.2 3 4.6 3.1 1.5 0.2 4 5.0 3.6 1.4 0.2 Explained var %: 0 0.92461634 1 0.05301554 2 0.017185122 3 0.005183111 First two: 0.9776318781077862 Load CSV & Preprocess Explore Variance](https://image.slidesharecdn.com/mddatasciencemeetuprapids-190316025246/75/RAPIDS-Open-GPU-accelerated-Data-Science-55-2048.jpg)
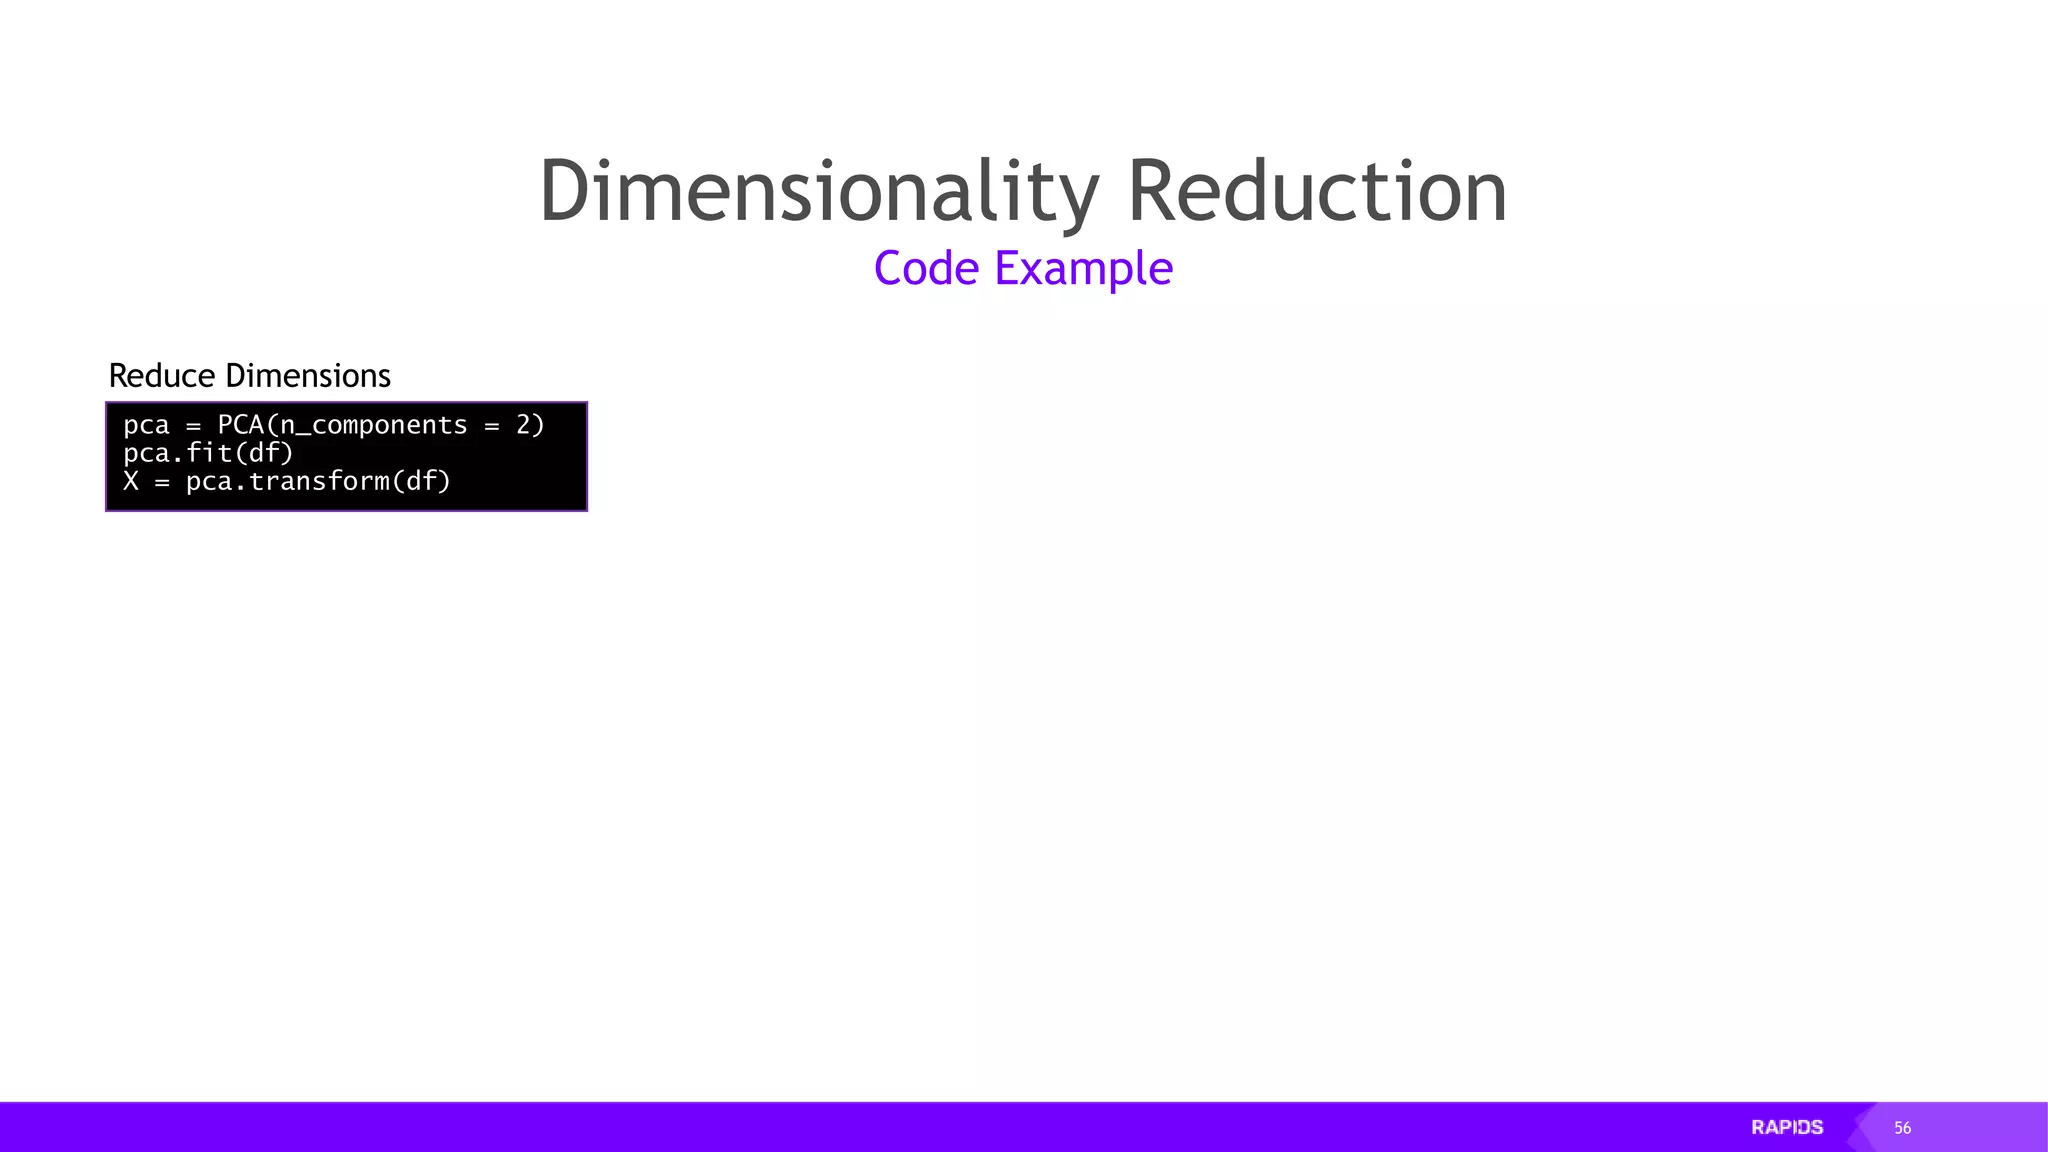
![57 Dimensionality Reduction pca = PCA(n_components = 2) pca.fit(df) X = pca.transform(df) Code Example uniq = set(labels.values) colors = [plt.cm.Spectral(each) for each in np.linspace(0, 1, len(uniq))] for k, col in zip(uniq, colors): c = X[l==k].as_gpu_matrix() plt.plot(c[:,0], c[:,1], '.', markerfacecolor=tuple(col)) Reduce Dimensions Chart Rotated Data](https://image.slidesharecdn.com/mddatasciencemeetuprapids-190316025246/75/RAPIDS-Open-GPU-accelerated-Data-Science-57-2048.jpg)
![58 Dimensionality Reduction pca = PCA(n_components = 2) pca.fit(df) X = pca.transform(df) Code Example uniq = set(labels.values) colors = [plt.cm.Spectral(each) for each in np.linspace(0, 1, len(uniq))] for k, col in zip(uniq, colors): c = X[l==k].as_gpu_matrix() plt.plot(c[:,0], c[:,1], '.', markerfacecolor=tuple(col)) Reduce Dimensions Chart Rotated Data](https://image.slidesharecdn.com/mddatasciencemeetuprapids-190316025246/75/RAPIDS-Open-GPU-accelerated-Data-Science-58-2048.jpg)
![59 Dimensionality Reduction pca = PCA(n_components = 2) pca.fit(df) X = pca.transform(df) Code Example uniq = set(labels.values) colors = [plt.cm.Spectral(each) for each in np.linspace(0, 1, len(uniq))] for k, col in zip(uniq, colors): c = X[l==k].as_gpu_matrix() plt.plot(c[:,0], c[:,1], '.', markerfacecolor=tuple(col)) Reduce Dimensions Chart Rotated Data](https://image.slidesharecdn.com/mddatasciencemeetuprapids-190316025246/75/RAPIDS-Open-GPU-accelerated-Data-Science-59-2048.jpg)
![60 Clustering Code Example X, y = make_moons(n_samples=int(1e2), noise=0.05, random_state=0) X_df = pd.DataFrame({'fea%d'%i: X[:, i] for i in range(X.shape[1])}) X = cudf.DataFrame.from_pandas(X_df) Load Moons Dataset and Preprocess](https://image.slidesharecdn.com/mddatasciencemeetuprapids-190316025246/75/RAPIDS-Open-GPU-accelerated-Data-Science-60-2048.jpg)
![61 Clustering Code Example X, y = make_moons(n_samples=int(1e2), noise=0.05, random_state=0) X_df = pd.DataFrame({'fea%d'%i: X[:, i] for i in range(X.shape[1])}) X = cudf.DataFrame.from_pandas(X_df) Load Moons Dataset and Preprocess](https://image.slidesharecdn.com/mddatasciencemeetuprapids-190316025246/75/RAPIDS-Open-GPU-accelerated-Data-Science-61-2048.jpg)
![62 Clustering Code Example X, y = make_moons(n_samples=int(1e2), noise=0.05, random_state=0) X_df = pd.DataFrame({'fea%d'%i: X[:, i] for i in range(X.shape[1])}) X = cudf.DataFrame.from_pandas(X_df) Load Moons Dataset and Preprocess](https://image.slidesharecdn.com/mddatasciencemeetuprapids-190316025246/75/RAPIDS-Open-GPU-accelerated-Data-Science-62-2048.jpg)
![63 Clustering from cuml import DBSCAN dbscan = DBSCAN(eps = 0.3, min_samples = 5) dbscan.fit(X) y_hat = db.fit_predict(X) Code Example Find Clusters X, y = make_moons(n_samples=int(1e2), noise=0.05, random_state=0) X_df = pd.DataFrame({'fea%d'%i: X[:, i] for i in range(X.shape[1])}) X = cudf.DataFrame.from_pandas(X_df) Load Moons Dataset and Preprocess](https://image.slidesharecdn.com/mddatasciencemeetuprapids-190316025246/75/RAPIDS-Open-GPU-accelerated-Data-Science-63-2048.jpg)
![64 Clustering from cuml import DBSCAN dbscan = DBSCAN(eps = 0.3, min_samples = 5) dbscan.fit(X) y_hat = db.fit_predict(X) Code Example Find Clusters X, y = make_moons(n_samples=int(1e2), noise=0.05, random_state=0) X_df = pd.DataFrame({'fea%d'%i: X[:, i] for i in range(X.shape[1])}) X = cudf.DataFrame.from_pandas(X_df) Load Moons Dataset and Preprocess](https://image.slidesharecdn.com/mddatasciencemeetuprapids-190316025246/75/RAPIDS-Open-GPU-accelerated-Data-Science-64-2048.jpg)


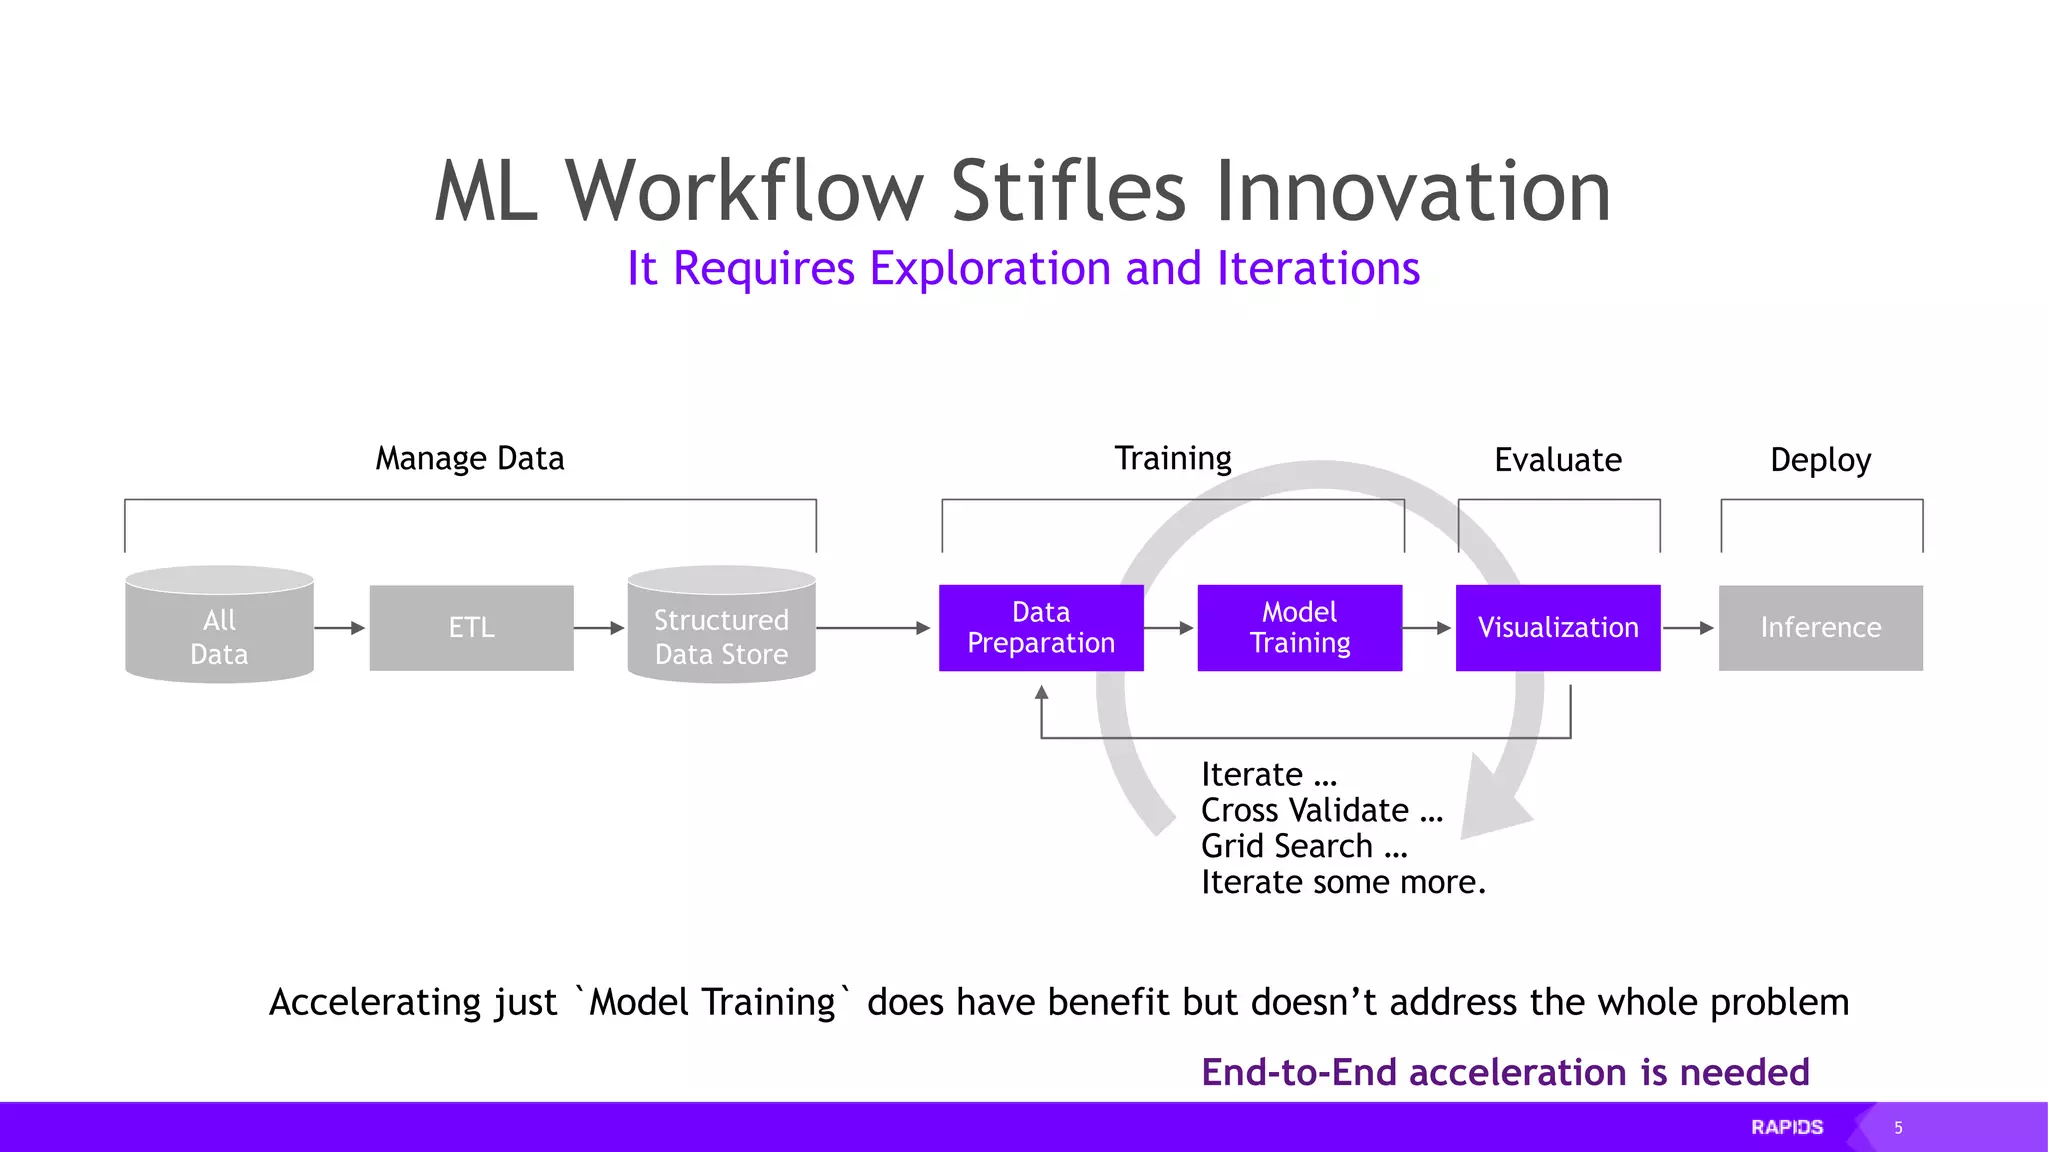
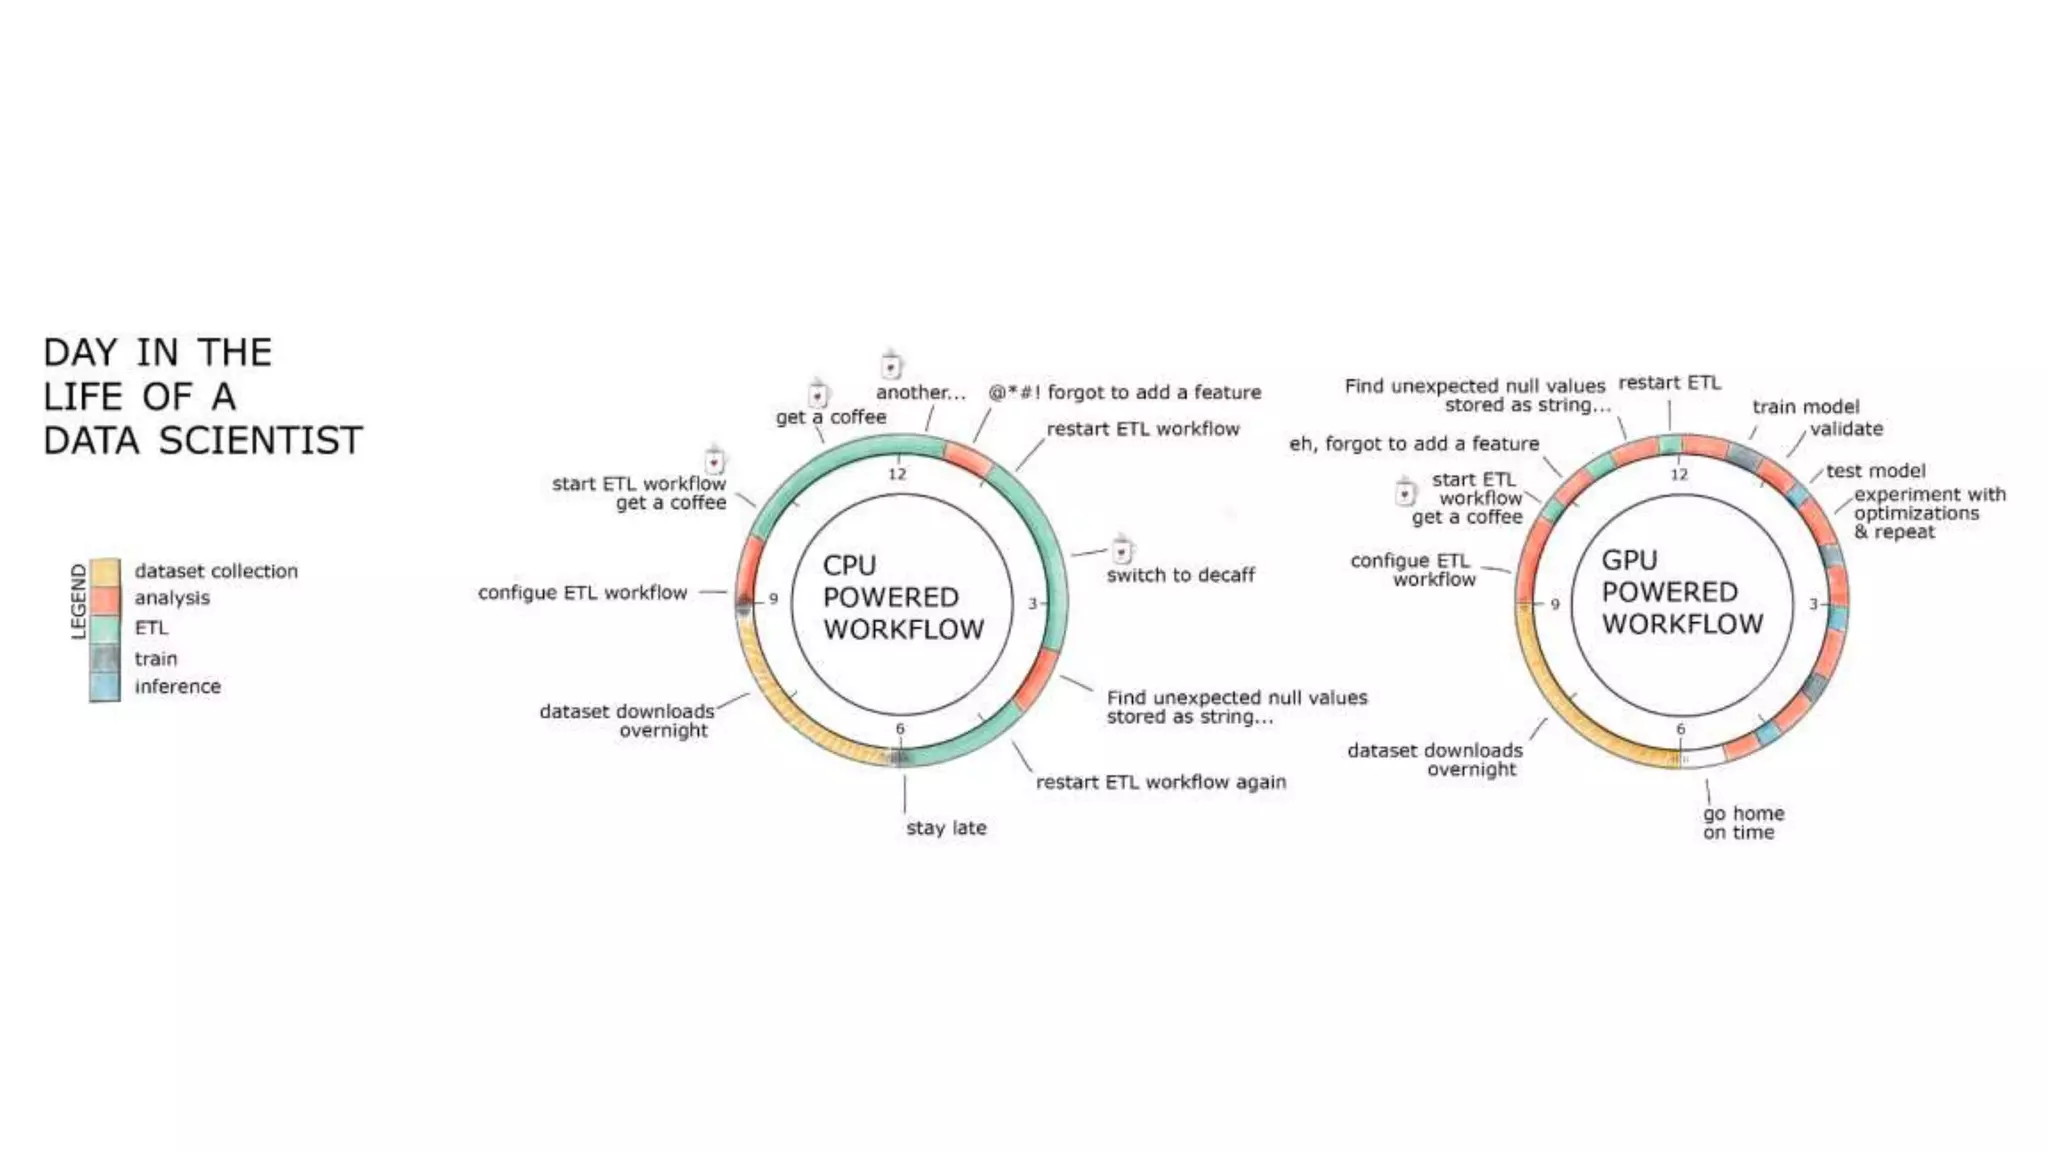
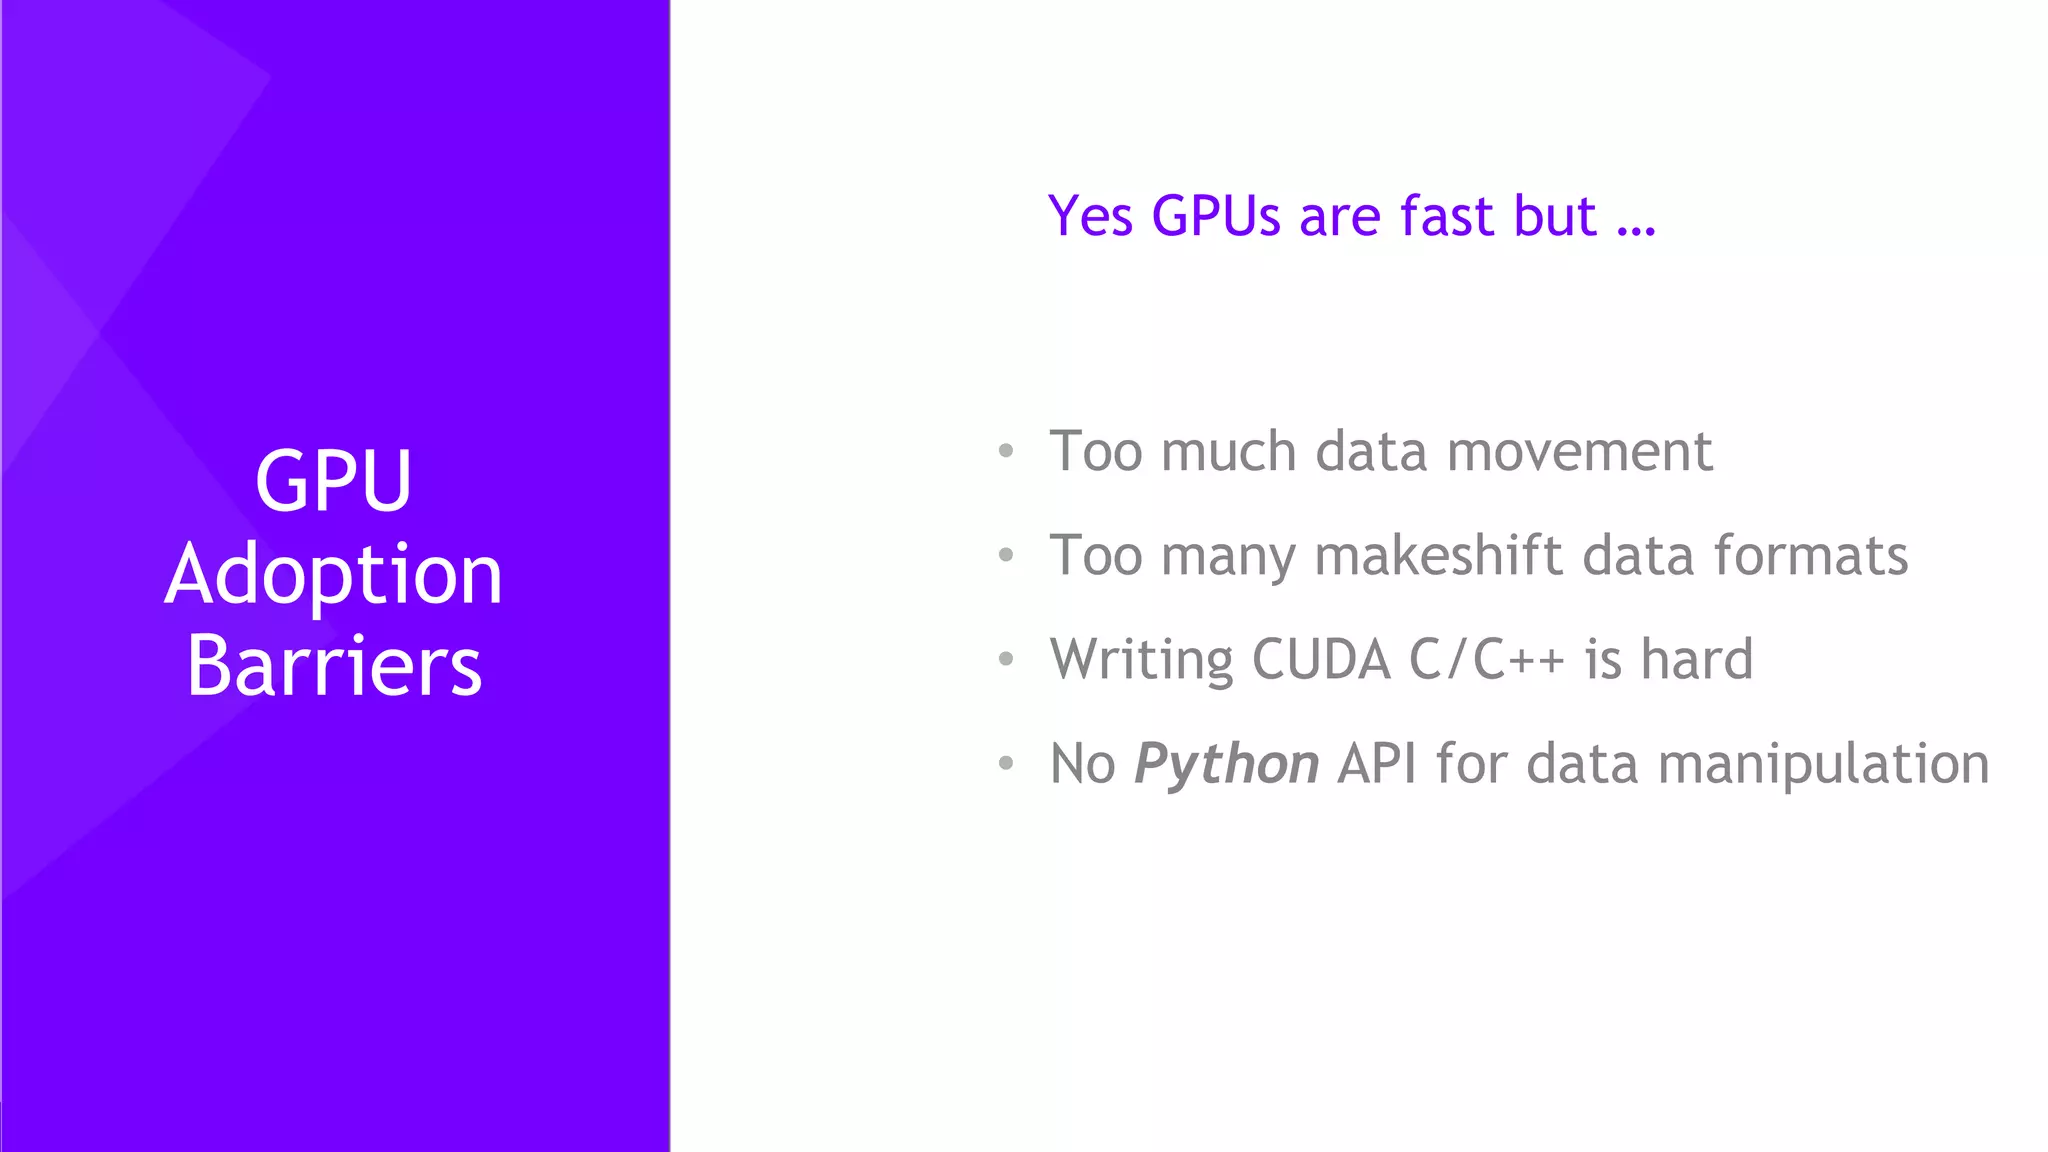
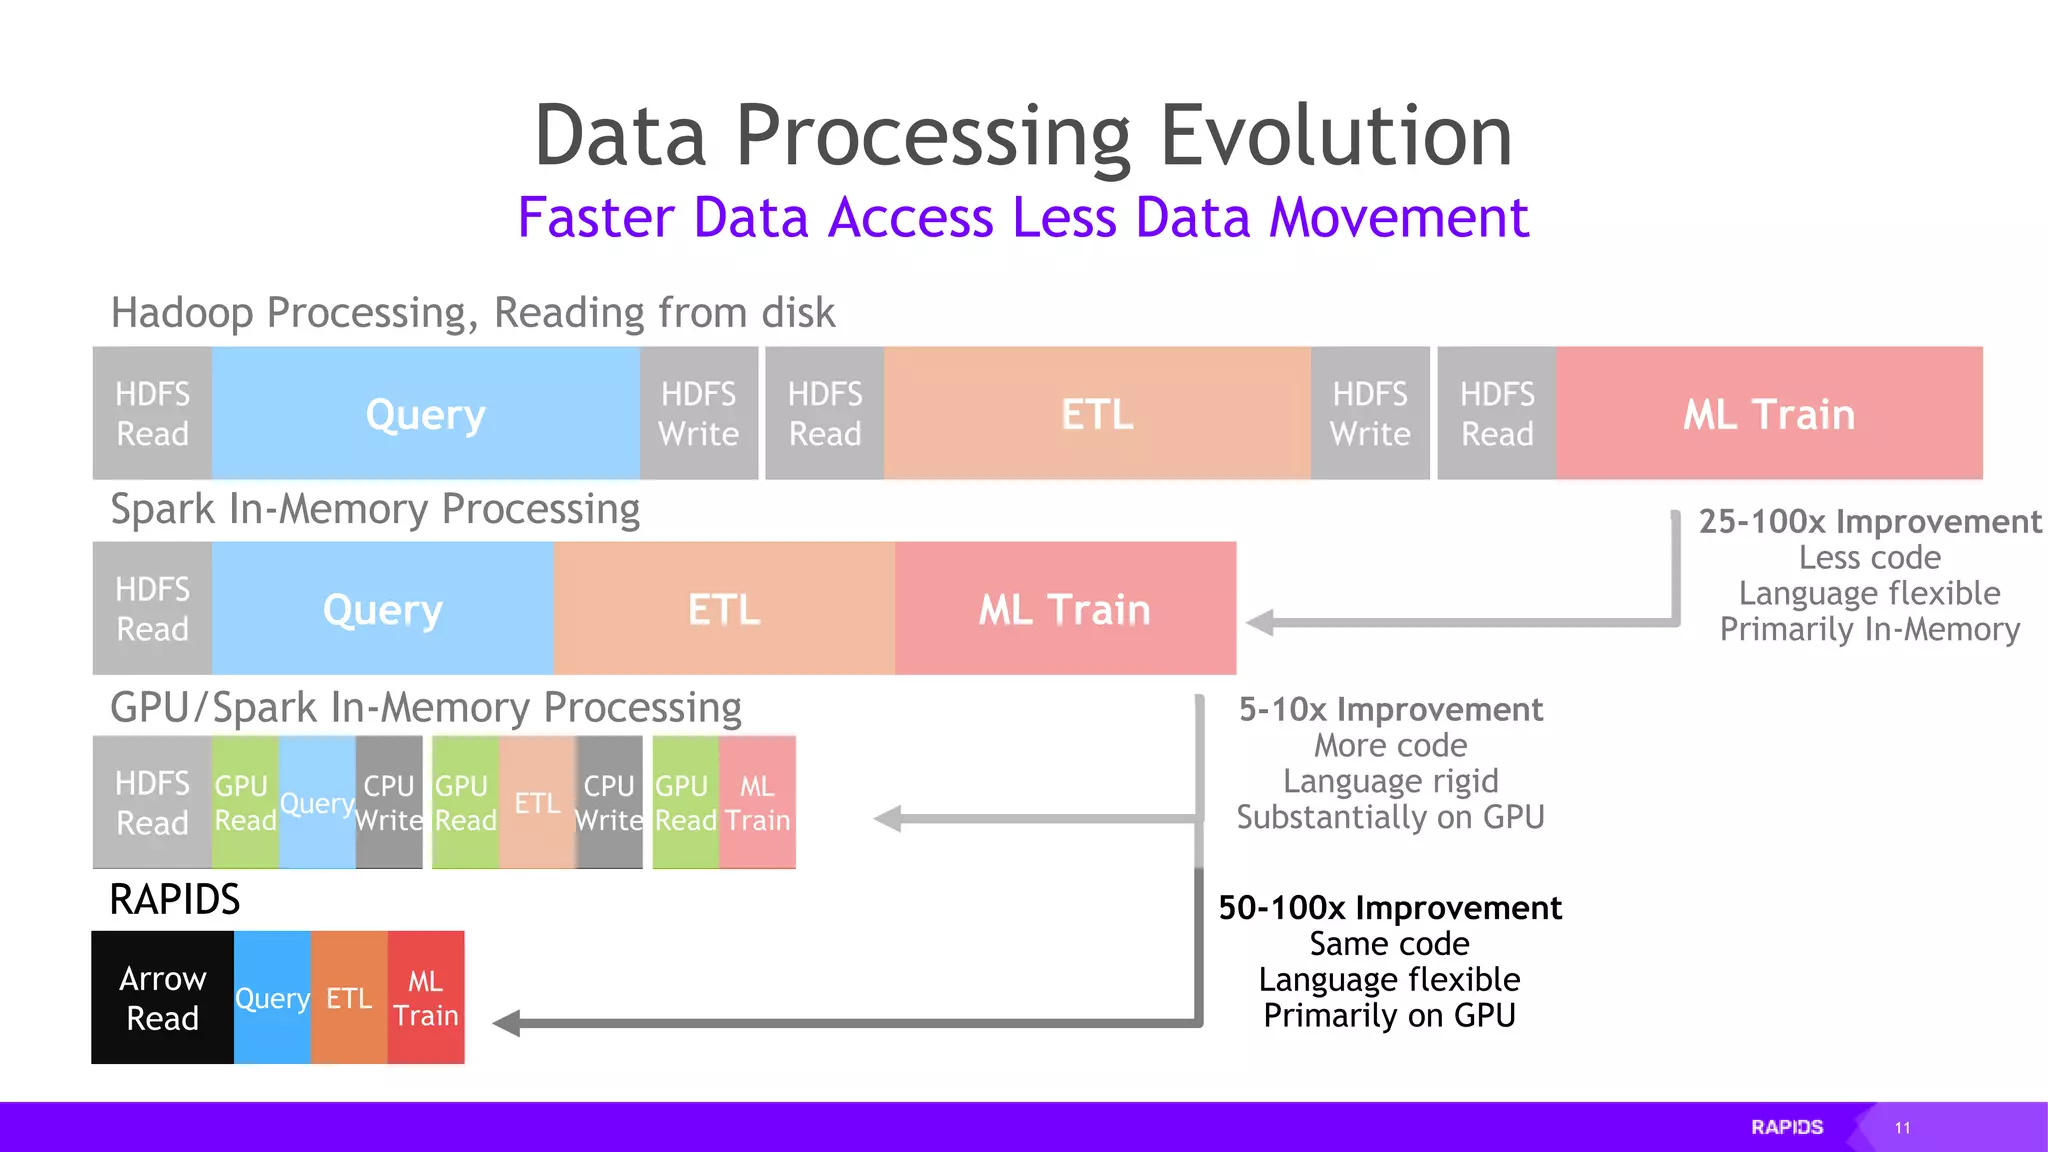
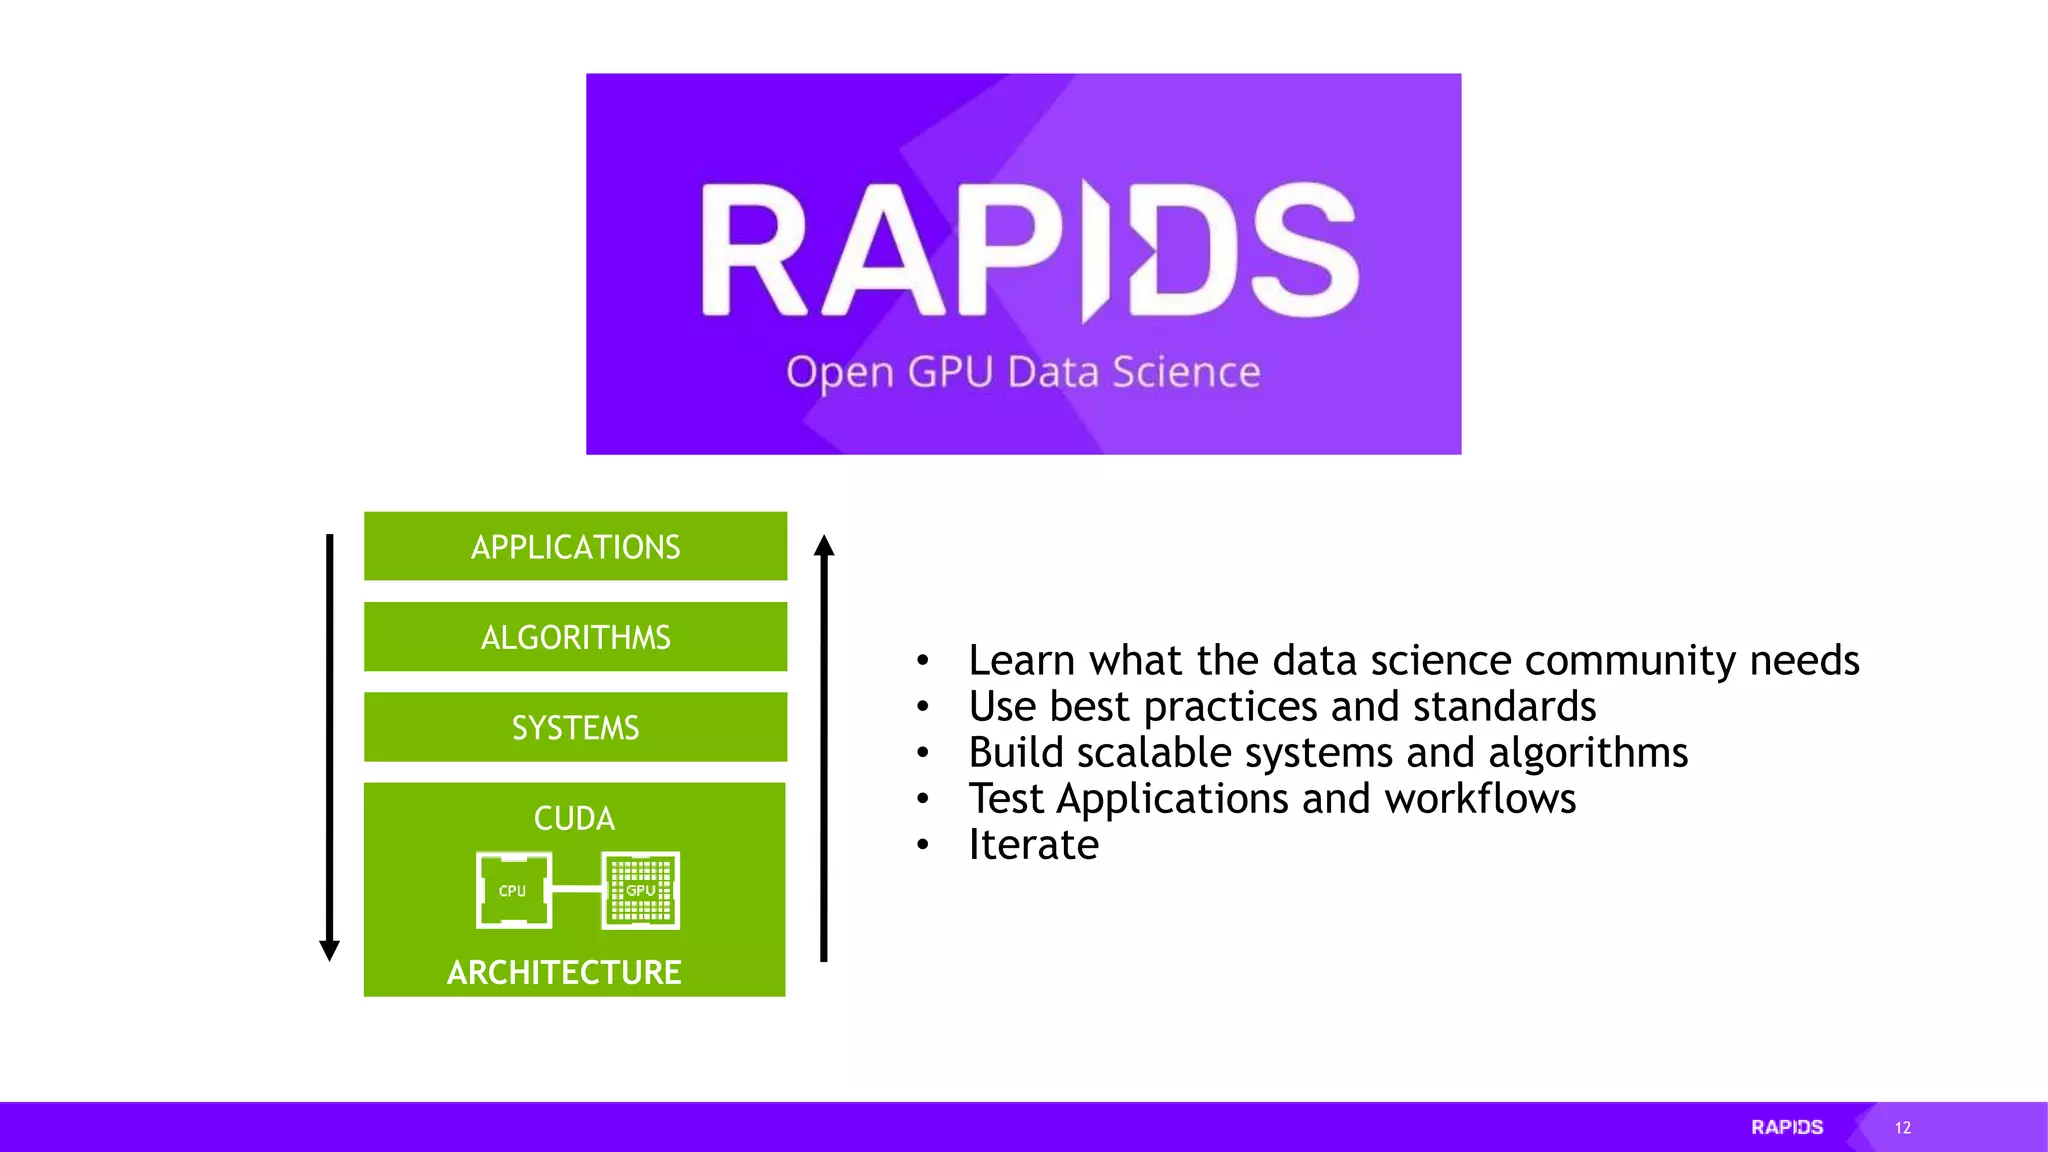
This document outlines the expertise and roles of Adam Thompson and Corey Nolet at NVIDIA, focusing on GPU-accelerated data science and machine learning. It discusses the performance challenges faced in ML workflows and the critical need for end-to-end acceleration in processing large datasets. Tools like RAPIDS, cuDF, and Dask are highlighted as solutions to enhance data manipulation, model training, and overall efficiency in data science applications.