Download to read offline

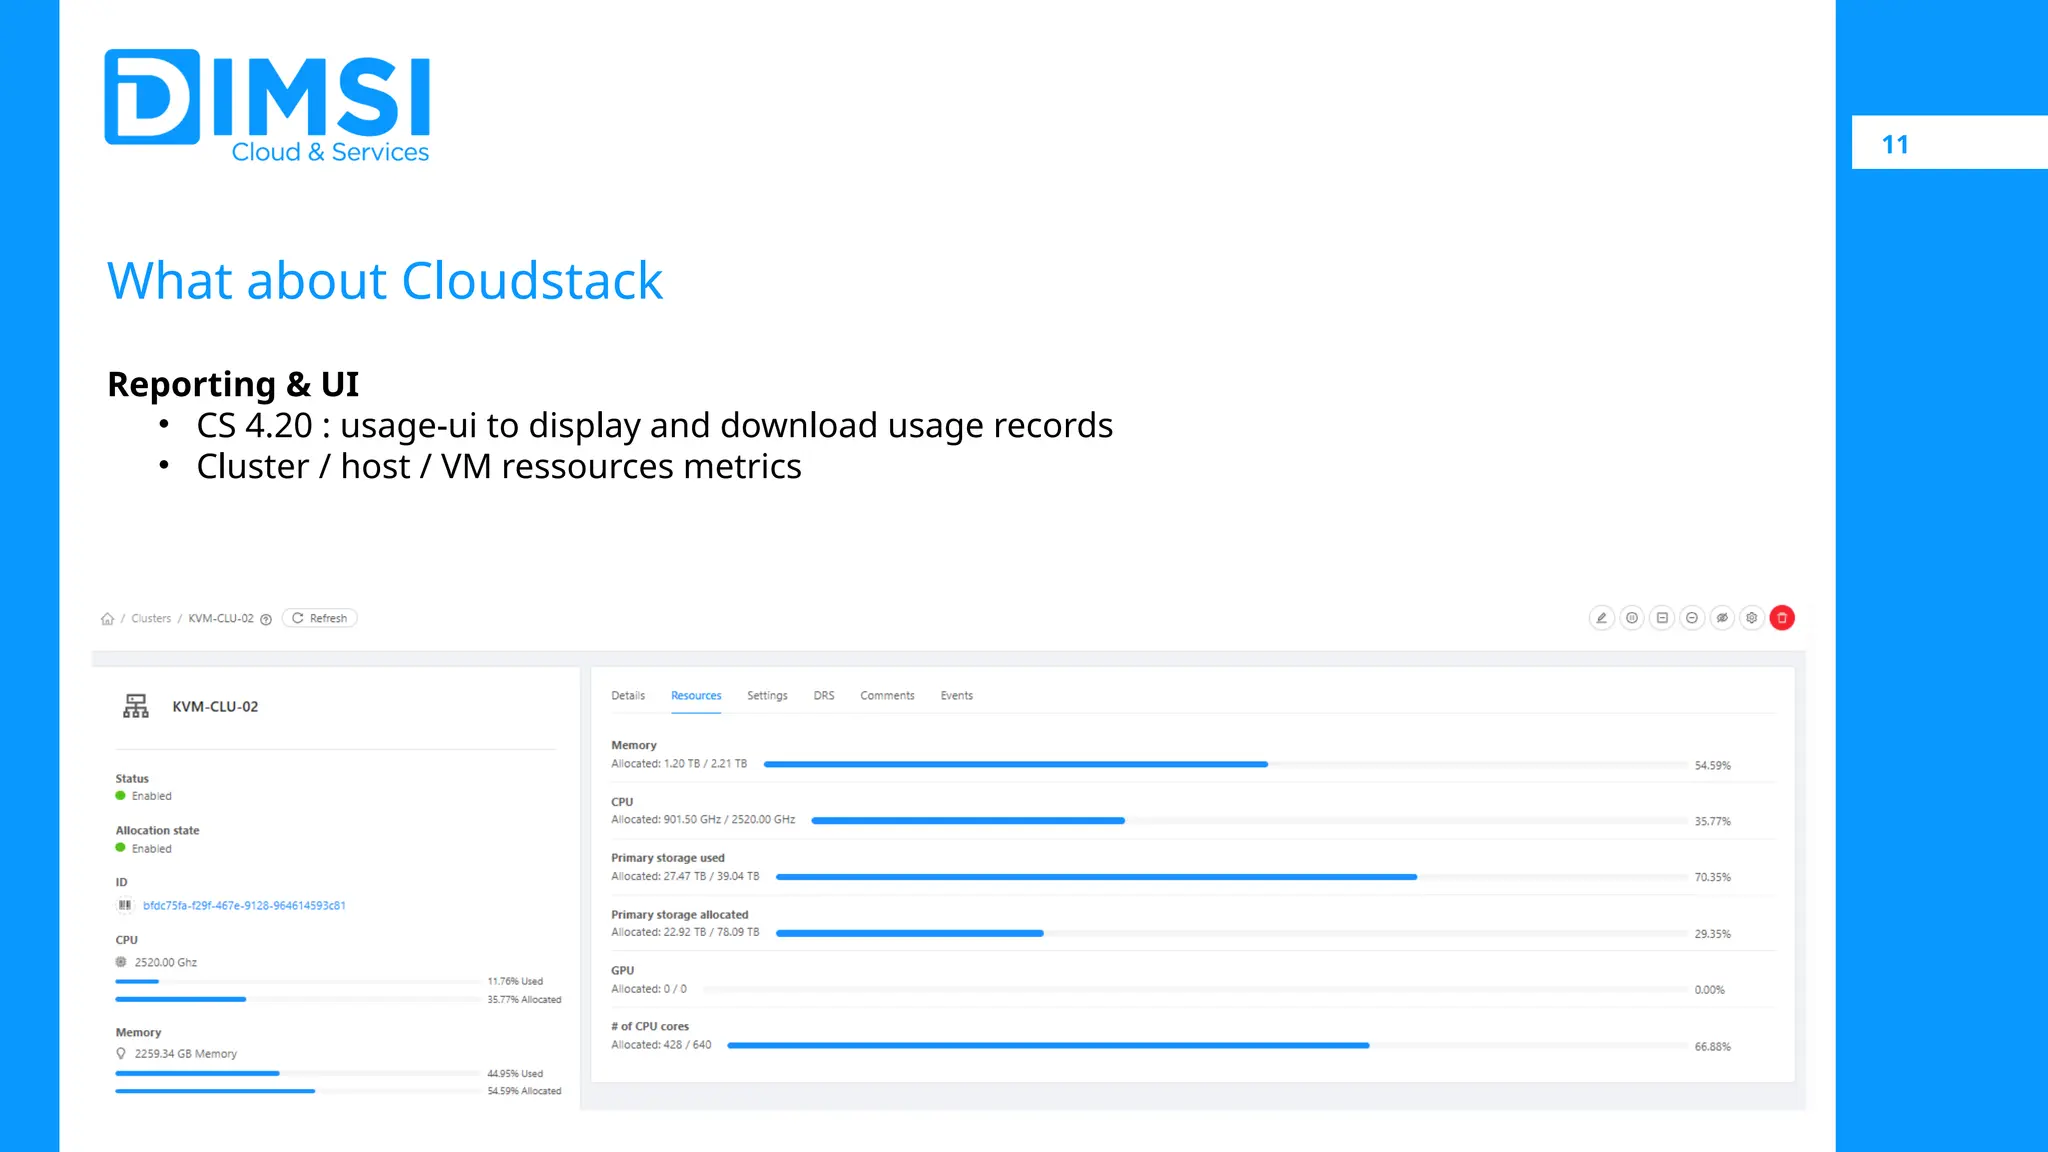
![10 What about Cloudstack Data • Usage service with API capabilities: Instances and infrastructure consumption • listCapacity API command: Capacity consumption by pod or cluster • listVirtualMachinesUsageHistory • listSystemVmsUsageHistory • listUsageRecords listUsageRecords startdate=2025-03-01 enddate=2025-03-02 domainid=9d190e08-f1b0-412d-b28d-811e61191a9e { "account": "Admin", "accountid": "02383f45-f318-439a-b8d9-6addbe7aa", "cpunumber": 4, "cpuspeed": 2400, "description": "Running VM usage for SRV1 (i-12-18680-VM) (bf83ef25-e2e2-432b-8e53-49e5ef4d718f) using service offering KVM (4104c50c- fb7a-45cb-a788-dec8d39a2d7a) and template Win-Srv-2016-Std-KVM (9405a5e3-5460-4e9c-a773-b95dc17a4346)", "domain": « 387", "domainid": "9d190e08-f1b0-412d-b28d-811e61191a9e", "domainpath": "/IAAS/387/", "enddate": "2024-03-01'T'23:59:59+00:00", "memory": 4096, "name": « SRV1", "offeringid": "4104c50c-fb7a-45cb-a788-dec8d39a2d7a", "oscategoryid": "47c7f725-1fed-11e8-a604-f61f8a45771f", "oscategoryname": "Windows", "osdisplayname": "Windows PV", "ostypeid": "47f03dcf-1fed-11e8-a604-f61f8a45771f", "rawusage": "24", "startdate": "2024-03-01'T'00:00:00+00:00", "tags": [], "templateid": "9405a5e3-5460-4e9c-a773-b95dc17a4346", "type": "KVM",](https://image.slidesharecdn.com/cseug25-monitorandmanagecloudusage-250519112632-c01569e9/75/Proposed-Feature-Monitoring-and-Managing-Cloud-Usage-Costs-in-Apache-CloudStack-10-2048.jpg)
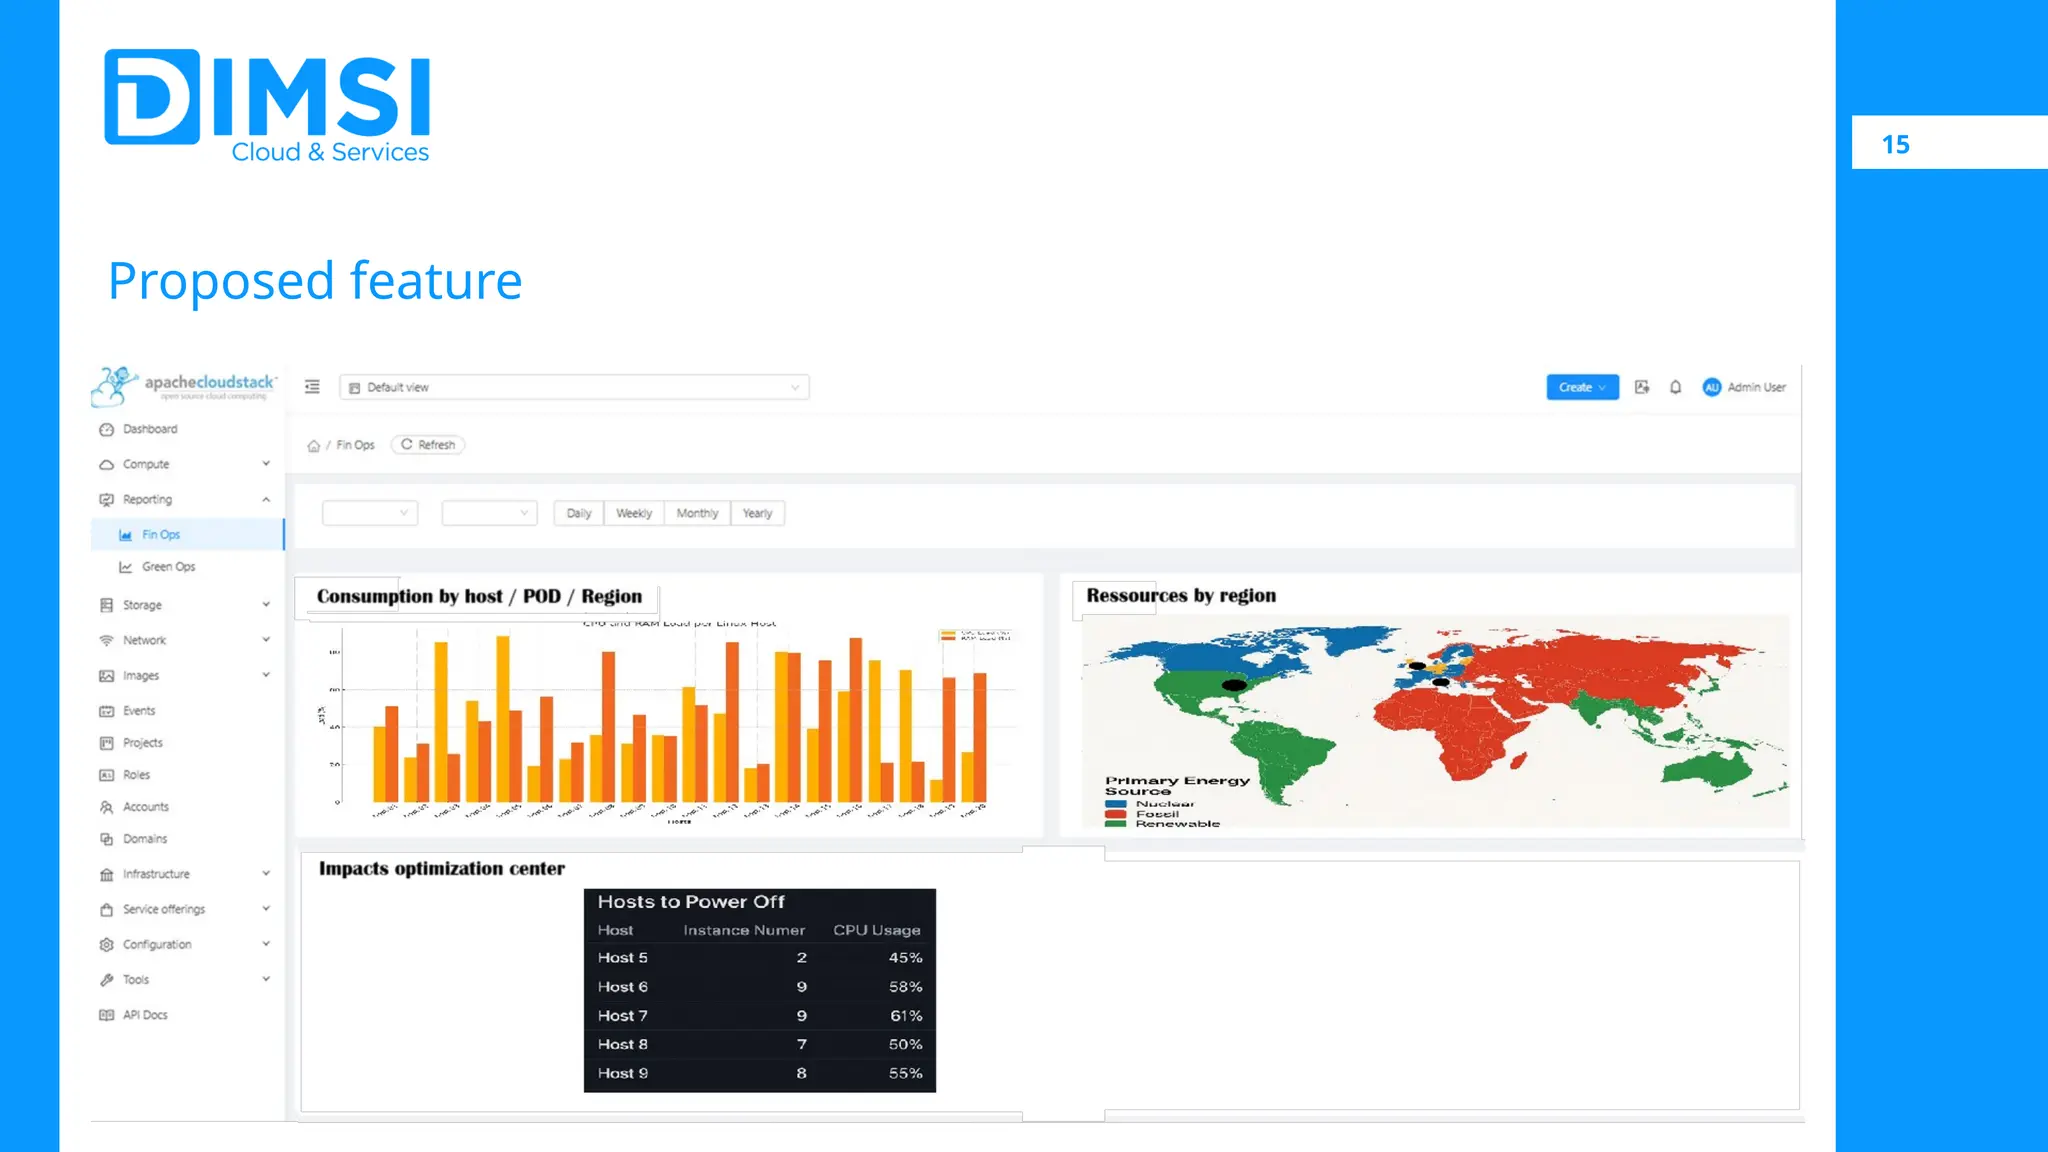


DIMSI showcased a proposed feature to help CloudStack users capitalize on cloud usage metrics out of the box. Gregoire Lamodiere and Joffrey Luangsaysana explored the need for improved visibility into cloud consumption metrics for both administrators and end users. They invited input and insights from the Apache CloudStack community regarding the proposal, fostering collaborative dialogue to refine the feature and ensure it meets the community's needs. -- The CloudStack European User Group 2025 took place on May 8th in Vienna, Austria. The event once again brought together open-source cloud professionals, contributors, developers, and users for a day of deep technical insights, knowledge sharing, and community connection.