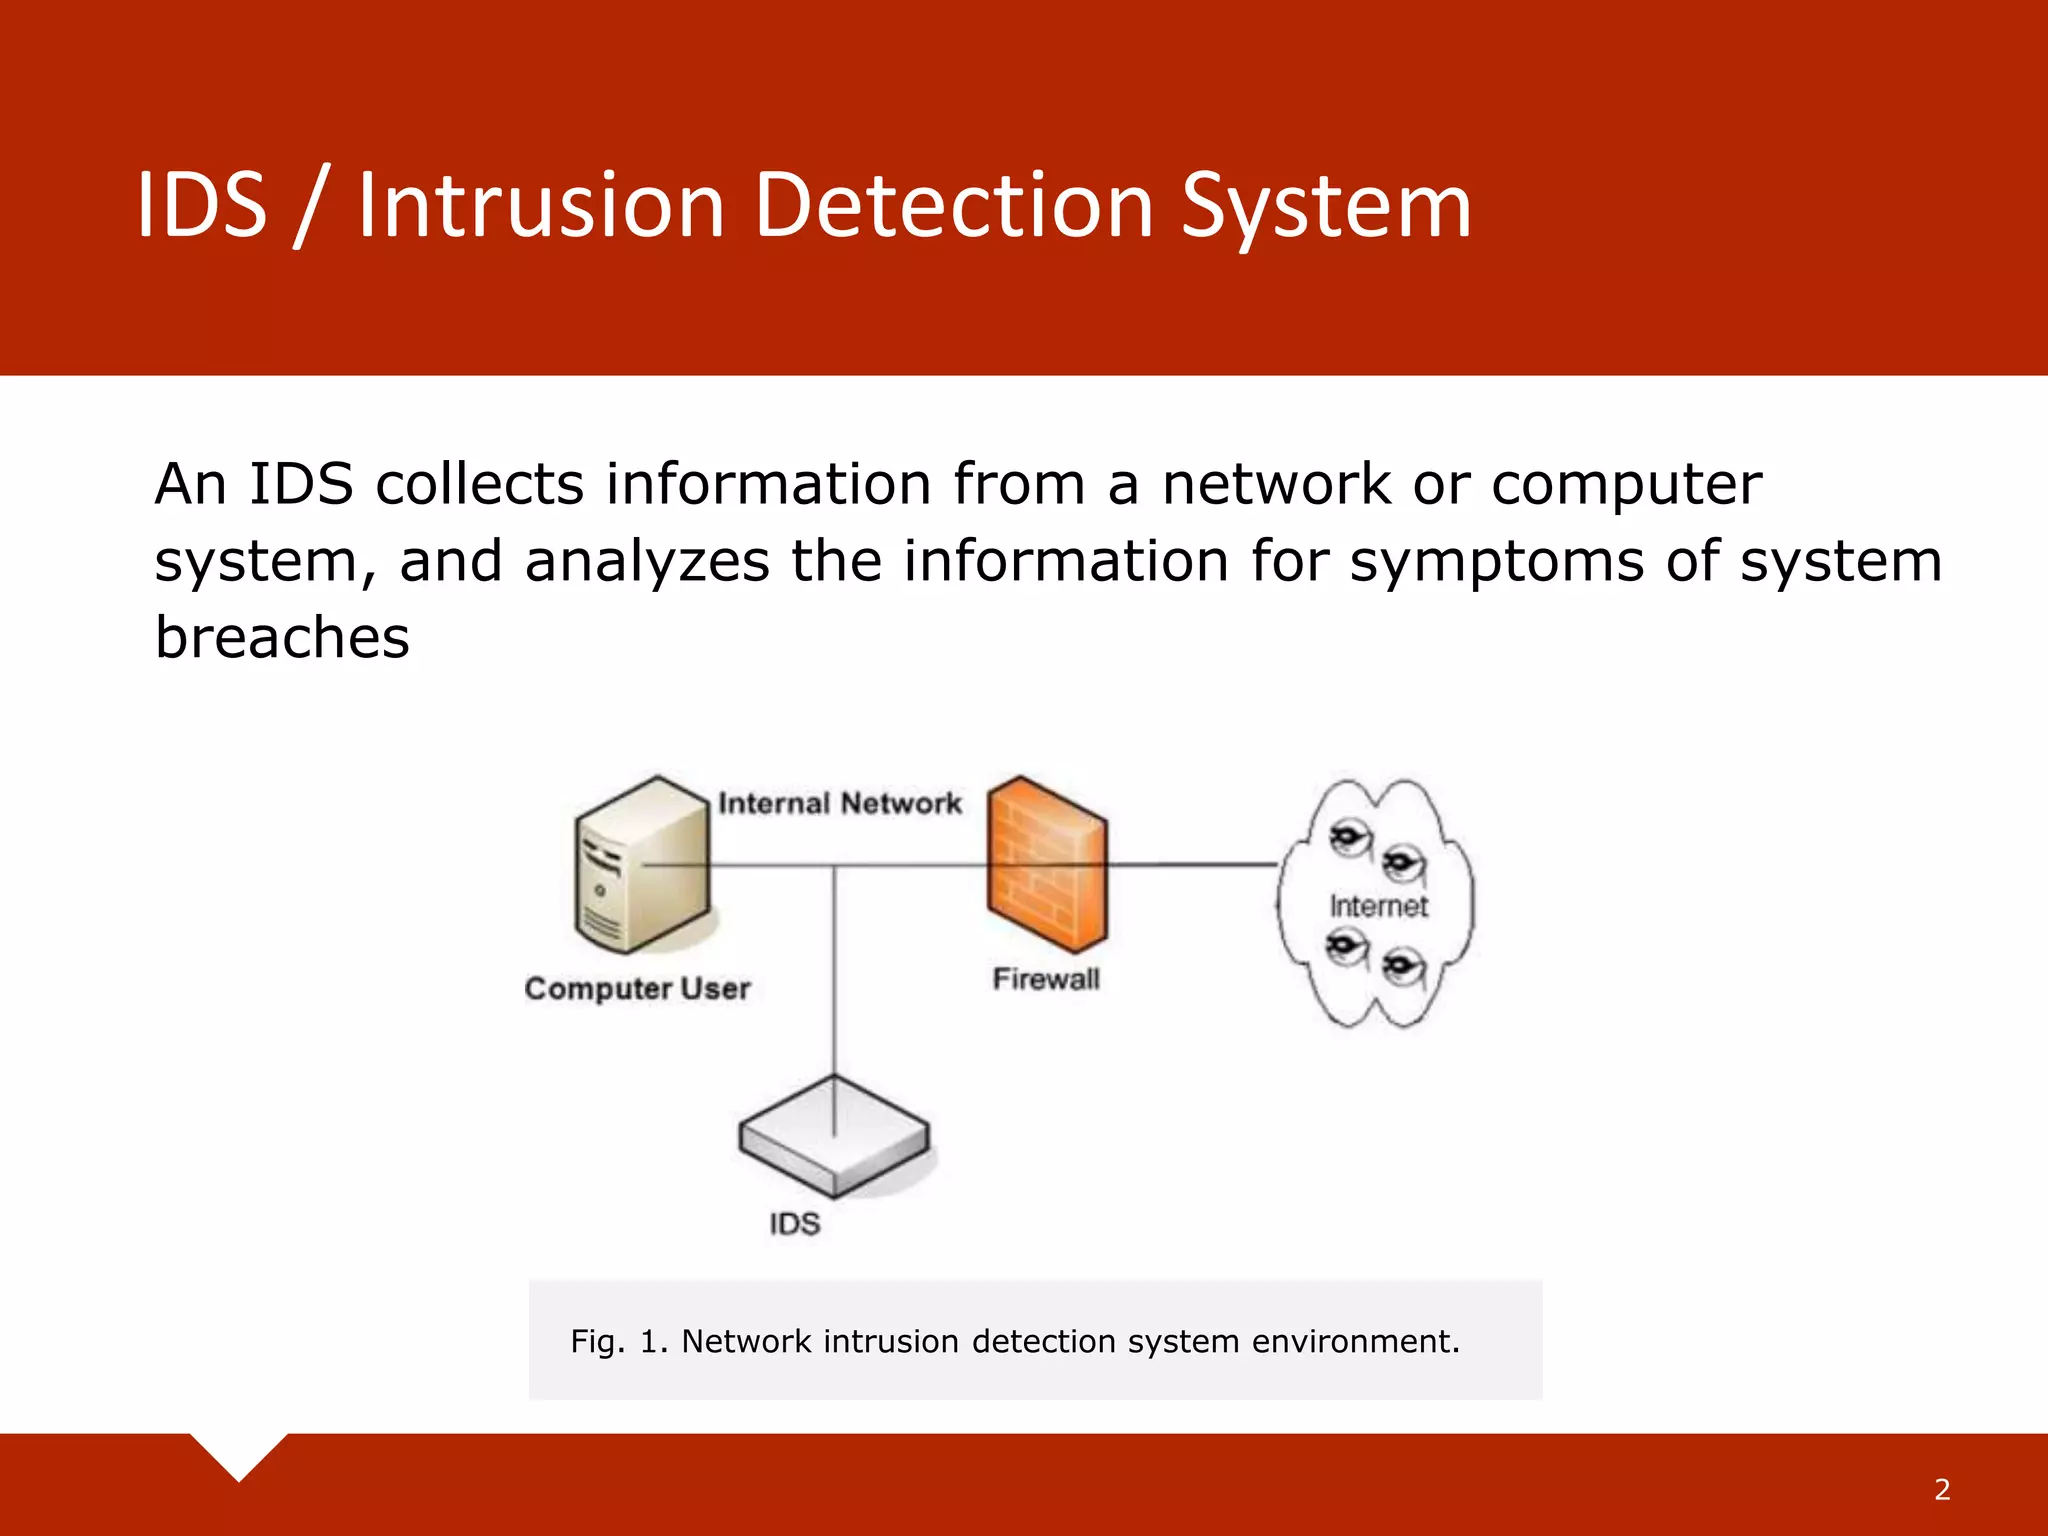
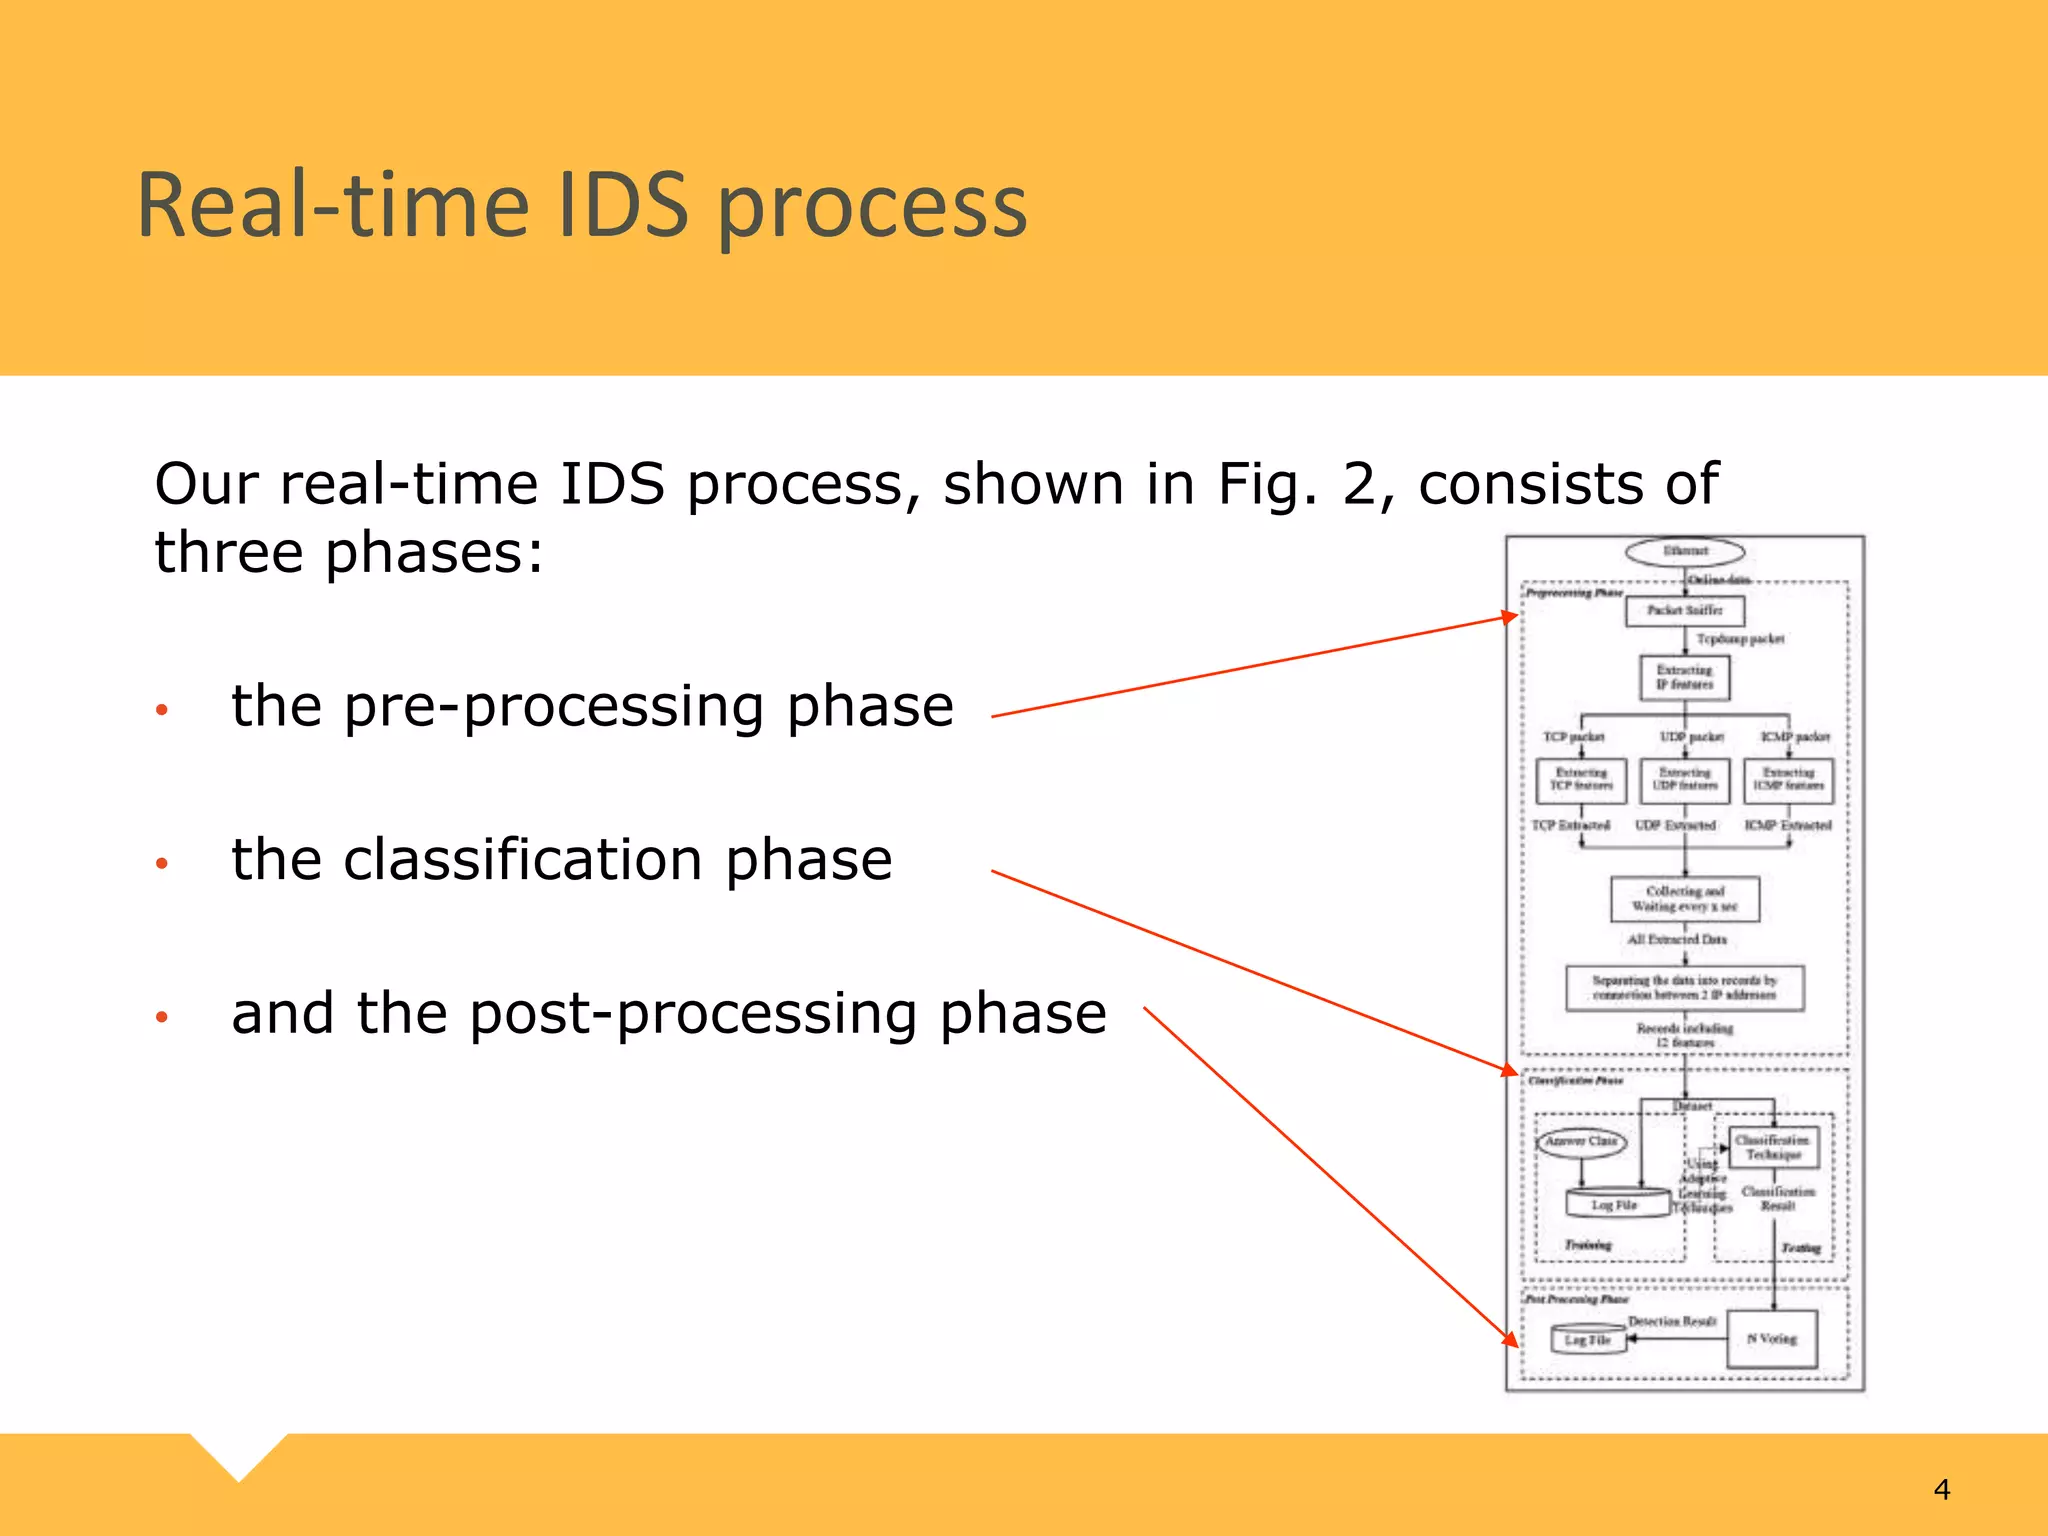
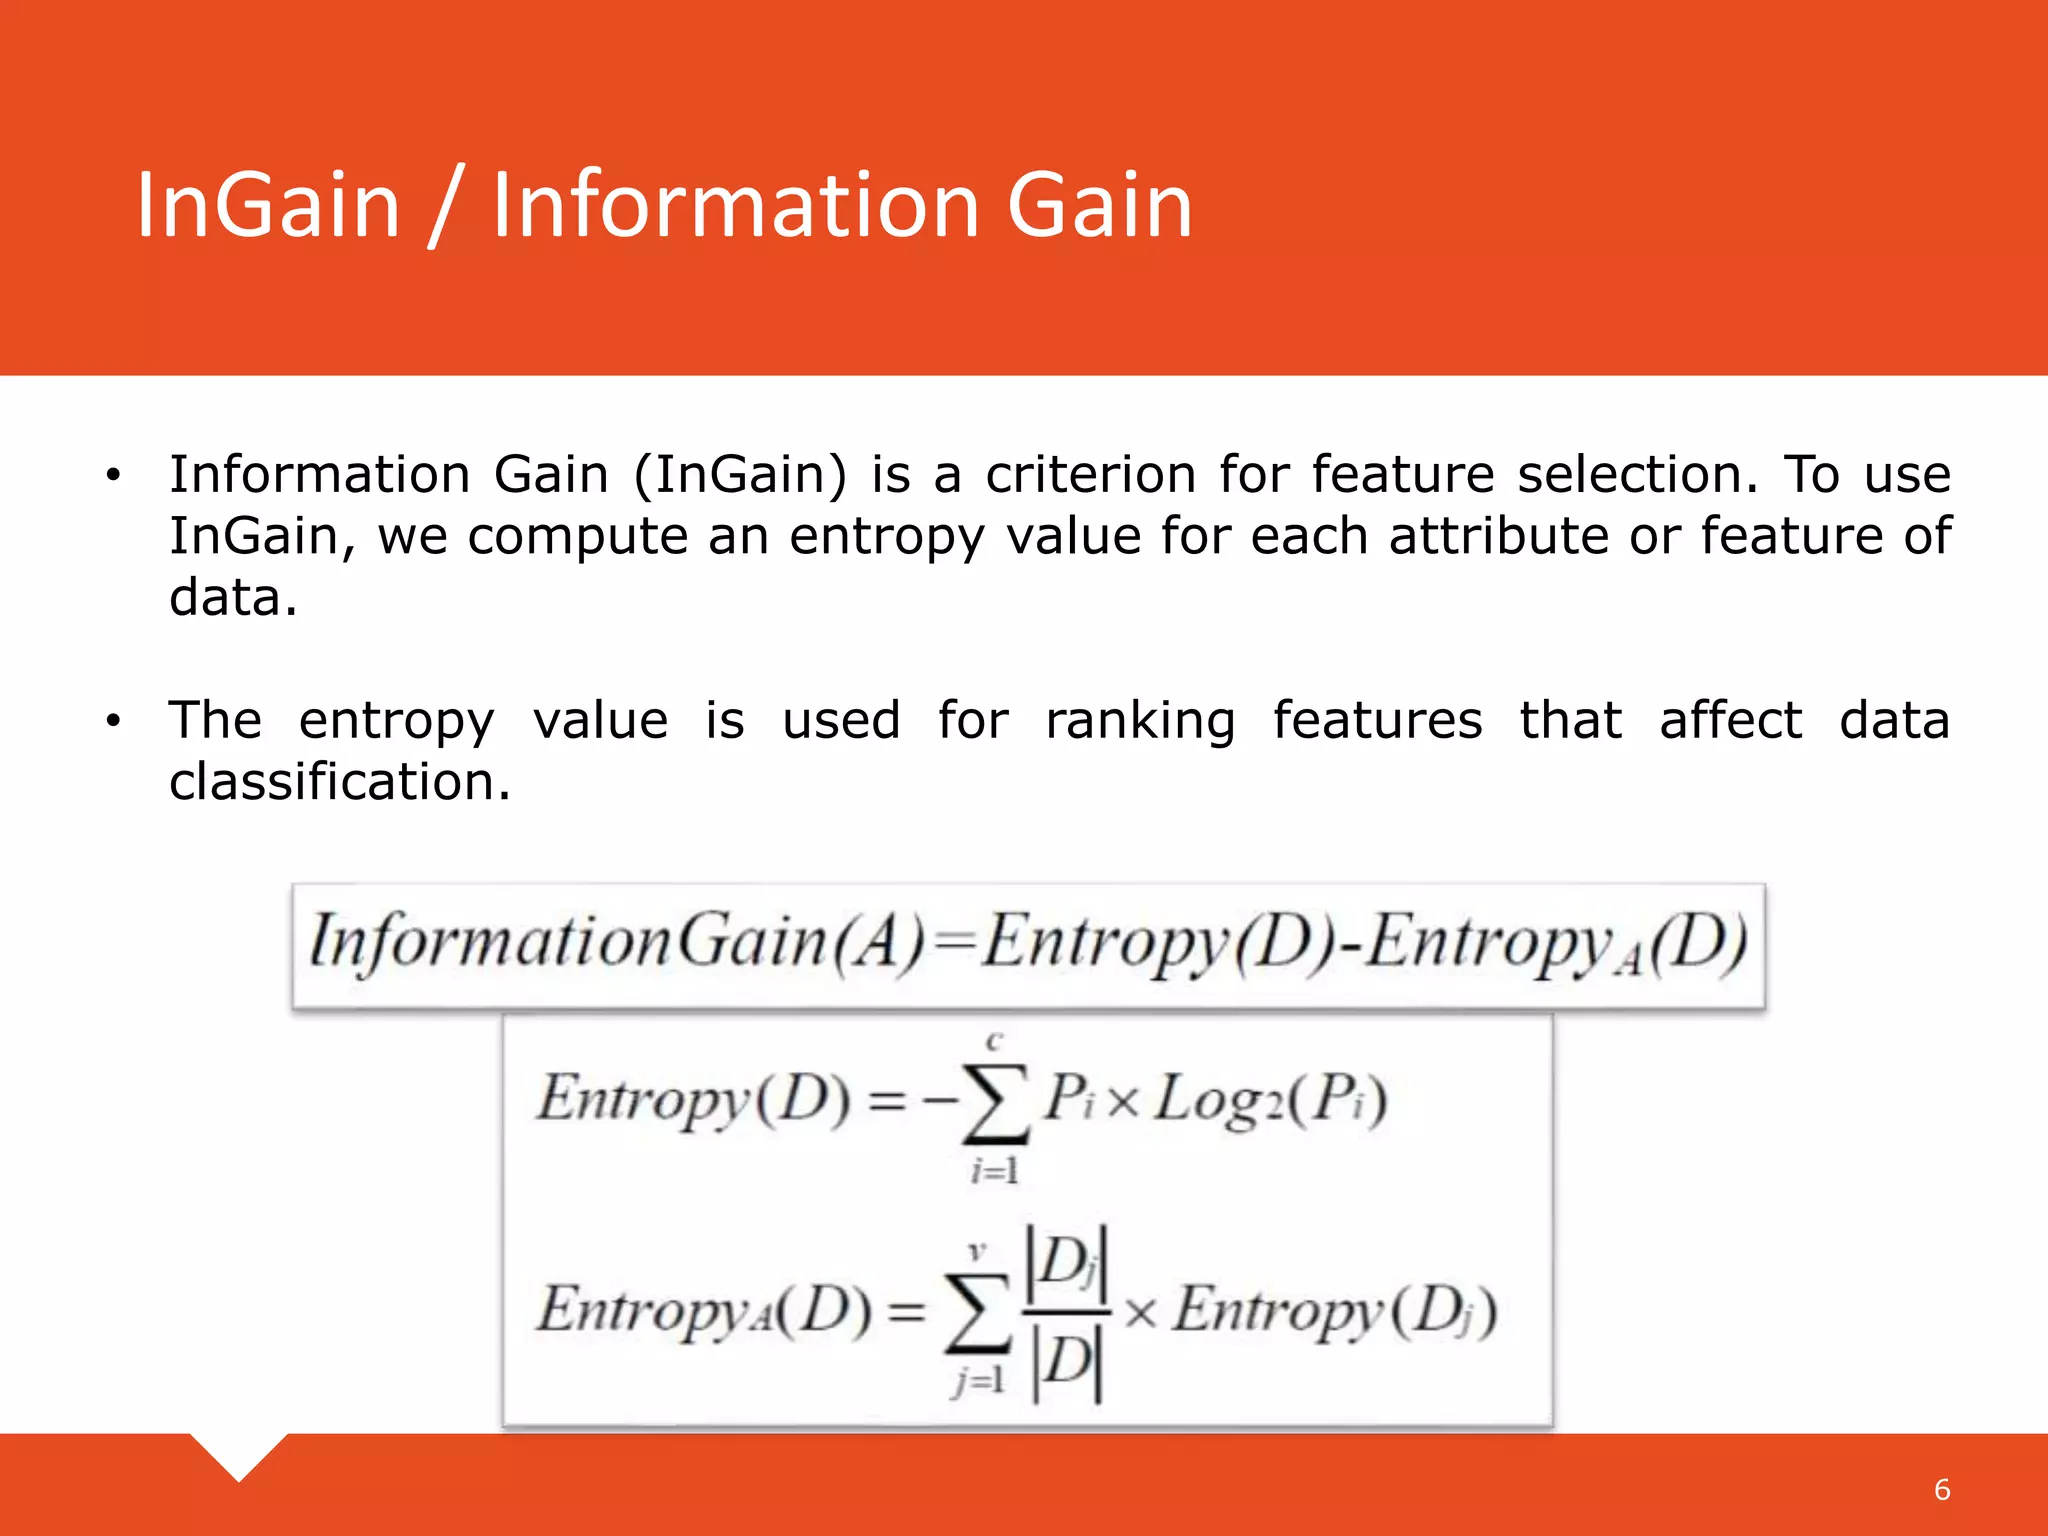
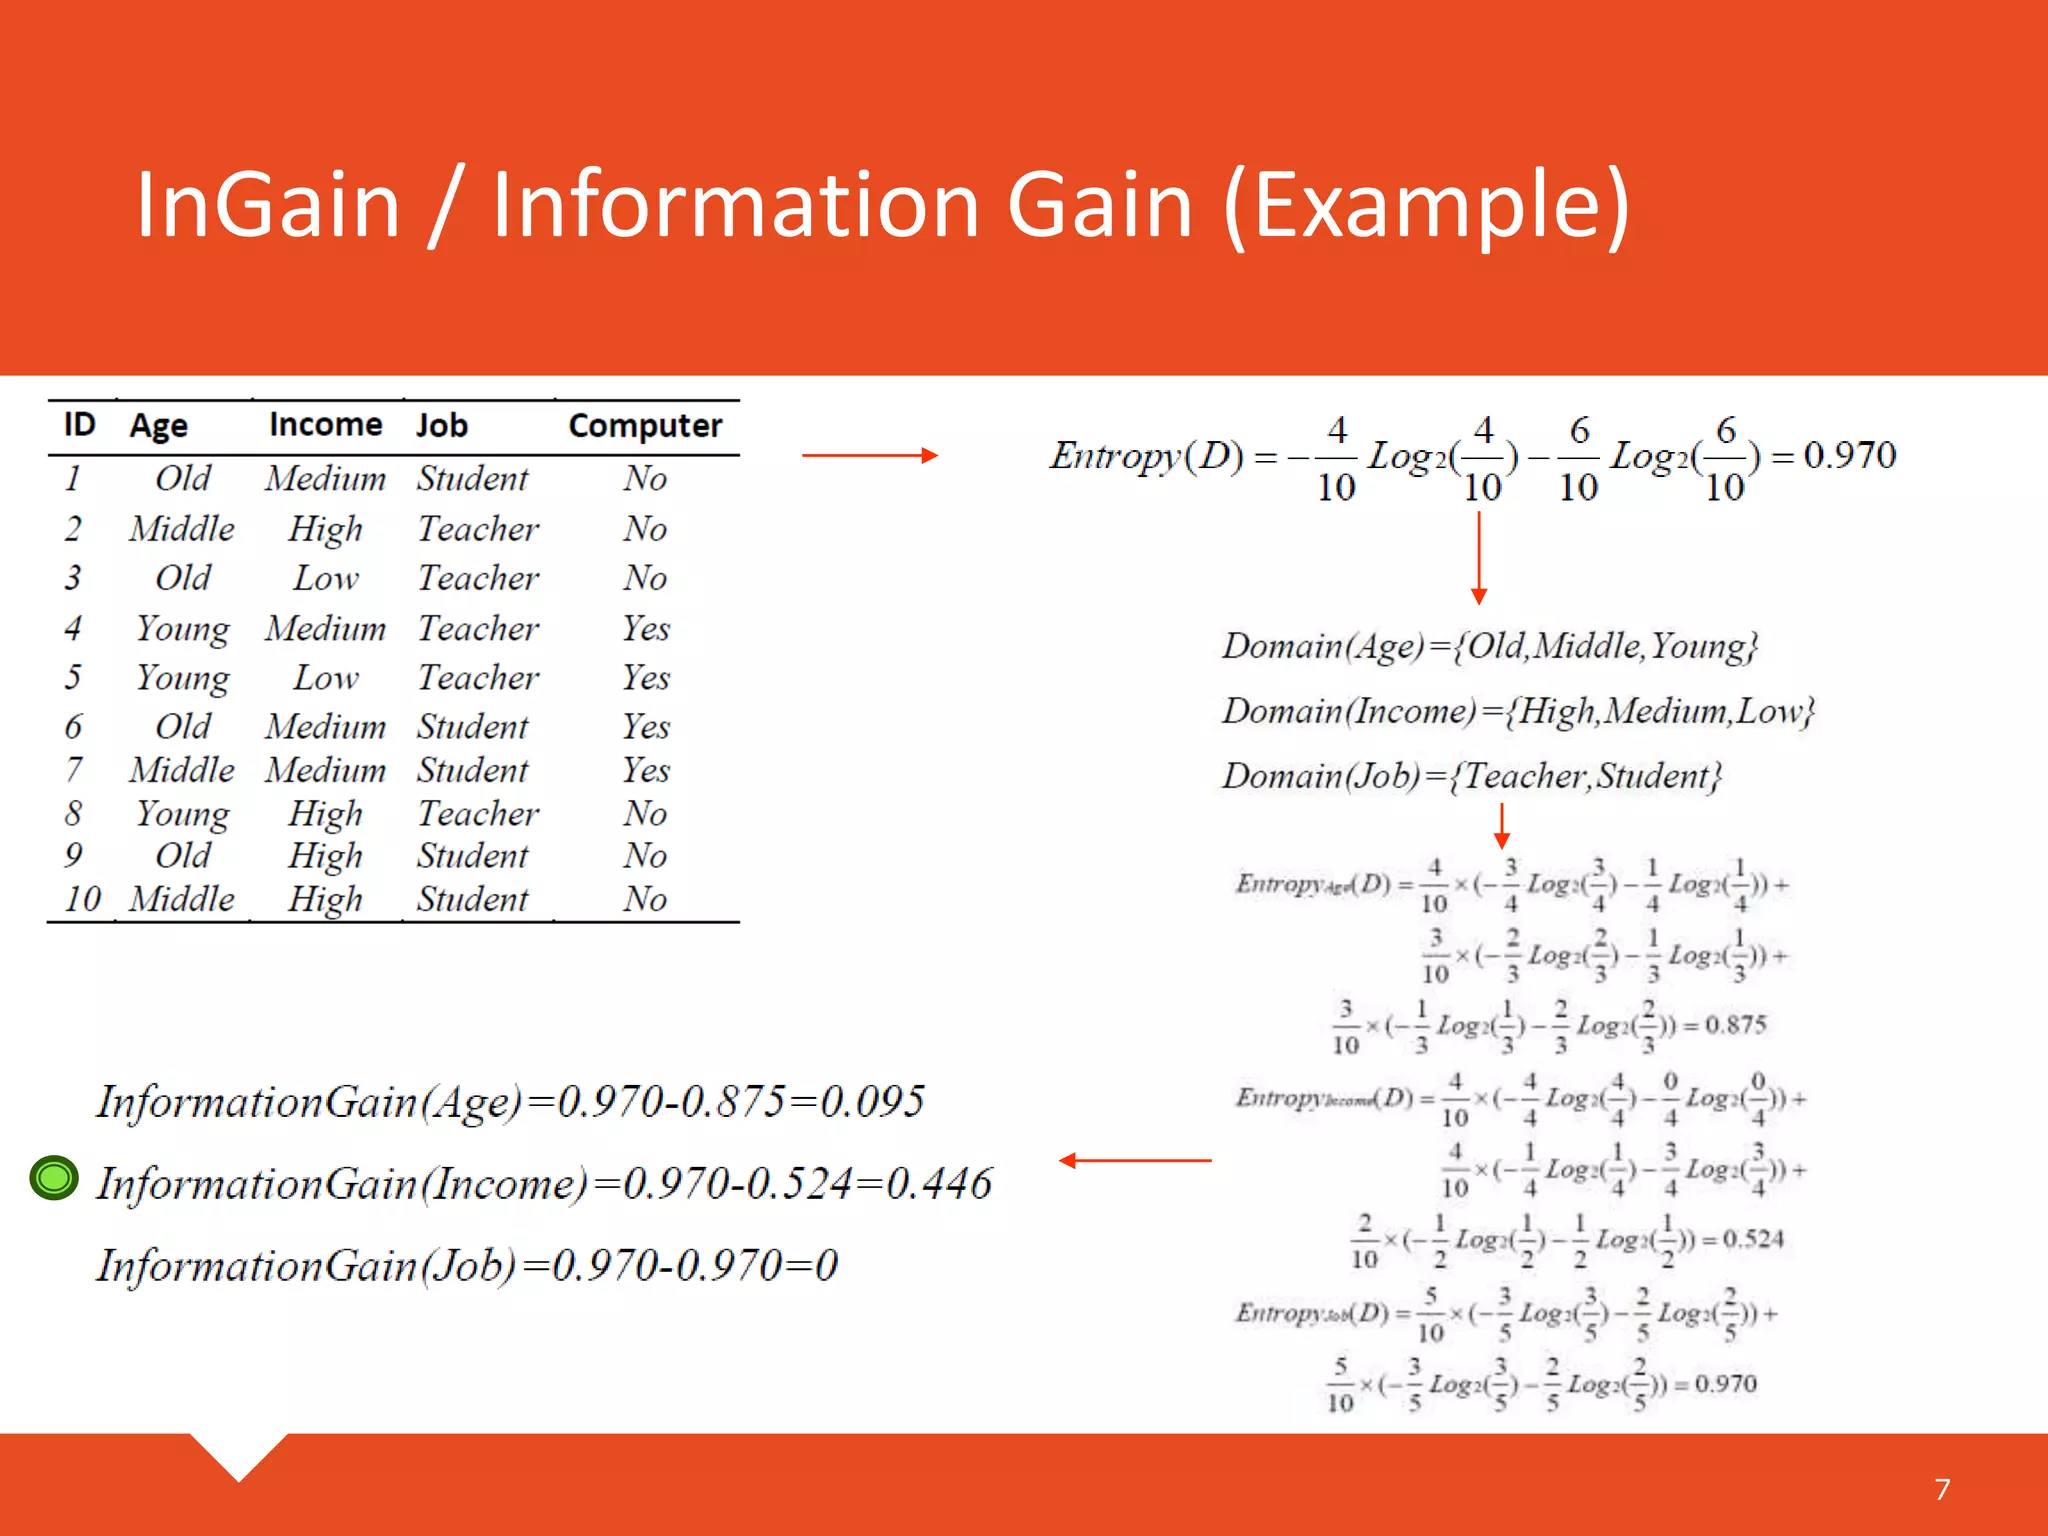
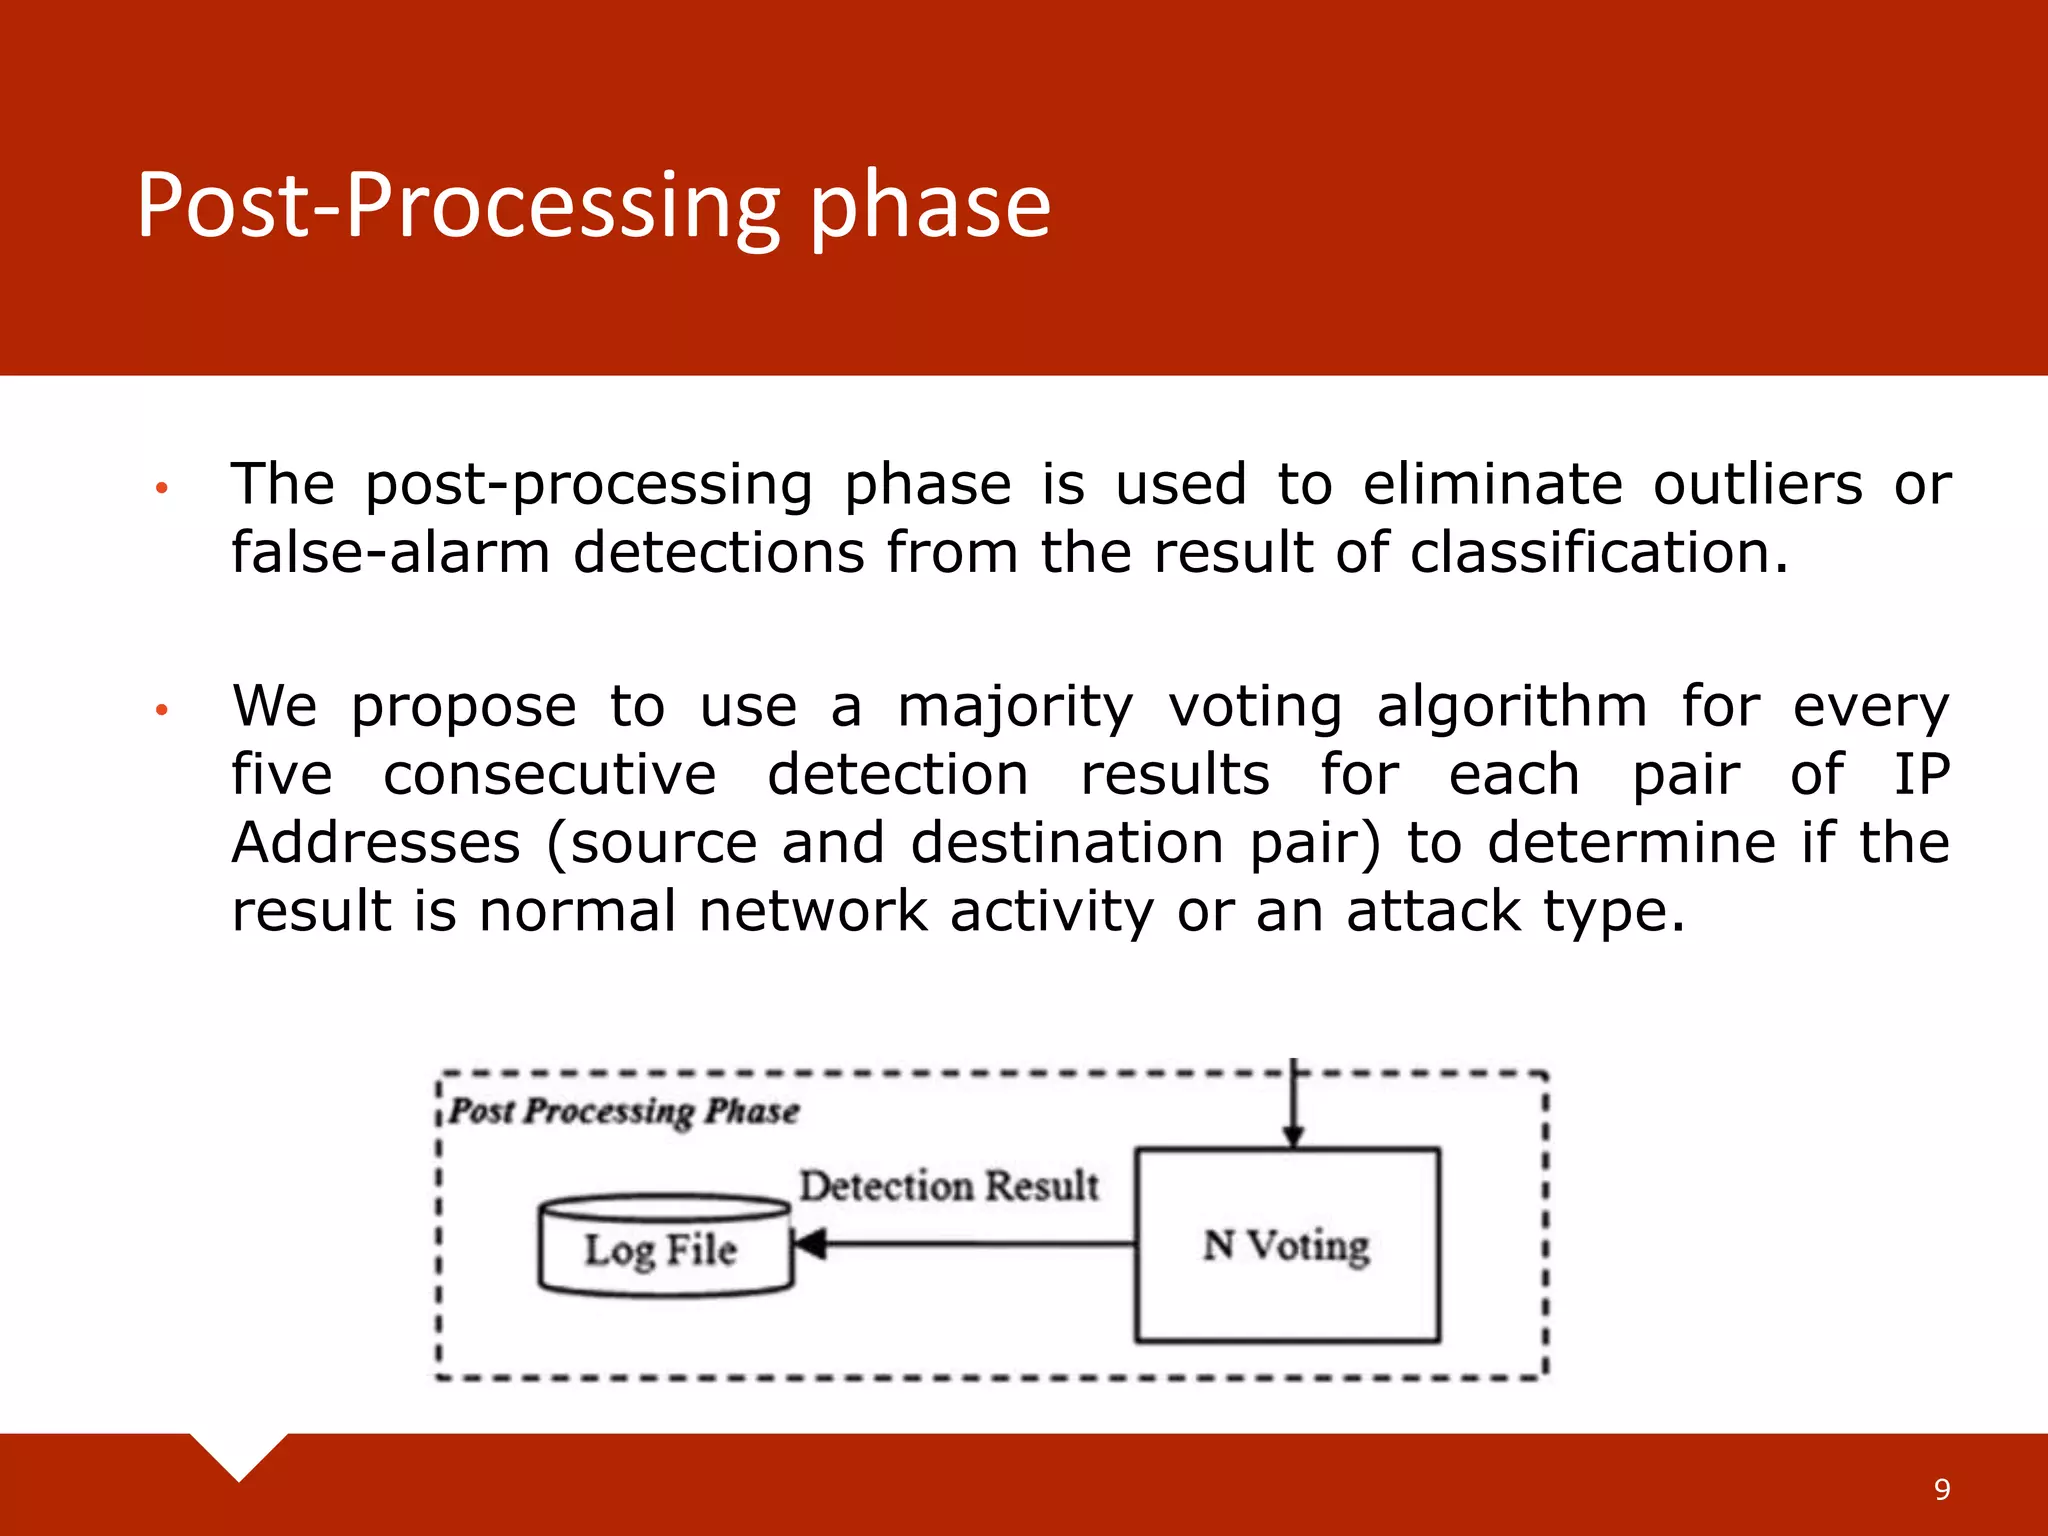
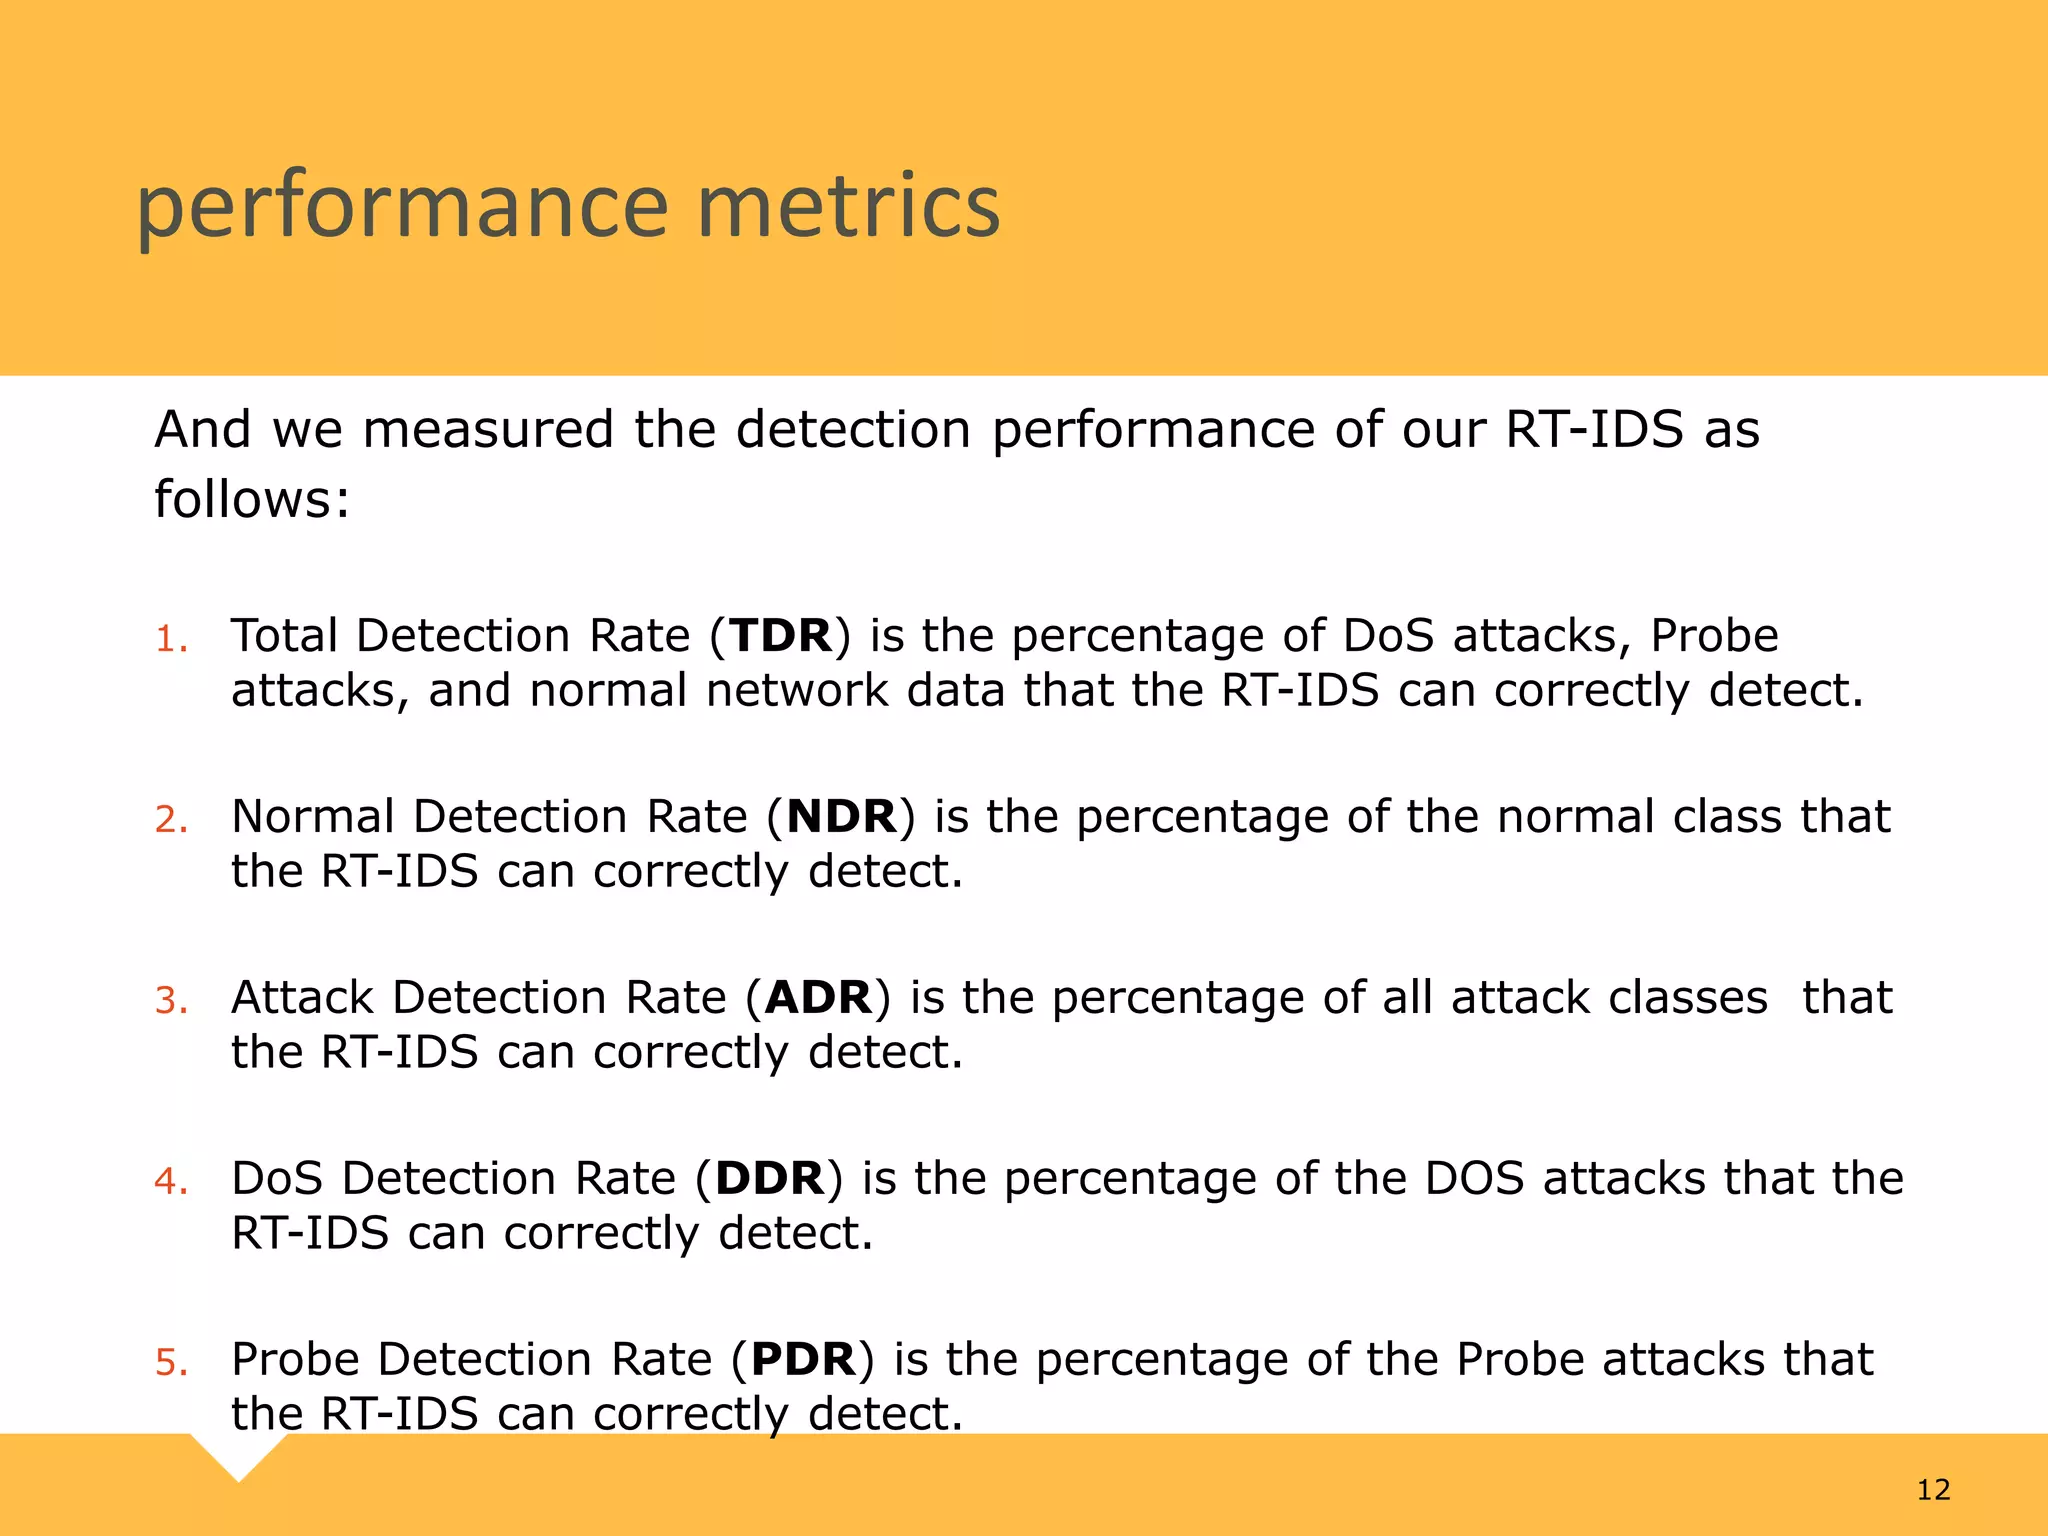
Practical real-time intrusion detection using machine learning approaches Armin shoughi May 2019
IDS / Intrusion Detection System An IDS collects information from a network or computer system, and analyzes the information for symptoms of system breaches Fig. 1. Network intrusion detection system environment. 2
IDS / Intrusion Detection System 1) 3 IDS Host-based Network-based Offline online IDS 2)
Real-time IDS process Our real-time IDS process, shown in Fig. 2, consists of three phases: • the pre-processing phase • the classification phase • and the post-processing phase 4
Pre-Processing Phase • In the pre-processing phase which is shown in the upper part of Fig. 2, we use a packet sniffer to extract network packet information including IP header, TCP header, UDP header, and ICMP header from each packet. 5
InGain / Information Gain 6 • Information Gain (InGain) is a criterion for feature selection. To use InGain, we compute an entropy value for each attribute or feature of data. • The entropy value is used for ranking features that affect data classification.
InGain / Information Gain (Example) 7
Classification phase • In the classification phase, we classify each of the preprocessed data records obtained from the preprocessing phase as normal data or attack data. • This classification phase consists of two main processes which are training and testing network data. 8
Post-Processing phase • The post-processing phase is used to eliminate outliers or false-alarm detections from the result of classification. • We propose to use a majority voting algorithm for every five consecutive detection results for each pair of IP Addresses (source and destination pair) to determine if the result is normal network activity or an attack type. 9
Experiments and performance evaluation In this section, we present the experimental results and performance evaluation of our proposed real-time IDS. We • first present the network data used in the experiment. • We then describe our experimental design and performance metrics used for evaluating the real-time IDS. • Finally, we present the experimental results. 10
Experimental Data • Our experimental network data consists of four DoS attack types, 13 Probe attack types, and normal activity as presented in Table 3. • All attack types were generated using many different tools as shown in the table, while the normal network data was captured from the actual network environment. 11
performance metrics And we measured the detection performance of our RT-IDS as follows: 1. Total Detection Rate (TDR) is the percentage of DoS attacks, Probe attacks, and normal network data that the RT-IDS can correctly detect. 2. Normal Detection Rate (NDR) is the percentage of the normal class that the RT-IDS can correctly detect. 3. Attack Detection Rate (ADR) is the percentage of all attack classes that the RT-IDS can correctly detect. 4. DoS Detection Rate (DDR) is the percentage of the DOS attacks that the RT-IDS can correctly detect. 5. Probe Detection Rate (PDR) is the percentage of the Probe attacks that the RT-IDS can correctly detect. 12
Experimental design 13 We performed three experiments to evaluate our RT-IDS. 1. Experimental results with off-line detection 2. Experimental results with on-line detection (real-time IDS) 3. Experimental results with post-processing procedure
Experimental results with off-line detection The experimental results with RLD09 dataset are presented in Table. All classification techniques gave total detection rates higher than 99% as well. 14
Experimental results with on-line detection (real-time IDS) The experimental results with RLD09 dataset are presented in Table. All classification techniques gave total detection rates higher than 99% as well. 15
Experimental results with post-processing procedure The results of our IDS with post-processing and without the post-processing procedure are compared in detail as shown in Table. 16
Experimental results with post-processing procedure 17 When capturing network traffic with full load (100 Mbps), our RT-IDS consumes less than 25% of CPU resources while using only 94.5 MB of memory.

Practical real-time intrusion detection using machine learning approaches

  • 1.
    Practical real-time intrusion detectionusing machine learning approaches Armin shoughi May 2019
  • 2.
    IDS / IntrusionDetection System An IDS collects information from a network or computer system, and analyzes the information for symptoms of system breaches Fig. 1. Network intrusion detection system environment. 2
  • 3.
    IDS / IntrusionDetection System 1) 3 IDS Host-based Network-based Offline online IDS 2)
  • 4.
    Real-time IDS process Ourreal-time IDS process, shown in Fig. 2, consists of three phases: • the pre-processing phase • the classification phase • and the post-processing phase 4
  • 5.
    Pre-Processing Phase • Inthe pre-processing phase which is shown in the upper part of Fig. 2, we use a packet sniffer to extract network packet information including IP header, TCP header, UDP header, and ICMP header from each packet. 5
  • 6.
    InGain / InformationGain 6 • Information Gain (InGain) is a criterion for feature selection. To use InGain, we compute an entropy value for each attribute or feature of data. • The entropy value is used for ranking features that affect data classification.
  • 7.
    InGain / InformationGain (Example) 7
  • 8.
    Classification phase • Inthe classification phase, we classify each of the preprocessed data records obtained from the preprocessing phase as normal data or attack data. • This classification phase consists of two main processes which are training and testing network data. 8
  • 9.
    Post-Processing phase • Thepost-processing phase is used to eliminate outliers or false-alarm detections from the result of classification. • We propose to use a majority voting algorithm for every five consecutive detection results for each pair of IP Addresses (source and destination pair) to determine if the result is normal network activity or an attack type. 9
  • 10.
    Experiments and performance evaluation Inthis section, we present the experimental results and performance evaluation of our proposed real-time IDS. We • first present the network data used in the experiment. • We then describe our experimental design and performance metrics used for evaluating the real-time IDS. • Finally, we present the experimental results. 10
  • 11.
    Experimental Data • Ourexperimental network data consists of four DoS attack types, 13 Probe attack types, and normal activity as presented in Table 3. • All attack types were generated using many different tools as shown in the table, while the normal network data was captured from the actual network environment. 11
  • 12.
    performance metrics And wemeasured the detection performance of our RT-IDS as follows: 1. Total Detection Rate (TDR) is the percentage of DoS attacks, Probe attacks, and normal network data that the RT-IDS can correctly detect. 2. Normal Detection Rate (NDR) is the percentage of the normal class that the RT-IDS can correctly detect. 3. Attack Detection Rate (ADR) is the percentage of all attack classes that the RT-IDS can correctly detect. 4. DoS Detection Rate (DDR) is the percentage of the DOS attacks that the RT-IDS can correctly detect. 5. Probe Detection Rate (PDR) is the percentage of the Probe attacks that the RT-IDS can correctly detect. 12
  • 13.
    Experimental design 13 We performedthree experiments to evaluate our RT-IDS. 1. Experimental results with off-line detection 2. Experimental results with on-line detection (real-time IDS) 3. Experimental results with post-processing procedure
  • 14.
    Experimental results withoff-line detection The experimental results with RLD09 dataset are presented in Table. All classification techniques gave total detection rates higher than 99% as well. 14
  • 15.
    Experimental results withon-line detection (real-time IDS) The experimental results with RLD09 dataset are presented in Table. All classification techniques gave total detection rates higher than 99% as well. 15
  • 16.
    Experimental results withpost-processing procedure The results of our IDS with post-processing and without the post-processing procedure are compared in detail as shown in Table. 16
  • 17.
    Experimental results withpost-processing procedure 17 When capturing network traffic with full load (100 Mbps), our RT-IDS consumes less than 25% of CPU resources while using only 94.5 MB of memory.