Proceedings of the 2nd International Conference on Current Trends in Engineering and Management ICCTEM -2014 INTERNATIONAL JOURNAL OF ELECTRONICS AND 17 – 19, July 2014, Mysore, Karnataka, India COMMUNICATION ENGINEERING TECHNOLOGY (IJECET) ISSN 0976 – 6464(Print) ISSN 0976 – 6472(Online) Volume 5, Issue 8, August (2014), pp. 150-159 © IAEME: http://www.iaeme.com/IJECET.asp Journal Impact Factor (2014): 7.2836 (Calculated by GISI) www.jifactor.com 150 IJECET © I A E M E PERFORMANCE ENHANCED BEAMFORMING ALGORITHMS FOR MIMO SYSTEMS Arjun K R1, Iffath Fawad2, Prasanna Kulkarni3 1Assistant Professor, Dept of ECE, Vidhyavardhaka College of Engineering, Mysore, India. 2Assistant Professor, Dept of ECE, Islamiah Institute of Technology, Bangalore, India. 3Assistant Professor, Dept of ECE, T.John Institute of Technology, Bangalore, India. ABSTRACT The increasing capacity and quality demands for Multiple-Input-Multiple-Output (MIMO) services without a corresponding increase in RF spectrum allocation motivate the need for new techniques to improve spectrum utilization. Smart Antenna comprises of two functions viz. Angle Of Arrival (AOA) and Adaptive Beamforming (ABF). In this paper Beamforming algorithms namely Least Mean Square (LMS), Sign Error LMS (SE-LMS), Sign Data LMS (SD-LMS), Sign Sign LMS (SS-LMS) algorithm’s were simulated for various look directions and jammer configurations and their MSE characteristics and phase transients are compared. Performance of SD-LMS algorithm is studied by varying the step size. SS-Beamforming algorithm is also implemented on DSP kit TMS320C6713 and compared with simulation result. Keywords: Adaptive Array Beamforming, LMS Algorithm, Sign Algorithms, MSE, MIMO. INTRODUCTION SMART antenna systems employing multiple antennas promises increased system capacity, extended radio coverage and improved quality of service through the ability to steer the antenna pattern in the direction of desired user while placing nulls at interferer locations [1]–[3]. Adding more antennas to the array gives higher angle resolution while steering the beam and more degrees of freedom in placing the nulls, but it results in increase of computational complexity and latency in calculating the weight vectors, which are used to process the received signals at the antennas. In Switched-beam approach a set of weight vectors are pre-calculated and stored for different angles, hence there is less computational complexity. In fully adaptive systems, however, a new weight vector is calculated adaptively with the change in the angle of the user and/or an
Proceedings of the 2nd International Conference on Current Trends in Engineering and Management ICCTEM -2014 17 – 19, July 2014, Mysore, Karnataka, India interferer. The adaptive approach, therefore, offers accurate tracing of the user angle at the cost of increased computational complexity. l . 151 0 ( ) (q ) ( ) (q ) ( ) ( ) (1) i x n a s n a i n n n The computational requirements of conventional LMS algorithm is high, therefore we need to devise methods to reduce complexity of beamforming algorithm without considerable degradation in performance. In this paper well Known LMS algorithm is modified to make it suitable for high speed digital communication systems by reducing the complexity in the weight vector updation. The LMS algorithm is modified to obtain SE-LMS, SD-LMS and SS-LMS algorithms. II. FORMULATION OF ADAPTIVE BEAMFORMING Figure 1: Uniform Linear Array A uniform linear array is as shown in Figure(1), which consists of L equi-spaced omni-directional sensors with inter-element spacing of 2 It receives M narrowband interference signals, one desired signal s(n) and noise signal n(n) .The received data vector x(n) is given by: M = = + × + i 1 Where, ( ) 0 a q is the desired steering vector and ( ) i a q is the steering vector for the ith interference signal [3]. If w(n) is the complex weight then the output of a linear beamformer is: y(n) w(n) x(n) (2) T = w(n) are usually estimated through the minimization of error e(n) given by: e(n) = s(n) − y(n) (3) III. LEAST MEAN SQUARE ALGORITHM (LMS) The LMS algorithm is the most widely used adaptive beamforming algorithm, being employed in several communication applications. The LMS algorithm changes the weight vector
Proceedings of the 2nd International Conference on Current Trends in Engineering and Management ICCTEM -2014 17 – 19, July 2014, Mysore, Karnataka, India w(n) along the direction of the estimated gradient based on the steepest descent method. The weight vector updation for LMS algorithm is given by: 152 ( 1) ( ) ( ) ( ) ( 4 ) * w n + w n + μ e n x n Where,μ is the step size controlling the convergence characteristics of beamforming algorithm given by: ( 5 ) 2 3 ( ) 0 xx tr R £ μ £ ( ) xx tr R is the trace of auto correlation matrix. IV. SIGN ERROR LMS ALGORITHM (SE-LMS) LMS algorithm is computationally efficient but the convergence rate is low and complexity is high. Therefore, the LMS algorithm is to be modified to achieve better convergence and reduced complexity by using SE-LMS. The array weight coefficients of LMS are modified by applying sign operator to error e(n) given by : w(n + 1) = w(n) + μ x(n) sgn( e(n)) (6) Where, sgn(e(n)) is given by (7) 1 ( ) 0 = e n 0 e ( n ) 0 1 ( ) 0 sgn( ( )) − = e n e n The SE-LMS algorithm is also known as Least Mean Absolute Value (LMAV) algorithm. The sign error algorithm can be viewed as the result of applying two level quantizer to error e(n). V. SIGN DATA LMS ALGORITHM (SD-LMS) This is similar to SE-LMS, instead of using the sgn operator for error, the computational requirement of the LMS algorithm may be simplified by applying sgn operator to the data as: w(n +1) = w(n) + μ sgn(x(n)) e(n) (8) Where, sgn(x(n)) is sign of data vector given by : (9 ) ( ) x n ( ) sgn( ( )) x n x n = The disadvantage of SD-LMS algorithm is that it sometimes alters the direction of weight vectors.
Proceedings of the 2nd International Conference on Current Trends in Engineering and Management ICCTEM -2014 17 – 19, July 2014, Mysore, Karnataka, India VI. SIGN SIGN LMS ALGORITHM (SS-LMS) l an optimum value to avoid grating lobes 153 In this algorithm we quantize both error and data by applying sgn operator. The weight update equation is: w(n+1)=w(n)+μ sgn(x(n))sgn(e(n)) (10) VII. SIMULATION RESULTS The performance of all Beamforming algorithms stated has been studied by means of MATLAB simulation. For comparison purpose, result obtained with the conventional LMS algorithm is also presented. For Simulation the following assumptions are considered 1. Mutual Coupling effects are zero between antenna elements 2. Distance between antenna elements is 2 3. Look Direction and jammer directions have been determined aprior. 4. The propagation environment is stationary. 5. Number of array elements is 100. CASE (A): Beamforming Result for LMS Look Direction=450 Interference Directions=100 and 300. Figure (2): Polar Plot of LMS algorithm From the Fig(2) it is clear that LMS algorithm is able to form the main beam in the look direction of 450 and nulls in the direction of interferers i.e 100 and 300.
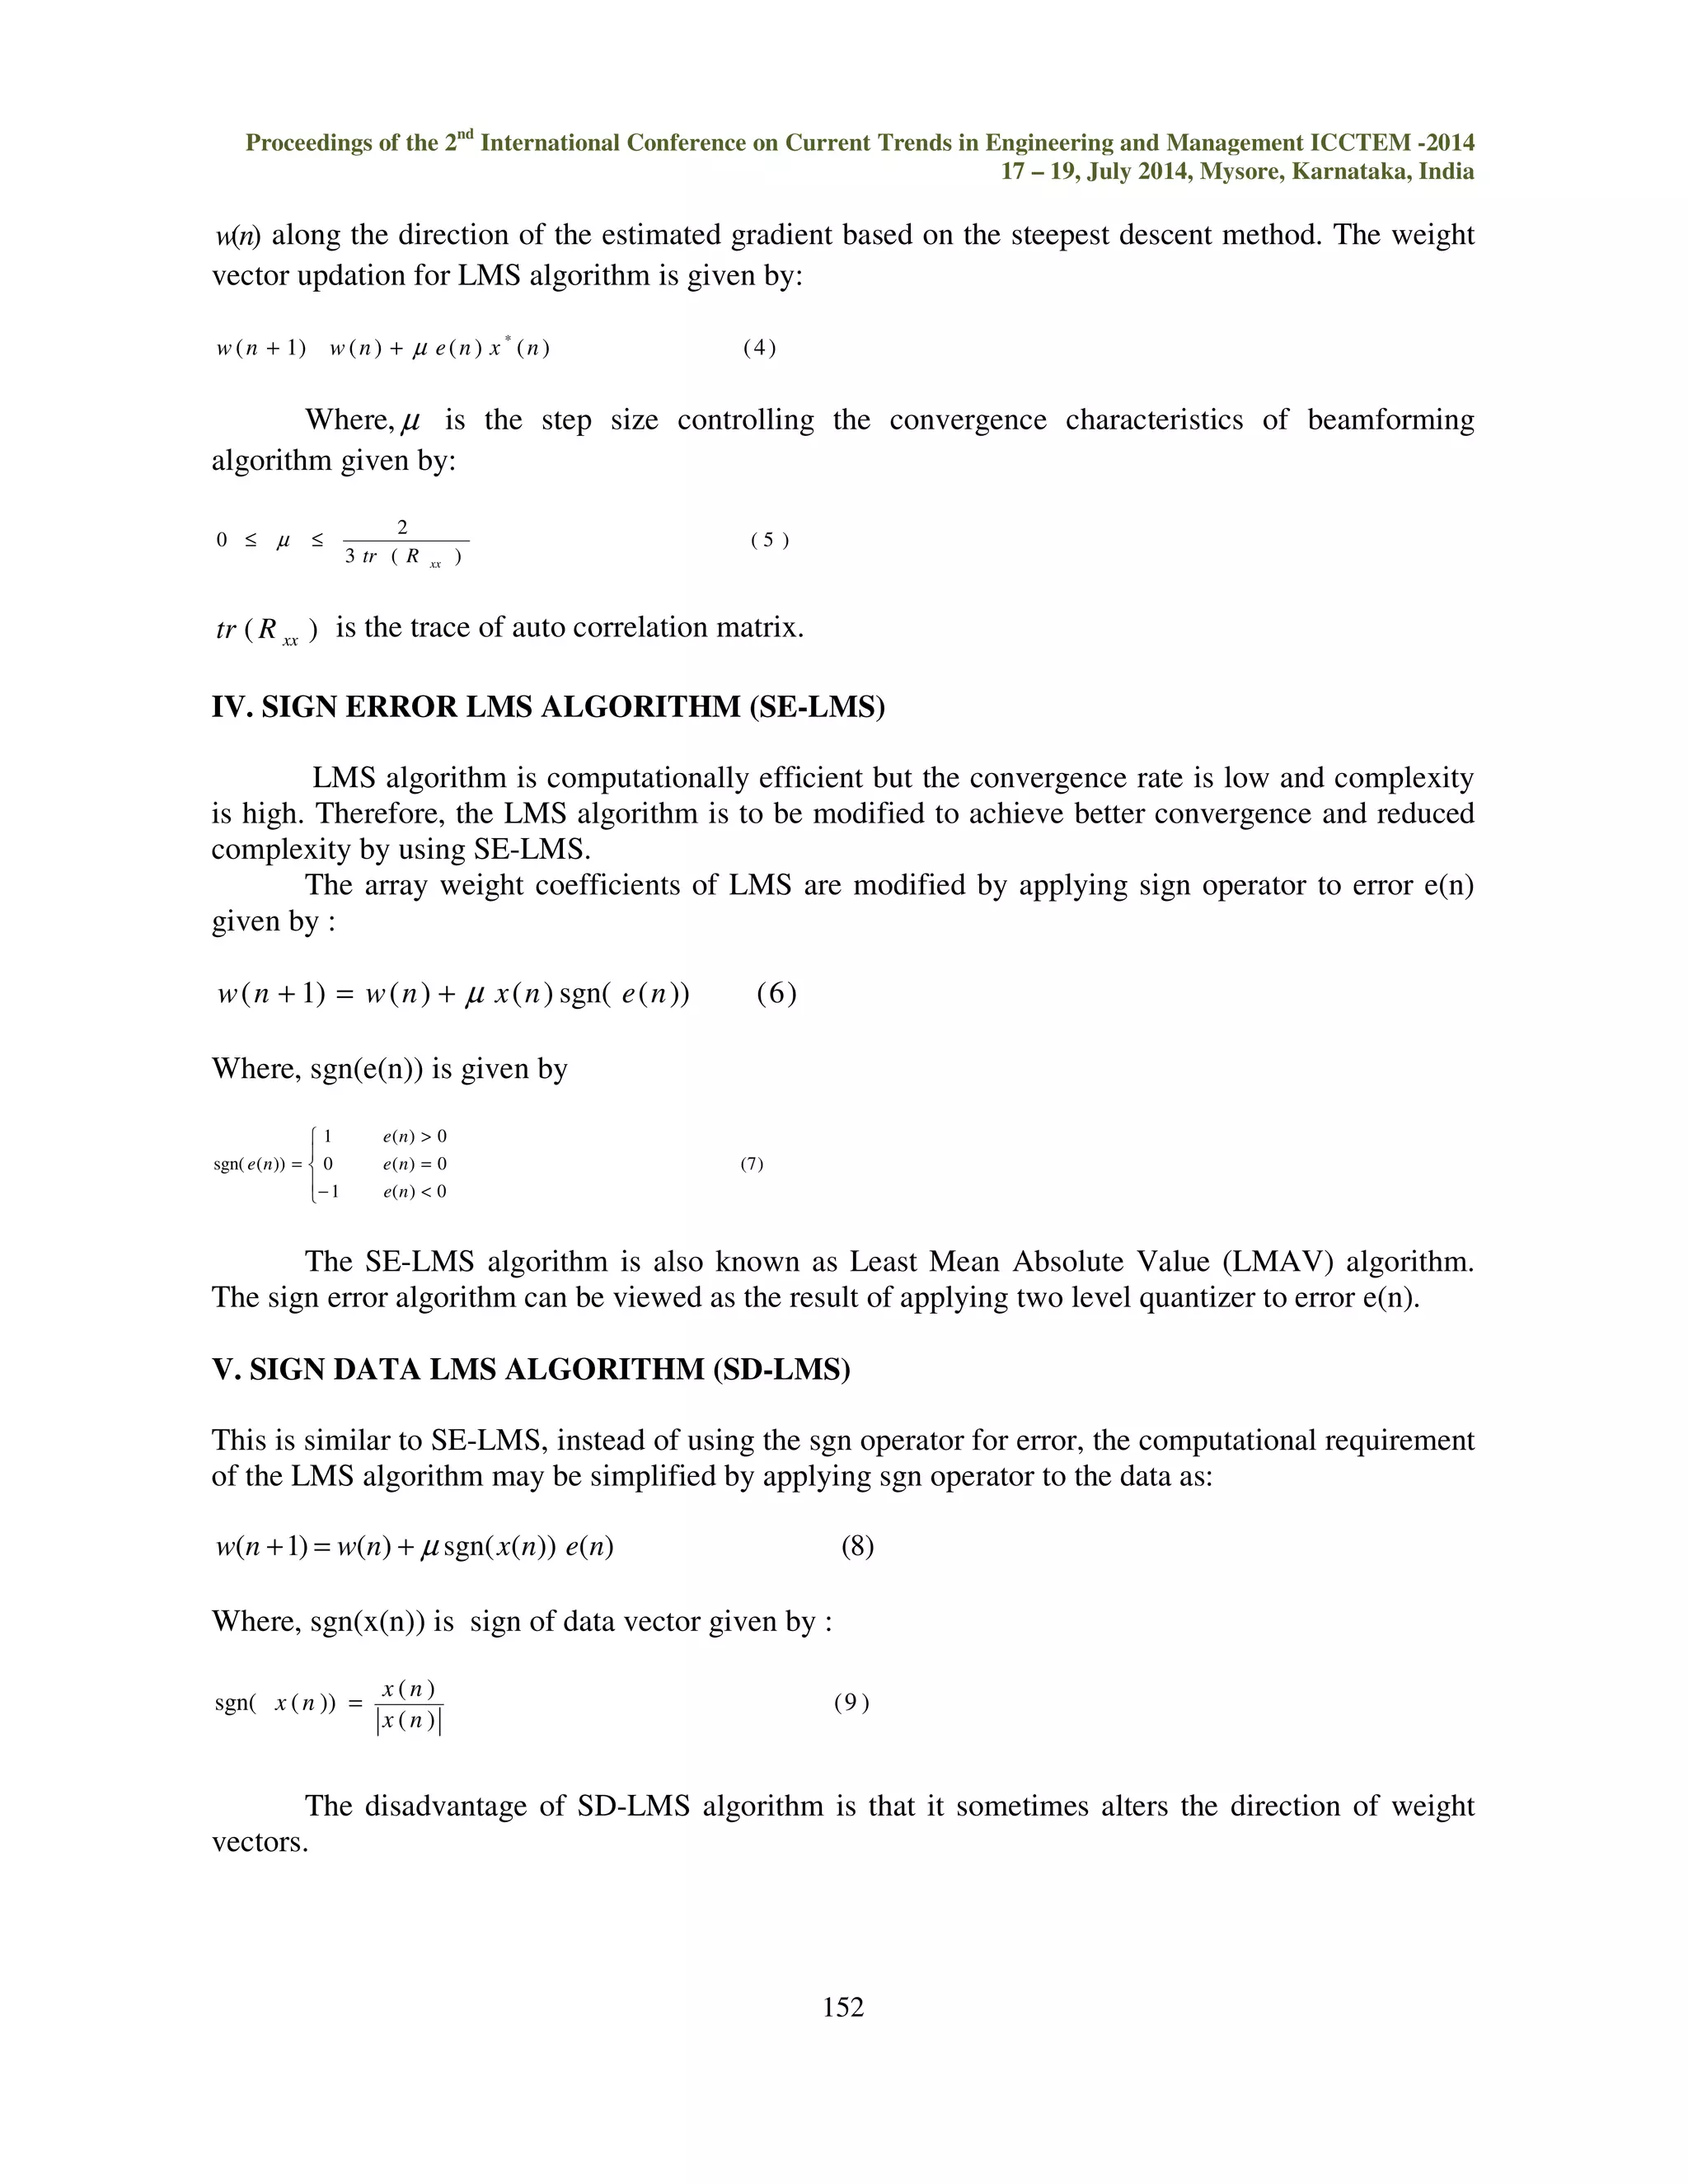
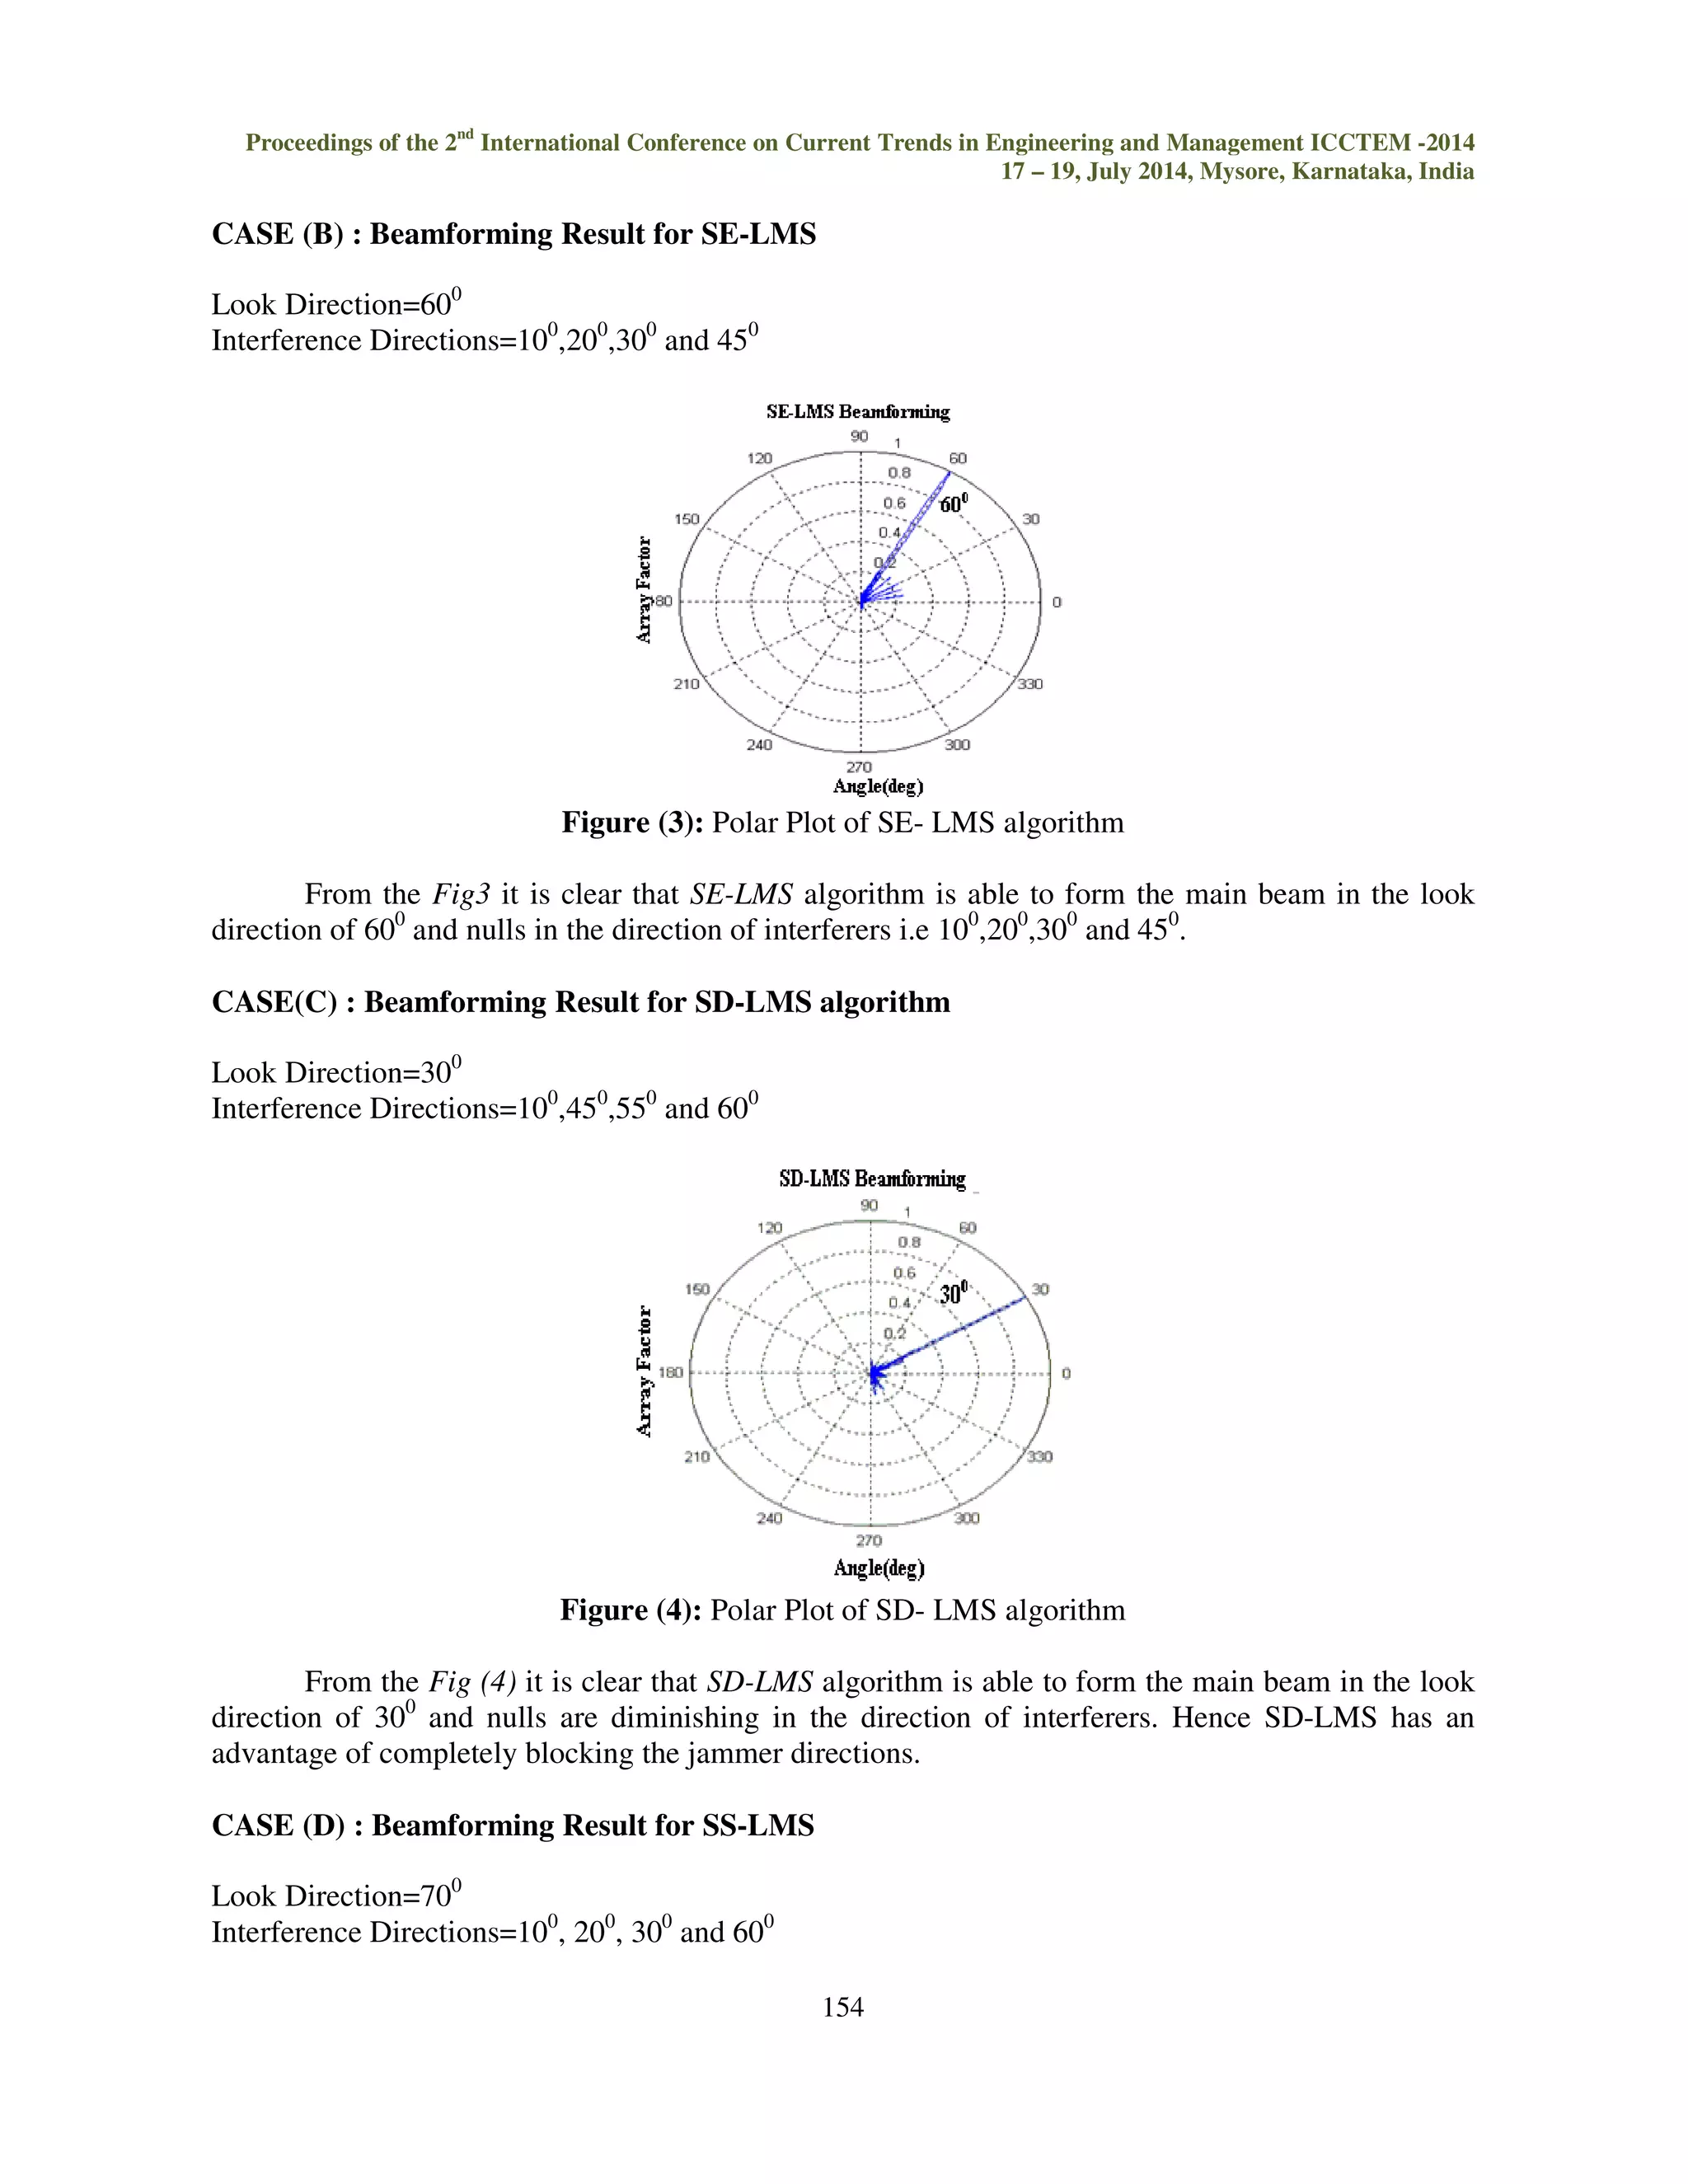
Proceedings of the 2nd International Conference on Current Trends in Engineering and Management ICCTEM -2014 17 – 19, July 2014, Mysore, Karnataka, India 154 CASE (B) : Beamforming Result for SE-LMS Look Direction=600 Interference Directions=100,200,300 and 450 Figure (3): Polar Plot of SE- LMS algorithm From the Fig3 it is clear that SE-LMS algorithm is able to form the main beam in the look direction of 600 and nulls in the direction of interferers i.e 100,200,300 and 450. CASE(C) : Beamforming Result for SD-LMS algorithm Look Direction=300 Interference Directions=100,450,550 and 600 Figure (4): Polar Plot of SD- LMS algorithm From the Fig (4) it is clear that SD-LMS algorithm is able to form the main beam in the look direction of 300 and nulls are diminishing in the direction of interferers. Hence SD-LMS has an advantage of completely blocking the jammer directions. CASE (D) : Beamforming Result for SS-LMS Look Direction=700 Interference Directions=100, 200, 300 and 600
Proceedings of the 2nd International Conference on Current Trends in Engineering and Management ICCTEM -2014 17 – 19, July 2014, Mysore, Karnataka, India 155 Figure (5): Polar Plot of SS- LMS algorithm From the Fig (5) it is clear that SS-LMS algorithm is able to form the main beam in the look direction of 700 and nulls are in the direction of interferers. CASE (E): Weight Vector Computation The performance of various algorithms is compared in terms of phase variations applied to individual array elements by performing 100 runs. LMS algorithm has the larger variations in phase shifts whereas sign algorithms have lesser variation’s in phase as depicted in simulation curves of Fig (6). Figure(6): Array weigths of Beamforming algorithms CASE(F) : Effect of Change in Step Size on MSE Figure(7): MSE of SD-LMS algorithm
Proceedings of the 2nd International Conference on Current Trends in Engineering and Management ICCTEM -2014 17 – 19, July 2014, Mysore, Karnataka, India 156 The performance of SD-LMS is studied by varying the step size. From the simulation curve of Fig (7) it is clear that as the step size increses the the algorithm takes more iterations to converge. CASE(G): Effect of Change in Step Size on weight magnitude Figure(8): Step Size Variation Effects The performance of SD-LMS algorithm is studied by varying the step size.As the step size is incresed the weigth vector magnitude has large amount of variations. Hence it is good to choose smaller step size for better performance as shown in simulation curve of Figure(8). CASE (G): Error Vector Magnitude (EVM) measurement of Beamforming algorithms For a complex signal, it is also convenient to make use of the Error Vector Magnitude (EVM) as an accurate measure of any distortion introduced by the adaptive scheme on the received signal [8]. The EVM is given by: ( ) ( ) (11) 1 rms r t S j S j 1 2 0 K = = − j KP EVM Where, K is the number of observations used, S ( j) r is the normalized jth output of the beamformer and S ( j ) t is the jth transmit signal. 0 P is the normalized transmit signal power. K= Number of observations= 100. Table (1): Simulation Results of EVM Algorithm EVM LMS 0.9870 SE-LMS 0.9760 SD-LMS 0.9582 SS-LMS 0.9844 From the MATLAB simulation results of TABLE(1) it is clear that the EVM of SD-LMS algorithm is less as compared to other algorithms.
Proceedings of the 2nd International Conference on Current Trends in Engineering and Management ICCTEM -2014 17 – 19, July 2014, Mysore, Karnataka, India CASE (H): Computation Complexity Execution Speed 157 Computation complexity is also a good performance index to measure the efficiency of Beamforming algorithms. If L is number of array elements and N is number of iterations. Table (2): Computation Complexity of Beamforming Algorithm Number of Additions Number of Multiplications LMS N (L+1) N(L+2) SE-LMS N N SD-LMS N(2L+4) N(2L-2) SS-LMS N NL From the TABLE(2) SE-LMS requires least number of multiplication’s and additions followed by SS-LMS where as conventional LMS requires large amount of multiplications. Table(3): Execution Speed of Beamforming Beamforming algorithm Execution Time in seconds L.M.S 0. 8541 SD-LMS 0.3084 SE-LMS 0.2297 SS-LMS 0.4780 From the TABLE (3) it is clear that SE-LMS takes least amount of execution time followed by SD-LMS as compared to conventional LMS. VIII.IMPLEMENTATION RESULTS ON TMSC3206713 In this section graphs for real and imaginary phase shifts obtained using DSP kit for SS-LMS algorithm are presented. Table (4): Input to SS-LMS Beamformer Algorithm Number of Array Elements Look Direction Jammer Directions SS-LMS 8 300 [100,200,700] Figure (9): DSP kit Output for real array weights calculation using SS-LMS Algorithm
Proceedings of the 2nd International Conference on Current Trends in Engineering and Management ICCTEM -2014 17 – 19, July 2014, Mysore, Karnataka, India 158 Fig(9)gives the real part of array weights calculated on DSP kit. ‘w(i)’ indicates array weight, i is the index corresponding to antenna element. Figure (10): DSP kit Output for imaginary array weights calculation using SS-LMS Algorithm Figure (10) gives the imaginary part of array weights calculated on DSP kit. IX. COMPARISON OF SIMULATION AND IMPLEMENTATION RESULTS Figure (11): Comparison of MATLAB and DSP kit Result for SS-LMS Figure(11) provides the comparison of weigth vector obtained using MATLAB and DSP kit. Both the weigth vector’s almost Converges. X.CONCLUSION LMS algorithm is modified to obtain sign algorithms of beamforming by applying the sgn operator to error, data and both. It is shown that sign algorithms have reduced Error Vector Magnitude, complexity and execution speed as compared to conventional LMS algorithm. Simulation curves also reveal that the phase transients of LMS are higher as compared to Sign algorithms. Performance of SD-LMS is simulated by varying step size. REFERENCES [1] Z. Zhang, M. F. Iskander, Z. Yun, and A. Host-Madsen, “Hybrid smart antenna system using directional elements performance analysis in flat Rayleigh fading,” IEEE Trans. Antennas Propag., vol. 51, no. 10, pp. 2926–2935, Oct. 2003.
Proceedings of the 2nd International Conference on Current Trends in Engineering and Management ICCTEM -2014 17 – 19, July 2014, Mysore, Karnataka, India 159 [2] M. Rezk,W. Kim, Z. Yun, and M. F. Iskander, “Performance comparison of a novel hybrid smart antenna system versus the fully adaptive and switched beam antenna arrays,” IEEE Antennas Wireless Propag. Lett., vol. 4, pp. 285–288, 2005. [3] L. C. Godara, “Applications of antenna arrays to mobile communications, part II: beam-forming and direction-of-arrival considerations,” Proc. IEEE, vol. 85, no. 8, pp. 1195–1245, Aug. 1997. [4] Guancheng Lin, Yaan Li, and Beili Jin, “Research on Support Vector Machines Framework for Uniform Arrays Beamforming”, IEEE International Conference on Intelligent Computation Technology and Automation, 2010. [5] O. Tanrikulu and A. G. Constantinides, “Least-mean kurtosis: A novel higher-order statistics based adaptive filtering algorithm” Electron.letter., vol. 30, no. 3, pp. 189–190, Feb. 1994. [6] T. Aboulnasr and K. Mayyas, “A robust variable step-size LMS-type algorithm: Analysis and simulations,” IEEE Trans. Signal Process., vol. 45, no. 3, pp. 631–639, Mar. 1997. [7] D. I. Pazaitis and A. G. Constantinides, “A novel kurtosis driven variable step-size adaptive algorithm,” IEEE Trans. Signal Process., vol. 47, no. 3, pp. 864–872, Mar. 1999. [8] Arslan, H. and H. Mahmoud, Error vector magnitude to SNR conversion for nondata-aided receivers, IEEE Trans. on Wireless Communications, vol. 8(5), pp. 2694- 2704, 2009. [9] Nascimento, V.H., Improving the initial convergence of adaptive filters: variable-length LMS algorithms, 14th International Conference on Digital Signal Processing, Santorini, Greece, pp. 667-670, July 2002. [10] Zhao, S., Z. Man, and S. Khoo, A Fast Variable Step-Size LMS Algorithm with System Identification, 2ndIEEE Conference on Industrial Electronics and Applications, Harbin, China, pp. 2340-2345, May2007.

Performance enhanced beamforming algorithms for mimo systems

  • 1.
    Proceedings of the2nd International Conference on Current Trends in Engineering and Management ICCTEM -2014 INTERNATIONAL JOURNAL OF ELECTRONICS AND 17 – 19, July 2014, Mysore, Karnataka, India COMMUNICATION ENGINEERING TECHNOLOGY (IJECET) ISSN 0976 – 6464(Print) ISSN 0976 – 6472(Online) Volume 5, Issue 8, August (2014), pp. 150-159 © IAEME: http://www.iaeme.com/IJECET.asp Journal Impact Factor (2014): 7.2836 (Calculated by GISI) www.jifactor.com 150 IJECET © I A E M E PERFORMANCE ENHANCED BEAMFORMING ALGORITHMS FOR MIMO SYSTEMS Arjun K R1, Iffath Fawad2, Prasanna Kulkarni3 1Assistant Professor, Dept of ECE, Vidhyavardhaka College of Engineering, Mysore, India. 2Assistant Professor, Dept of ECE, Islamiah Institute of Technology, Bangalore, India. 3Assistant Professor, Dept of ECE, T.John Institute of Technology, Bangalore, India. ABSTRACT The increasing capacity and quality demands for Multiple-Input-Multiple-Output (MIMO) services without a corresponding increase in RF spectrum allocation motivate the need for new techniques to improve spectrum utilization. Smart Antenna comprises of two functions viz. Angle Of Arrival (AOA) and Adaptive Beamforming (ABF). In this paper Beamforming algorithms namely Least Mean Square (LMS), Sign Error LMS (SE-LMS), Sign Data LMS (SD-LMS), Sign Sign LMS (SS-LMS) algorithm’s were simulated for various look directions and jammer configurations and their MSE characteristics and phase transients are compared. Performance of SD-LMS algorithm is studied by varying the step size. SS-Beamforming algorithm is also implemented on DSP kit TMS320C6713 and compared with simulation result. Keywords: Adaptive Array Beamforming, LMS Algorithm, Sign Algorithms, MSE, MIMO. INTRODUCTION SMART antenna systems employing multiple antennas promises increased system capacity, extended radio coverage and improved quality of service through the ability to steer the antenna pattern in the direction of desired user while placing nulls at interferer locations [1]–[3]. Adding more antennas to the array gives higher angle resolution while steering the beam and more degrees of freedom in placing the nulls, but it results in increase of computational complexity and latency in calculating the weight vectors, which are used to process the received signals at the antennas. In Switched-beam approach a set of weight vectors are pre-calculated and stored for different angles, hence there is less computational complexity. In fully adaptive systems, however, a new weight vector is calculated adaptively with the change in the angle of the user and/or an
  • 2.
    Proceedings of the2nd International Conference on Current Trends in Engineering and Management ICCTEM -2014 17 – 19, July 2014, Mysore, Karnataka, India interferer. The adaptive approach, therefore, offers accurate tracing of the user angle at the cost of increased computational complexity. l . 151 0 ( ) (q ) ( ) (q ) ( ) ( ) (1) i x n a s n a i n n n The computational requirements of conventional LMS algorithm is high, therefore we need to devise methods to reduce complexity of beamforming algorithm without considerable degradation in performance. In this paper well Known LMS algorithm is modified to make it suitable for high speed digital communication systems by reducing the complexity in the weight vector updation. The LMS algorithm is modified to obtain SE-LMS, SD-LMS and SS-LMS algorithms. II. FORMULATION OF ADAPTIVE BEAMFORMING Figure 1: Uniform Linear Array A uniform linear array is as shown in Figure(1), which consists of L equi-spaced omni-directional sensors with inter-element spacing of 2 It receives M narrowband interference signals, one desired signal s(n) and noise signal n(n) .The received data vector x(n) is given by: M = = + × + i 1 Where, ( ) 0 a q is the desired steering vector and ( ) i a q is the steering vector for the ith interference signal [3]. If w(n) is the complex weight then the output of a linear beamformer is: y(n) w(n) x(n) (2) T = w(n) are usually estimated through the minimization of error e(n) given by: e(n) = s(n) − y(n) (3) III. LEAST MEAN SQUARE ALGORITHM (LMS) The LMS algorithm is the most widely used adaptive beamforming algorithm, being employed in several communication applications. The LMS algorithm changes the weight vector
  • 3.
    Proceedings of the2nd International Conference on Current Trends in Engineering and Management ICCTEM -2014 17 – 19, July 2014, Mysore, Karnataka, India w(n) along the direction of the estimated gradient based on the steepest descent method. The weight vector updation for LMS algorithm is given by: 152 ( 1) ( ) ( ) ( ) ( 4 ) * w n + w n + μ e n x n Where,μ is the step size controlling the convergence characteristics of beamforming algorithm given by: ( 5 ) 2 3 ( ) 0 xx tr R £ μ £ ( ) xx tr R is the trace of auto correlation matrix. IV. SIGN ERROR LMS ALGORITHM (SE-LMS) LMS algorithm is computationally efficient but the convergence rate is low and complexity is high. Therefore, the LMS algorithm is to be modified to achieve better convergence and reduced complexity by using SE-LMS. The array weight coefficients of LMS are modified by applying sign operator to error e(n) given by : w(n + 1) = w(n) + μ x(n) sgn( e(n)) (6) Where, sgn(e(n)) is given by (7) 1 ( ) 0 = e n 0 e ( n ) 0 1 ( ) 0 sgn( ( )) − = e n e n The SE-LMS algorithm is also known as Least Mean Absolute Value (LMAV) algorithm. The sign error algorithm can be viewed as the result of applying two level quantizer to error e(n). V. SIGN DATA LMS ALGORITHM (SD-LMS) This is similar to SE-LMS, instead of using the sgn operator for error, the computational requirement of the LMS algorithm may be simplified by applying sgn operator to the data as: w(n +1) = w(n) + μ sgn(x(n)) e(n) (8) Where, sgn(x(n)) is sign of data vector given by : (9 ) ( ) x n ( ) sgn( ( )) x n x n = The disadvantage of SD-LMS algorithm is that it sometimes alters the direction of weight vectors.
  • 4.
    Proceedings of the2nd International Conference on Current Trends in Engineering and Management ICCTEM -2014 17 – 19, July 2014, Mysore, Karnataka, India VI. SIGN SIGN LMS ALGORITHM (SS-LMS) l an optimum value to avoid grating lobes 153 In this algorithm we quantize both error and data by applying sgn operator. The weight update equation is: w(n+1)=w(n)+μ sgn(x(n))sgn(e(n)) (10) VII. SIMULATION RESULTS The performance of all Beamforming algorithms stated has been studied by means of MATLAB simulation. For comparison purpose, result obtained with the conventional LMS algorithm is also presented. For Simulation the following assumptions are considered 1. Mutual Coupling effects are zero between antenna elements 2. Distance between antenna elements is 2 3. Look Direction and jammer directions have been determined aprior. 4. The propagation environment is stationary. 5. Number of array elements is 100. CASE (A): Beamforming Result for LMS Look Direction=450 Interference Directions=100 and 300. Figure (2): Polar Plot of LMS algorithm From the Fig(2) it is clear that LMS algorithm is able to form the main beam in the look direction of 450 and nulls in the direction of interferers i.e 100 and 300.
  • 5.
    Proceedings of the2nd International Conference on Current Trends in Engineering and Management ICCTEM -2014 17 – 19, July 2014, Mysore, Karnataka, India 154 CASE (B) : Beamforming Result for SE-LMS Look Direction=600 Interference Directions=100,200,300 and 450 Figure (3): Polar Plot of SE- LMS algorithm From the Fig3 it is clear that SE-LMS algorithm is able to form the main beam in the look direction of 600 and nulls in the direction of interferers i.e 100,200,300 and 450. CASE(C) : Beamforming Result for SD-LMS algorithm Look Direction=300 Interference Directions=100,450,550 and 600 Figure (4): Polar Plot of SD- LMS algorithm From the Fig (4) it is clear that SD-LMS algorithm is able to form the main beam in the look direction of 300 and nulls are diminishing in the direction of interferers. Hence SD-LMS has an advantage of completely blocking the jammer directions. CASE (D) : Beamforming Result for SS-LMS Look Direction=700 Interference Directions=100, 200, 300 and 600
  • 6.
    Proceedings of the2nd International Conference on Current Trends in Engineering and Management ICCTEM -2014 17 – 19, July 2014, Mysore, Karnataka, India 155 Figure (5): Polar Plot of SS- LMS algorithm From the Fig (5) it is clear that SS-LMS algorithm is able to form the main beam in the look direction of 700 and nulls are in the direction of interferers. CASE (E): Weight Vector Computation The performance of various algorithms is compared in terms of phase variations applied to individual array elements by performing 100 runs. LMS algorithm has the larger variations in phase shifts whereas sign algorithms have lesser variation’s in phase as depicted in simulation curves of Fig (6). Figure(6): Array weigths of Beamforming algorithms CASE(F) : Effect of Change in Step Size on MSE Figure(7): MSE of SD-LMS algorithm
  • 7.
    Proceedings of the2nd International Conference on Current Trends in Engineering and Management ICCTEM -2014 17 – 19, July 2014, Mysore, Karnataka, India 156 The performance of SD-LMS is studied by varying the step size. From the simulation curve of Fig (7) it is clear that as the step size increses the the algorithm takes more iterations to converge. CASE(G): Effect of Change in Step Size on weight magnitude Figure(8): Step Size Variation Effects The performance of SD-LMS algorithm is studied by varying the step size.As the step size is incresed the weigth vector magnitude has large amount of variations. Hence it is good to choose smaller step size for better performance as shown in simulation curve of Figure(8). CASE (G): Error Vector Magnitude (EVM) measurement of Beamforming algorithms For a complex signal, it is also convenient to make use of the Error Vector Magnitude (EVM) as an accurate measure of any distortion introduced by the adaptive scheme on the received signal [8]. The EVM is given by: ( ) ( ) (11) 1 rms r t S j S j 1 2 0 K = = − j KP EVM Where, K is the number of observations used, S ( j) r is the normalized jth output of the beamformer and S ( j ) t is the jth transmit signal. 0 P is the normalized transmit signal power. K= Number of observations= 100. Table (1): Simulation Results of EVM Algorithm EVM LMS 0.9870 SE-LMS 0.9760 SD-LMS 0.9582 SS-LMS 0.9844 From the MATLAB simulation results of TABLE(1) it is clear that the EVM of SD-LMS algorithm is less as compared to other algorithms.
  • 8.
    Proceedings of the2nd International Conference on Current Trends in Engineering and Management ICCTEM -2014 17 – 19, July 2014, Mysore, Karnataka, India CASE (H): Computation Complexity Execution Speed 157 Computation complexity is also a good performance index to measure the efficiency of Beamforming algorithms. If L is number of array elements and N is number of iterations. Table (2): Computation Complexity of Beamforming Algorithm Number of Additions Number of Multiplications LMS N (L+1) N(L+2) SE-LMS N N SD-LMS N(2L+4) N(2L-2) SS-LMS N NL From the TABLE(2) SE-LMS requires least number of multiplication’s and additions followed by SS-LMS where as conventional LMS requires large amount of multiplications. Table(3): Execution Speed of Beamforming Beamforming algorithm Execution Time in seconds L.M.S 0. 8541 SD-LMS 0.3084 SE-LMS 0.2297 SS-LMS 0.4780 From the TABLE (3) it is clear that SE-LMS takes least amount of execution time followed by SD-LMS as compared to conventional LMS. VIII.IMPLEMENTATION RESULTS ON TMSC3206713 In this section graphs for real and imaginary phase shifts obtained using DSP kit for SS-LMS algorithm are presented. Table (4): Input to SS-LMS Beamformer Algorithm Number of Array Elements Look Direction Jammer Directions SS-LMS 8 300 [100,200,700] Figure (9): DSP kit Output for real array weights calculation using SS-LMS Algorithm
  • 9.
    Proceedings of the2nd International Conference on Current Trends in Engineering and Management ICCTEM -2014 17 – 19, July 2014, Mysore, Karnataka, India 158 Fig(9)gives the real part of array weights calculated on DSP kit. ‘w(i)’ indicates array weight, i is the index corresponding to antenna element. Figure (10): DSP kit Output for imaginary array weights calculation using SS-LMS Algorithm Figure (10) gives the imaginary part of array weights calculated on DSP kit. IX. COMPARISON OF SIMULATION AND IMPLEMENTATION RESULTS Figure (11): Comparison of MATLAB and DSP kit Result for SS-LMS Figure(11) provides the comparison of weigth vector obtained using MATLAB and DSP kit. Both the weigth vector’s almost Converges. X.CONCLUSION LMS algorithm is modified to obtain sign algorithms of beamforming by applying the sgn operator to error, data and both. It is shown that sign algorithms have reduced Error Vector Magnitude, complexity and execution speed as compared to conventional LMS algorithm. Simulation curves also reveal that the phase transients of LMS are higher as compared to Sign algorithms. Performance of SD-LMS is simulated by varying step size. REFERENCES [1] Z. Zhang, M. F. Iskander, Z. Yun, and A. Host-Madsen, “Hybrid smart antenna system using directional elements performance analysis in flat Rayleigh fading,” IEEE Trans. Antennas Propag., vol. 51, no. 10, pp. 2926–2935, Oct. 2003.
  • 10.
    Proceedings of the2nd International Conference on Current Trends in Engineering and Management ICCTEM -2014 17 – 19, July 2014, Mysore, Karnataka, India 159 [2] M. Rezk,W. Kim, Z. Yun, and M. F. Iskander, “Performance comparison of a novel hybrid smart antenna system versus the fully adaptive and switched beam antenna arrays,” IEEE Antennas Wireless Propag. Lett., vol. 4, pp. 285–288, 2005. [3] L. C. Godara, “Applications of antenna arrays to mobile communications, part II: beam-forming and direction-of-arrival considerations,” Proc. IEEE, vol. 85, no. 8, pp. 1195–1245, Aug. 1997. [4] Guancheng Lin, Yaan Li, and Beili Jin, “Research on Support Vector Machines Framework for Uniform Arrays Beamforming”, IEEE International Conference on Intelligent Computation Technology and Automation, 2010. [5] O. Tanrikulu and A. G. Constantinides, “Least-mean kurtosis: A novel higher-order statistics based adaptive filtering algorithm” Electron.letter., vol. 30, no. 3, pp. 189–190, Feb. 1994. [6] T. Aboulnasr and K. Mayyas, “A robust variable step-size LMS-type algorithm: Analysis and simulations,” IEEE Trans. Signal Process., vol. 45, no. 3, pp. 631–639, Mar. 1997. [7] D. I. Pazaitis and A. G. Constantinides, “A novel kurtosis driven variable step-size adaptive algorithm,” IEEE Trans. Signal Process., vol. 47, no. 3, pp. 864–872, Mar. 1999. [8] Arslan, H. and H. Mahmoud, Error vector magnitude to SNR conversion for nondata-aided receivers, IEEE Trans. on Wireless Communications, vol. 8(5), pp. 2694- 2704, 2009. [9] Nascimento, V.H., Improving the initial convergence of adaptive filters: variable-length LMS algorithms, 14th International Conference on Digital Signal Processing, Santorini, Greece, pp. 667-670, July 2002. [10] Zhao, S., Z. Man, and S. Khoo, A Fast Variable Step-Size LMS Algorithm with System Identification, 2ndIEEE Conference on Industrial Electronics and Applications, Harbin, China, pp. 2340-2345, May2007.