Naive Bayes Classifier Tutorial | Naive Bayes Classifier Example | Naive Bayes in R | Edureka
The document details a data science certification training course focusing on machine learning, specifically classification algorithms and the Naive Bayes classifier. It explains concepts such as supervised vs. unsupervised learning, provides examples of classification problems, and demonstrates how the Naive Bayes algorithm can be used to predict outcomes, such as employee salary based on various attributes. Additionally, it highlights the implementation process, model optimization, and validation for accurate predictions.
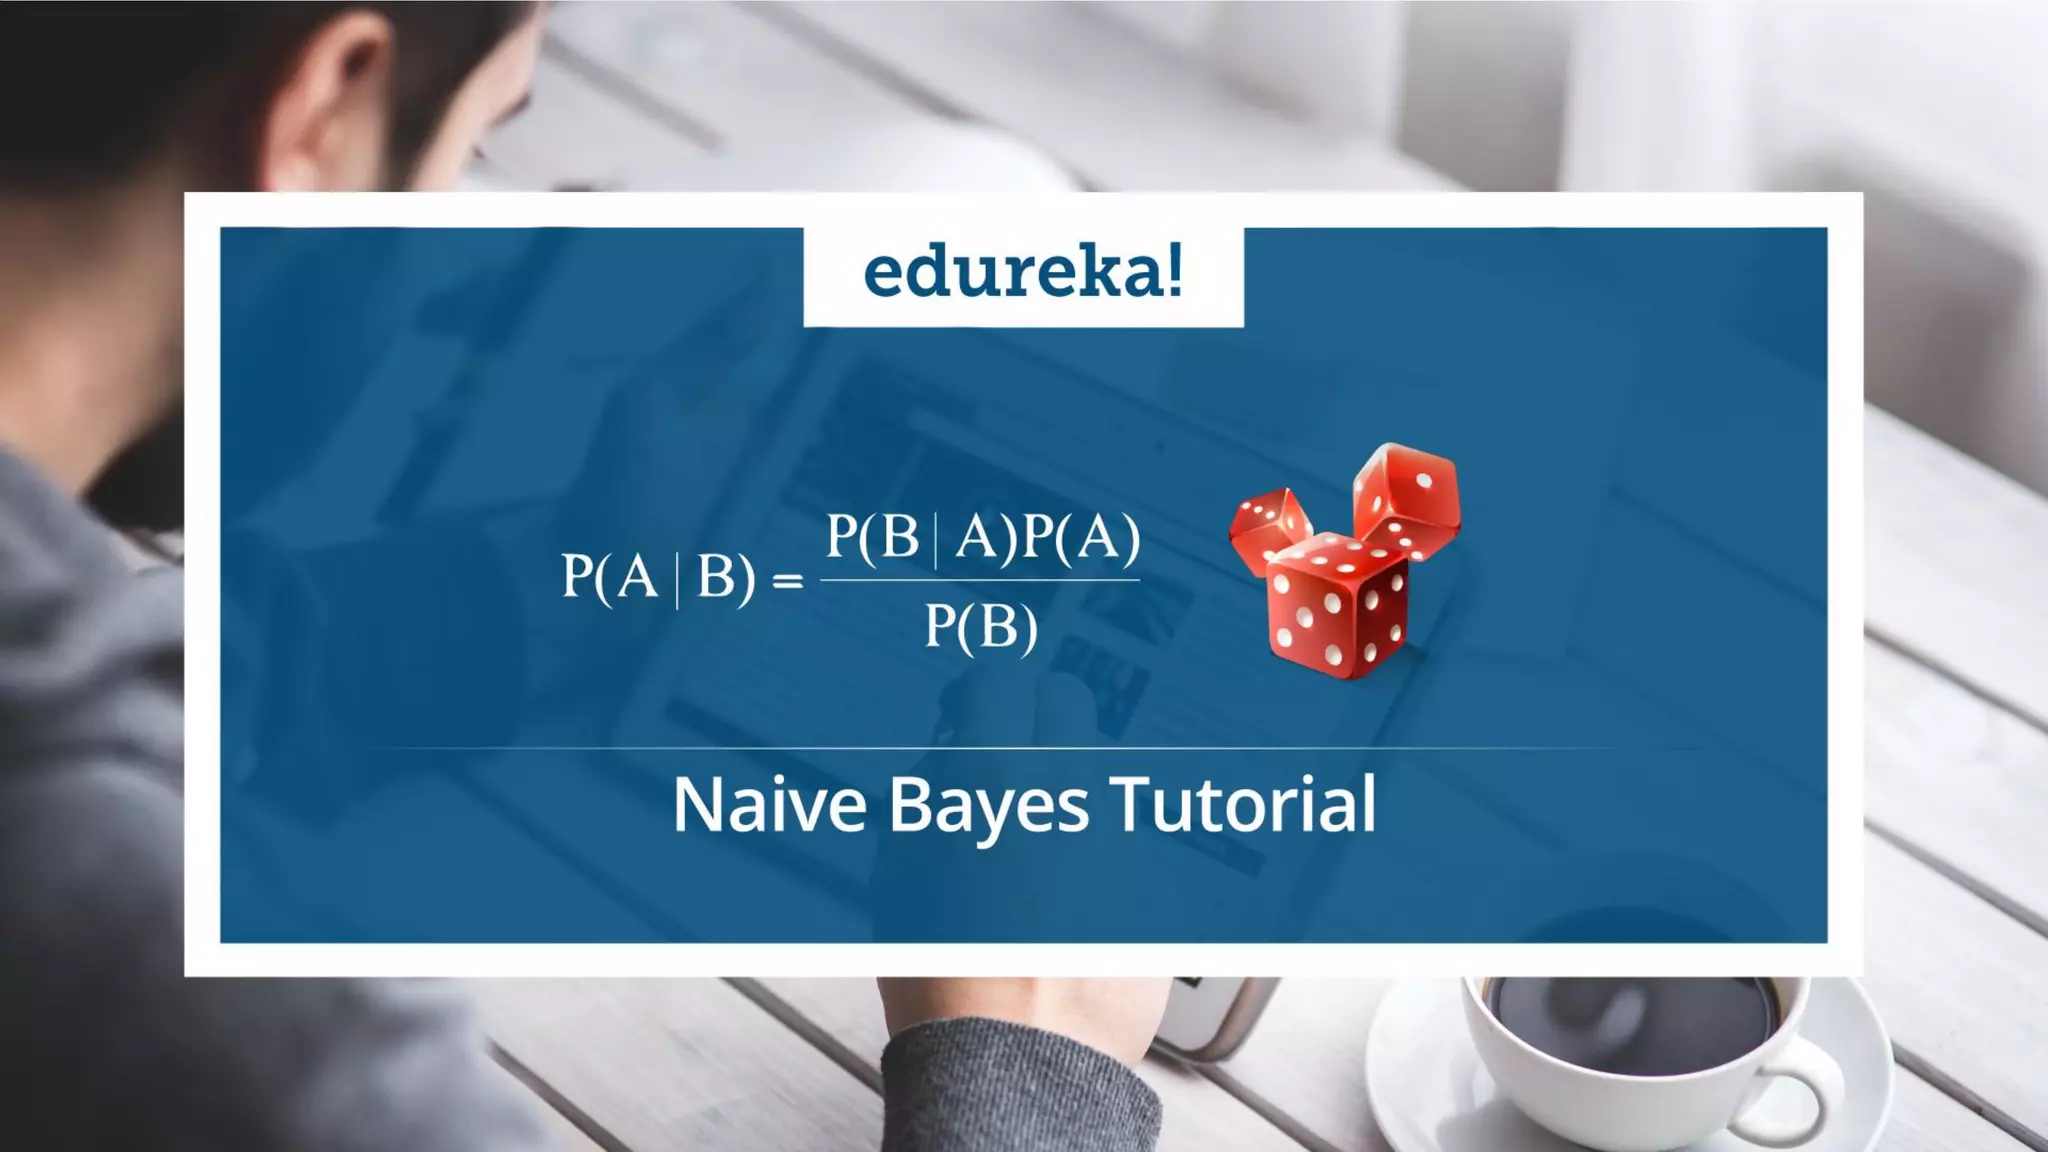
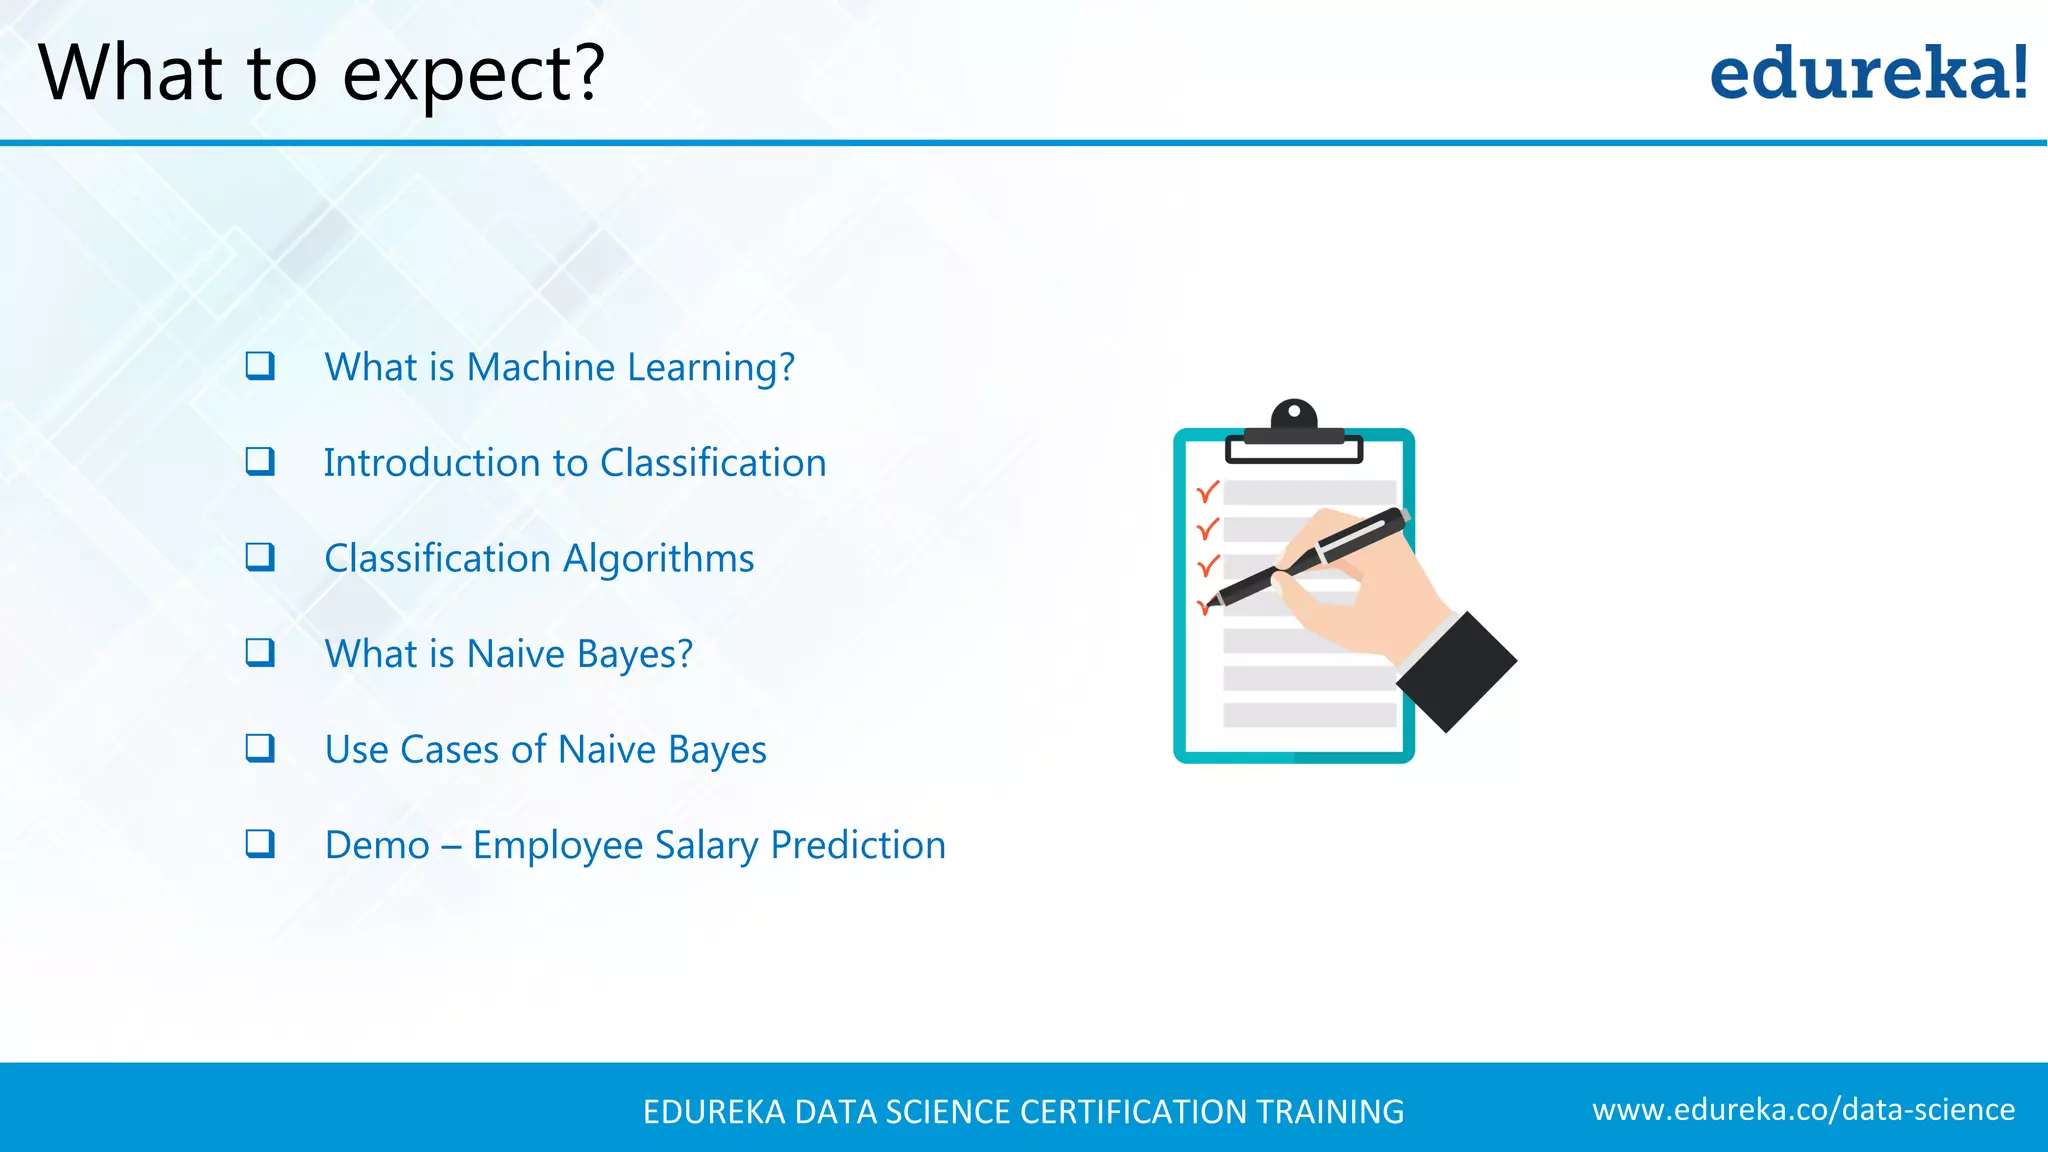
Introduction to Edureka's Data Science Certification Training, covering Machine Learning, classification, Naive Bayes, and a demo.
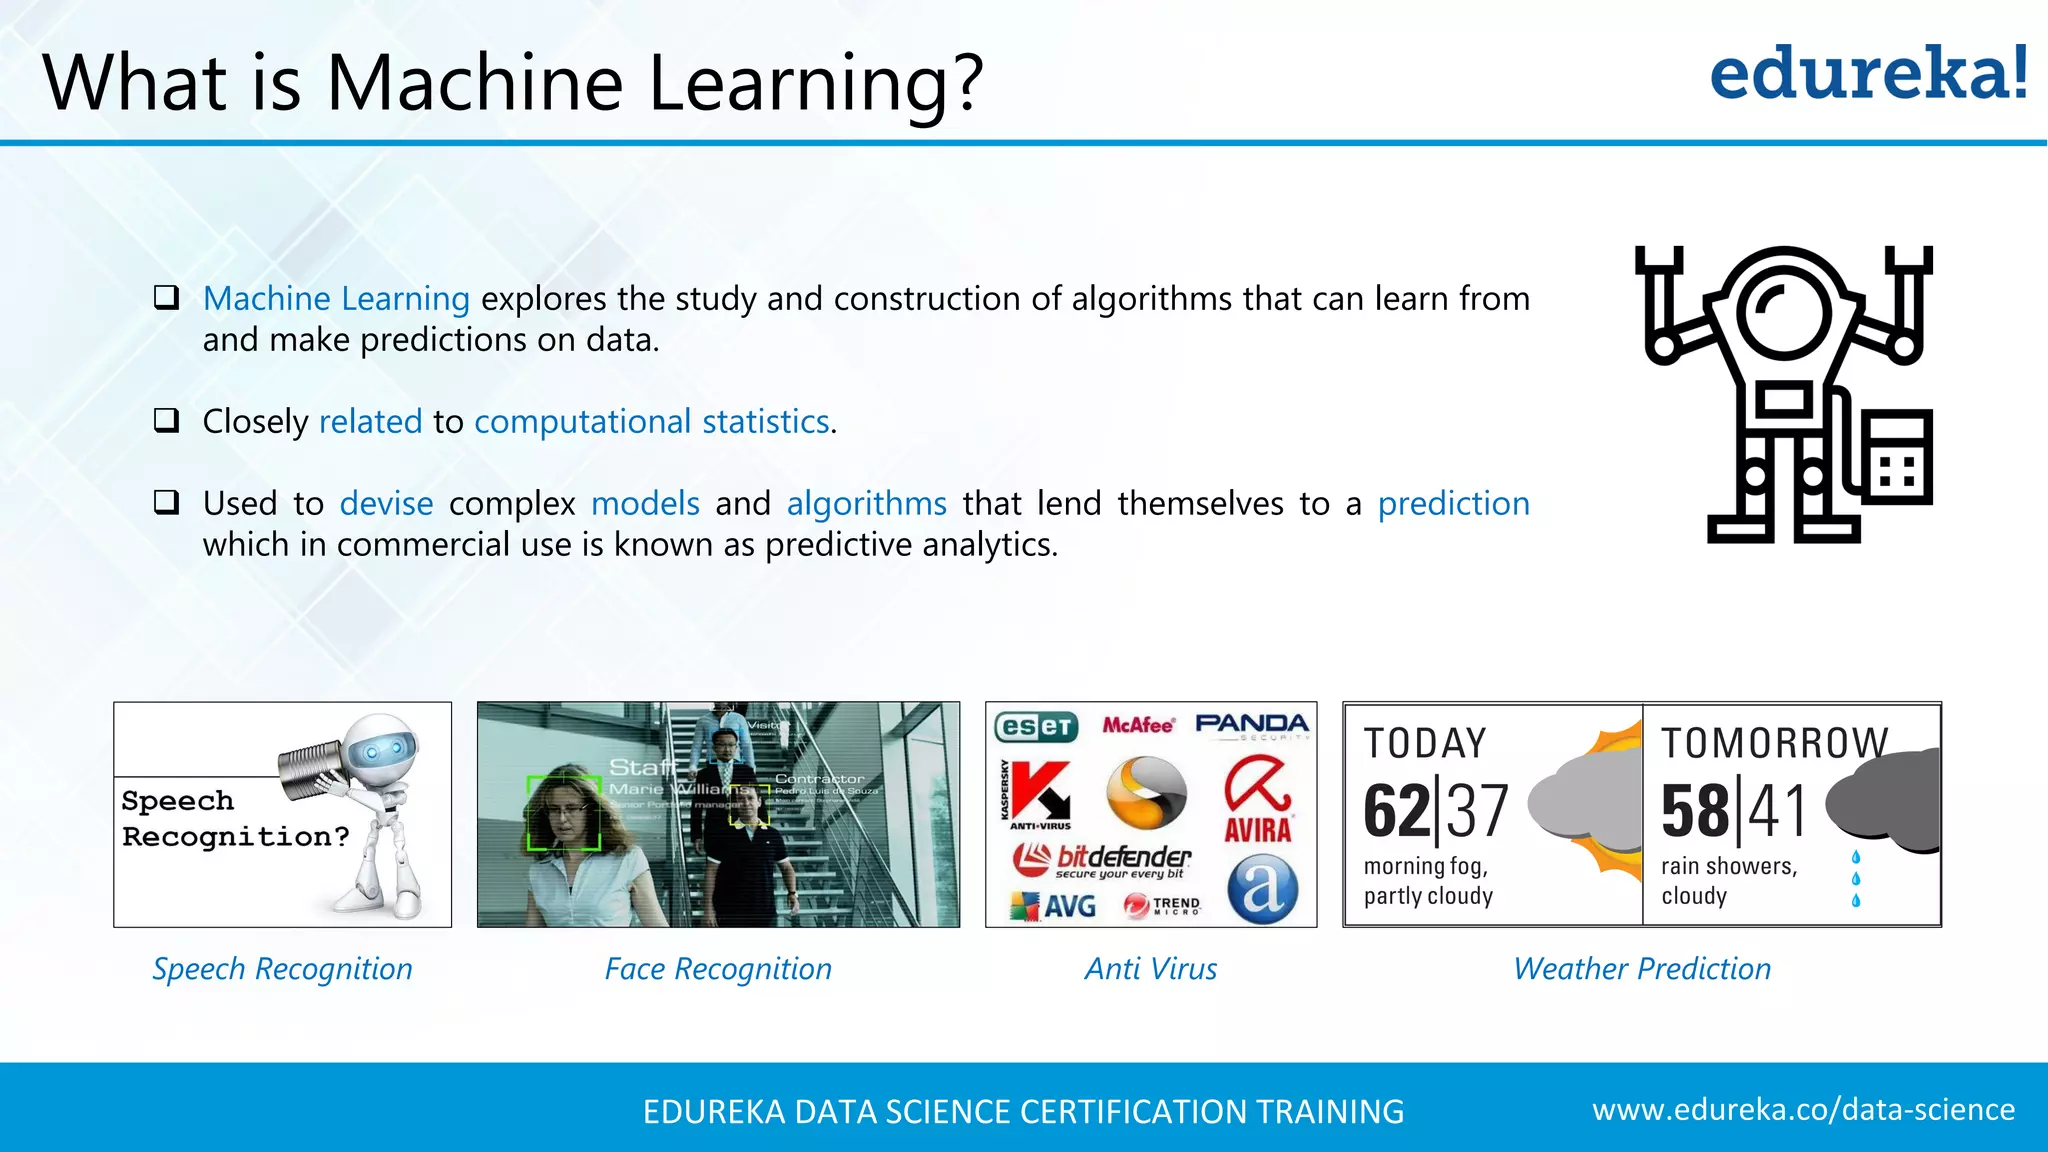
An overview of Machine Learning, its relationship with statistics, and applications in predictive analytics.
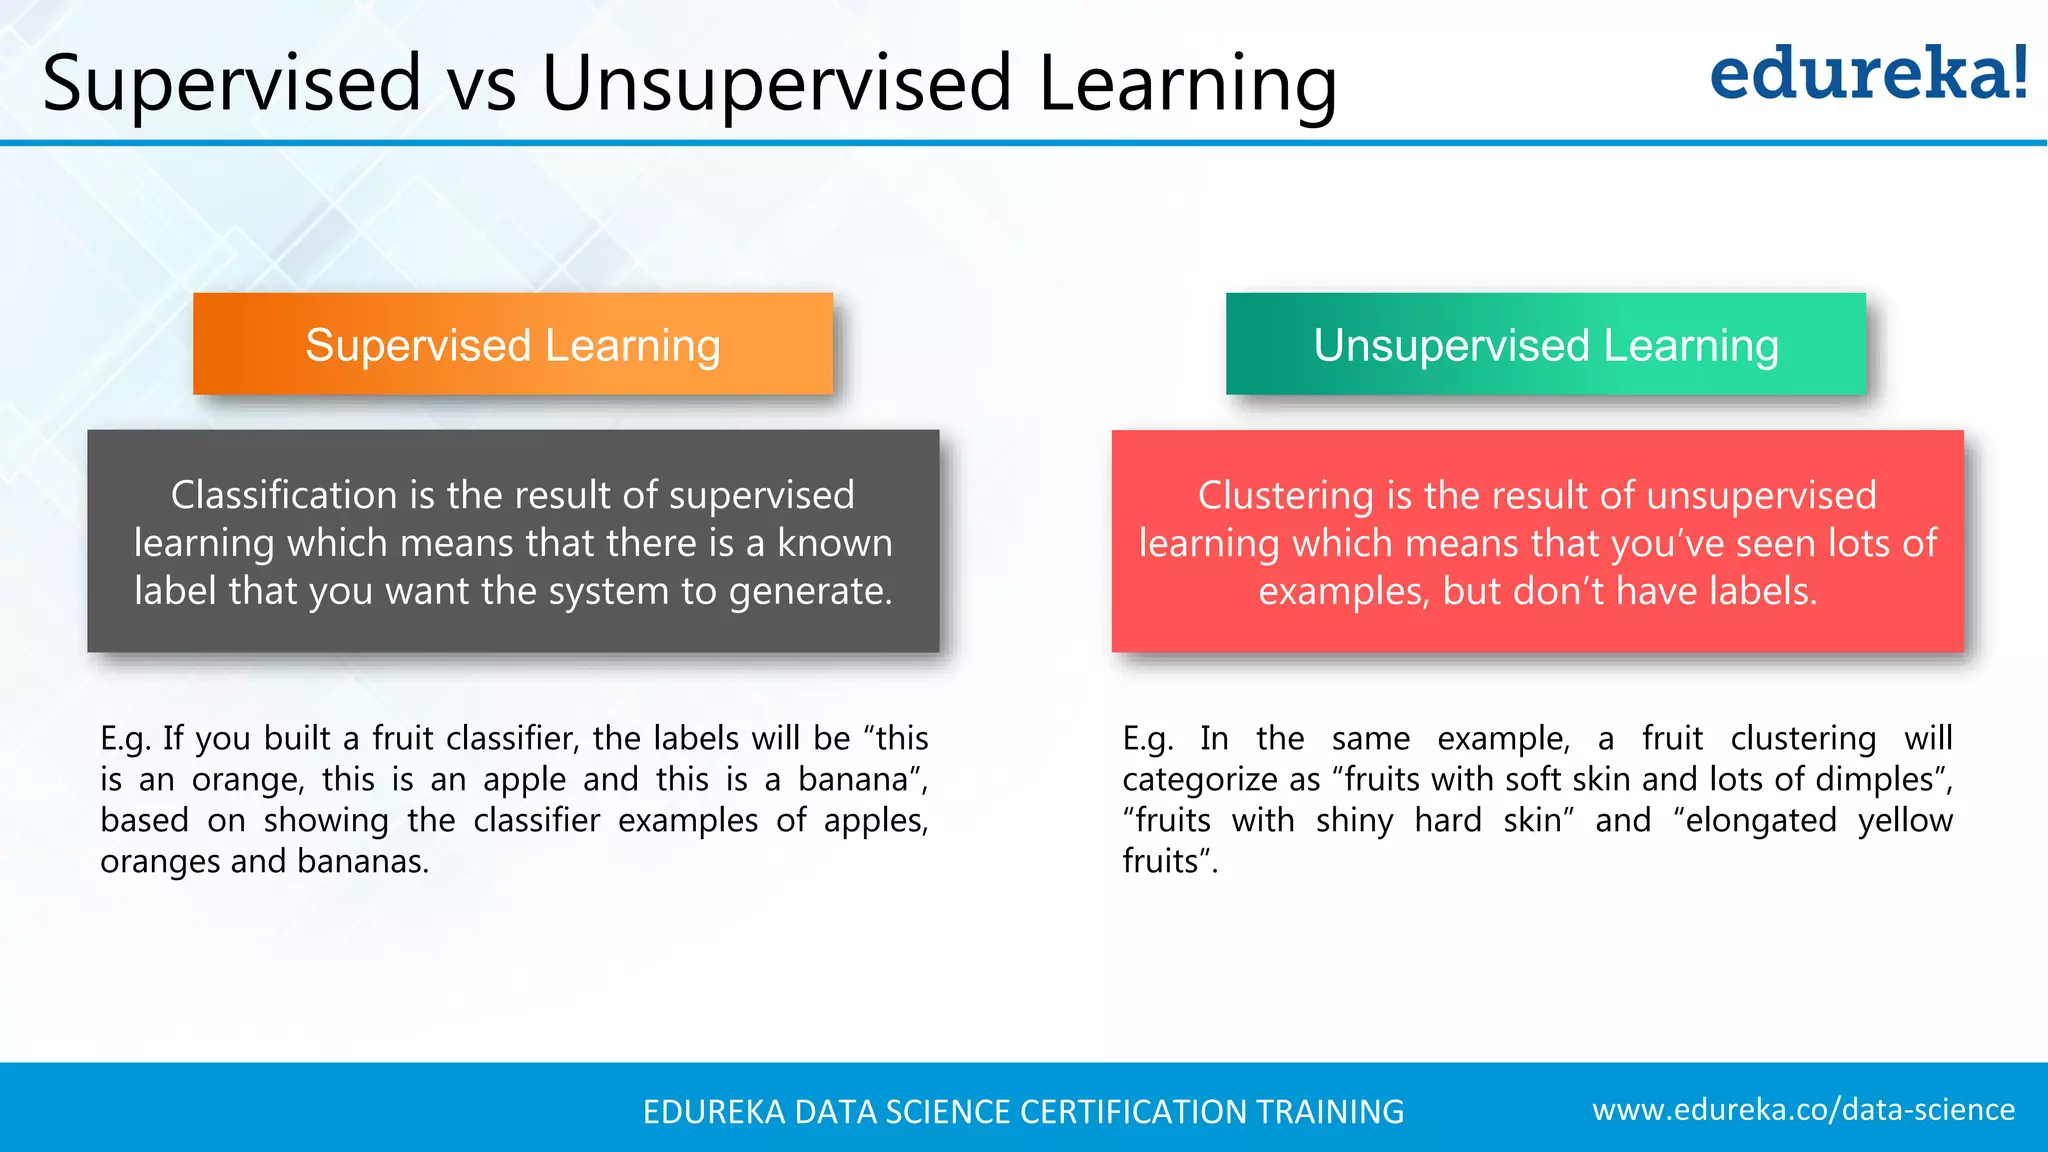
Comparison between supervised learning (classification) and unsupervised learning (clustering) with examples.
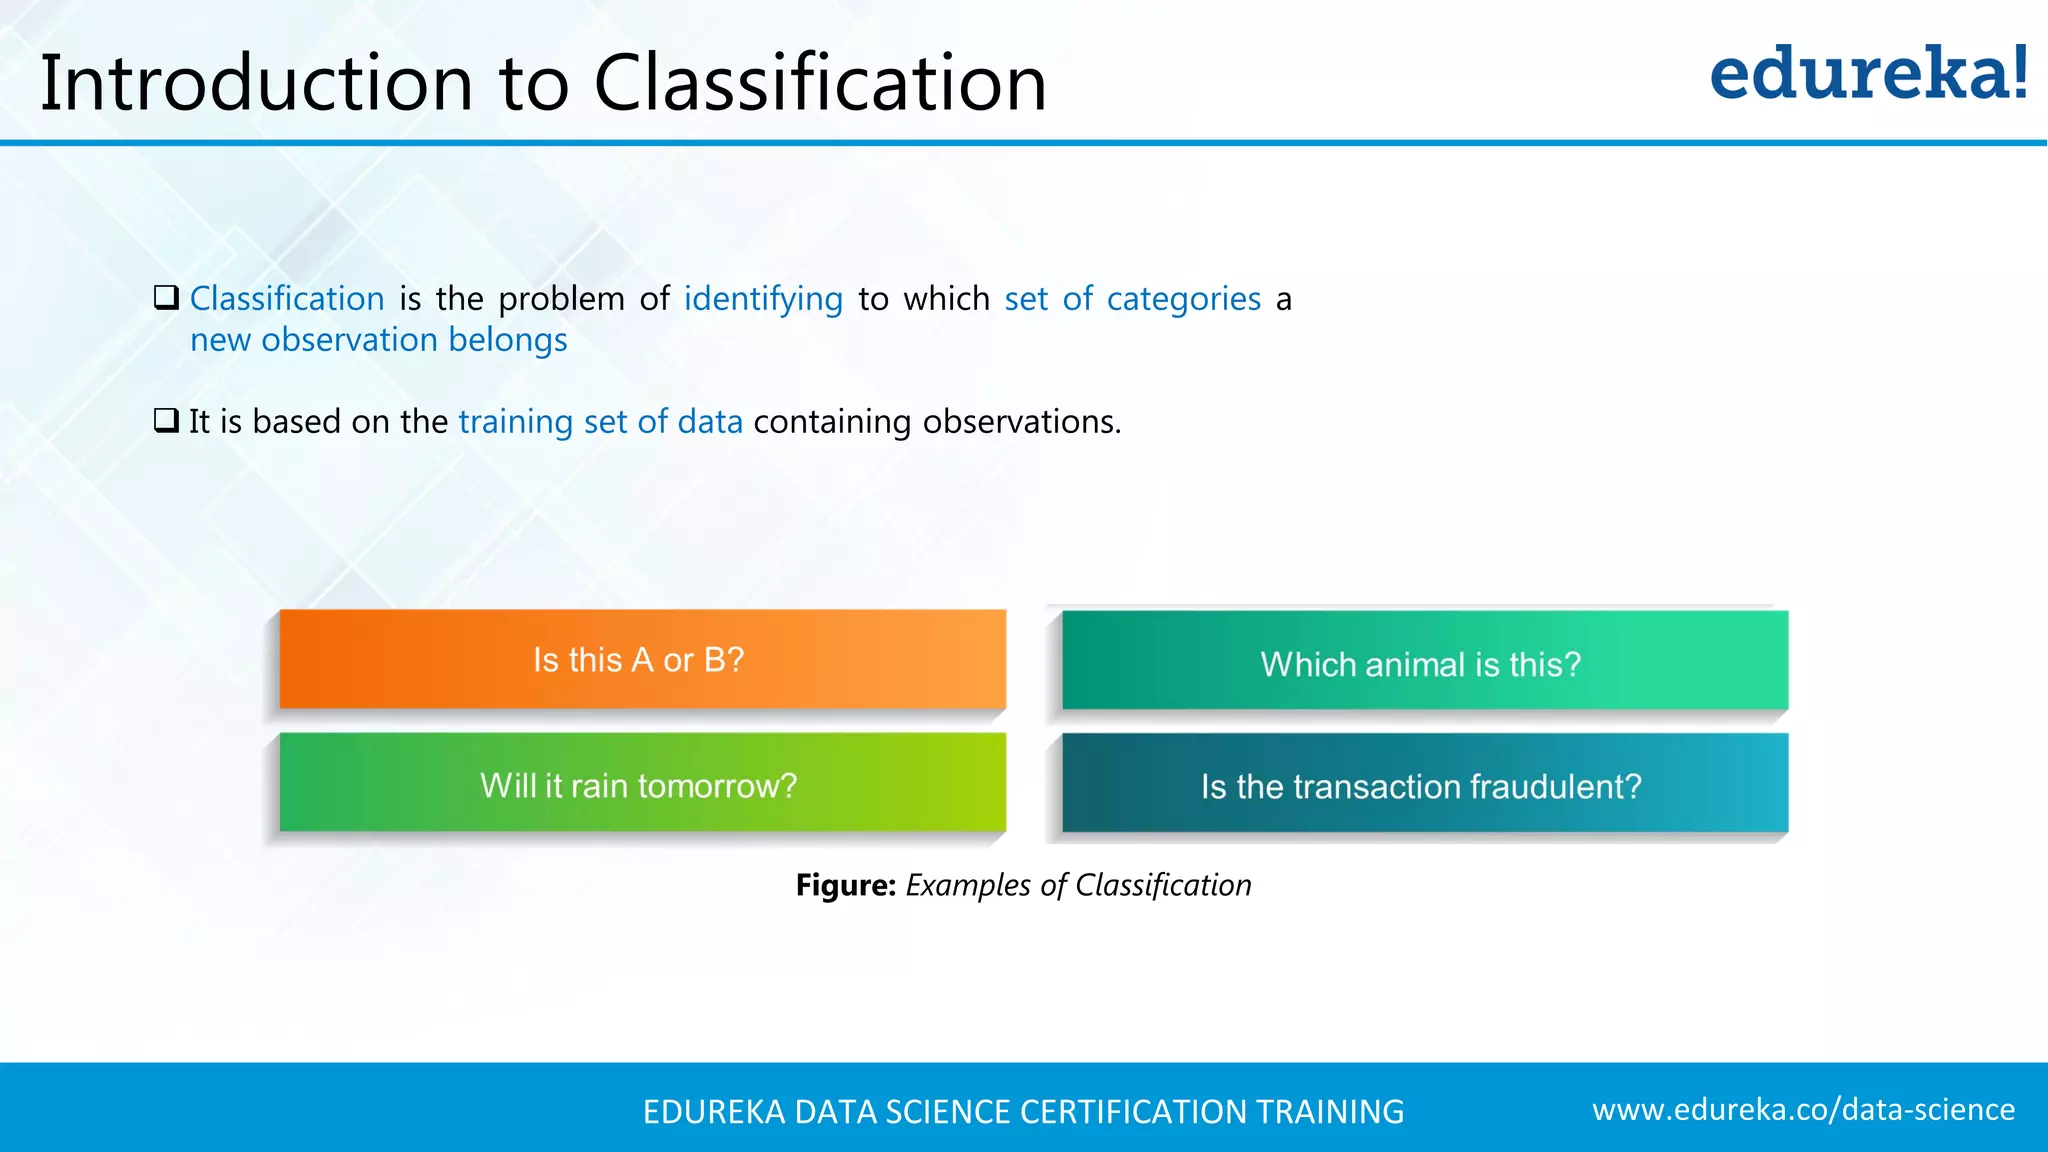
Introduction to classification, defining its purpose to categorize observations based on training data.
List of various classification algorithms including Naive Bayes, SVM, and Neural Networks.
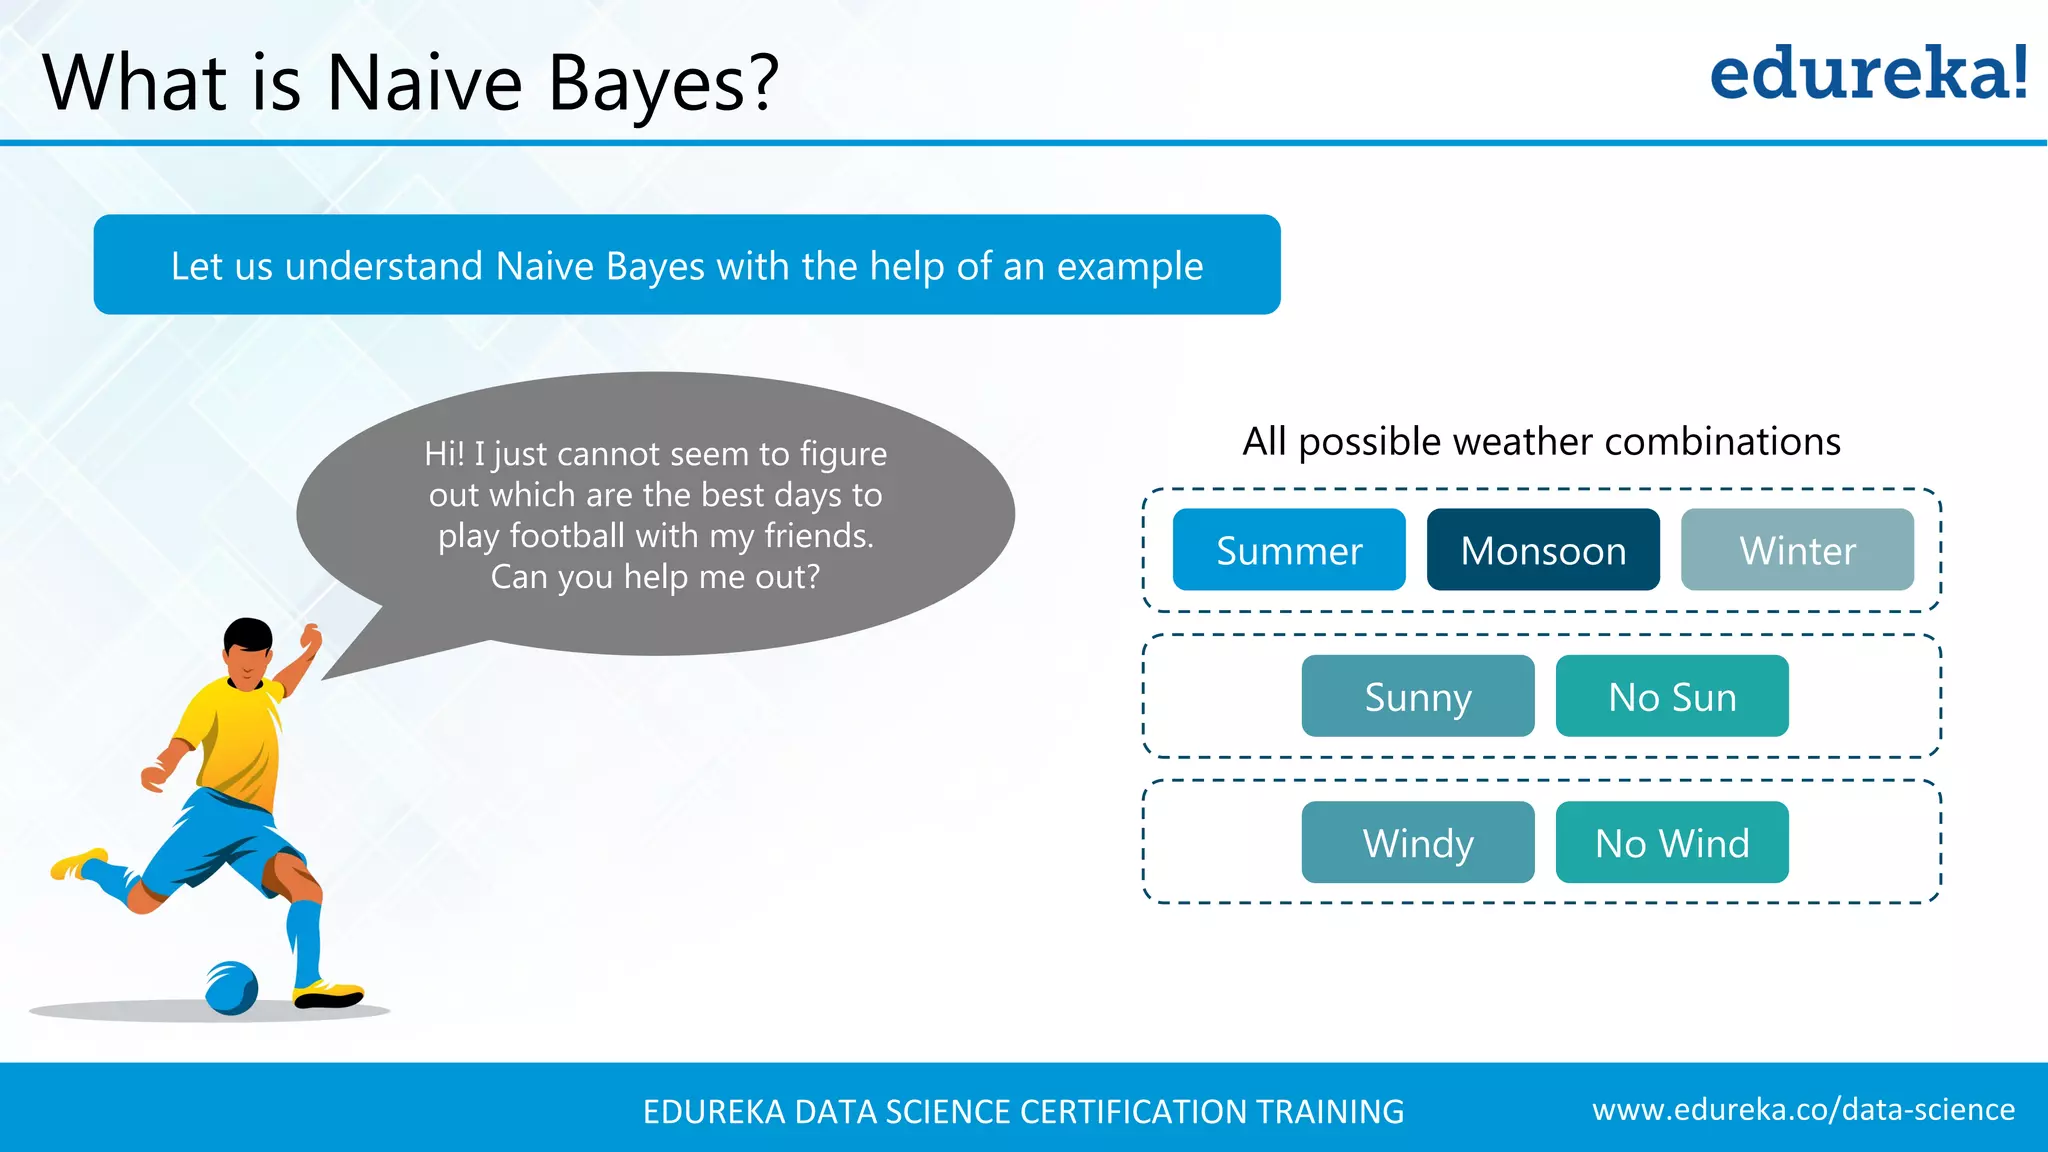
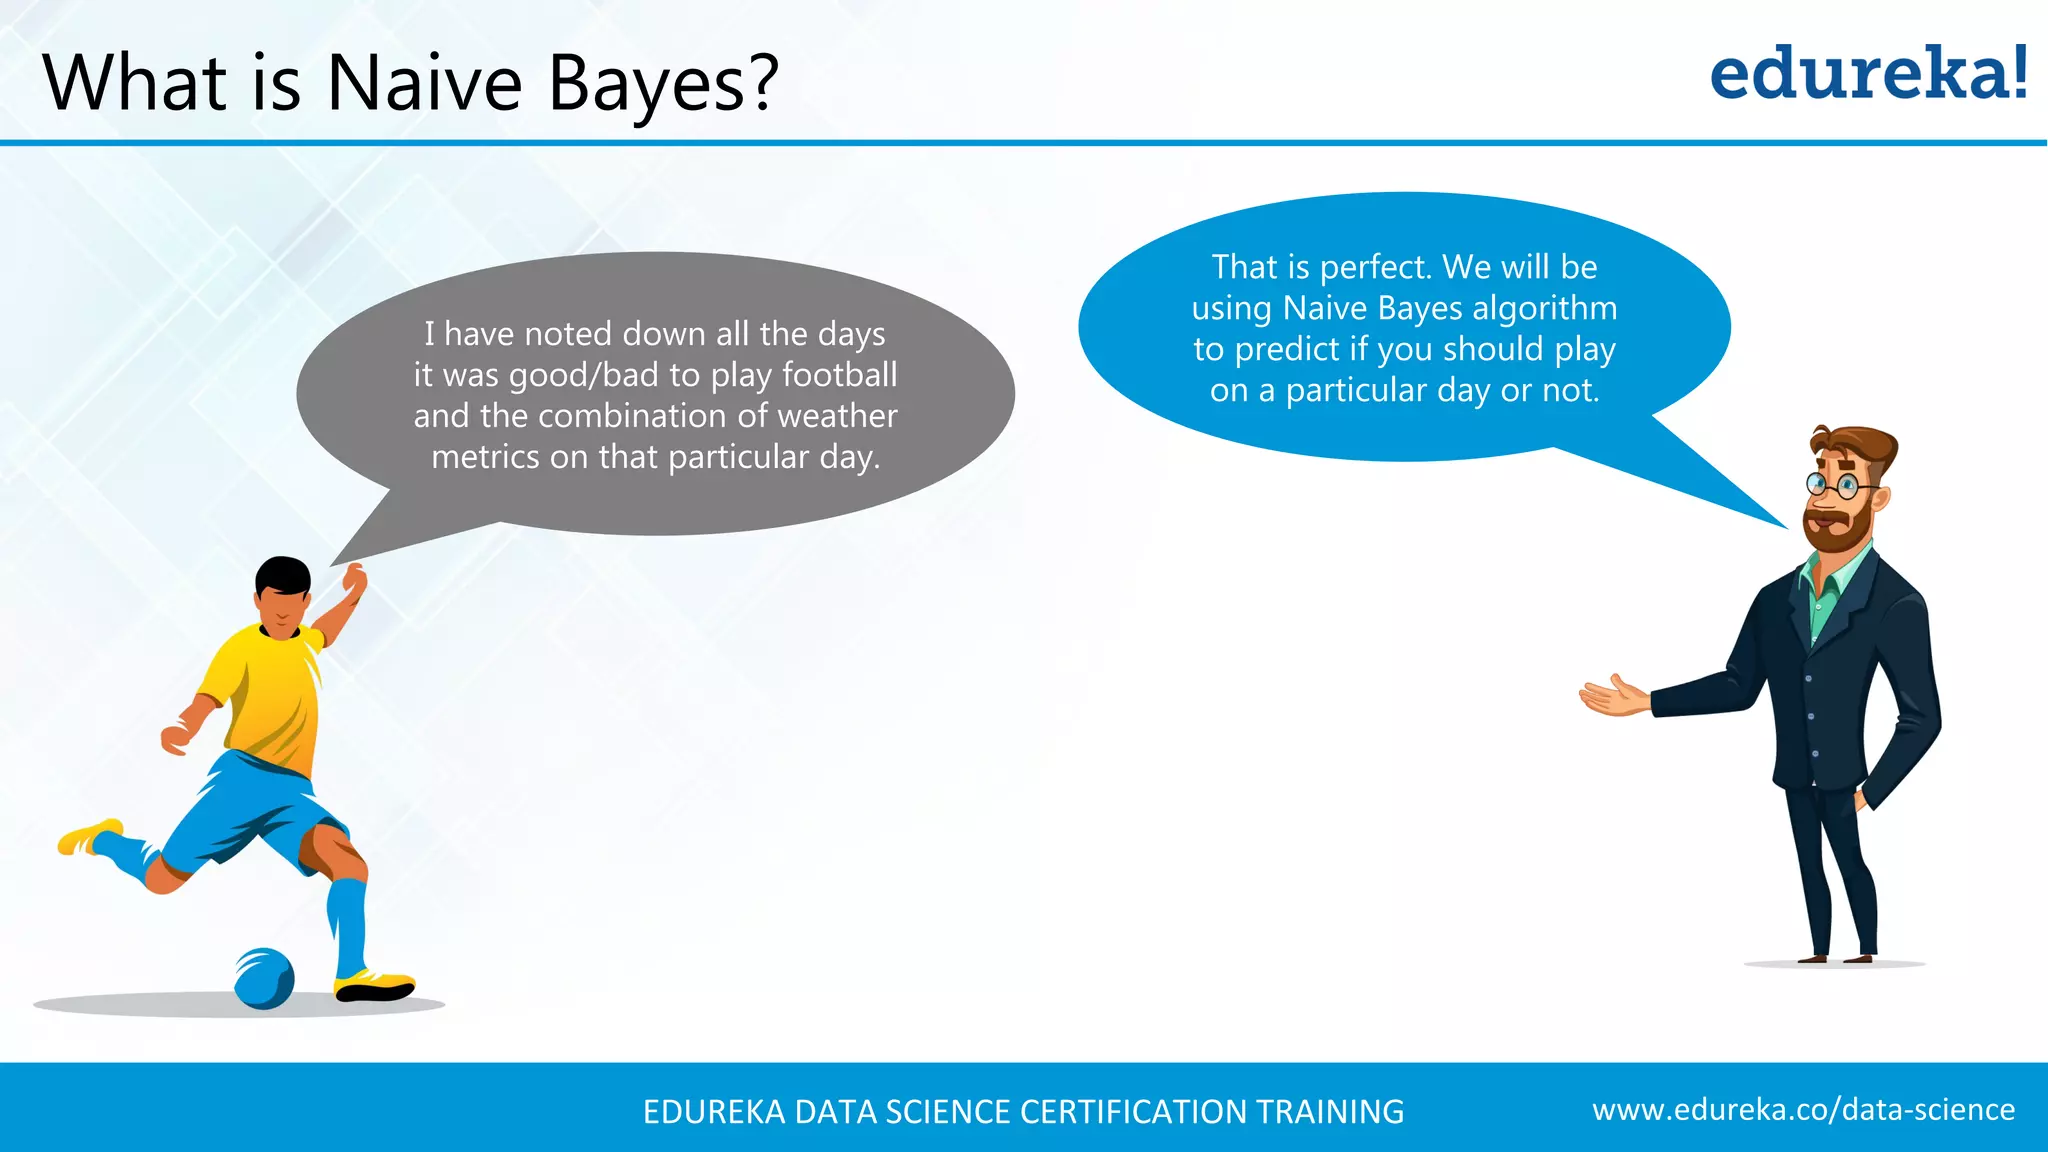
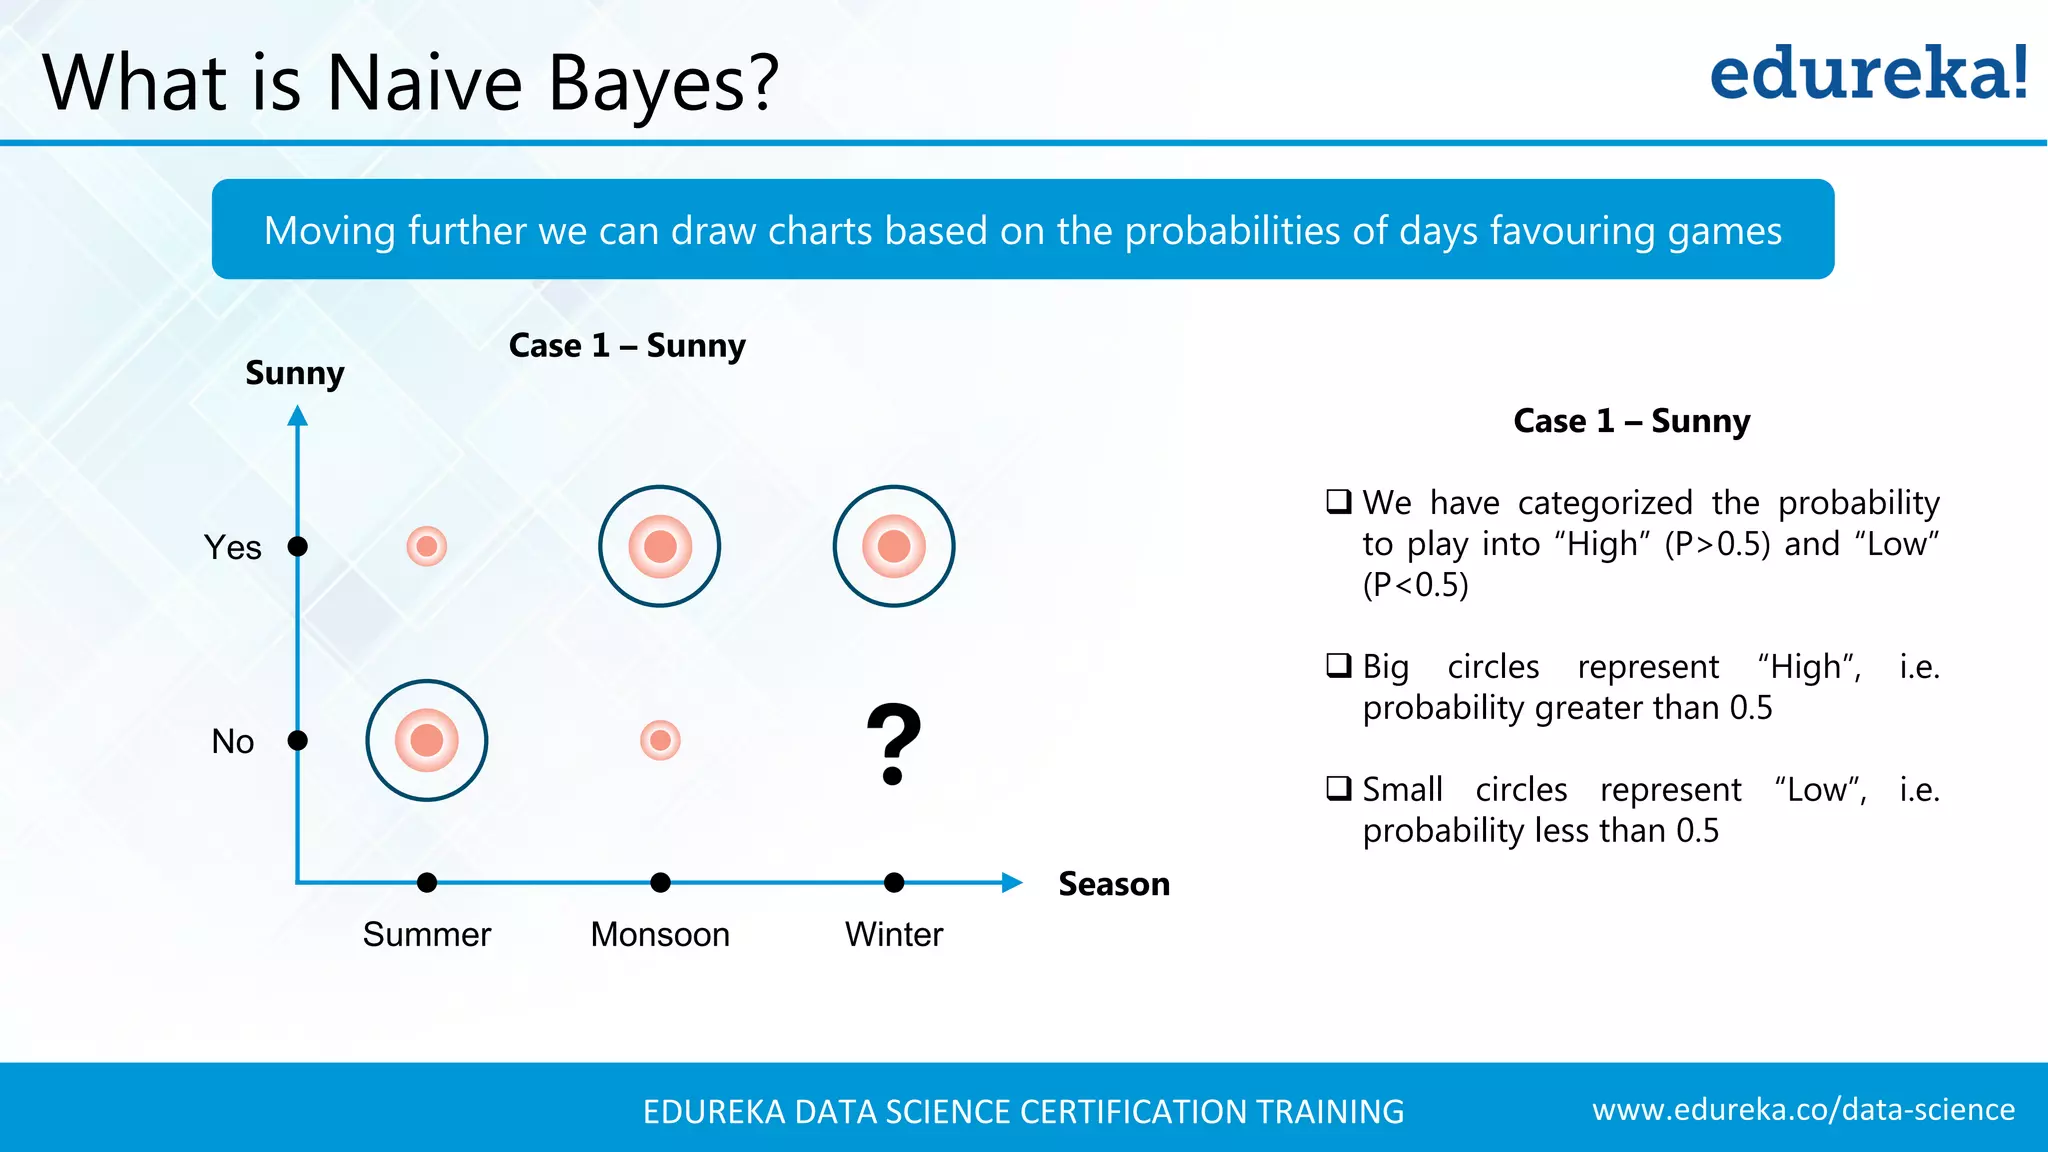
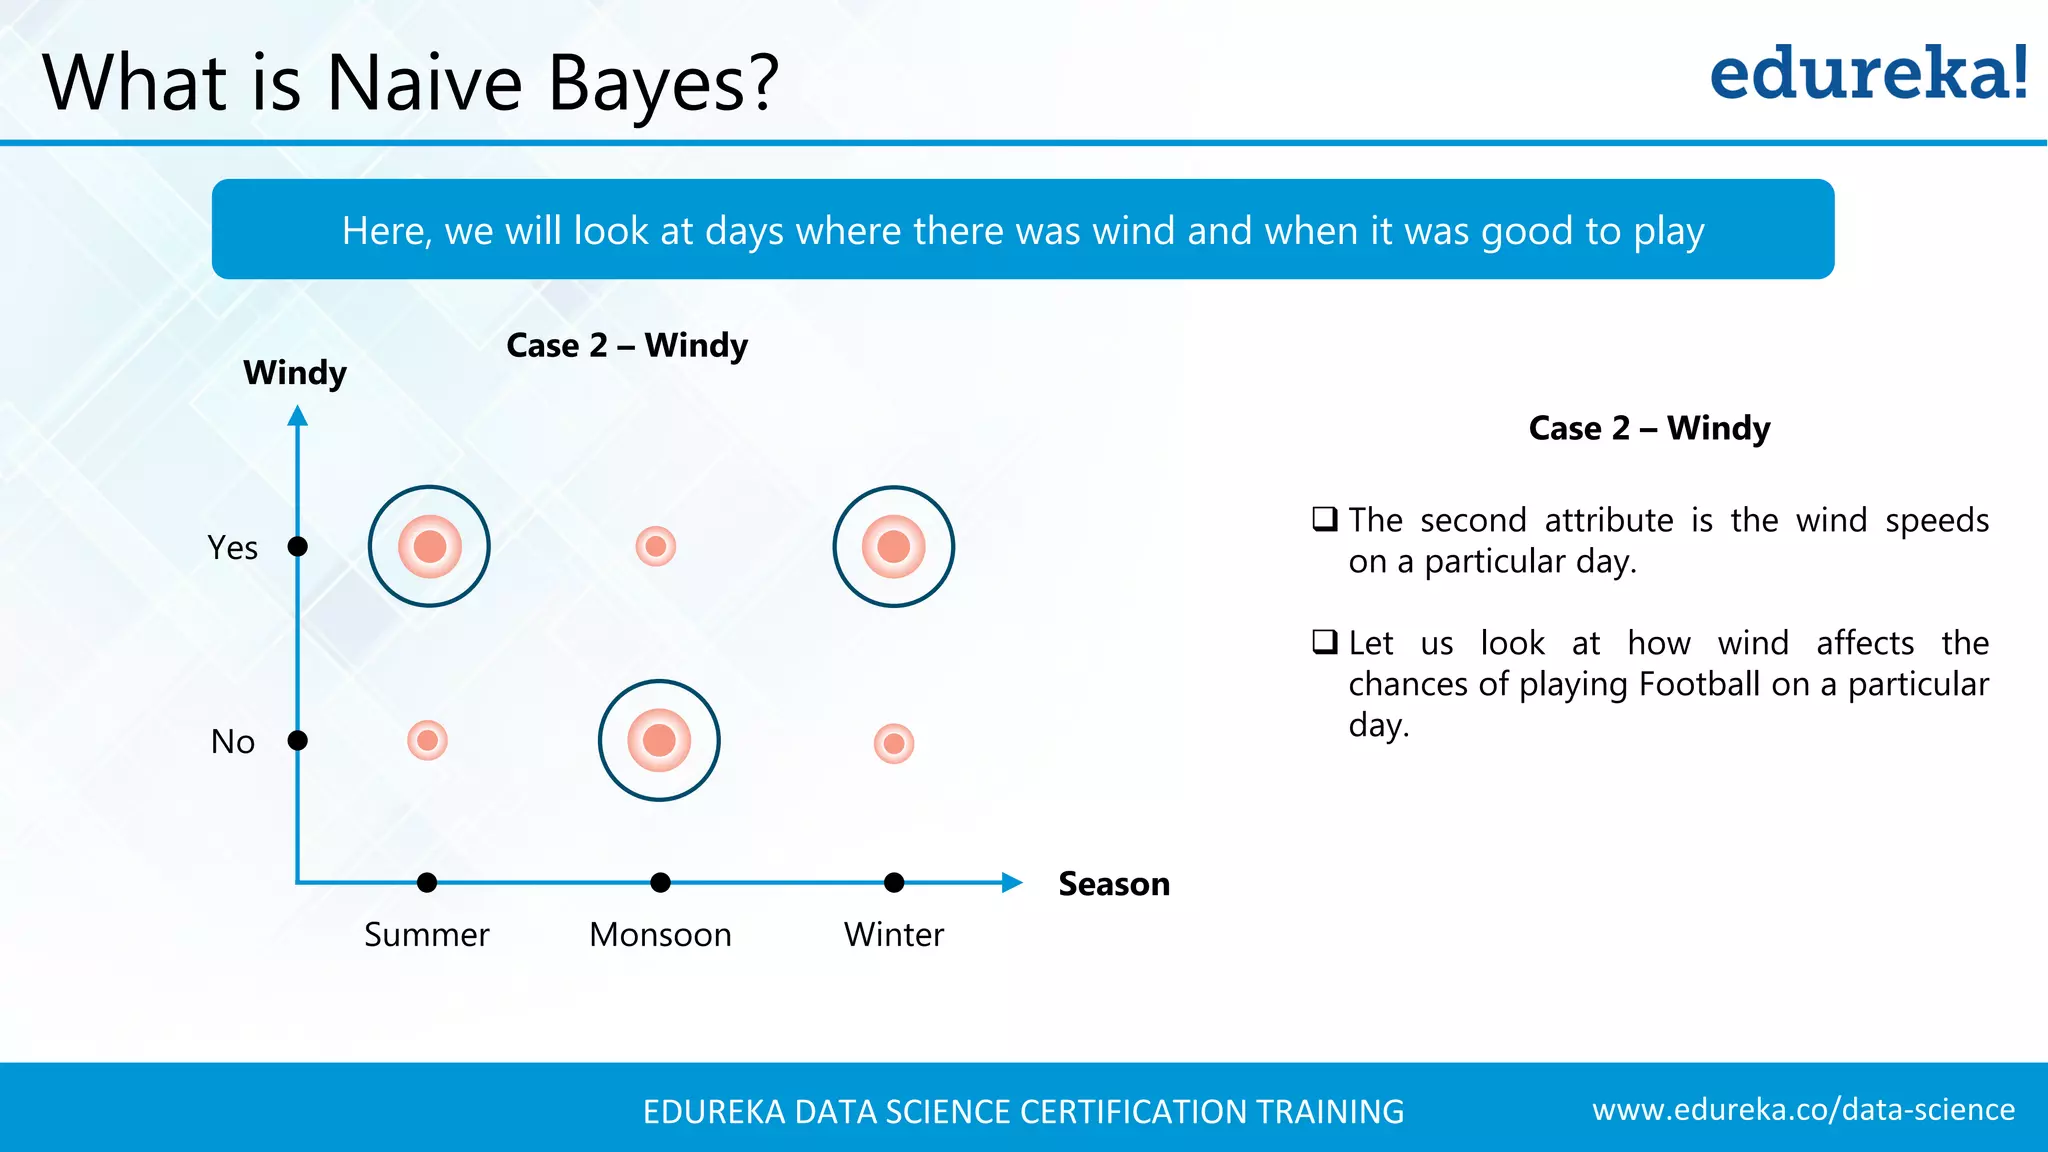
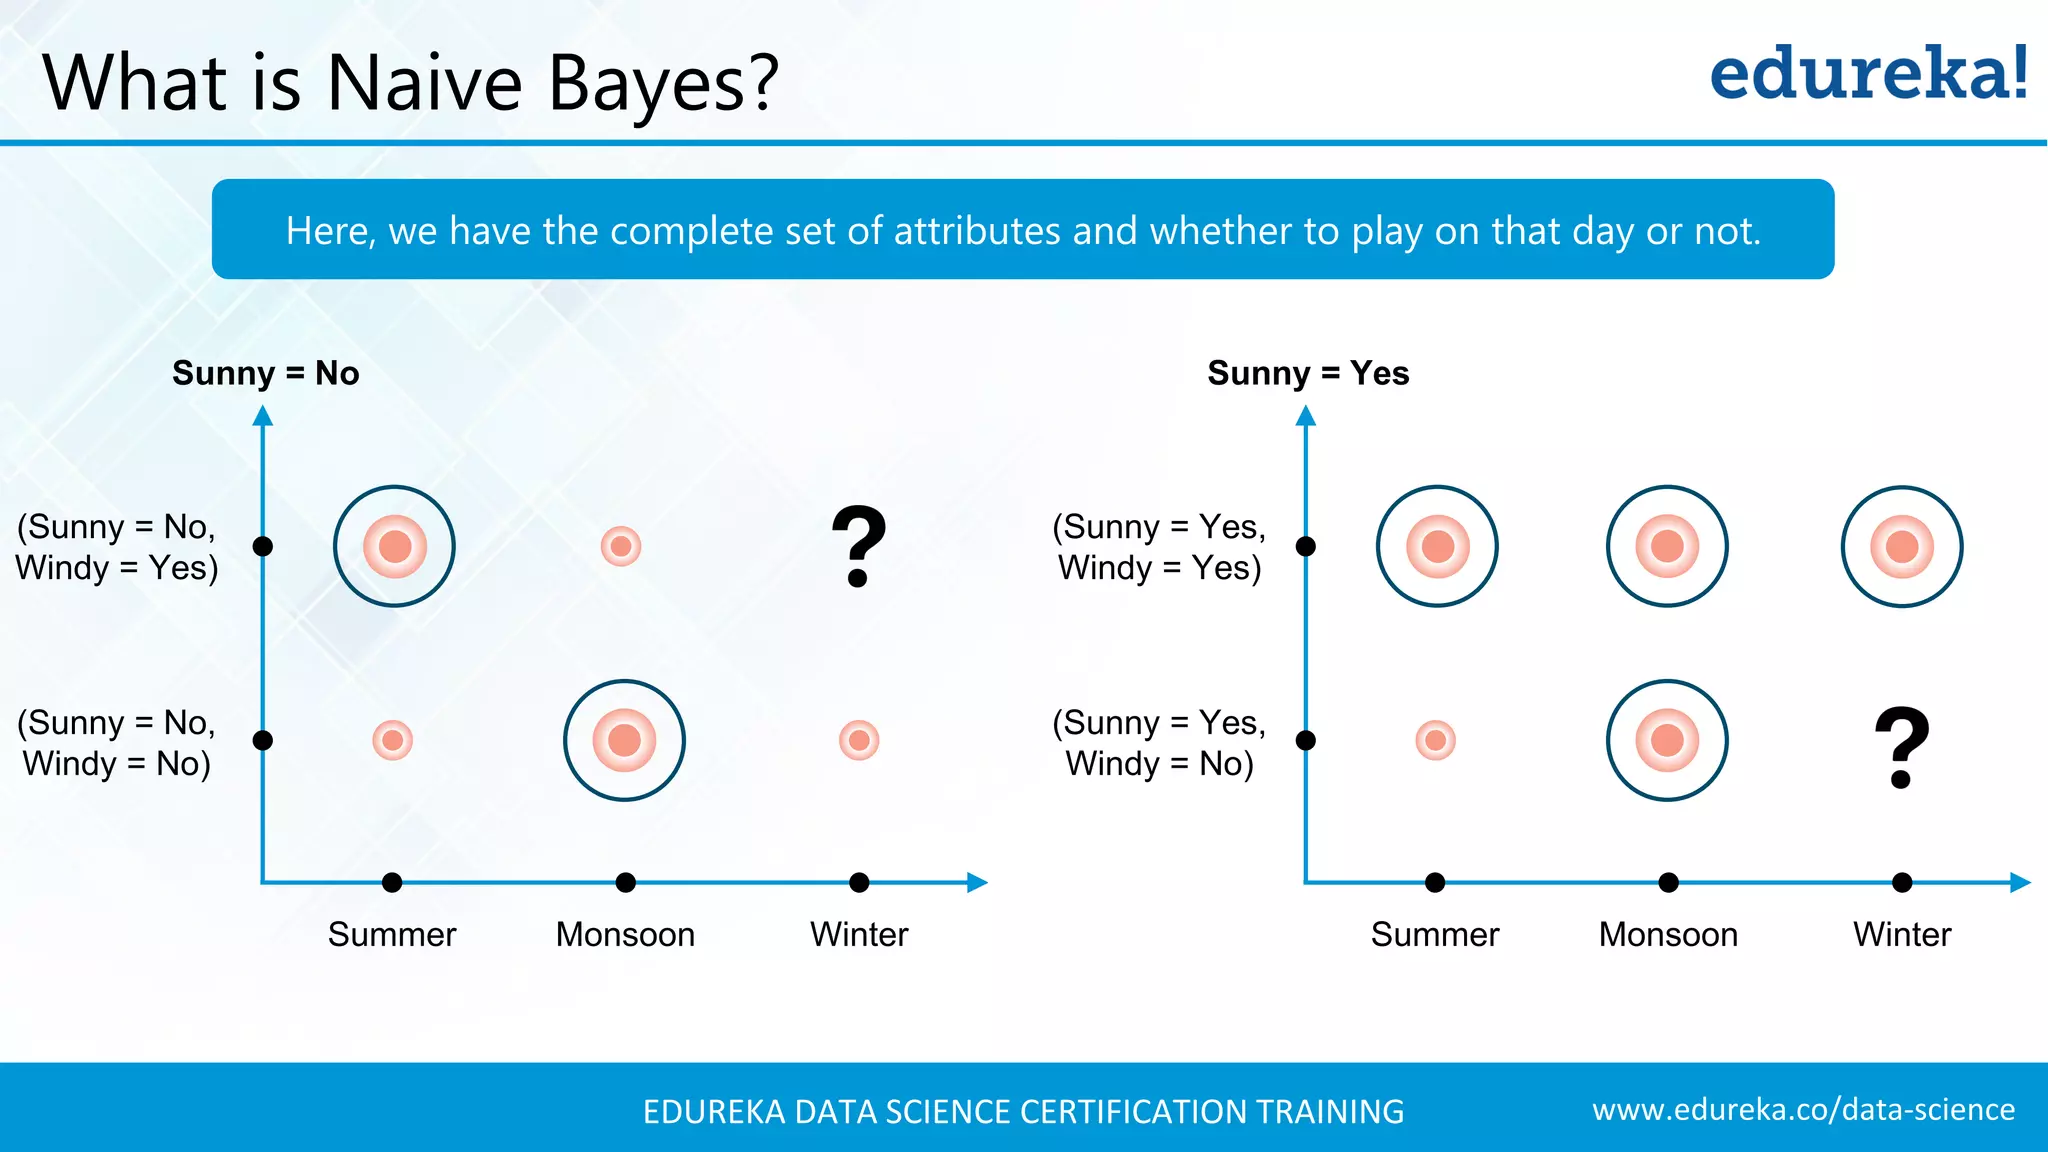
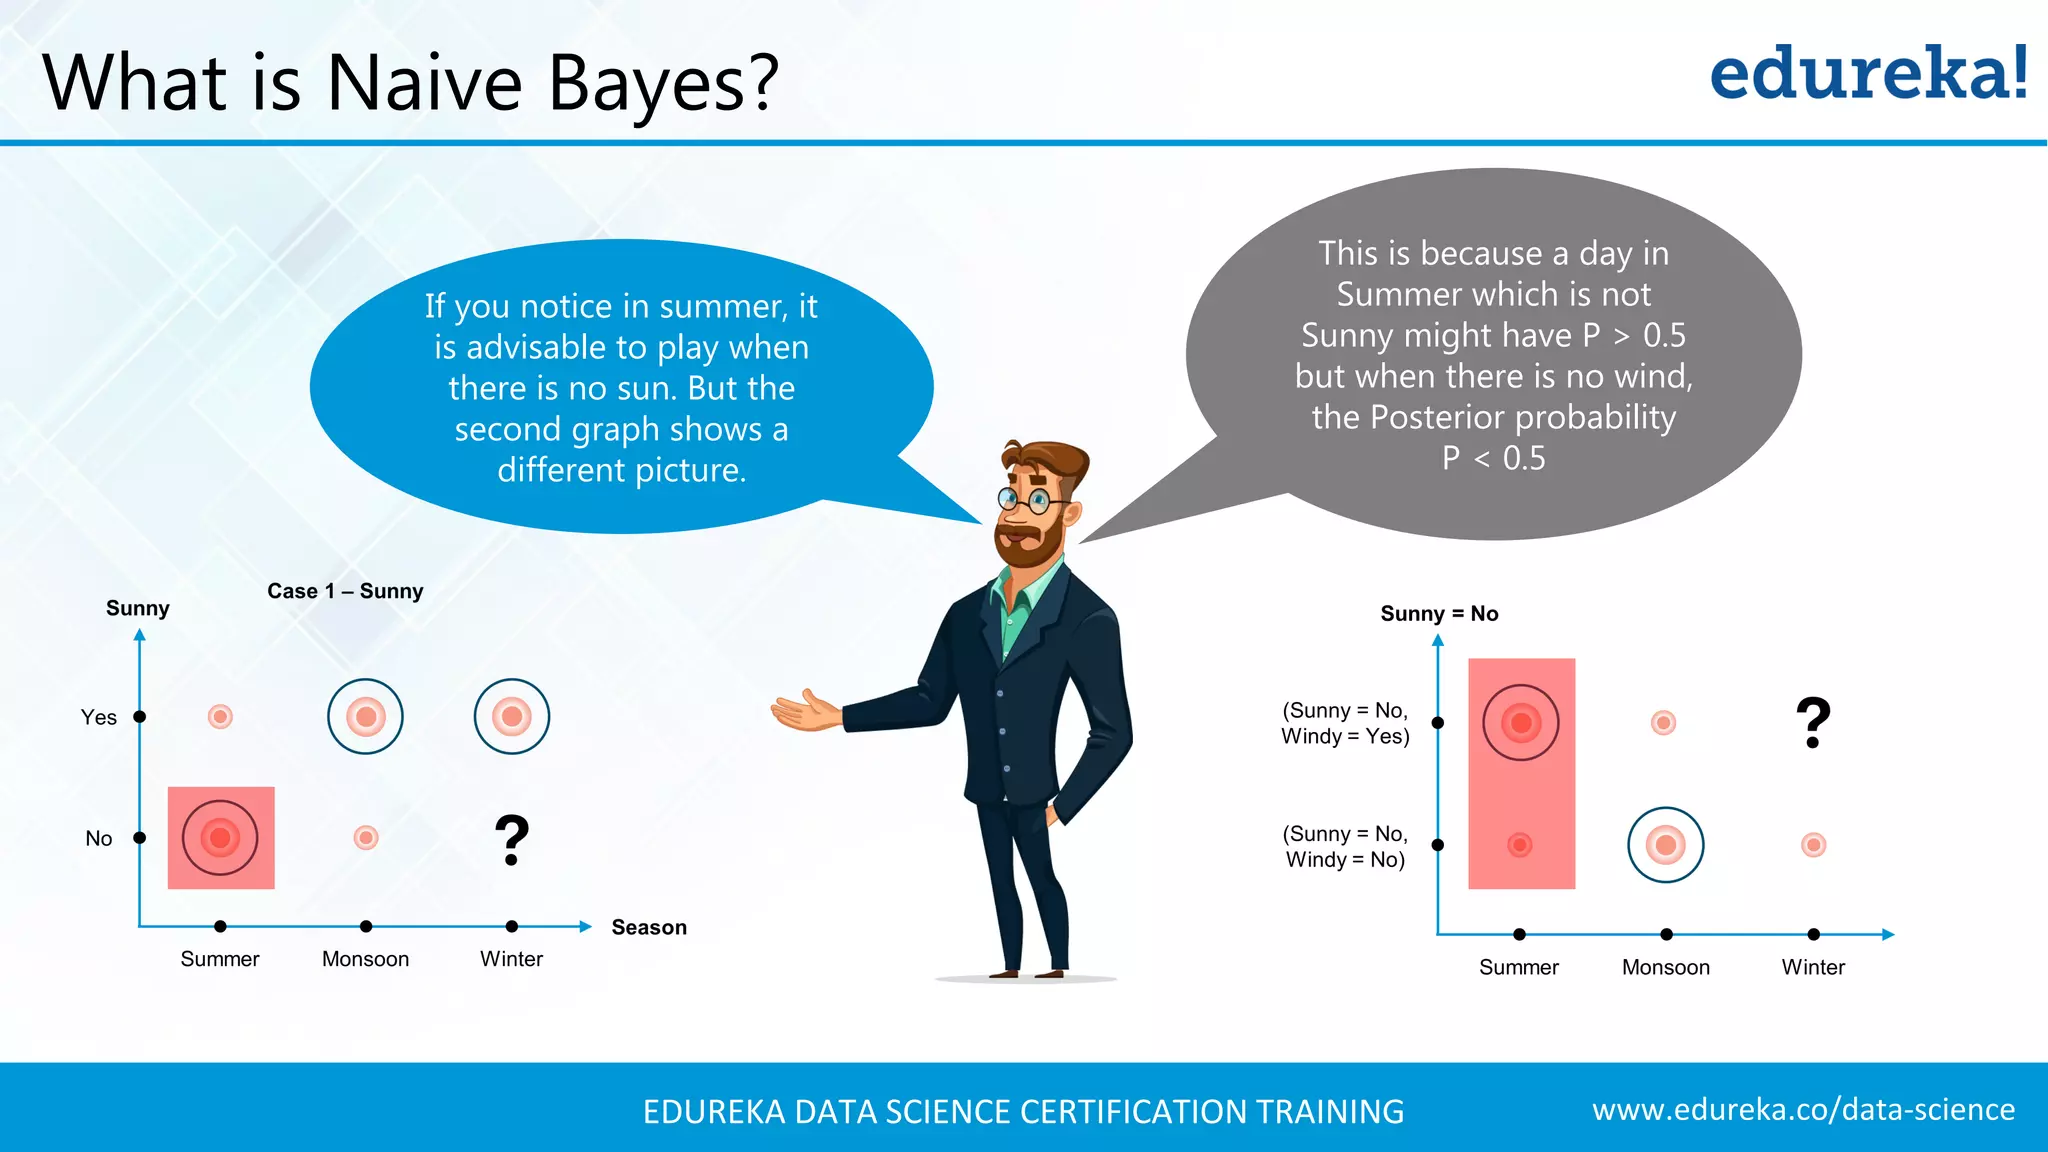
Explanation of the Naive Bayes algorithm, its practical application using weather conditions for football game prediction.
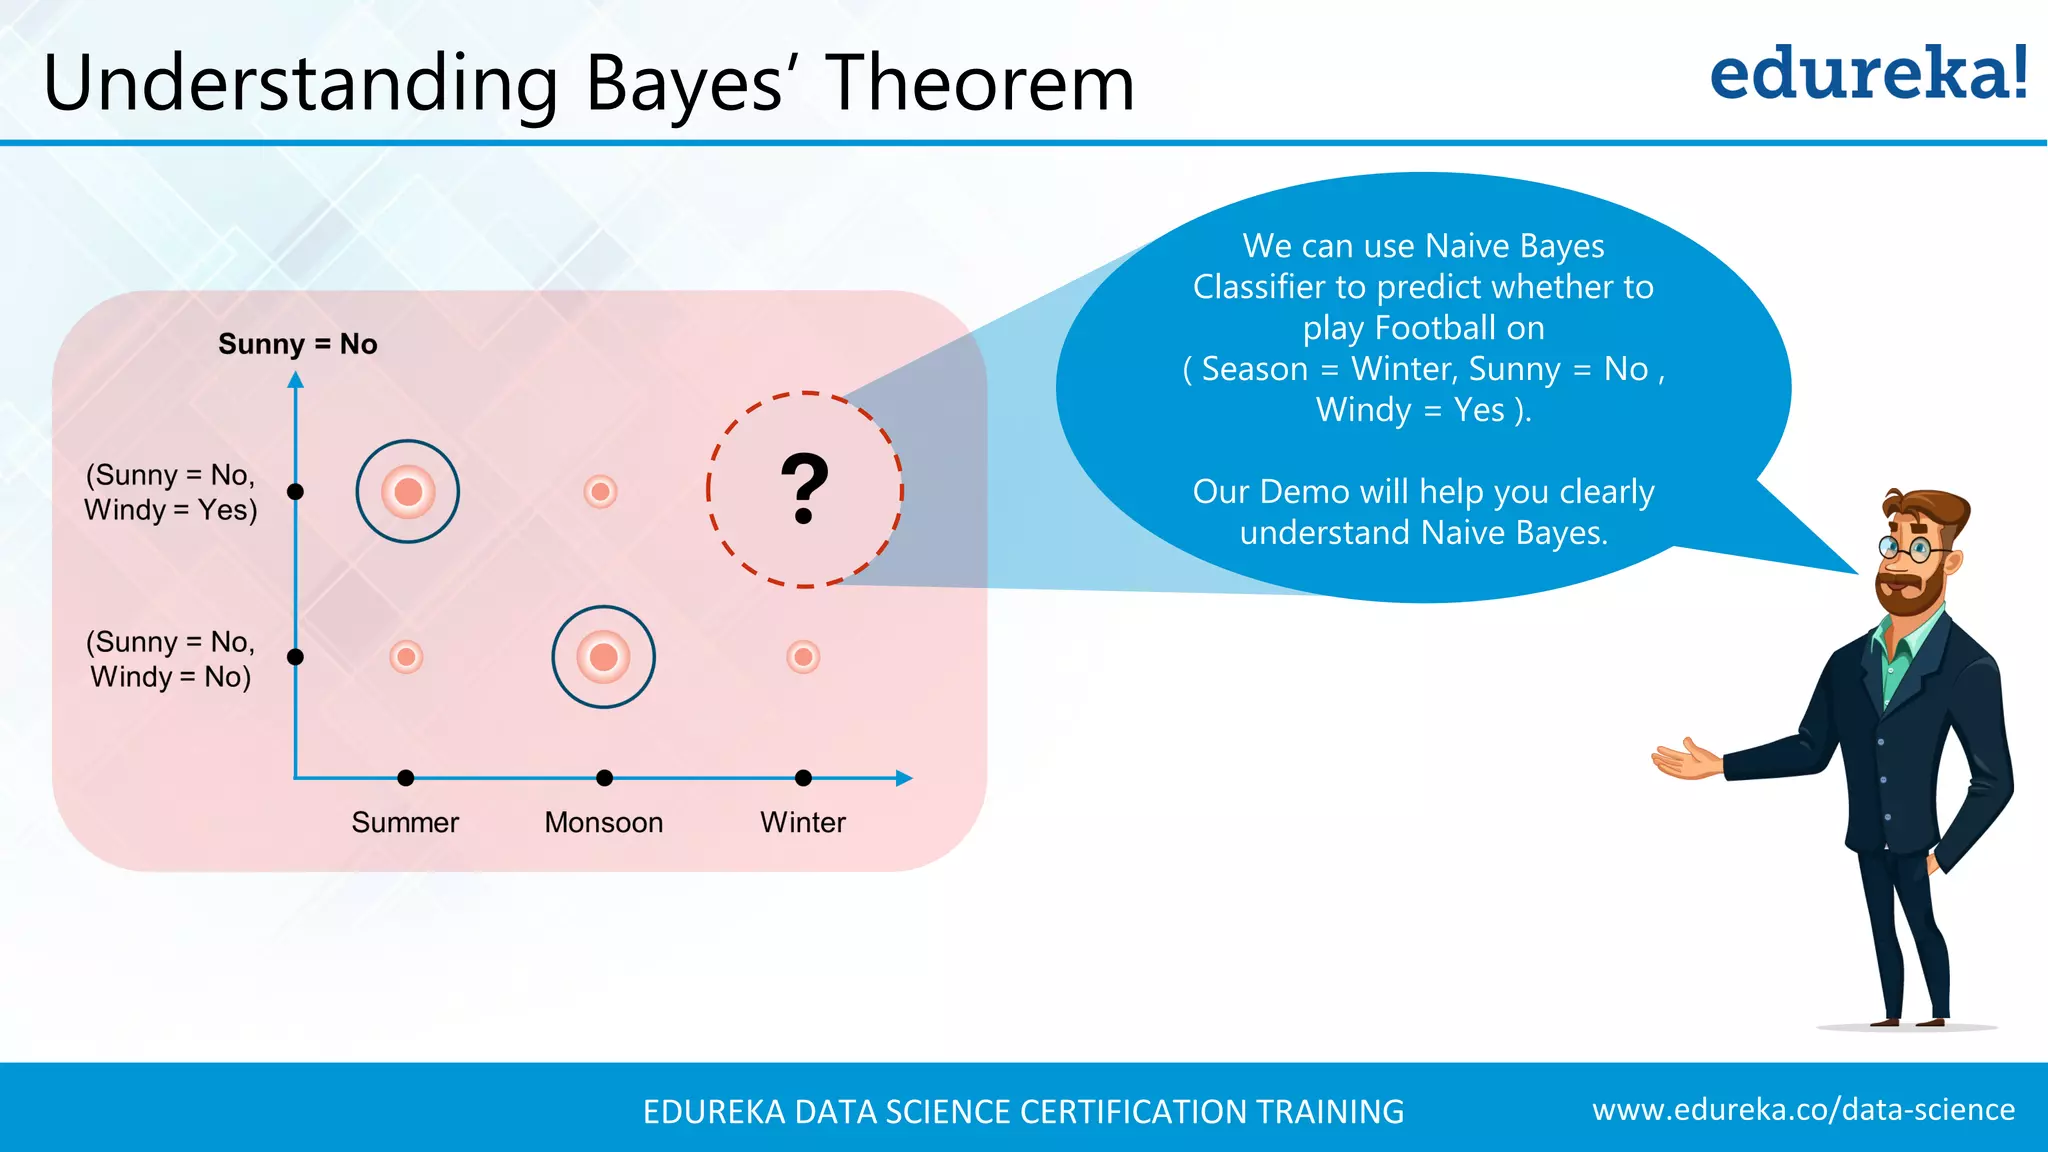
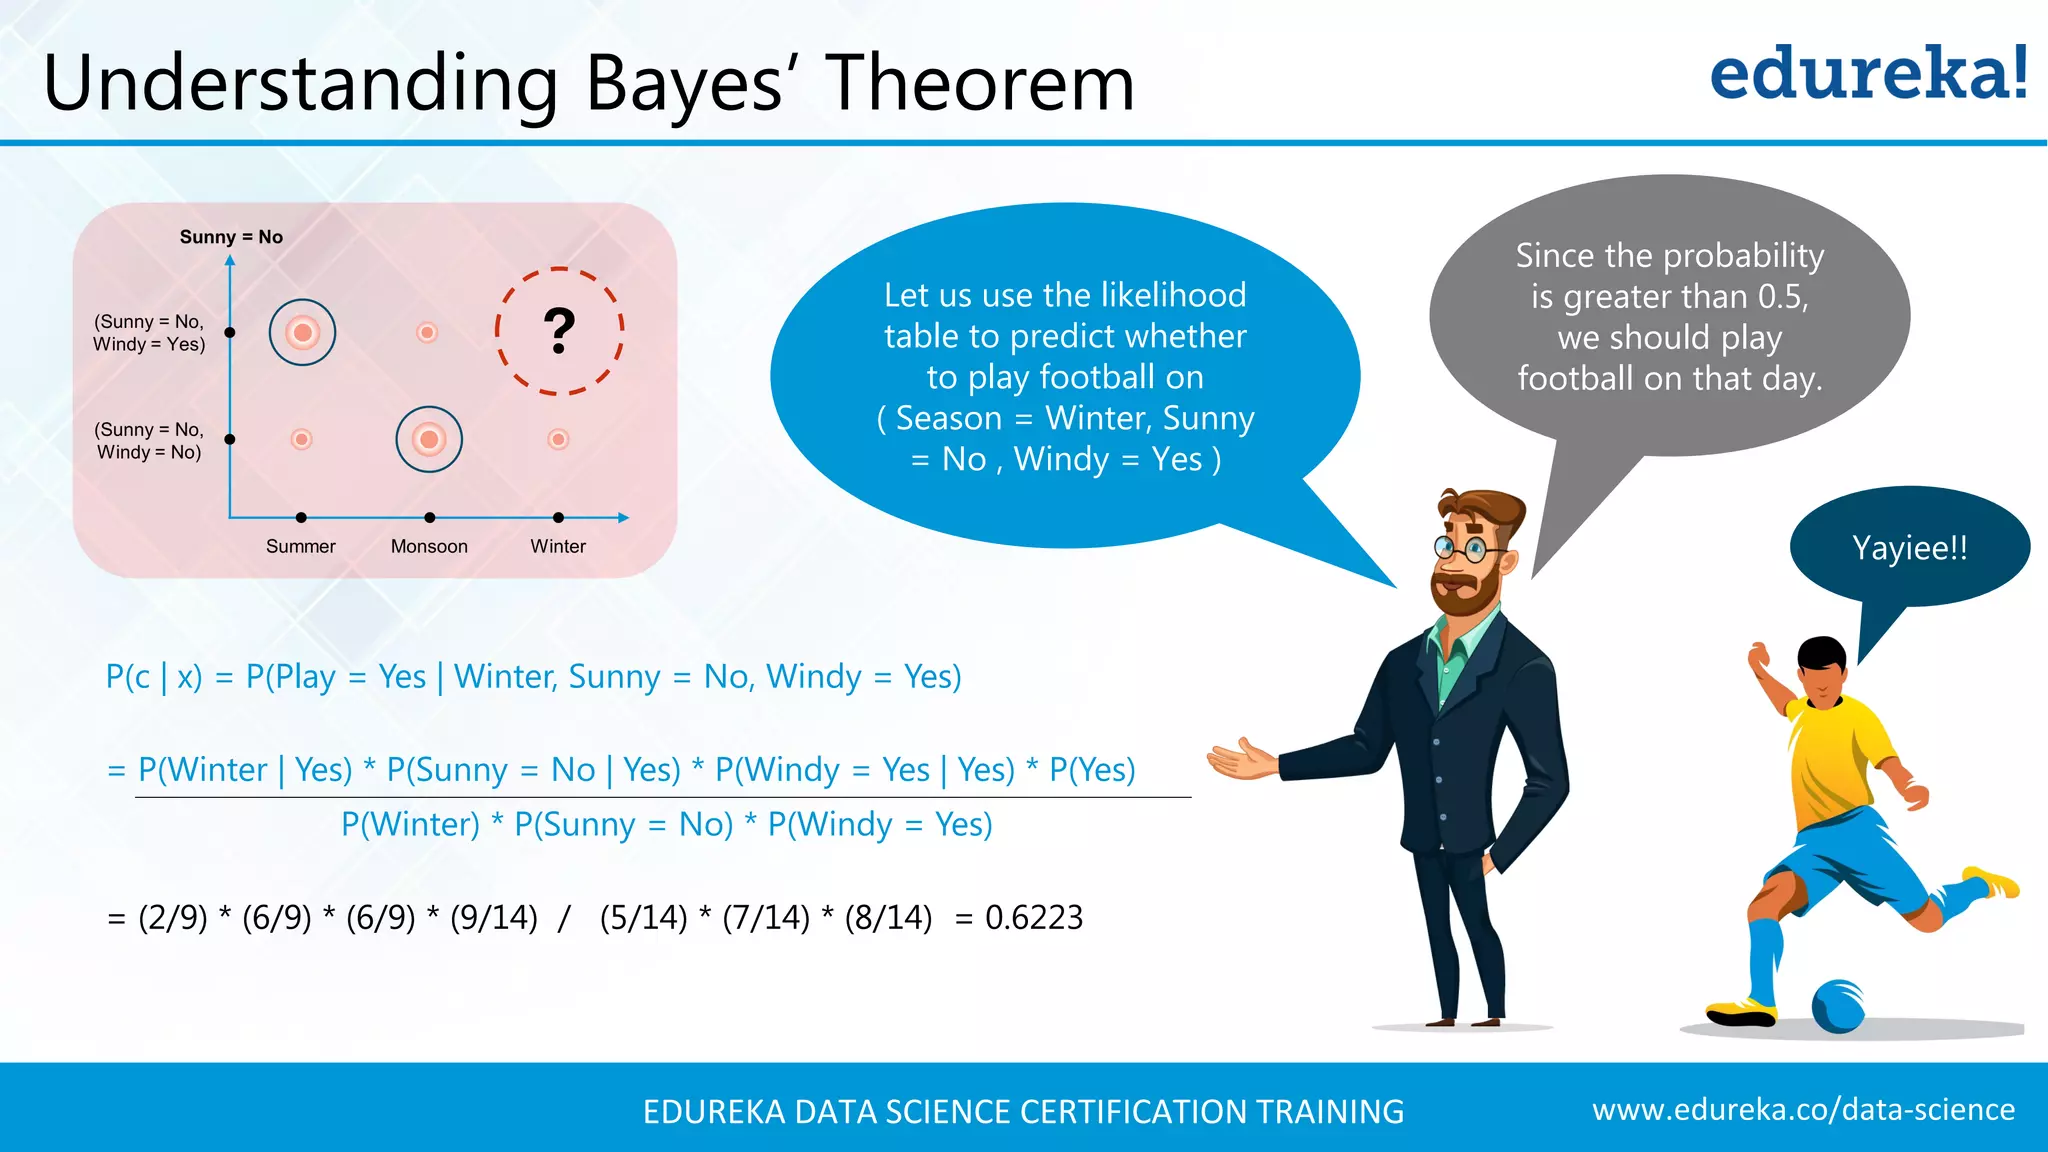
Probabilistic modeling using Naive Bayes, categorizing days based on weather attributes for decision-making.
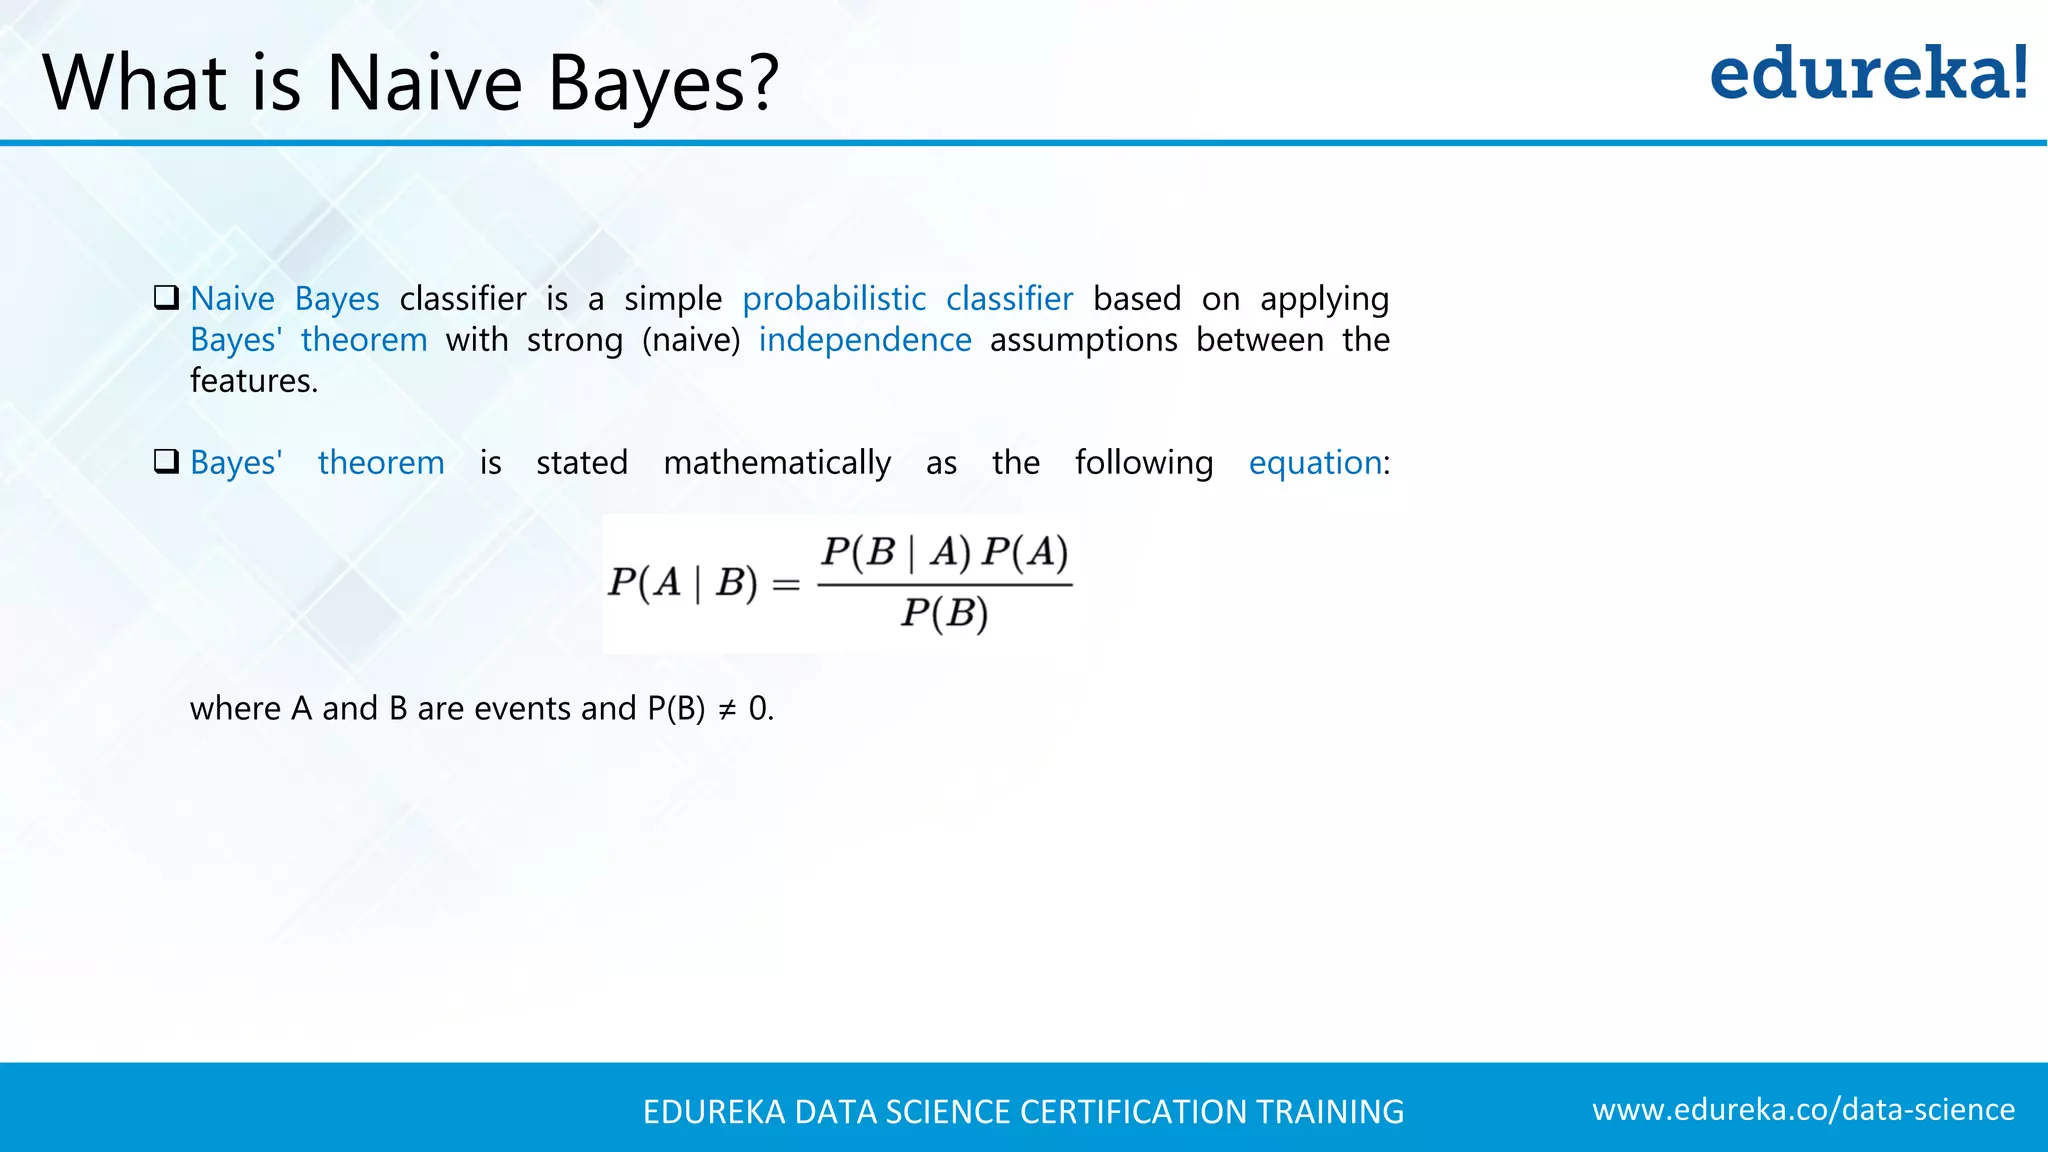
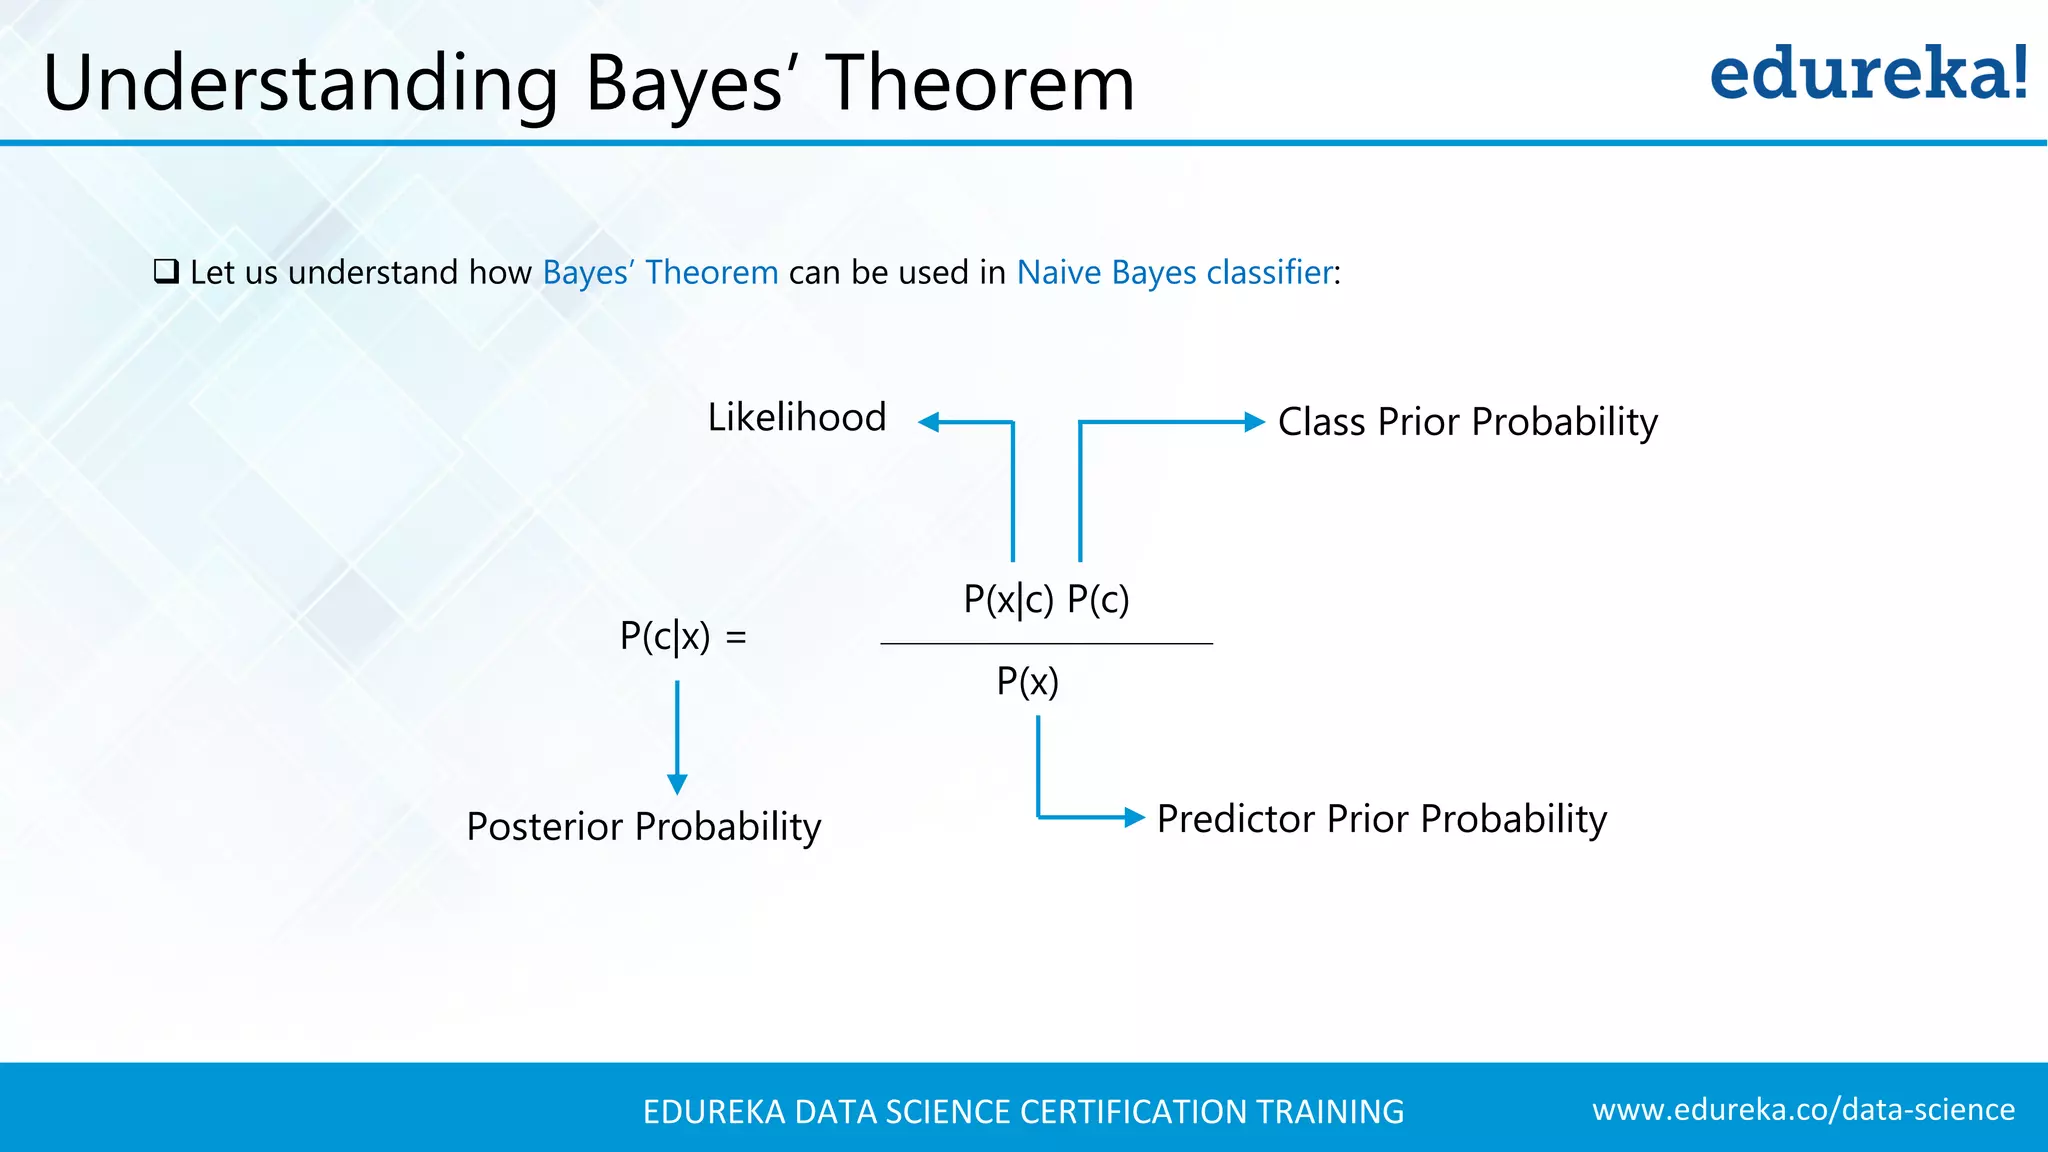
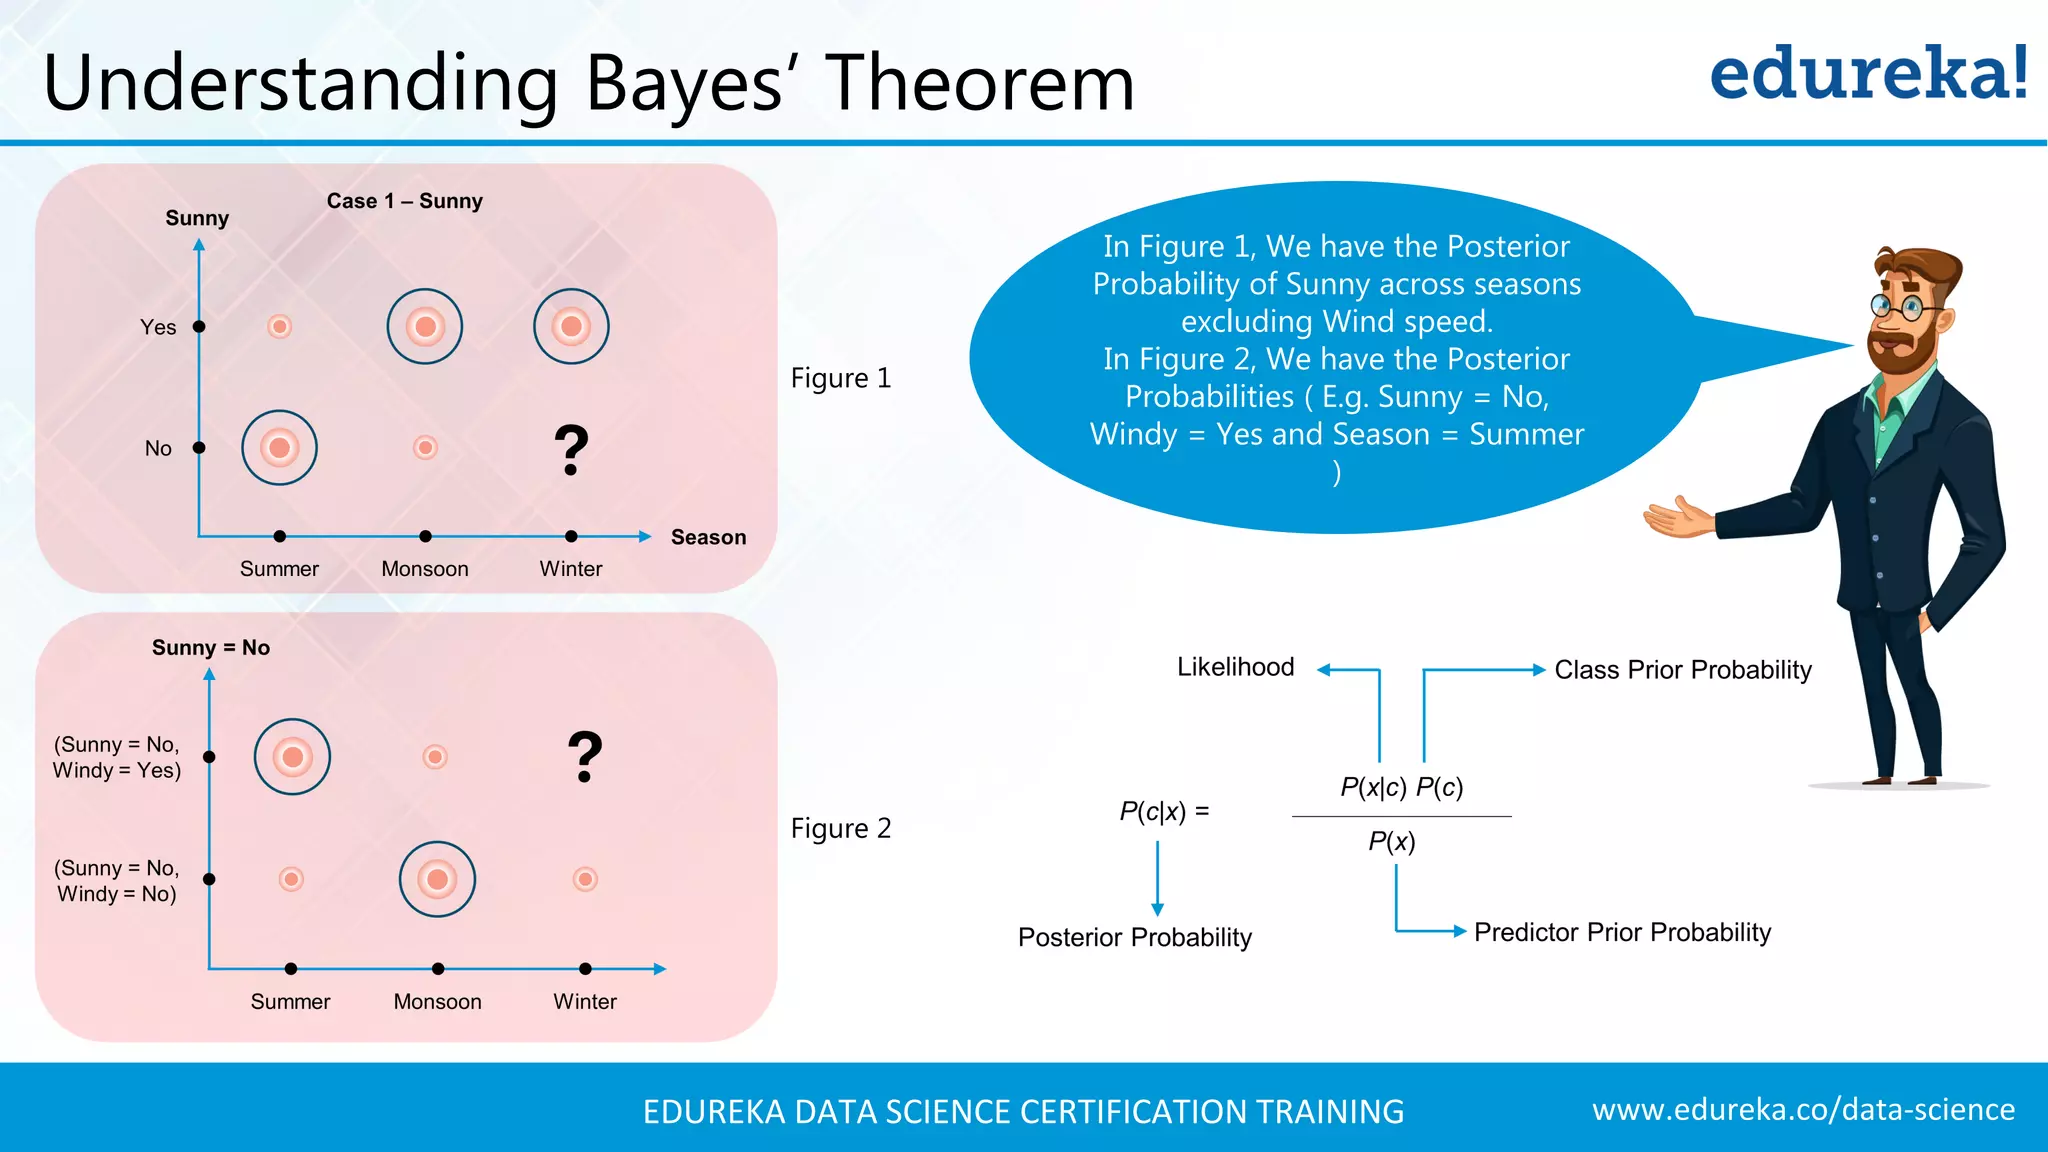
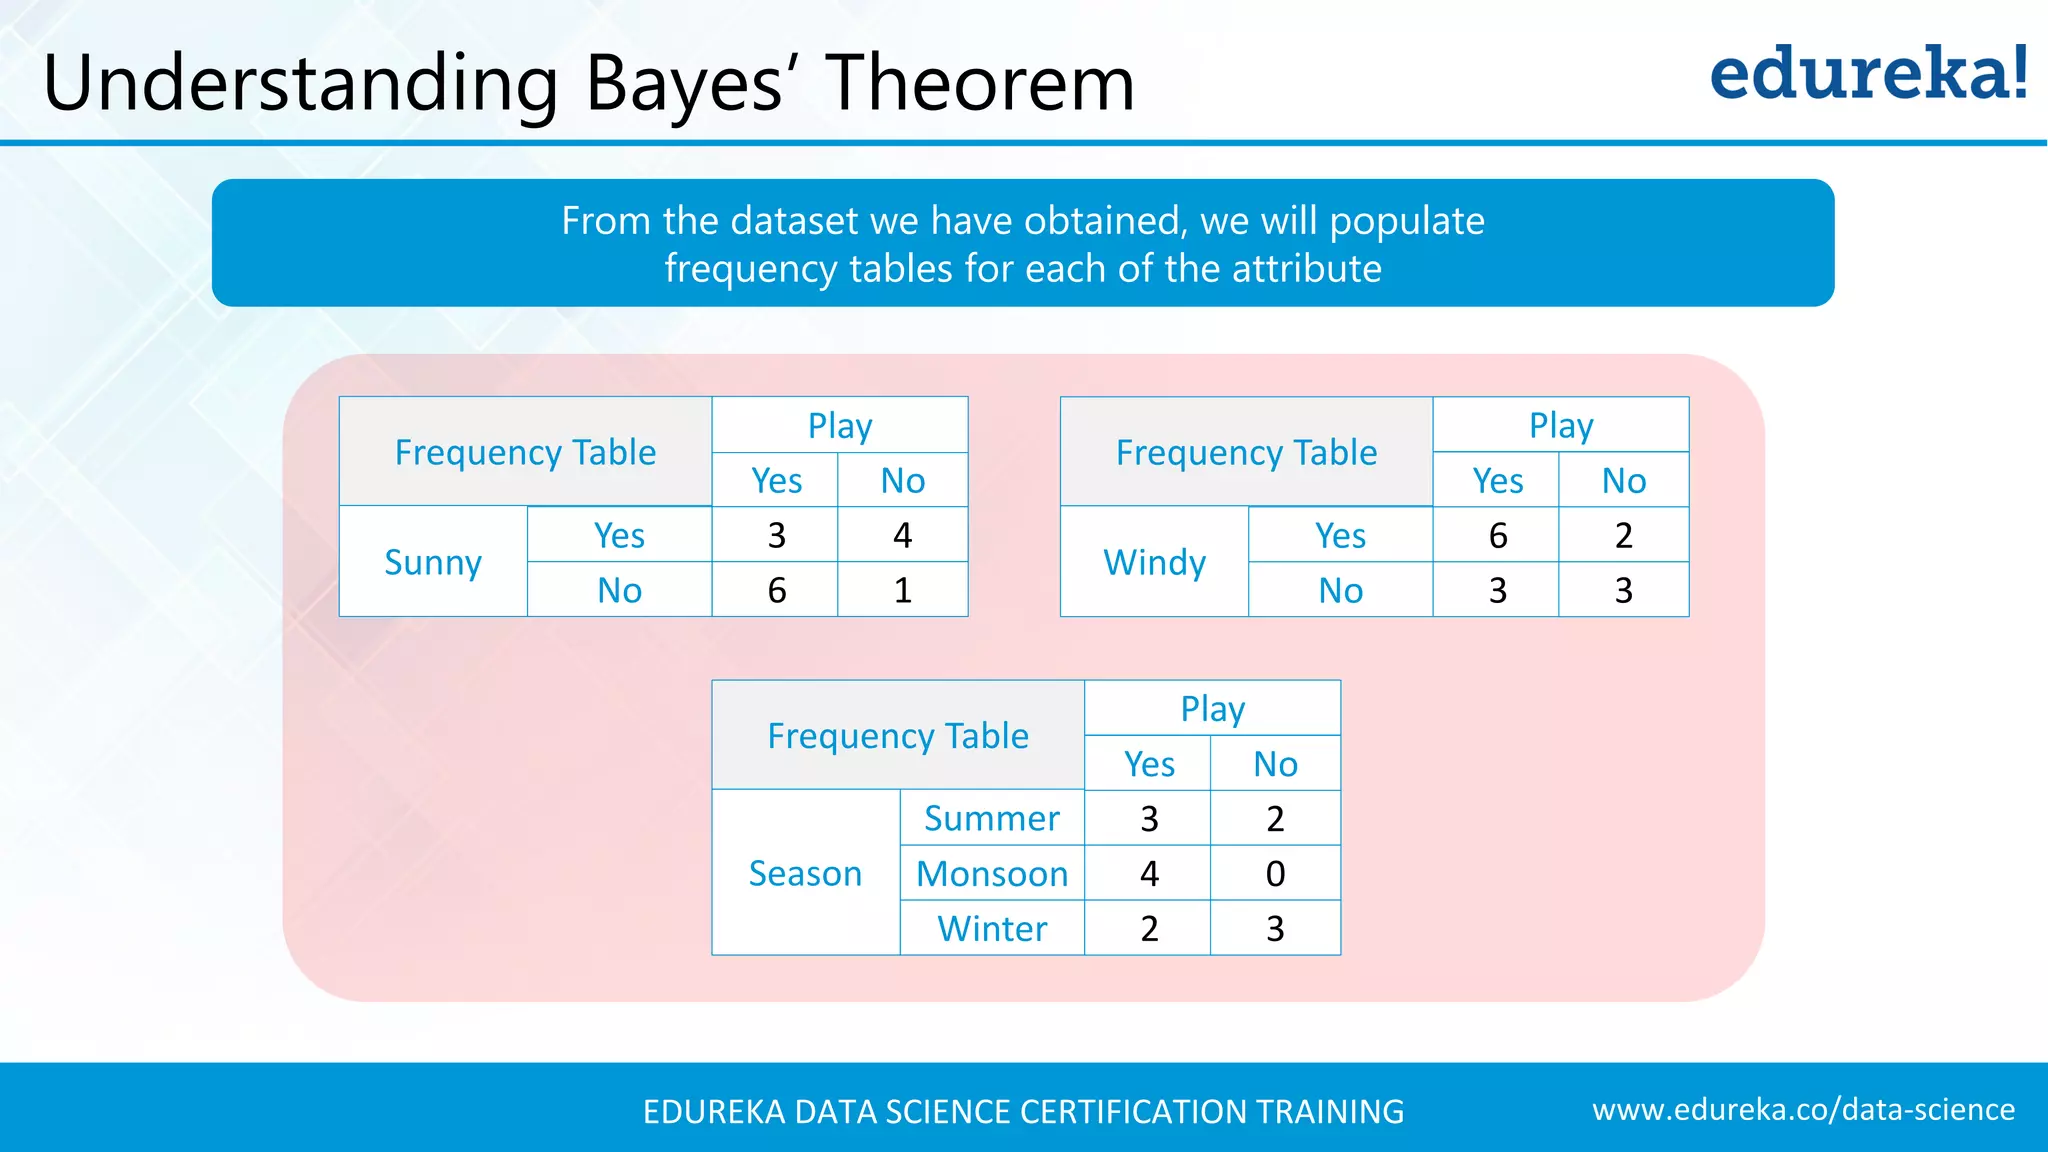
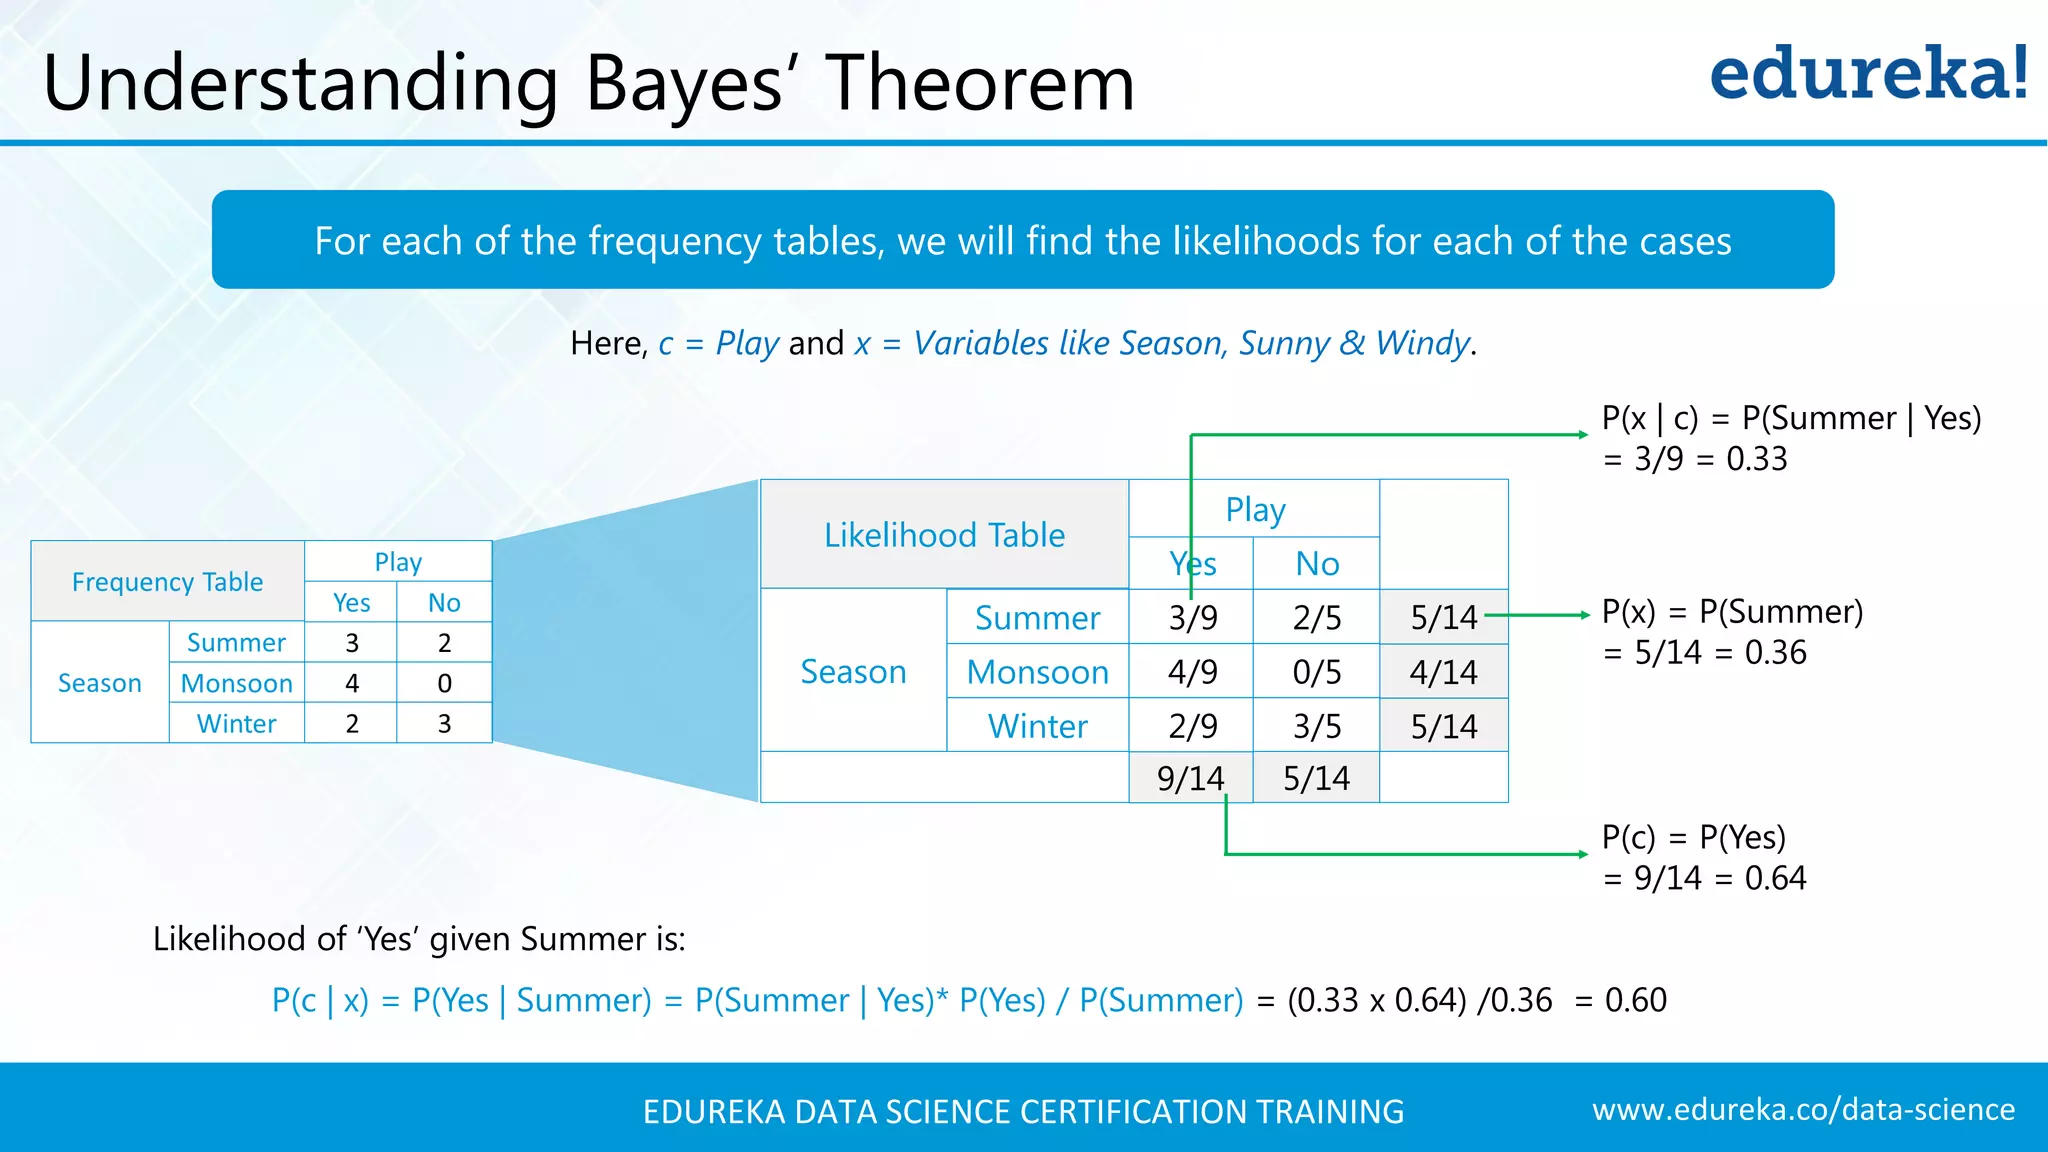
Introduction to Bayes’ theorem and its application in Naive Bayes classification with mathematical representation.
Using Bayes' theorem to calculate posterior probabilities for predicting whether to play football on specific days.
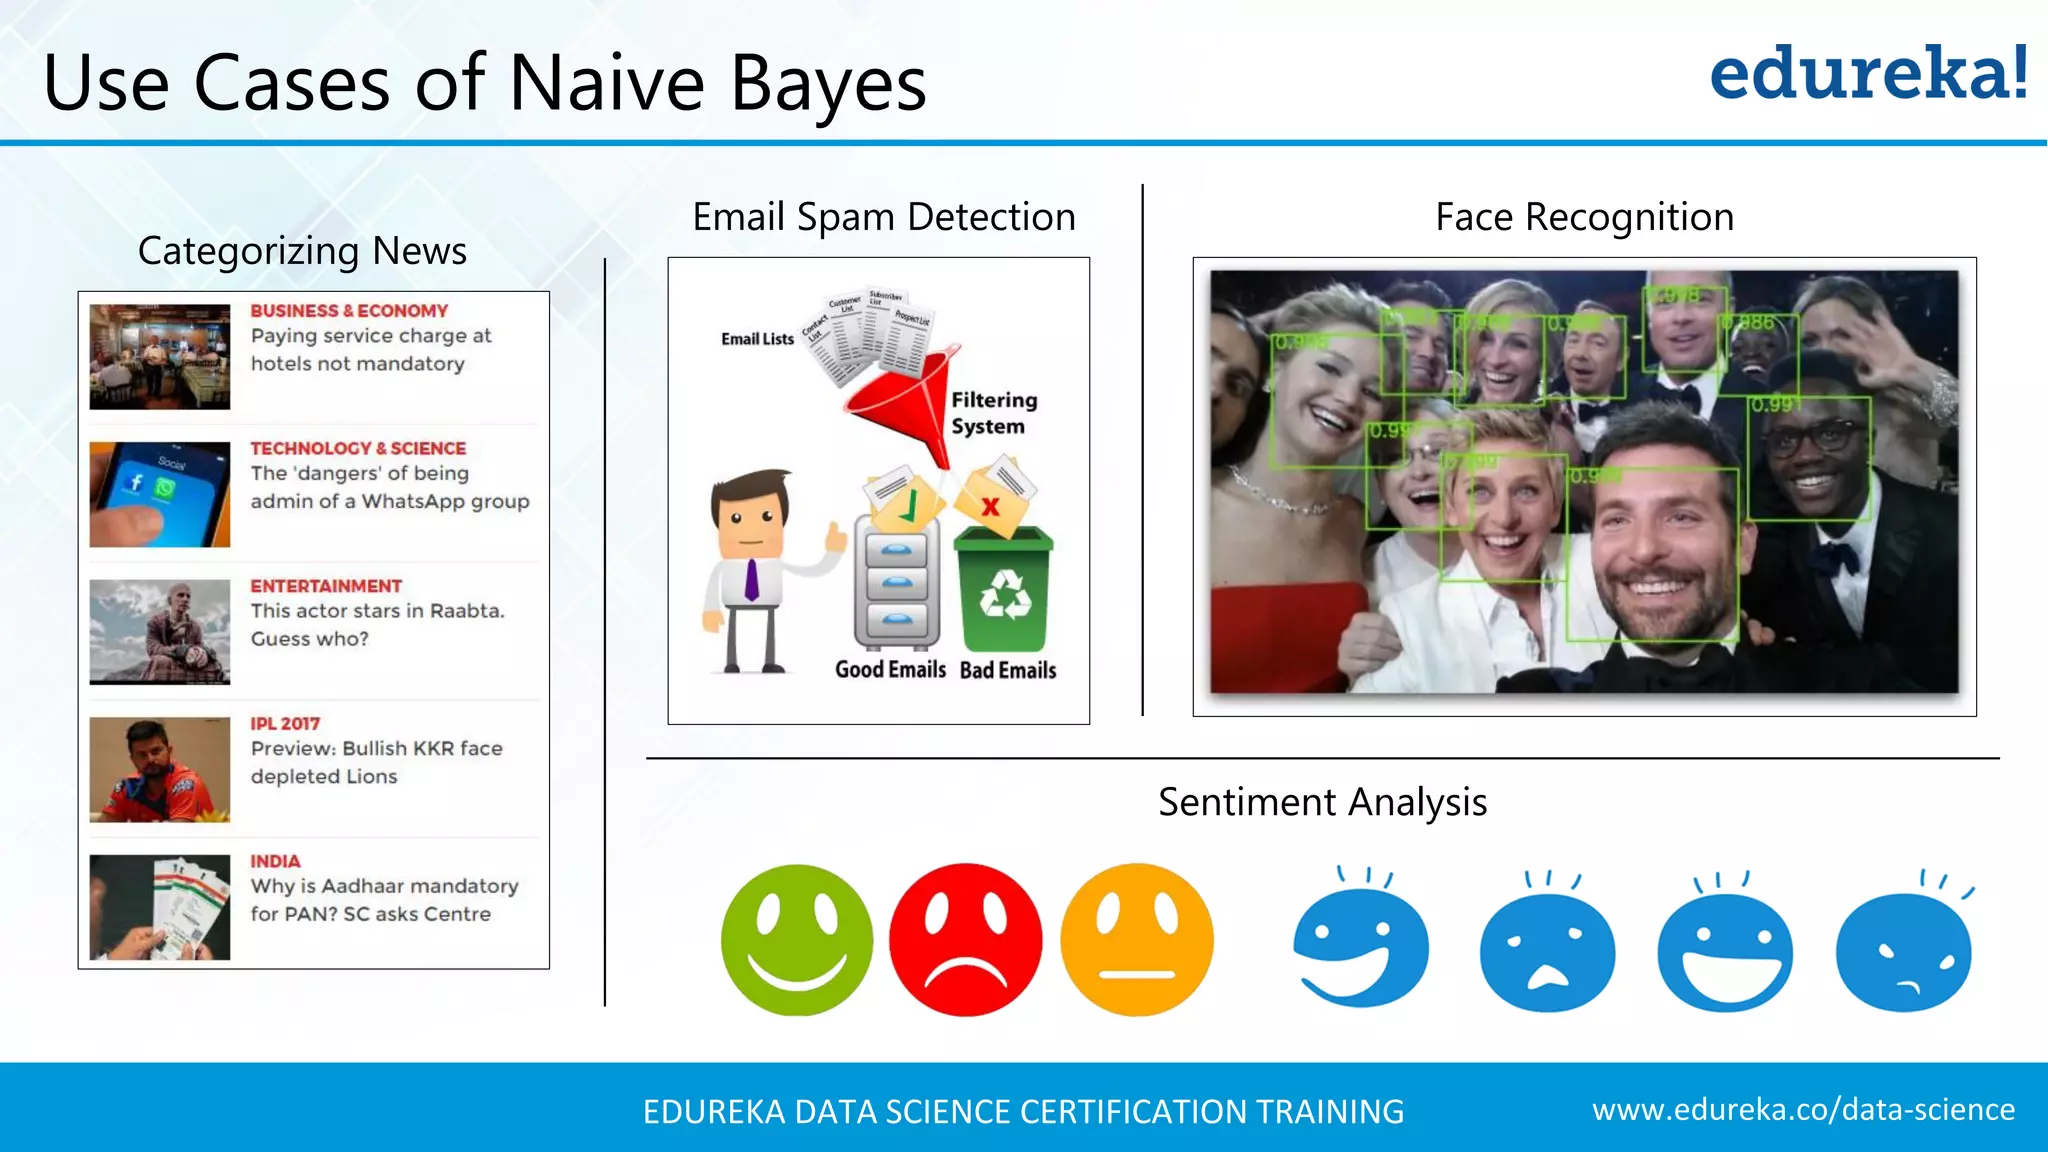
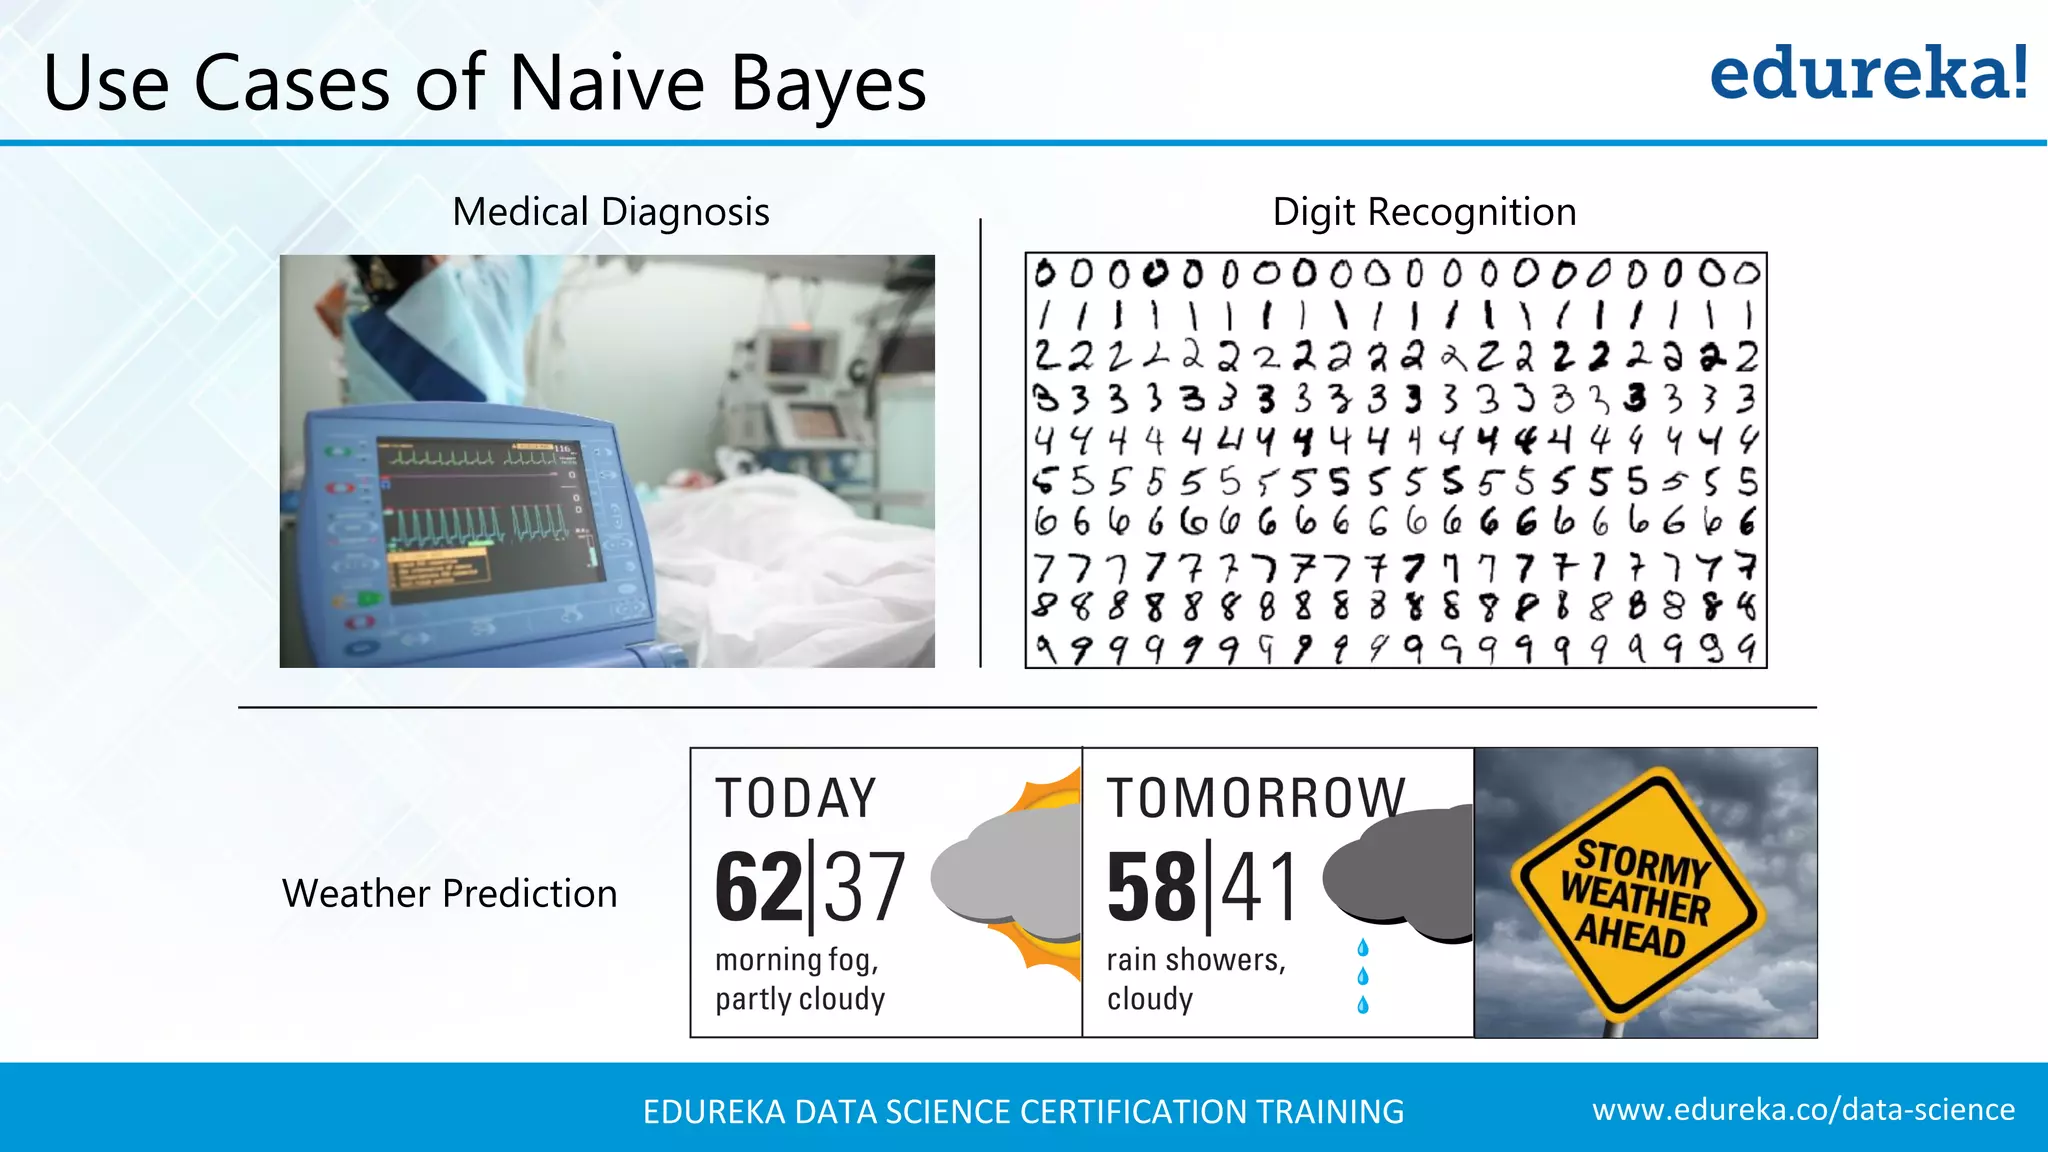
Application of Naive Bayes in various domains including email spam detection, sentiment analysis, and medical diagnosis.
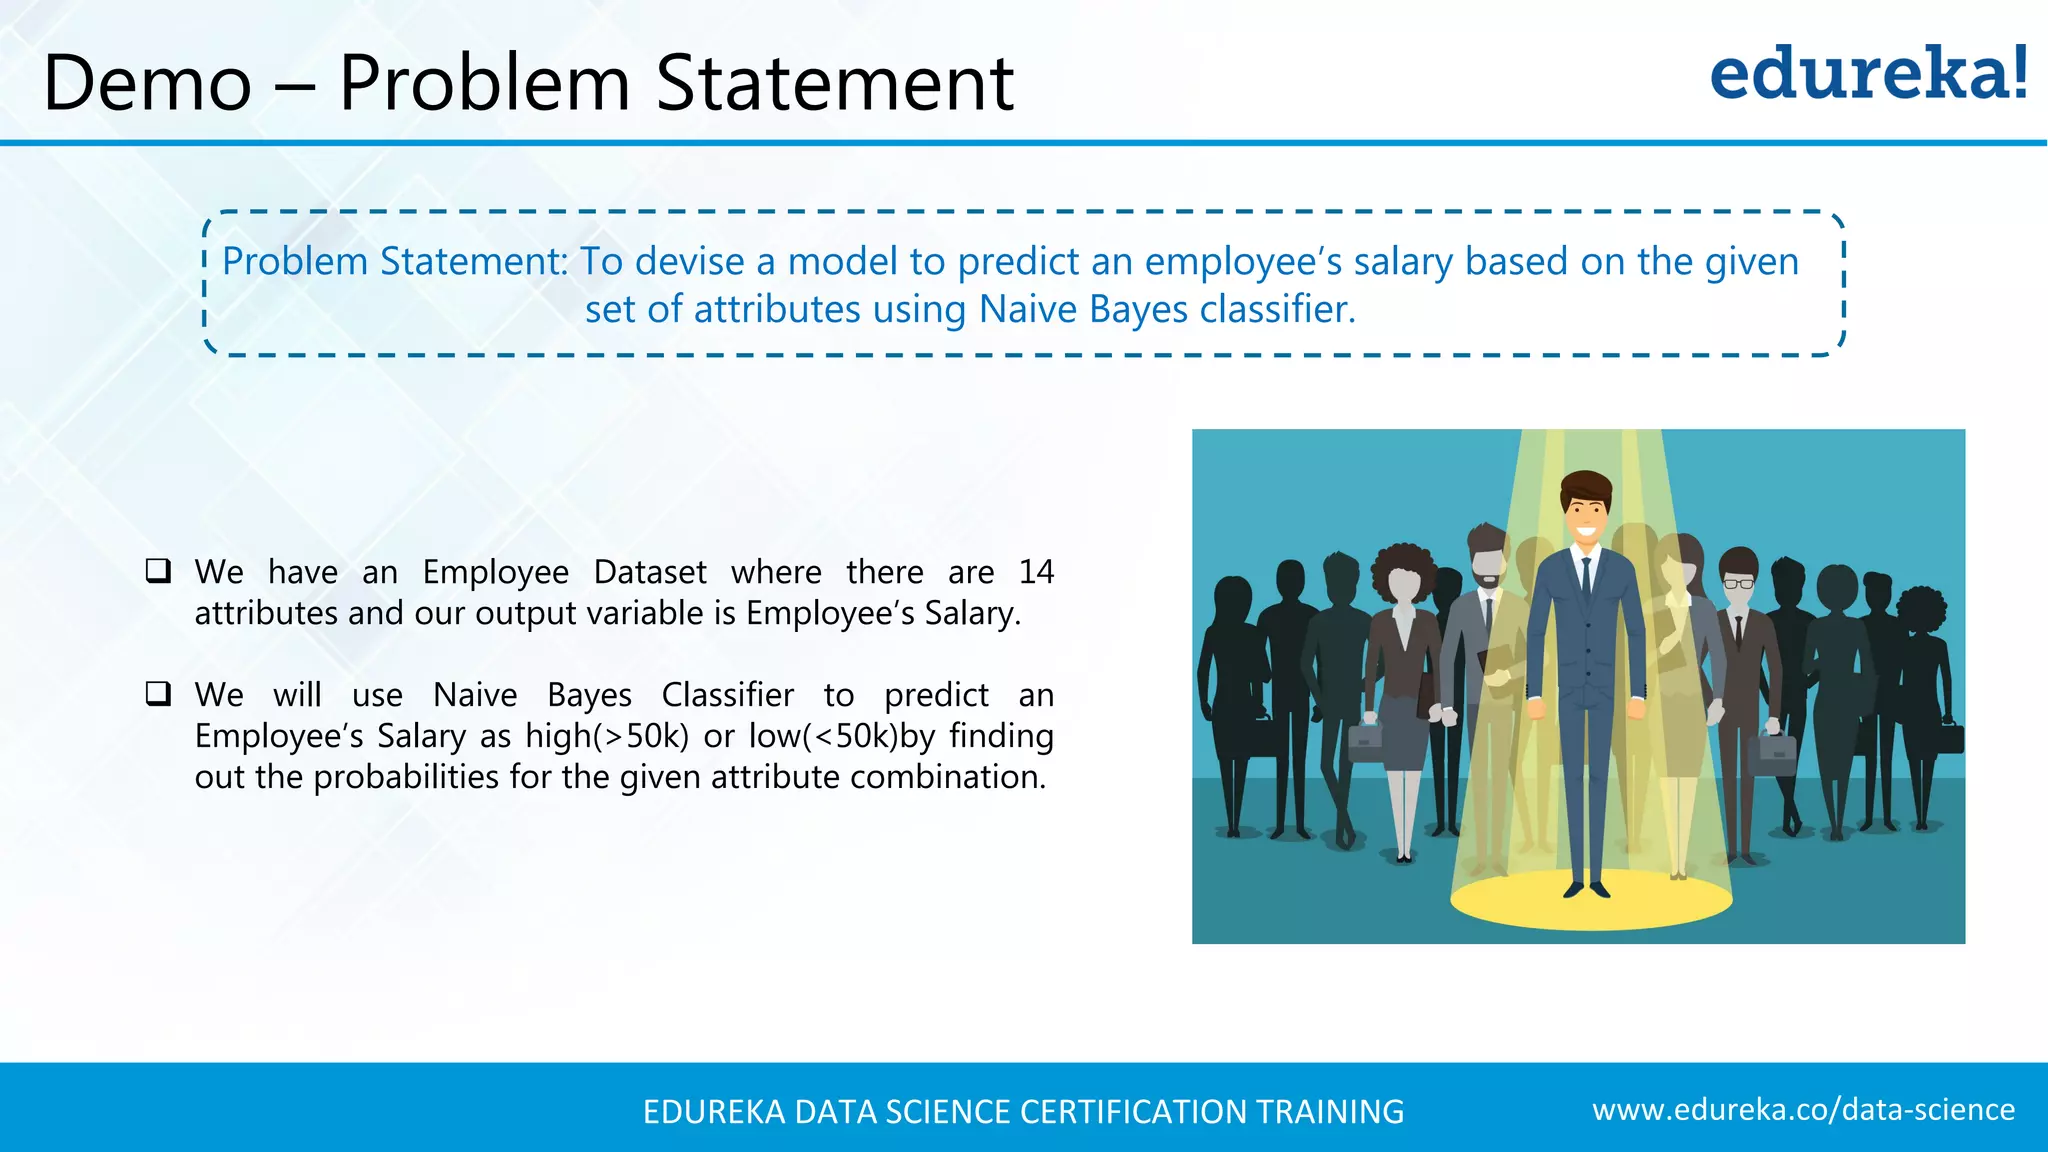
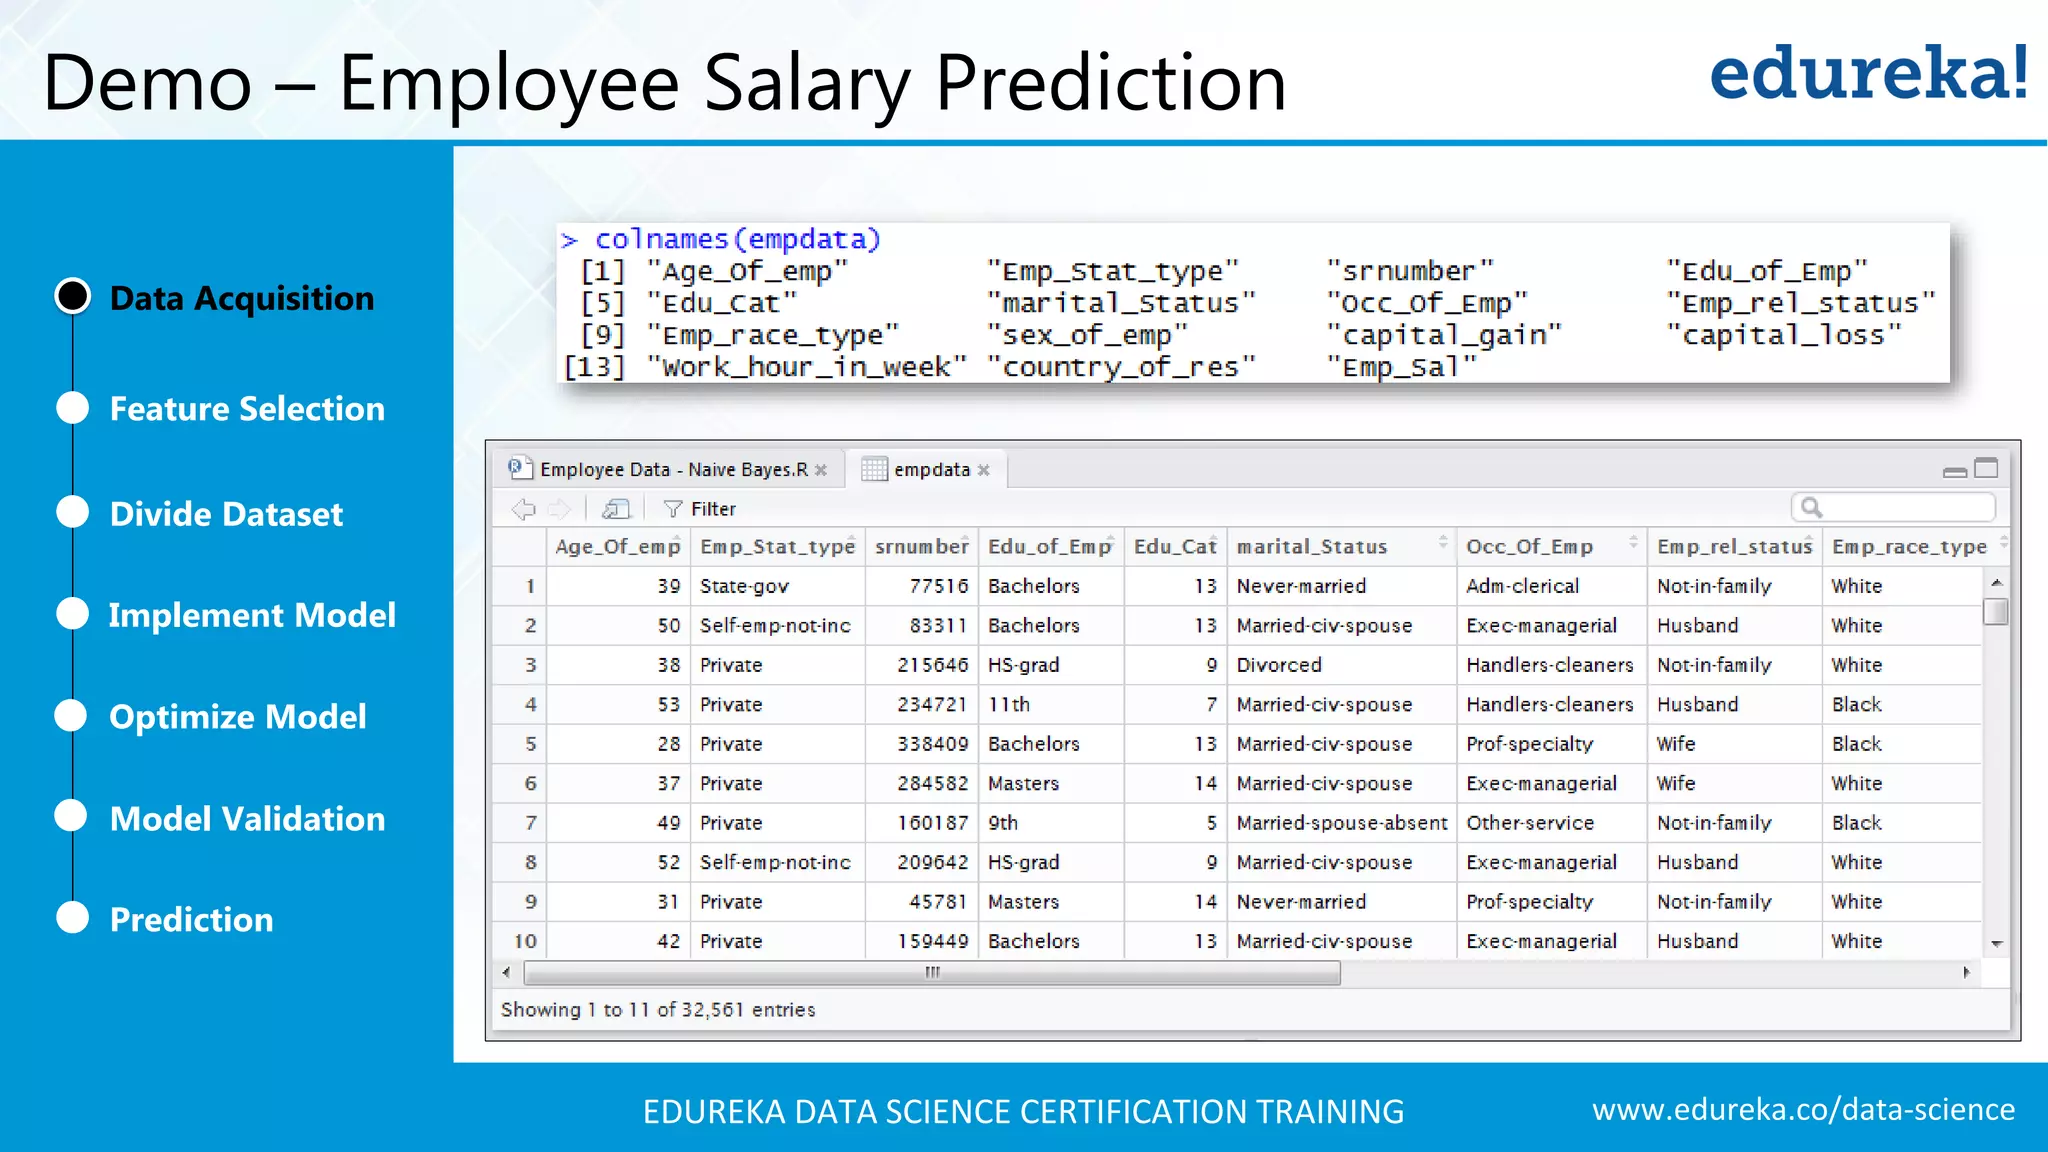
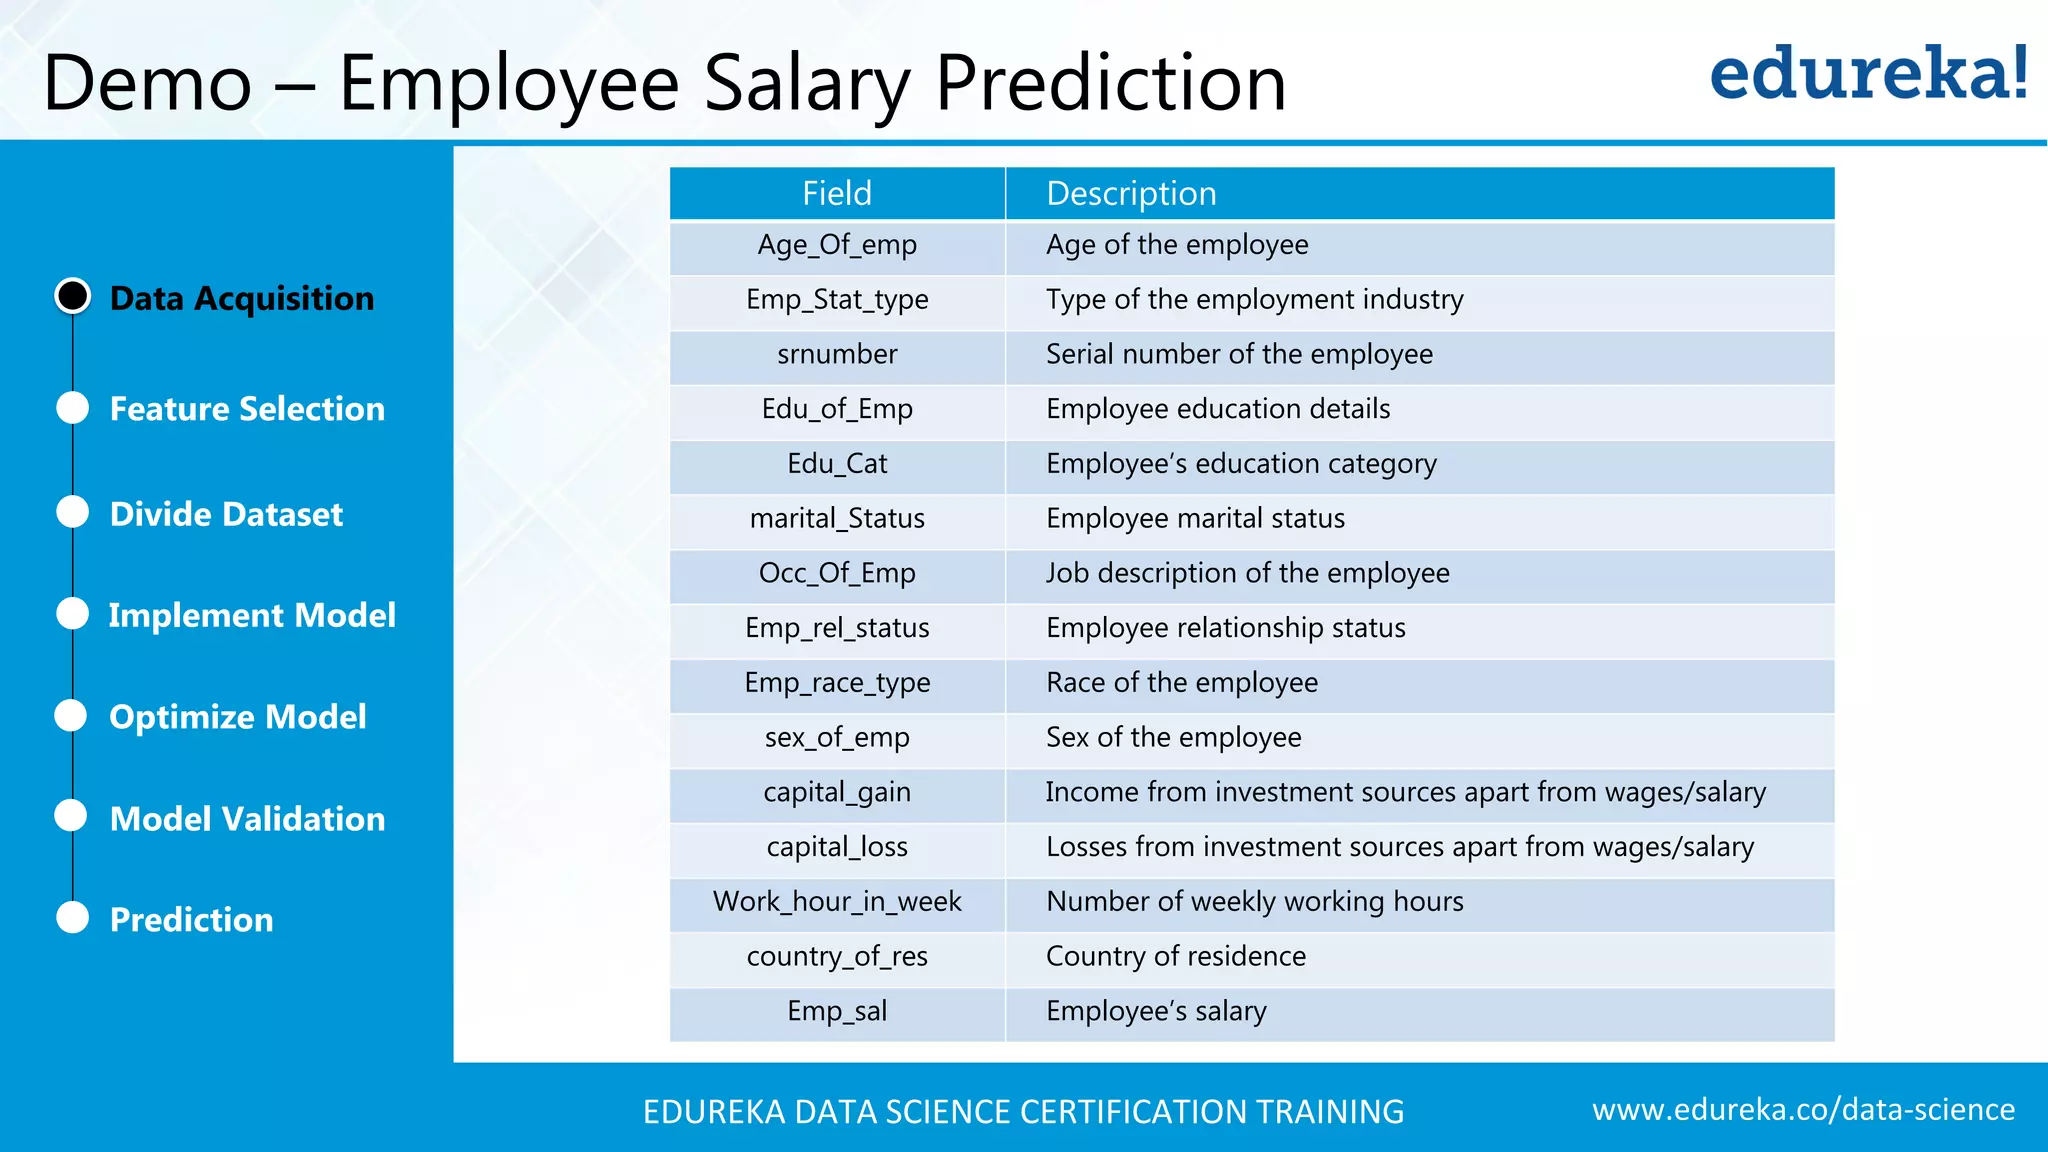
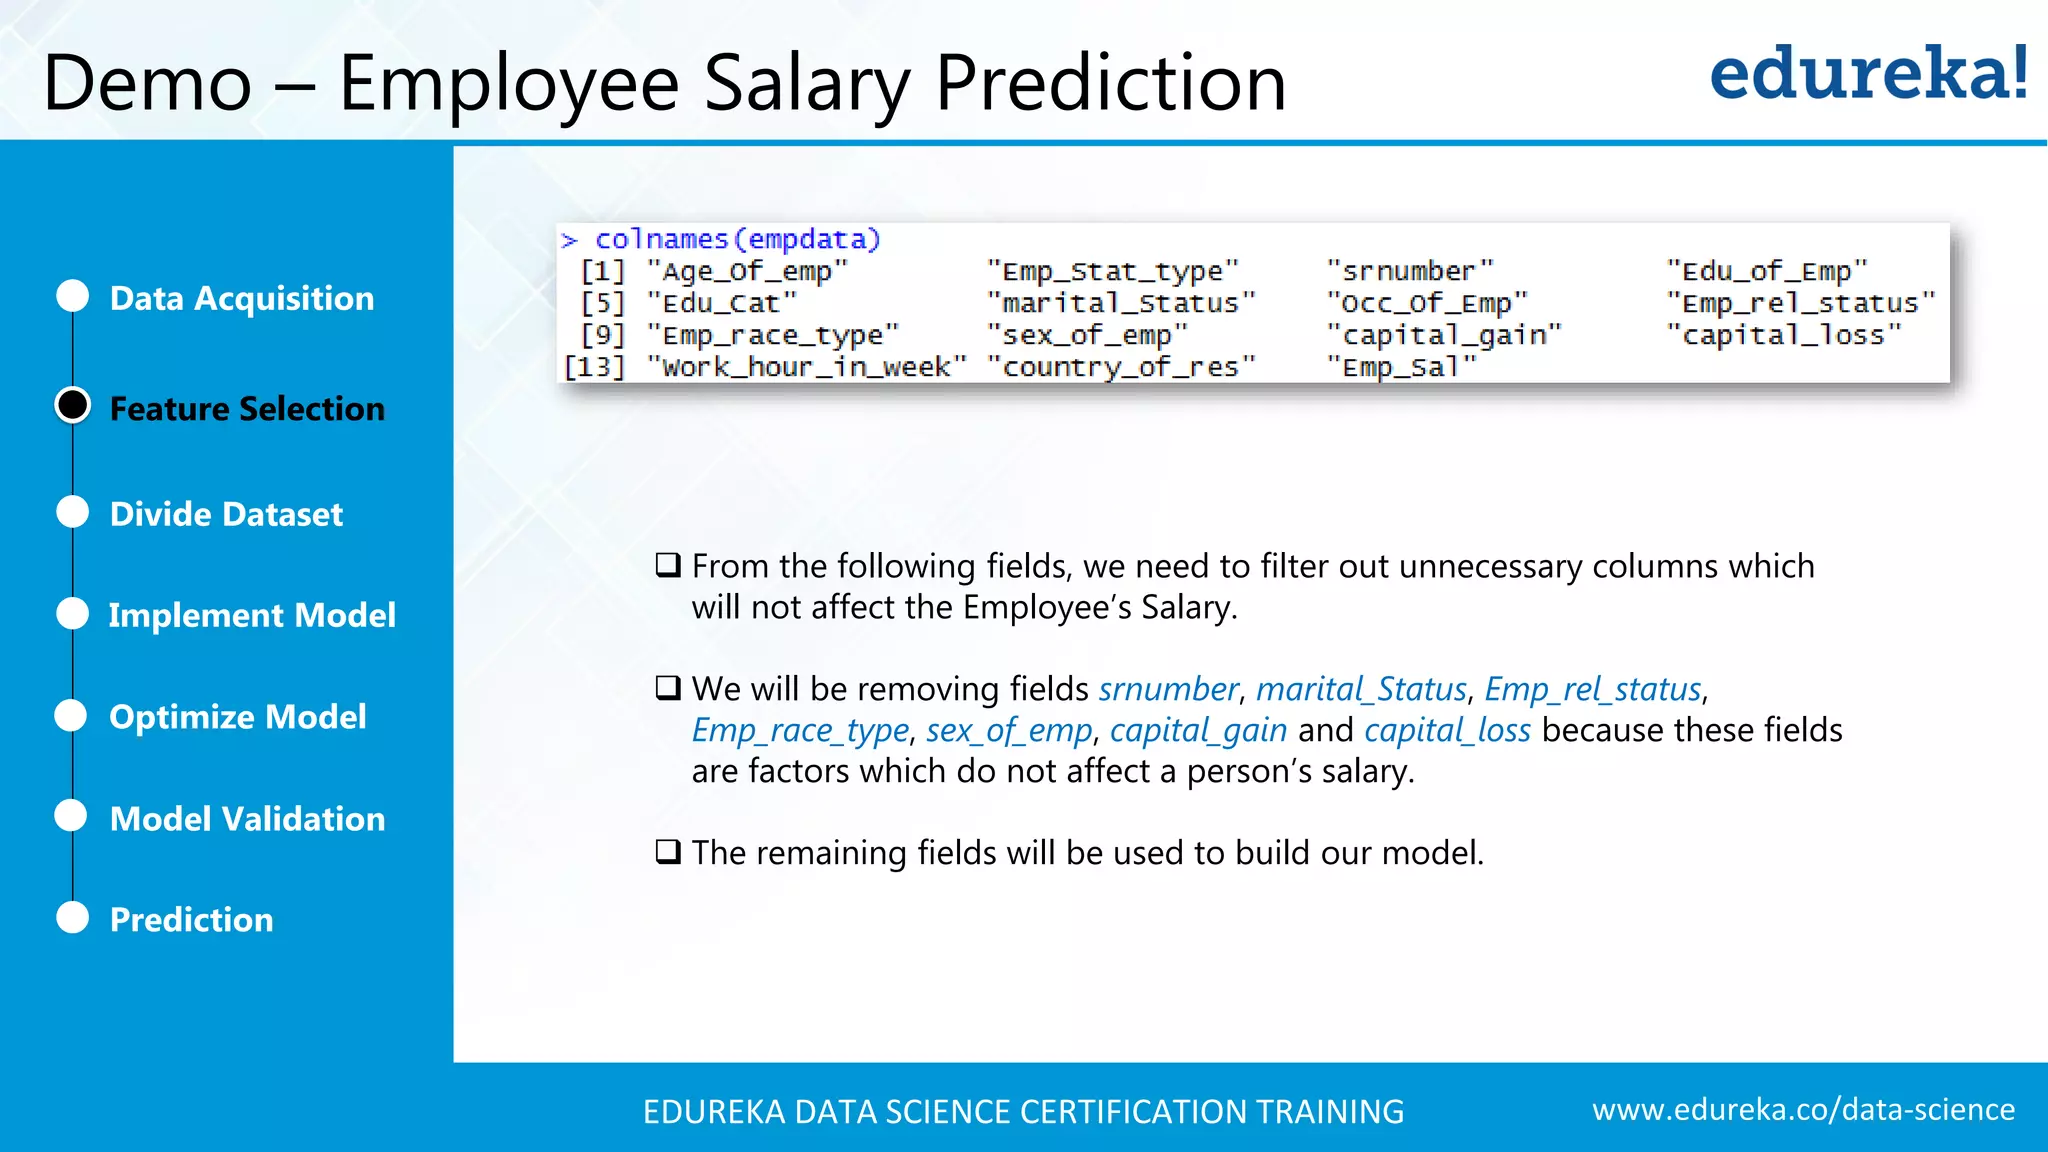
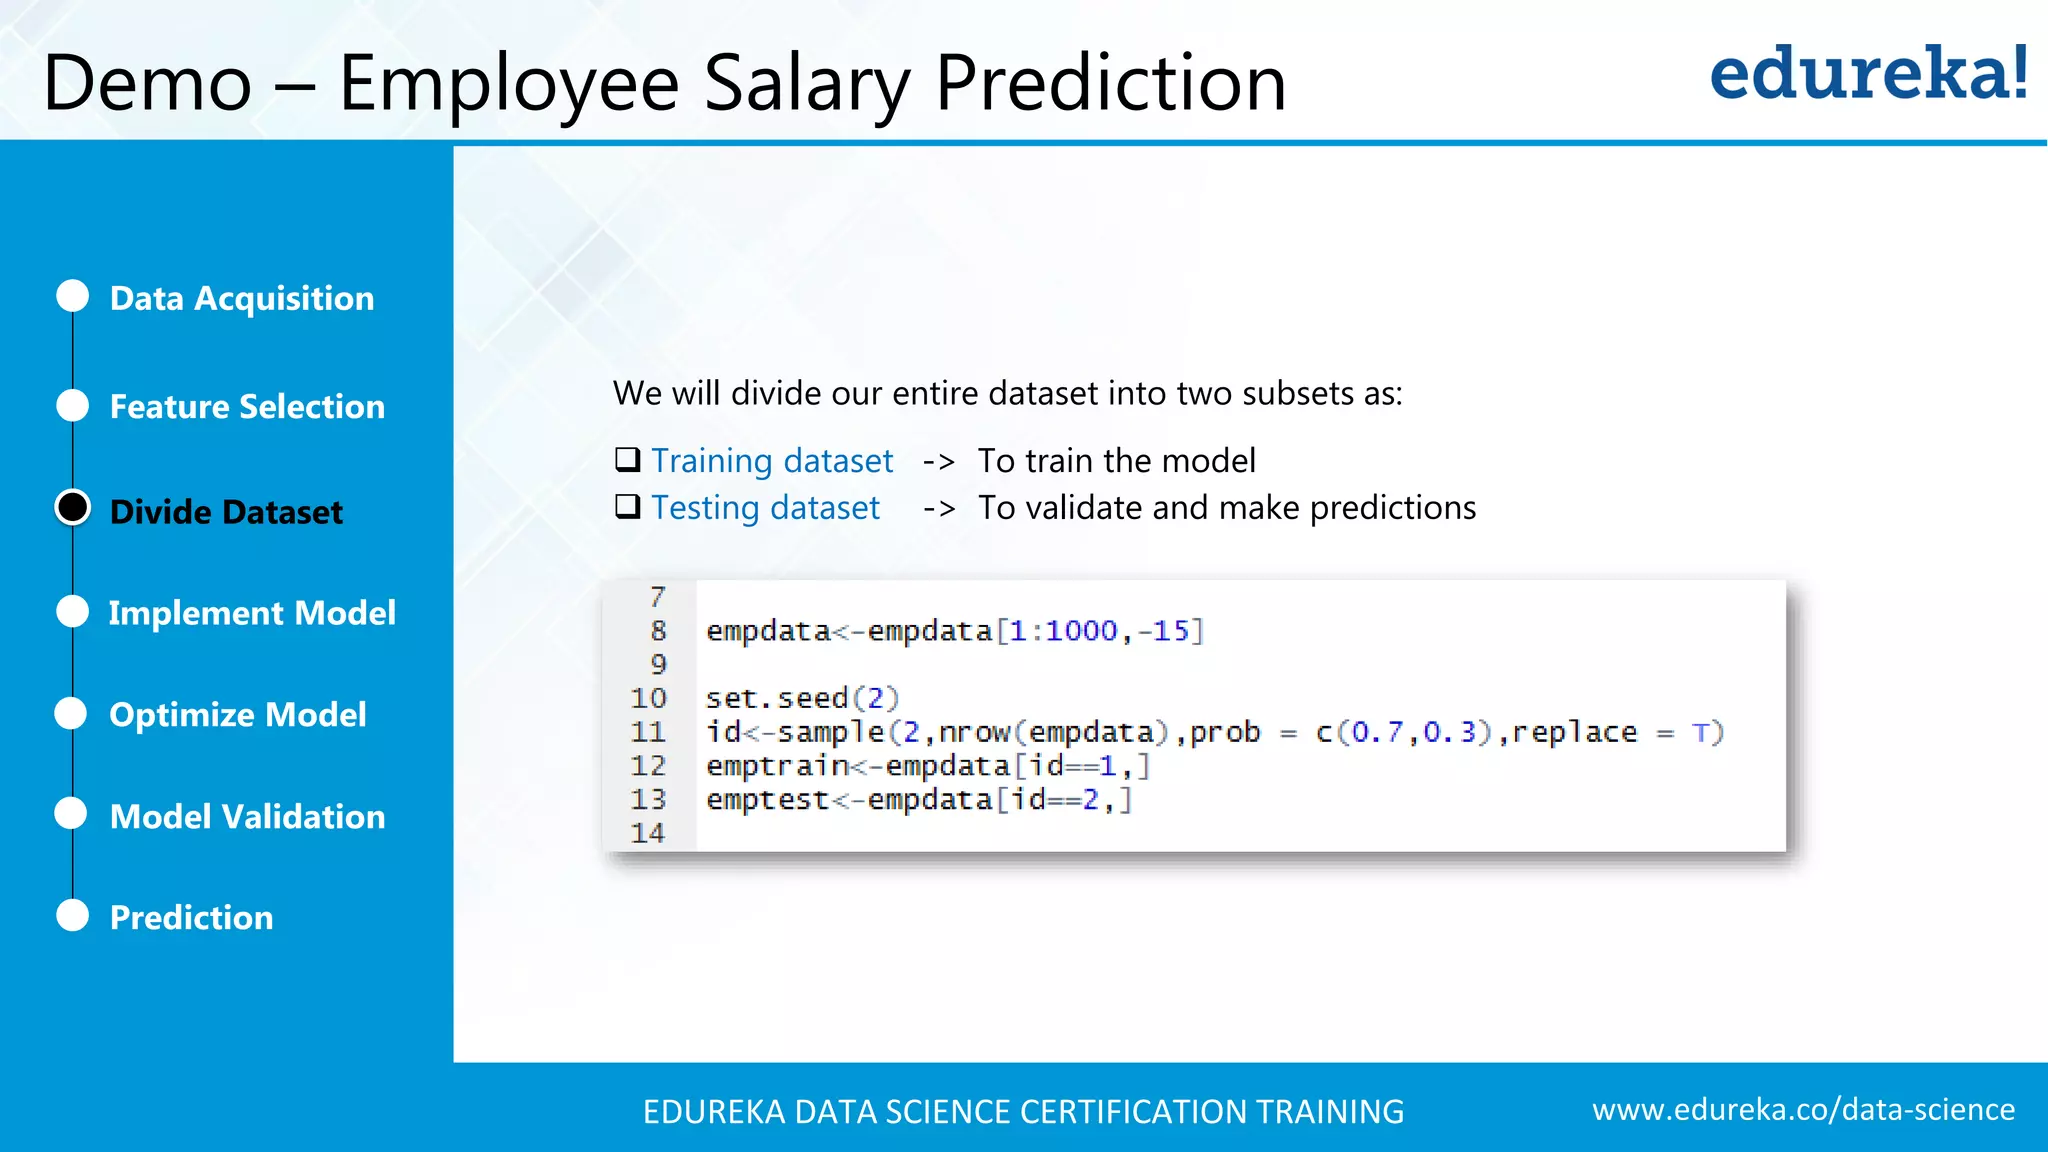
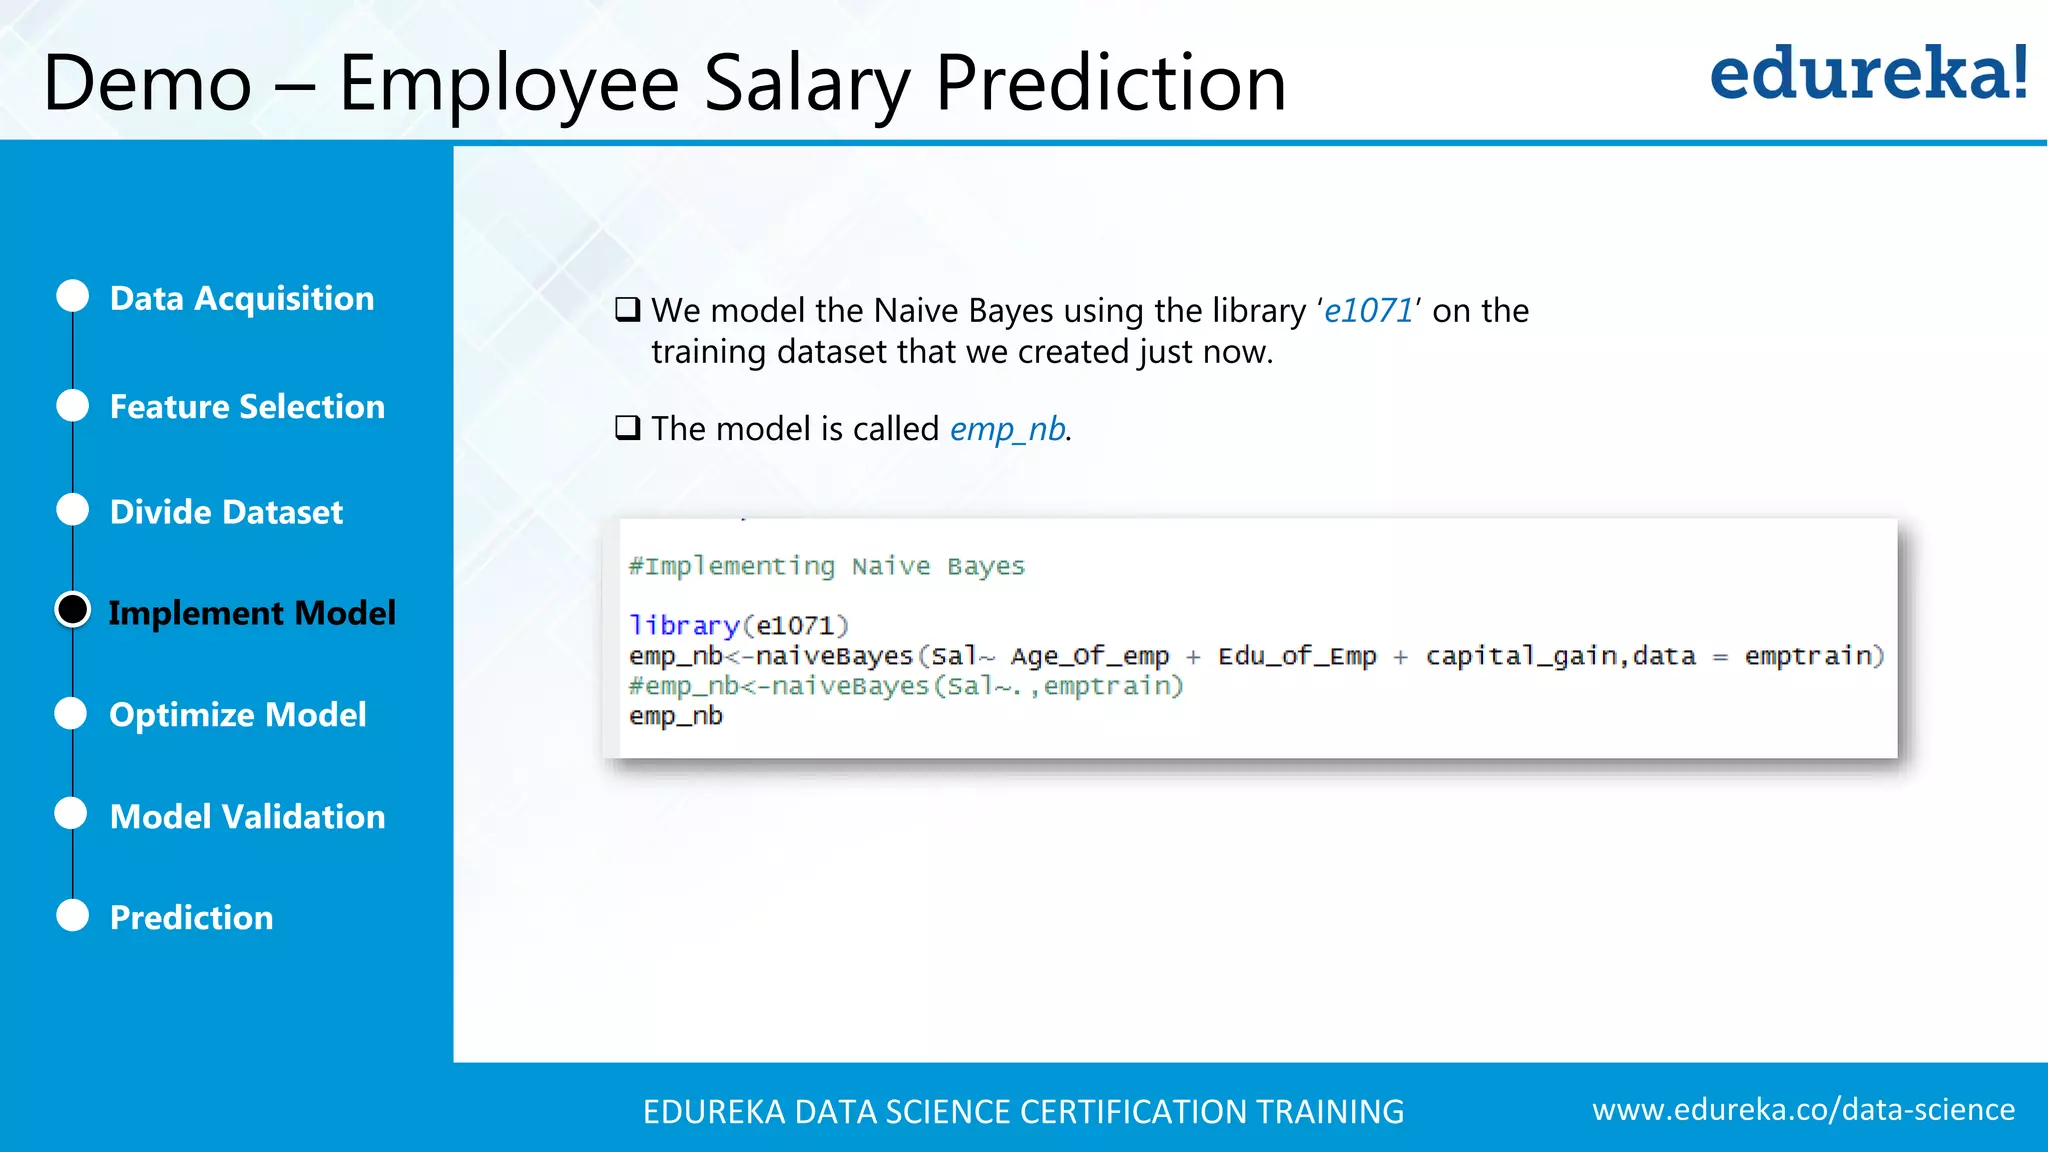
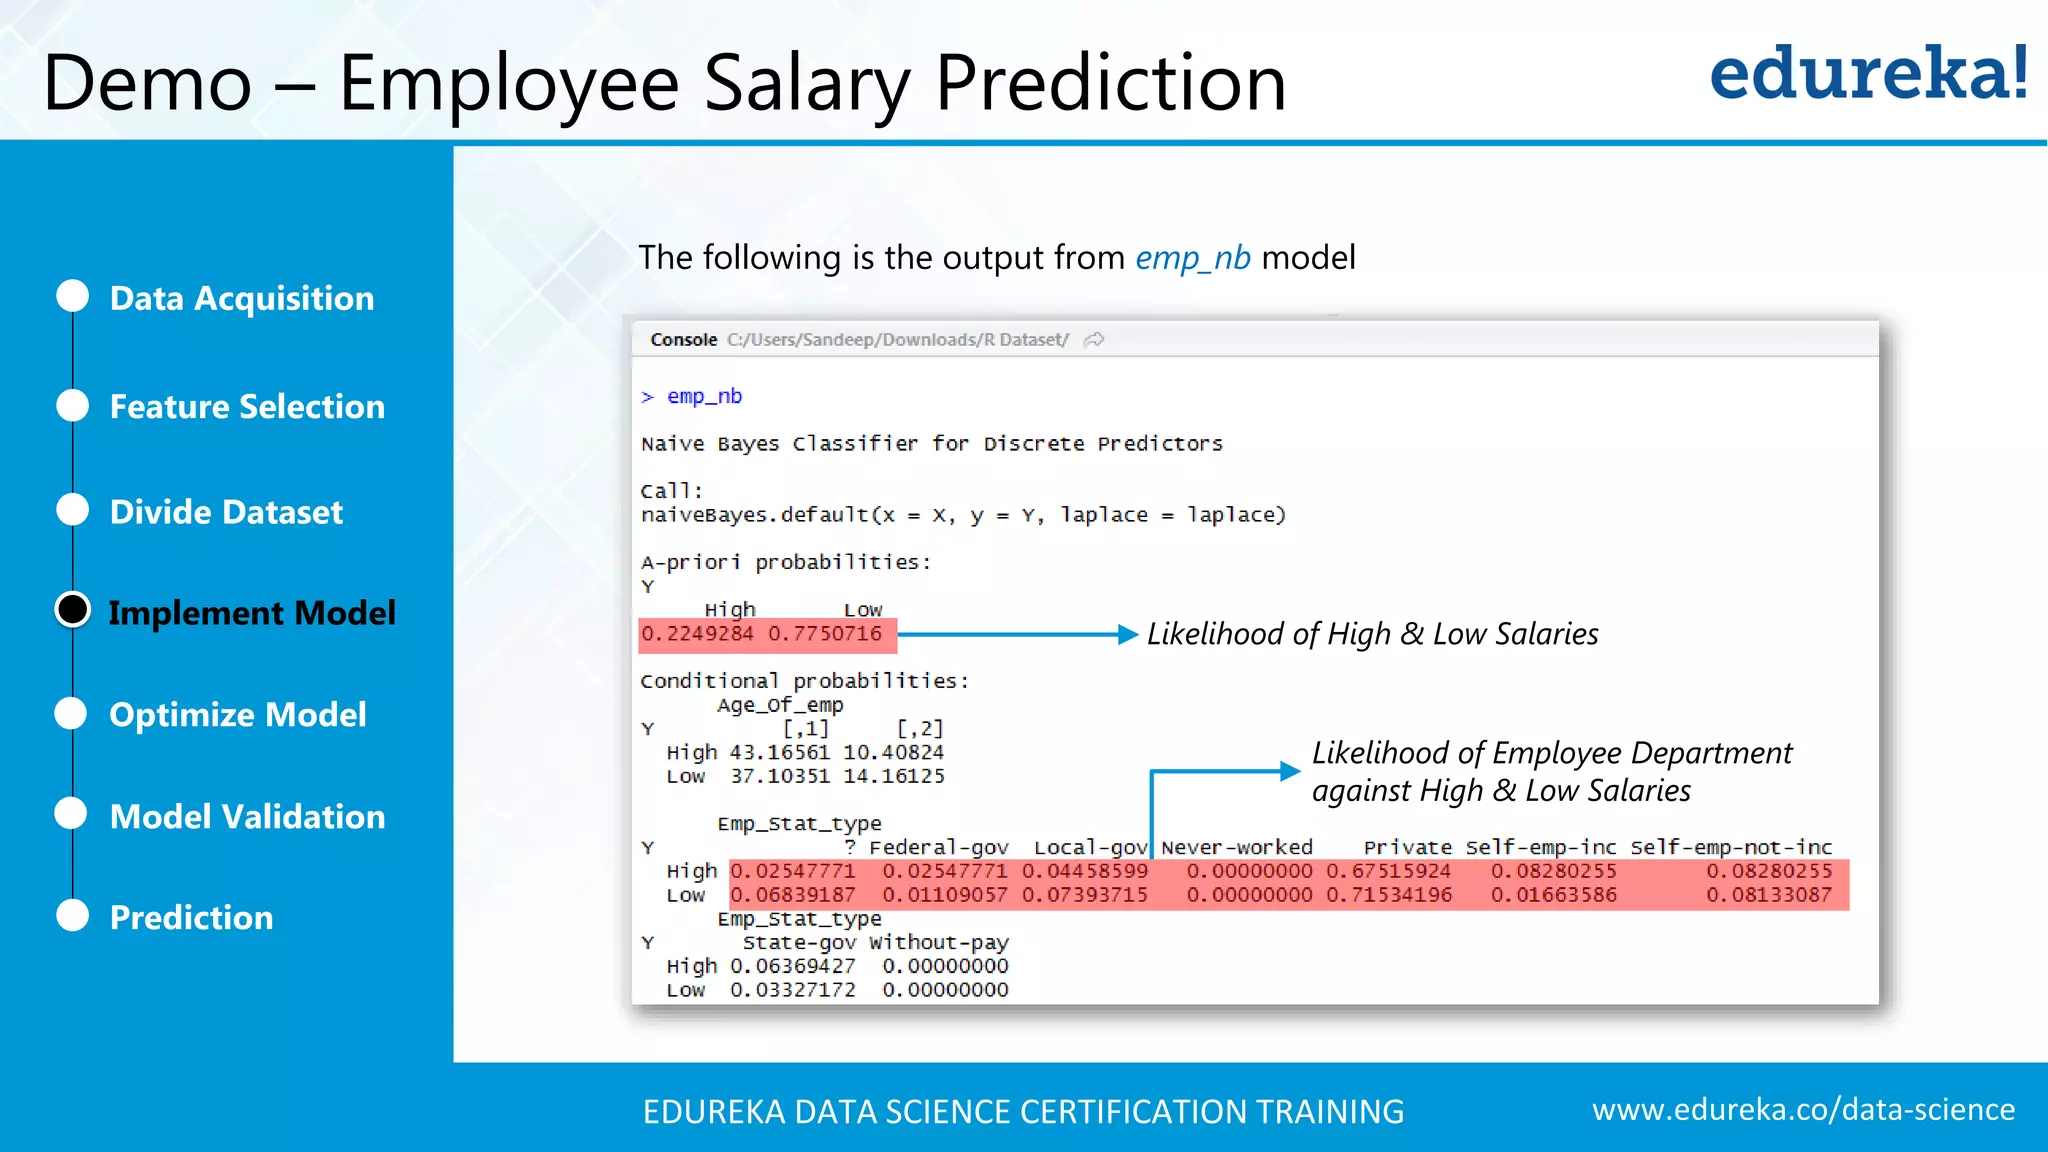
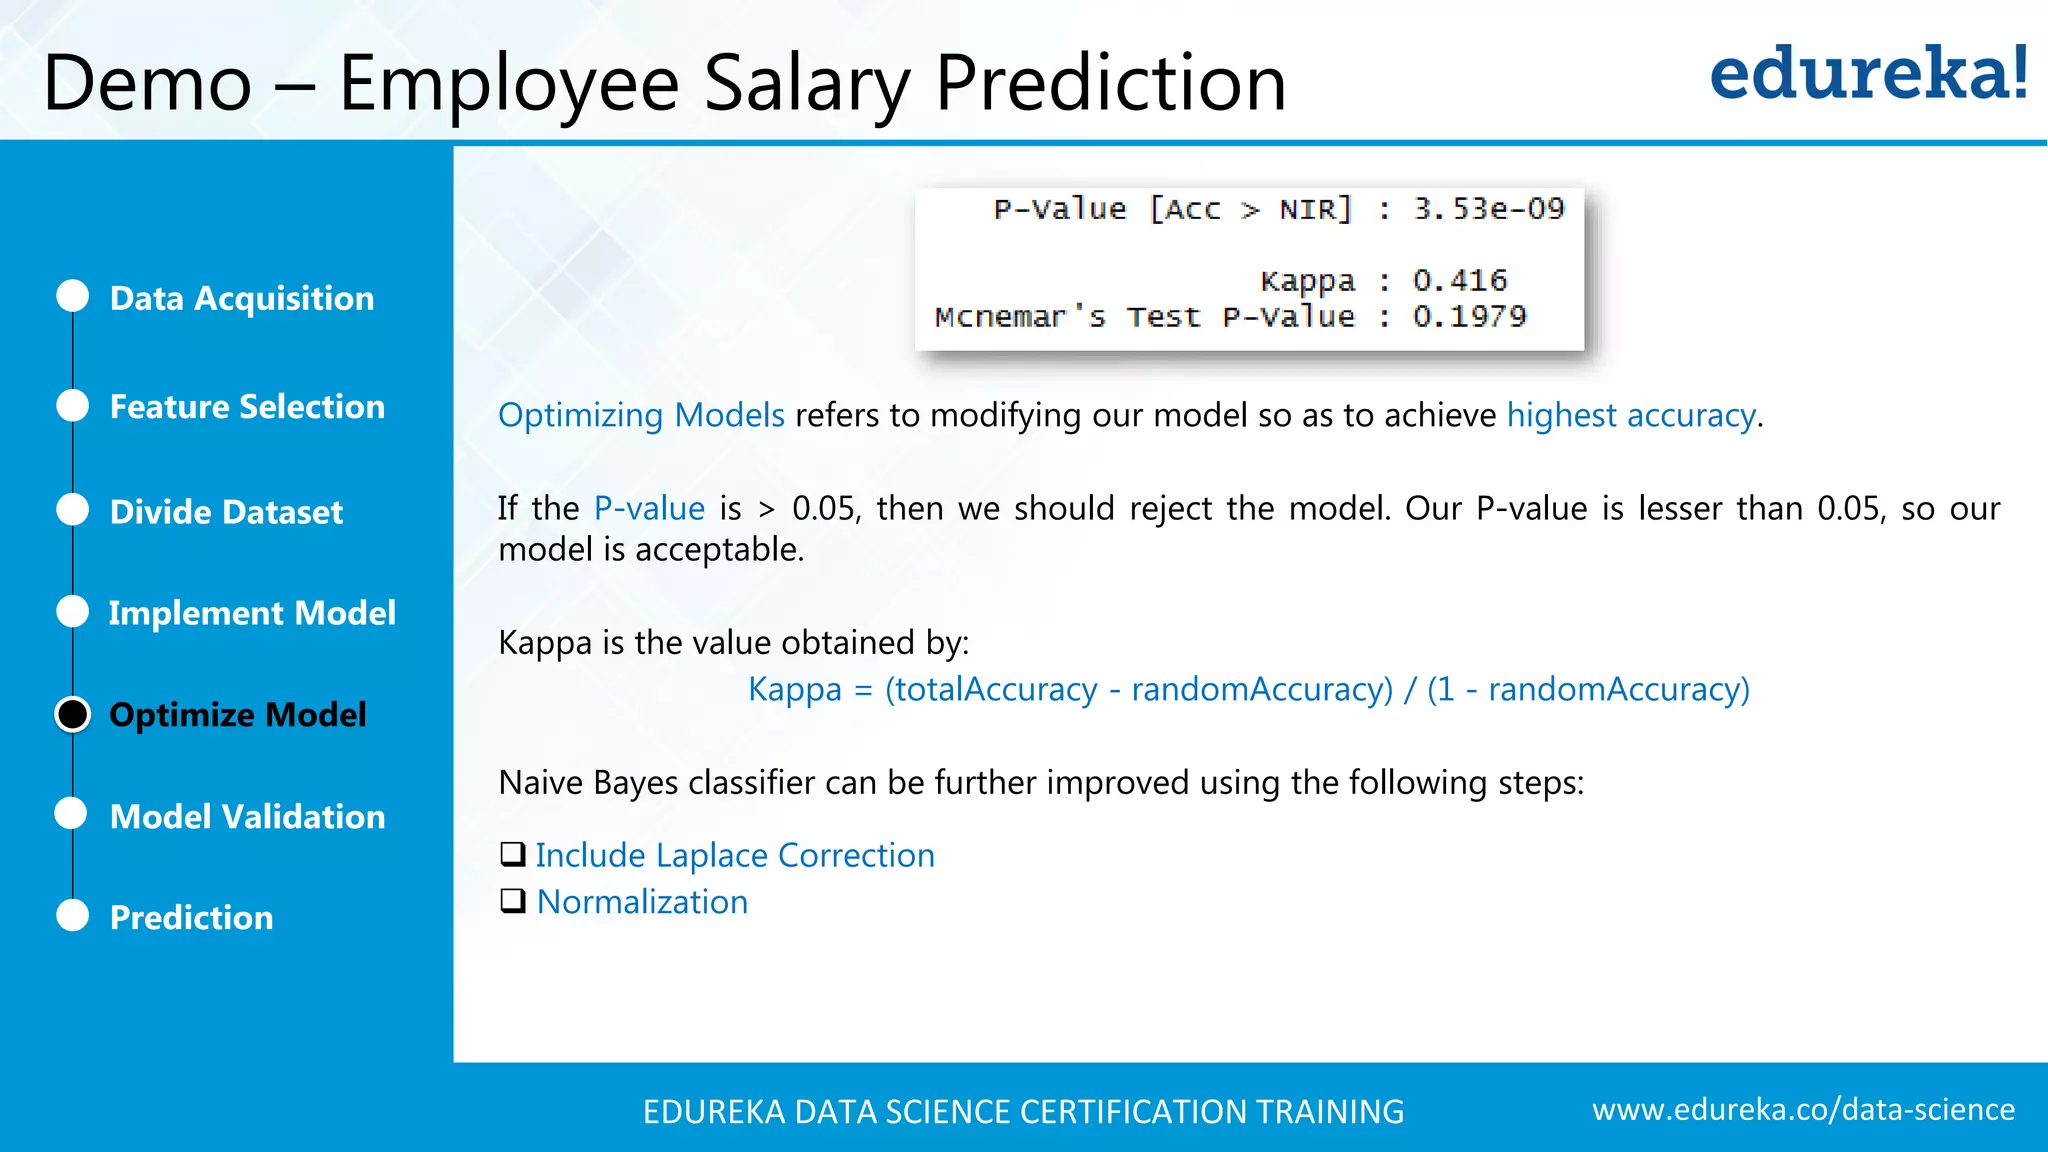
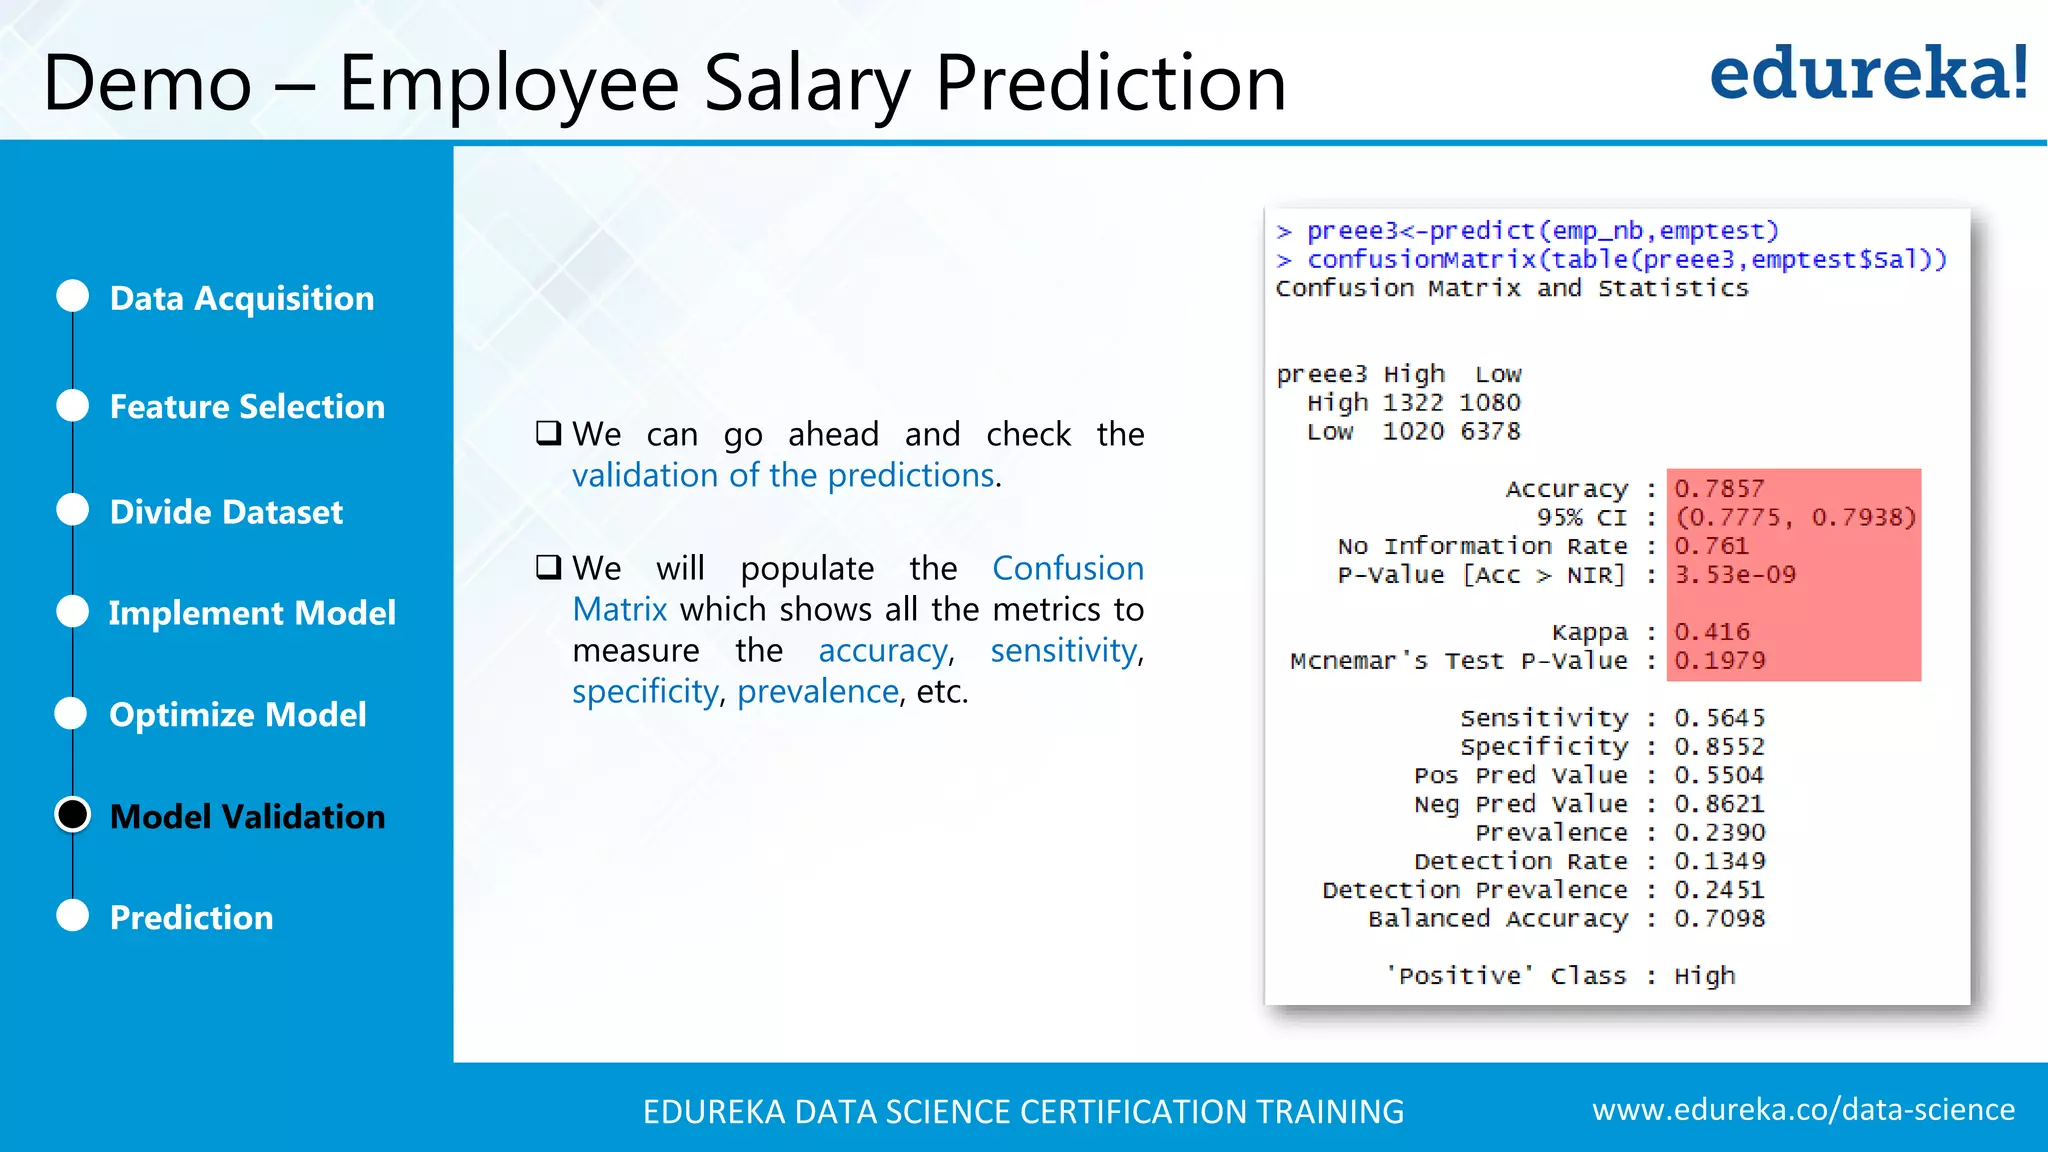
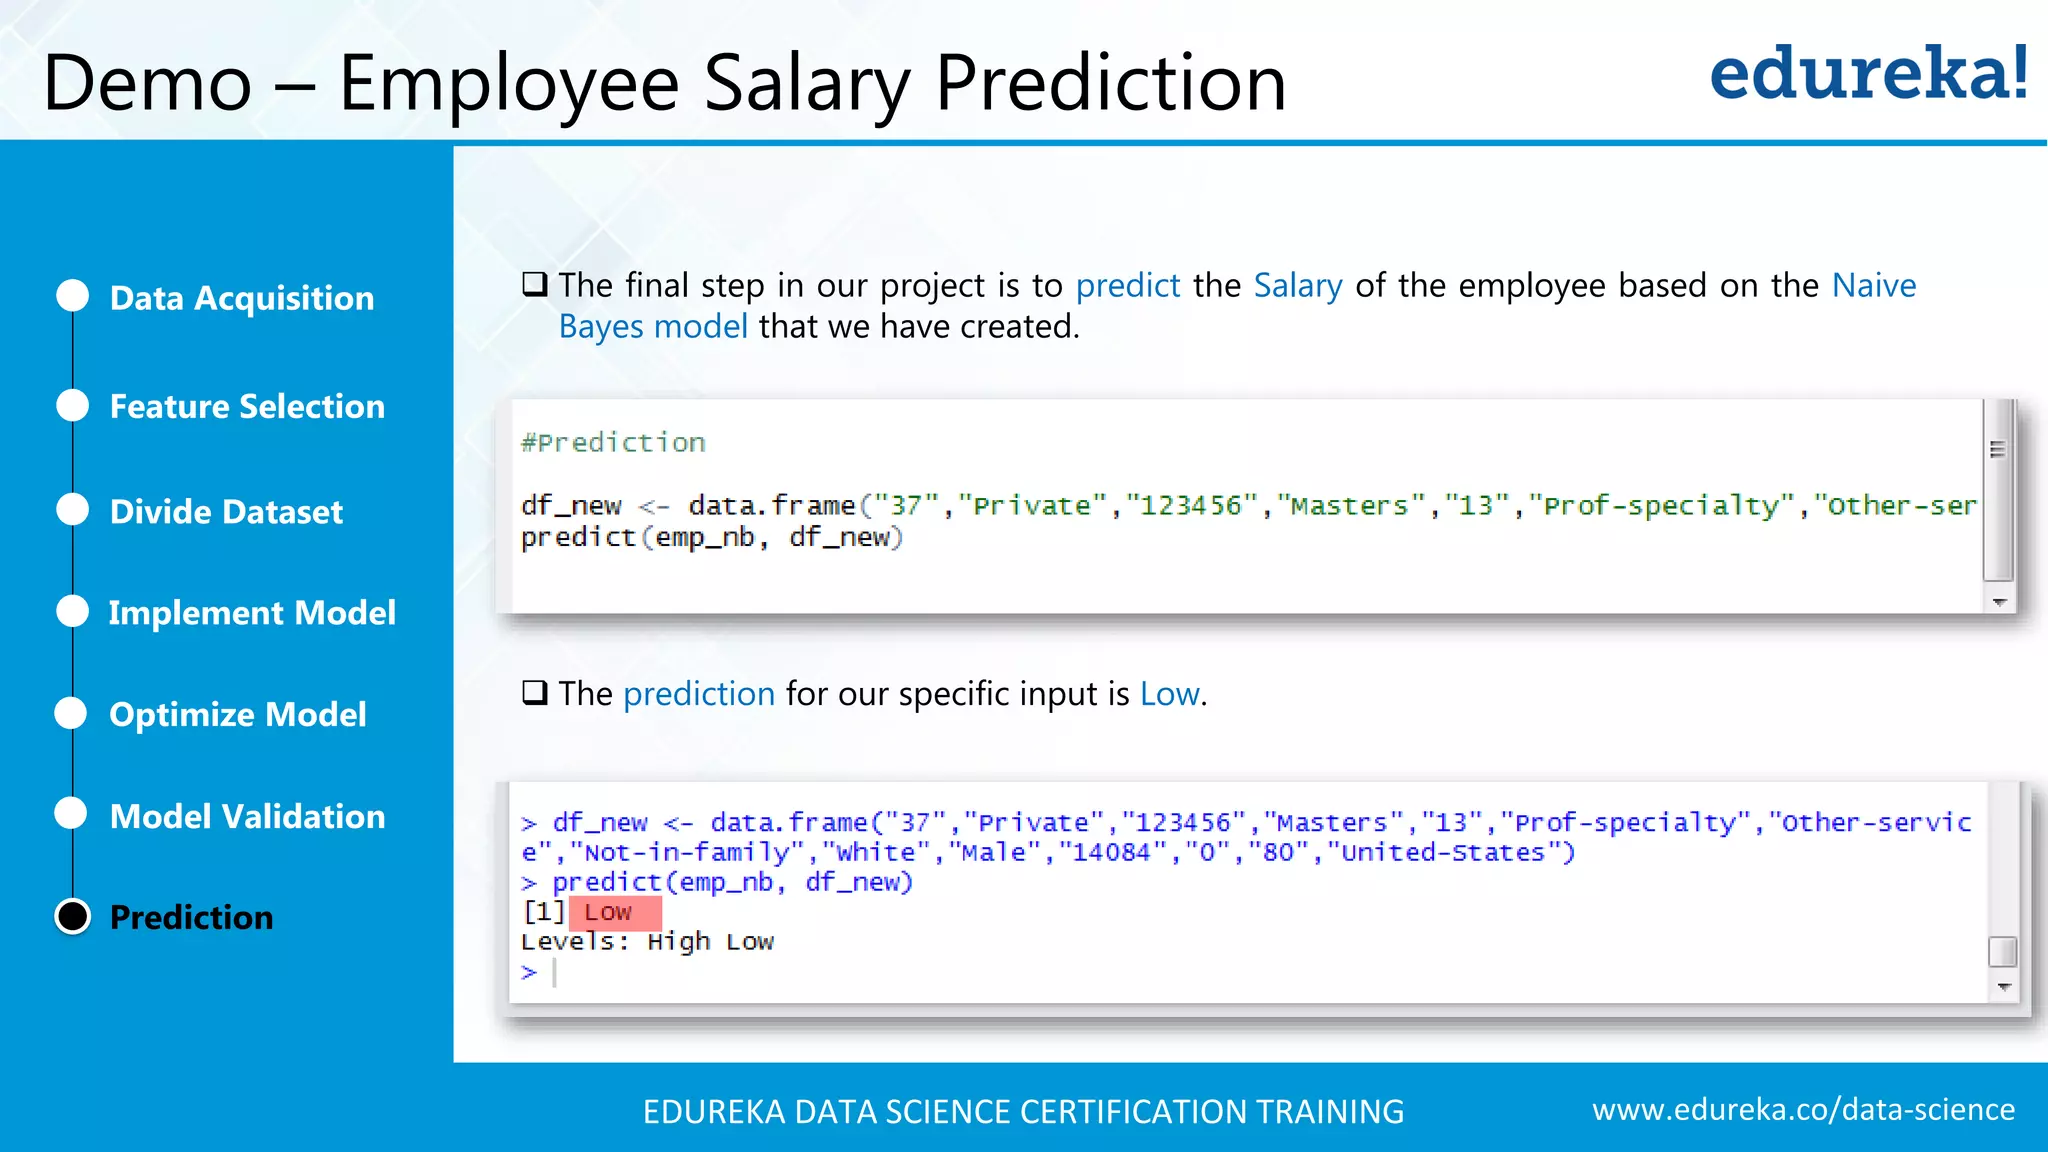
A comprehensive demo using Naive Bayes to predict employee salaries, detailing data acquisition, model building, optimization, and validation processes.
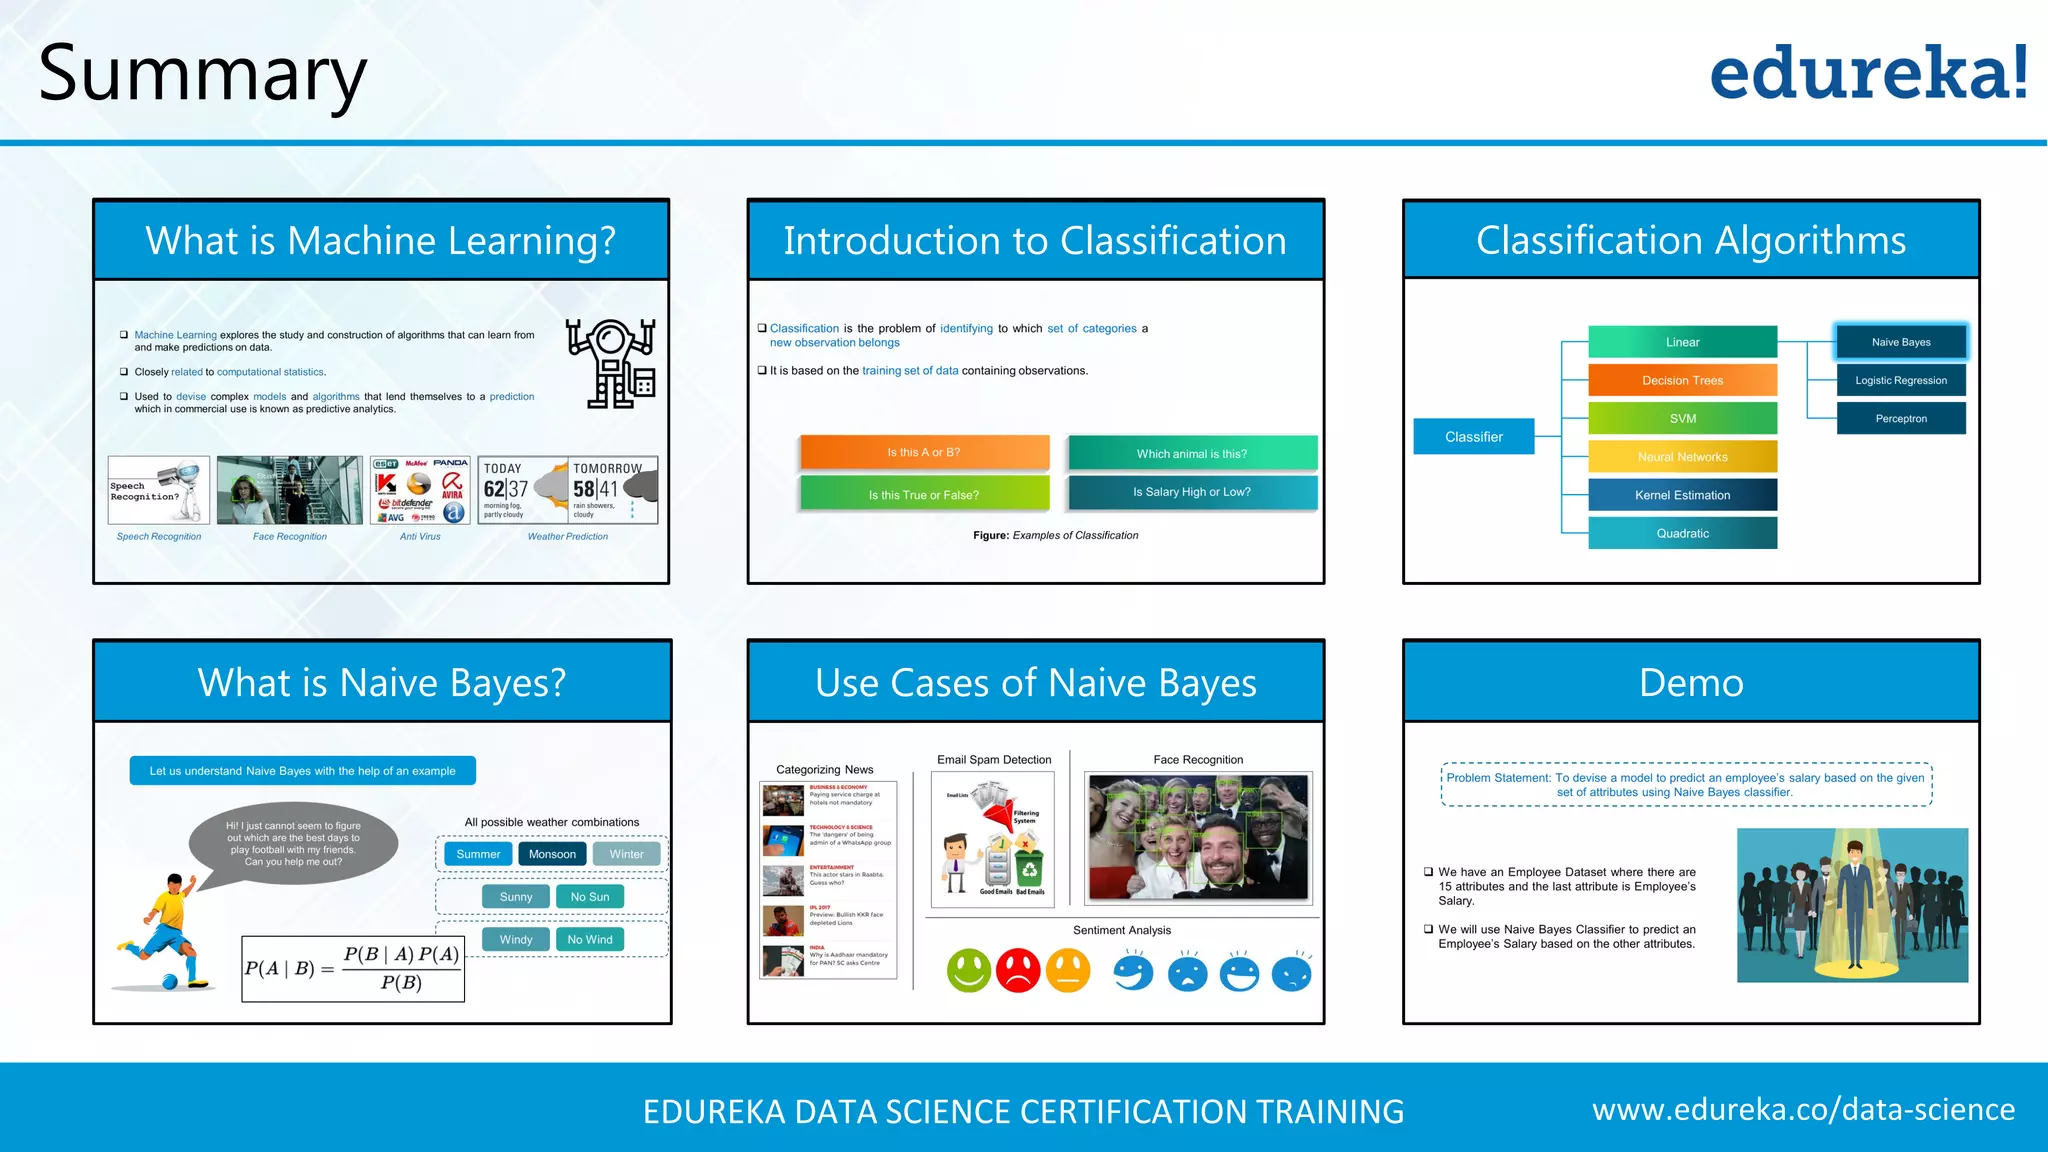
Summarization of the presentation covering all key points regarding Machine Learning, classification, and the Naive Bayes algorithm.
www.edureka.co/data-scienceEDUREKA DATA SCIENCECERTIFICATION TRAINING What to expect? What is Machine Learning? Introduction to Classification Classification Algorithms What is Naive Bayes? Use Cases of Naive Bayes Demo – Employee Salary Prediction
www.edureka.co/data-scienceEDUREKA DATA SCIENCECERTIFICATION TRAINING What is Machine Learning? Machine Learning explores the study and construction of algorithms that can learn from and make predictions on data. Closely related to computational statistics. Used to devise complex models and algorithms that lend themselves to a prediction which in commercial use is known as predictive analytics. Speech Recognition Face Recognition Anti Virus Weather Prediction
5.
www.edureka.co/data-scienceEDUREKA DATA SCIENCECERTIFICATION TRAINING Supervised vs Unsupervised Learning Supervised Learning Unsupervised Learning Classification is the result of supervised learning which means that there is a known label that you want the system to generate. Clustering is the result of unsupervised learning which means that you’ve seen lots of examples, but don’t have labels. E.g. If you built a fruit classifier, the labels will be “this is an orange, this is an apple and this is a banana”, based on showing the classifier examples of apples, oranges and bananas. E.g. In the same example, a fruit clustering will categorize as “fruits with soft skin and lots of dimples”, “fruits with shiny hard skin” and “elongated yellow fruits”.
www.edureka.co/data-scienceEDUREKA DATA SCIENCECERTIFICATION TRAINING Introduction to Classification Classification is the problem of identifying to which set of categories a new observation belongs It is based on the training set of data containing observations. Figure: Examples of Classification
www.edureka.co/data-scienceEDUREKA DATA SCIENCECERTIFICATION TRAINING What is Naive Bayes? Let us understand Naive Bayes with the help of an example Hi! I just cannot seem to figure out which are the best days to play football with my friends. Can you help me out? Summer Monsoon Winter Sunny No Sun Windy No Wind All possible weather combinations
12.
www.edureka.co/data-scienceEDUREKA DATA SCIENCECERTIFICATION TRAINING What is Naive Bayes? That is perfect. We will be using Naive Bayes algorithm to predict if you should play on a particular day or not. I have noted down all the days it was good/bad to play football and the combination of weather metrics on that particular day.
13.
www.edureka.co/data-scienceEDUREKA DATA SCIENCECERTIFICATION TRAINING What is Naive Bayes? Summer Monsoon Winter No Yes Season Sunny Case 1 – Sunny We have categorized the probability to play into “High” (P>0.5) and “Low” (P<0.5) Big circles represent “High”, i.e. probability greater than 0.5 Small circles represent “Low”, i.e. probability less than 0.5 Case 1 – Sunny Moving further we can draw charts based on the probabilities of days favouring games
14.
www.edureka.co/data-scienceEDUREKA DATA SCIENCECERTIFICATION TRAINING The second attribute is the wind speeds on a particular day. Let us look at how wind affects the chances of playing Football on a particular day. What is Naive Bayes? Summer Monsoon Winter No Yes Season Windy Case 2 – Windy Here, we will look at days where there was wind and when it was good to play Case 2 – Windy
15.
www.edureka.co/data-scienceEDUREKA DATA SCIENCECERTIFICATION TRAINING What is Naive Bayes? Summer Monsoon Winter (Sunny = No, Windy = Yes) Sunny = No (Sunny = No, Windy = No) Summer Monsoon Winter (Sunny = Yes, Windy = Yes) Sunny = Yes (Sunny = Yes, Windy = No) Here, we have the complete set of attributes and whether to play on that day or not.
16.
www.edureka.co/data-scienceEDUREKA DATA SCIENCECERTIFICATION TRAINING What is Naive Bayes? If you notice in summer, it is advisable to play when there is no sun. But the second graph shows a different picture. This is because a day in Summer which is not Sunny might have P > 0.5 but when there is no wind, the Posterior probability P < 0.5
17.
www.edureka.co/data-scienceEDUREKA DATA SCIENCECERTIFICATION TRAINING Naive Bayes classifier is a simple probabilistic classifier based on applying Bayes' theorem with strong (naive) independence assumptions between the features. Bayes' theorem is stated mathematically as the following equation: where A and B are events and P(B) ≠ 0. What is Naive Bayes?
18.
www.edureka.co/data-scienceEDUREKA DATA SCIENCECERTIFICATION TRAINING Understanding Bayes’ Theorem P(c|x) = P(x|c) P(c) P(x) Likelihood Class Prior Probability Posterior Probability Predictor Prior Probability Let us understand how Bayes’ Theorem can be used in Naive Bayes classifier:
19.
www.edureka.co/data-scienceEDUREKA DATA SCIENCECERTIFICATION TRAINING Understanding Bayes’ Theorem In Figure 1, We have the Posterior Probability of Sunny across seasons excluding Wind speed. In Figure 2, We have the Posterior Probabilities ( E.g. Sunny = No, Windy = Yes and Season = Summer ) Figure 1 Figure 2
20.
www.edureka.co/data-scienceEDUREKA DATA SCIENCECERTIFICATION TRAINING Understanding Bayes’ Theorem We can use Naive Bayes Classifier to predict whether to play Football on ( Season = Winter, Sunny = No , Windy = Yes ). Our Demo will help you clearly understand Naive Bayes.
21.
www.edureka.co/data-scienceEDUREKA DATA SCIENCECERTIFICATION TRAINING Understanding Bayes’ Theorem Yes No 3 2 4 0 2 3 Summer Monsoon Winter Season Play Frequency Table Yes No 3 4 6 1 Yes No Sunny Play Frequency Table Yes No 6 2 3 3 Yes No Windy Play Frequency Table From the dataset we have obtained, we will populate frequency tables for each of the attribute
22.
www.edureka.co/data-scienceEDUREKA DATA SCIENCECERTIFICATION TRAINING Understanding Bayes’ Theorem For each of the frequency tables, we will find the likelihoods for each of the cases P(c | x) = P(Yes | Summer) = P(Summer | Yes)* P(Yes) / P(Summer) = (0.33 x 0.64) /0.36 = 0.60 Likelihood of ‘Yes’ given Summer is: Yes No 3/9 2/5 4/9 0/5 2/9 3/5 Summer Monsoon Winter Season Play Likelihood Table 9/14 5/14 5/14 4/14 5/14 P(x | c) = P(Summer | Yes) = 3/9 = 0.33 P(c) = P(Yes) = 9/14 = 0.64 P(x) = P(Summer) = 5/14 = 0.36 Here, c = Play and x = Variables like Season, Sunny & Windy.
23.
www.edureka.co/data-scienceEDUREKA DATA SCIENCECERTIFICATION TRAINING Understanding Bayes’ Theorem Let us use the likelihood table to predict whether to play football on ( Season = Winter, Sunny = No , Windy = Yes ) P(c | x) = P(Play = Yes | Winter, Sunny = No, Windy = Yes) = P(Winter | Yes) * P(Sunny = No | Yes) * P(Windy = Yes | Yes) * P(Yes) P(Winter) * P(Sunny = No) * P(Windy = Yes) = (2/9) * (6/9) * (6/9) * (9/14) / (5/14) * (7/14) * (8/14) = 0.6223 Since the probability is greater than 0.5, we should play football on that day. Yayiee!!
www.edureka.co/data-scienceEDUREKA DATA SCIENCECERTIFICATION TRAINING Demo – Problem Statement Problem Statement: To devise a model to predict an employee’s salary based on the given set of attributes using Naive Bayes classifier. We have an Employee Dataset where there are 14 attributes and our output variable is Employee’s Salary. We will use Naive Bayes Classifier to predict an Employee’s Salary as high(>50k) or low(<50k)by finding out the probabilities for the given attribute combination.
29.
www.edureka.co/data-scienceEDUREKA DATA SCIENCECERTIFICATION TRAINING Demo – Employee Salary Prediction Feature Selection Divide Dataset Implement Model Optimize Model Prediction Model Validation Data Acquisition
30.
www.edureka.co/data-scienceEDUREKA DATA SCIENCECERTIFICATION TRAINING Demo – Employee Salary Prediction Field Description Age_Of_emp Age of the employee Emp_Stat_type Type of the employment industry srnumber Serial number of the employee Edu_of_Emp Employee education details Edu_Cat Employee’s education category marital_Status Employee marital status Occ_Of_Emp Job description of the employee Emp_rel_status Employee relationship status Emp_race_type Race of the employee sex_of_emp Sex of the employee capital_gain Income from investment sources apart from wages/salary capital_loss Losses from investment sources apart from wages/salary Work_hour_in_week Number of weekly working hours country_of_res Country of residence Emp_sal Employee’s salary Feature Selection Divide Dataset Implement Model Optimize Model Prediction Model Validation Data Acquisition
31.
www.edureka.co/data-scienceEDUREKA DATA SCIENCECERTIFICATION TRAINING Demo – Employee Salary Prediction Feature Selection Divide Dataset Implement Model Optimize Model Prediction Model Validation Data Acquisition From the following fields, we need to filter out unnecessary columns which will not affect the Employee’s Salary. We will be removing fields srnumber, marital_Status, Emp_rel_status, Emp_race_type, sex_of_emp, capital_gain and capital_loss because these fields are factors which do not affect a person’s salary. The remaining fields will be used to build our model.
32.
www.edureka.co/data-scienceEDUREKA DATA SCIENCECERTIFICATION TRAINING Demo – Employee Salary Prediction We will divide our entire dataset into two subsets as: Training dataset -> To train the model Testing dataset -> To validate and make predictions Feature Selection Divide Dataset Implement Model Optimize Model Prediction Model Validation Data Acquisition
33.
www.edureka.co/data-scienceEDUREKA DATA SCIENCECERTIFICATION TRAINING Demo – Employee Salary Prediction We model the Naive Bayes using the library ‘e1071’ on the training dataset that we created just now. The model is called emp_nb. Feature Selection Divide Dataset Implement Model Optimize Model Prediction Model Validation Data Acquisition
34.
www.edureka.co/data-scienceEDUREKA DATA SCIENCECERTIFICATION TRAINING Demo – Employee Salary Prediction The following is the output from emp_nb model Feature Selection Divide Dataset Implement Model Optimize Model Prediction Model Validation Data Acquisition Likelihood of High & Low Salaries Likelihood of Employee Department against High & Low Salaries
35.
www.edureka.co/data-scienceEDUREKA DATA SCIENCECERTIFICATION TRAINING Demo – Employee Salary Prediction Optimizing Models refers to modifying our model so as to achieve highest accuracy. If the P-value is > 0.05, then we should reject the model. Our P-value is lesser than 0.05, so our model is acceptable. Kappa is the value obtained by: Kappa = (totalAccuracy - randomAccuracy) / (1 - randomAccuracy) Naive Bayes classifier can be further improved using the following steps: Include Laplace Correction Normalization Feature Selection Divide Dataset Implement Model Optimize Model Prediction Model Validation Data Acquisition
36.
www.edureka.co/data-scienceEDUREKA DATA SCIENCECERTIFICATION TRAINING Demo – Employee Salary Prediction We can go ahead and check the validation of the predictions. We will populate the Confusion Matrix which shows all the metrics to measure the accuracy, sensitivity, specificity, prevalence, etc. Feature Selection Divide Dataset Implement Model Optimize Model Prediction Model Validation Data Acquisition
37.
www.edureka.co/data-scienceEDUREKA DATA SCIENCECERTIFICATION TRAINING Demo – Employee Salary Prediction The final step in our project is to predict the Salary of the employee based on the Naive Bayes model that we have created. The prediction for our specific input is Low. Feature Selection Divide Dataset Implement Model Optimize Model Prediction Model Validation Data Acquisition
www.edureka.co/data-scienceEDUREKA DATA SCIENCECERTIFICATION TRAINING Introduction to ClassificationWhat is Machine Learning? Summary Use Cases of Naive BayesWhat is Naive Bayes? Demo Classification Algorithms