Download as PDF, PPTX


![AVG | QUERY -------------------------------------------------------------------------------- 10.7ms | SELECT oid, typname, typelem, typdelim, typinput FROM pg_type 3.0ms | SET time zone 'UTC' 0.4ms | SELECT a.attname, format_type(a.atttypid, a.atttypmod), pg_get_expr(d.adbin, d.adrelid), a.attnotnull, a.atttypid, a.atttypmod FROM pg_attribute a LEFT JOIN pg_attrdef d ON a.attrelid = d.adrelid AND a.attnum = d.adnum WHERE a.attrelid = ?::regclass AND a.attnum > ? AND NOT a.attisdropped ORDER BY a.attnum 0.2ms | SELECT pg_stat_statements_reset() 0.1ms | SELECT query, calls, total_time FROM pg_stat_statements 0.1ms | SELECT attr.attname FROM pg_attribute attr INNER JOIN pg_constraint cons ON attr.attrelid = cons.conrelid AND attr.attnum = cons.conkey[?] WHERE cons.contype = ? AND cons.conrelid = ?: :regclass 0.0ms | SELECT COUNT(*) FROM pg_class c LEFT JOIN pg_namespace n ON n.oid = c.relnamespace WHERE c.relkind in (?,?) AND c.relname = ? AND n.nspname = ANY (current_schemas(?)) 0.0ms | SELECT * FROM posts JOIN users ON (posts.author_id = users.id) WHERE users.login = ?; 0.0ms | SET client_min_messages TO 'panic' 0.0ms | set client_encoding to 'UTF8' 0.0ms | SHOW client_min_messages 0.0ms | SELECT * FROM ad_reels WHERE id = ?; 0.0ms | SELECT * FROM posts WHERE guid = ?; 0.0ms | SELECT ? 0.0ms | SET client_min_messages TO 'warning' 0.0ms | SET standard_conforming_strings = on 0.0ms | SELECT "posts".* FROM "posts" ORDER BY "posts"."id" DESC LIMIT ? 0.0ms | SHOW TIME ZONE pg_qtop -d testdb](https://image.slidesharecdn.com/monitoringpostgresatscale-180324171904/75/PGConf-APAC-2018-Monitoring-PostgreSQL-at-Scale-53-2048.jpg)
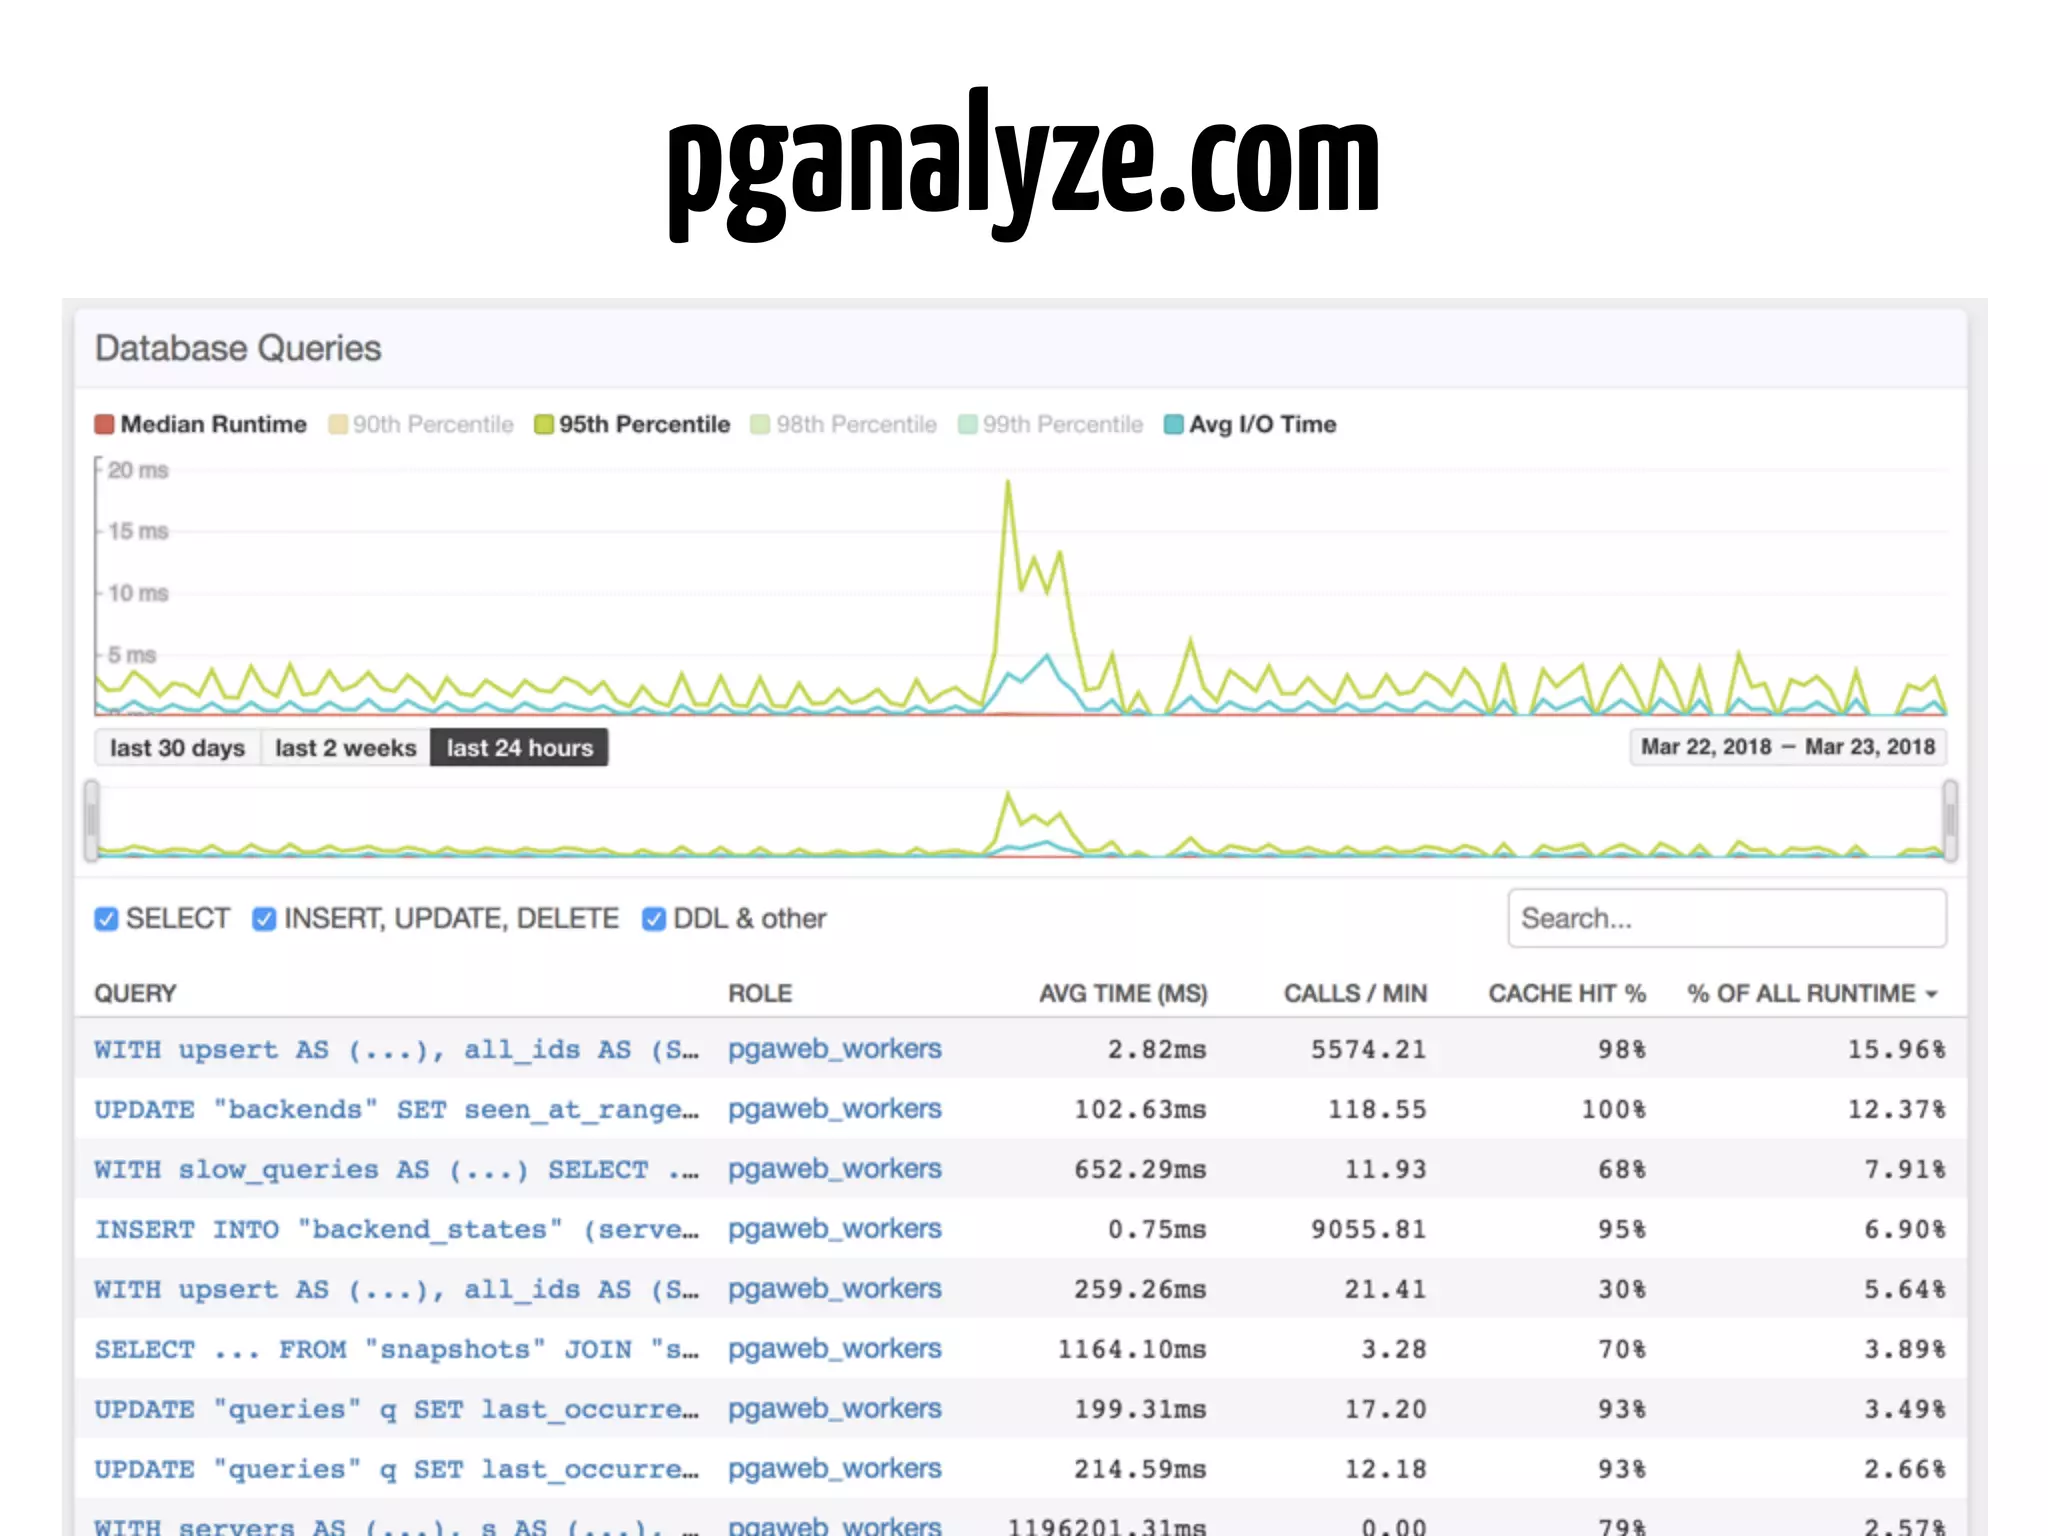

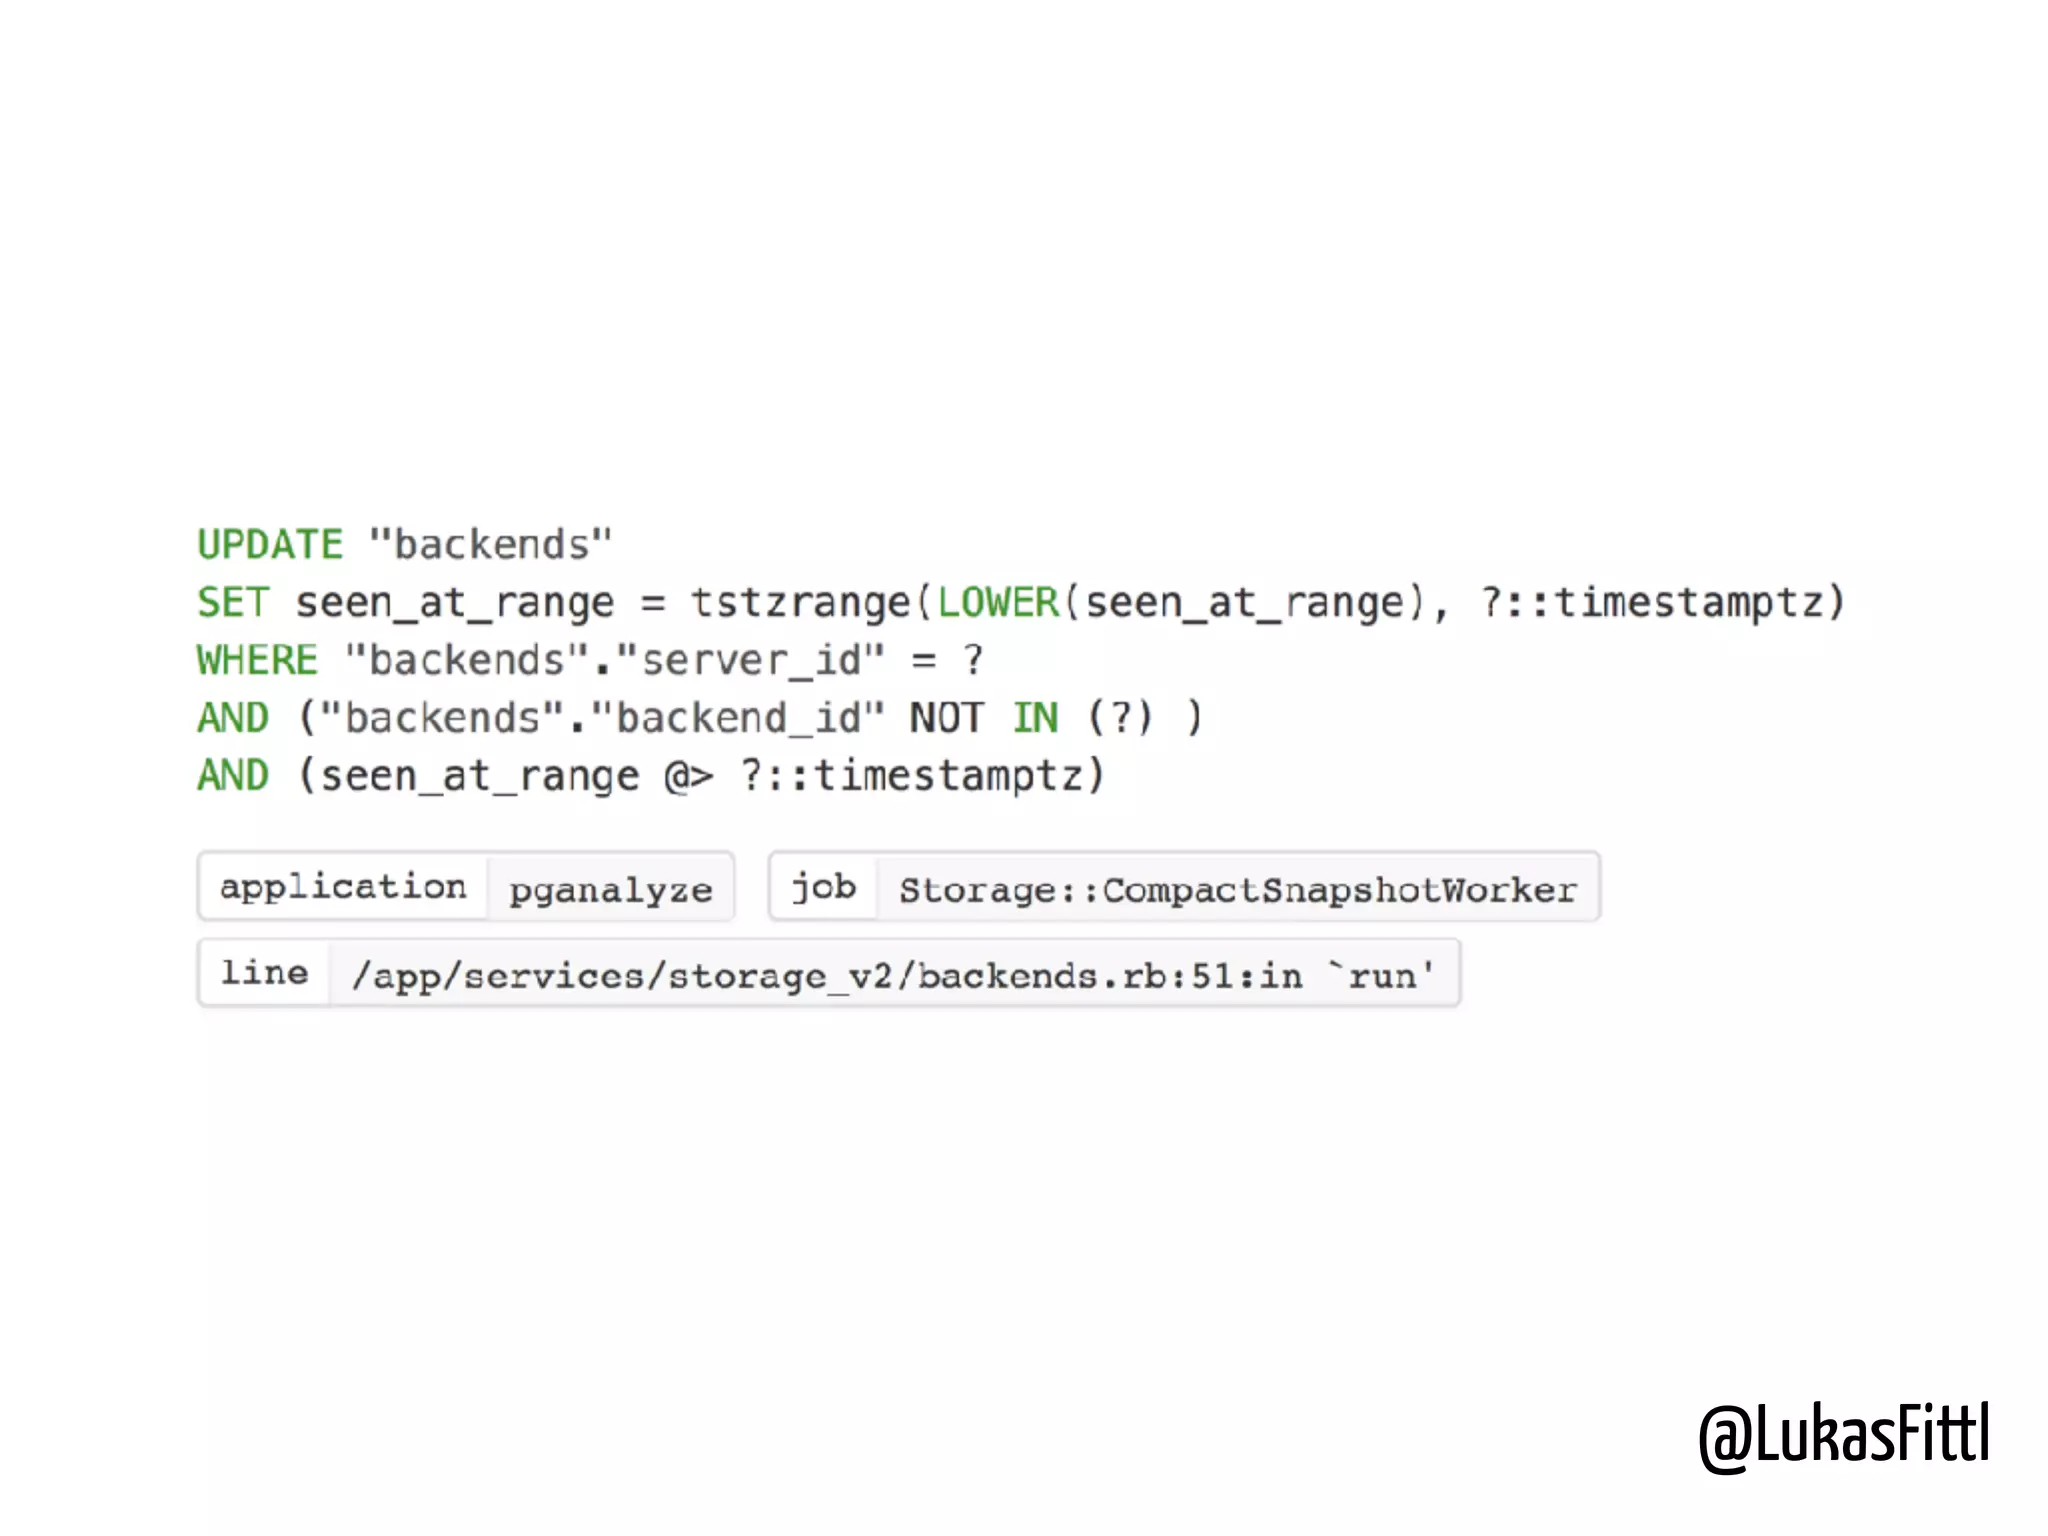
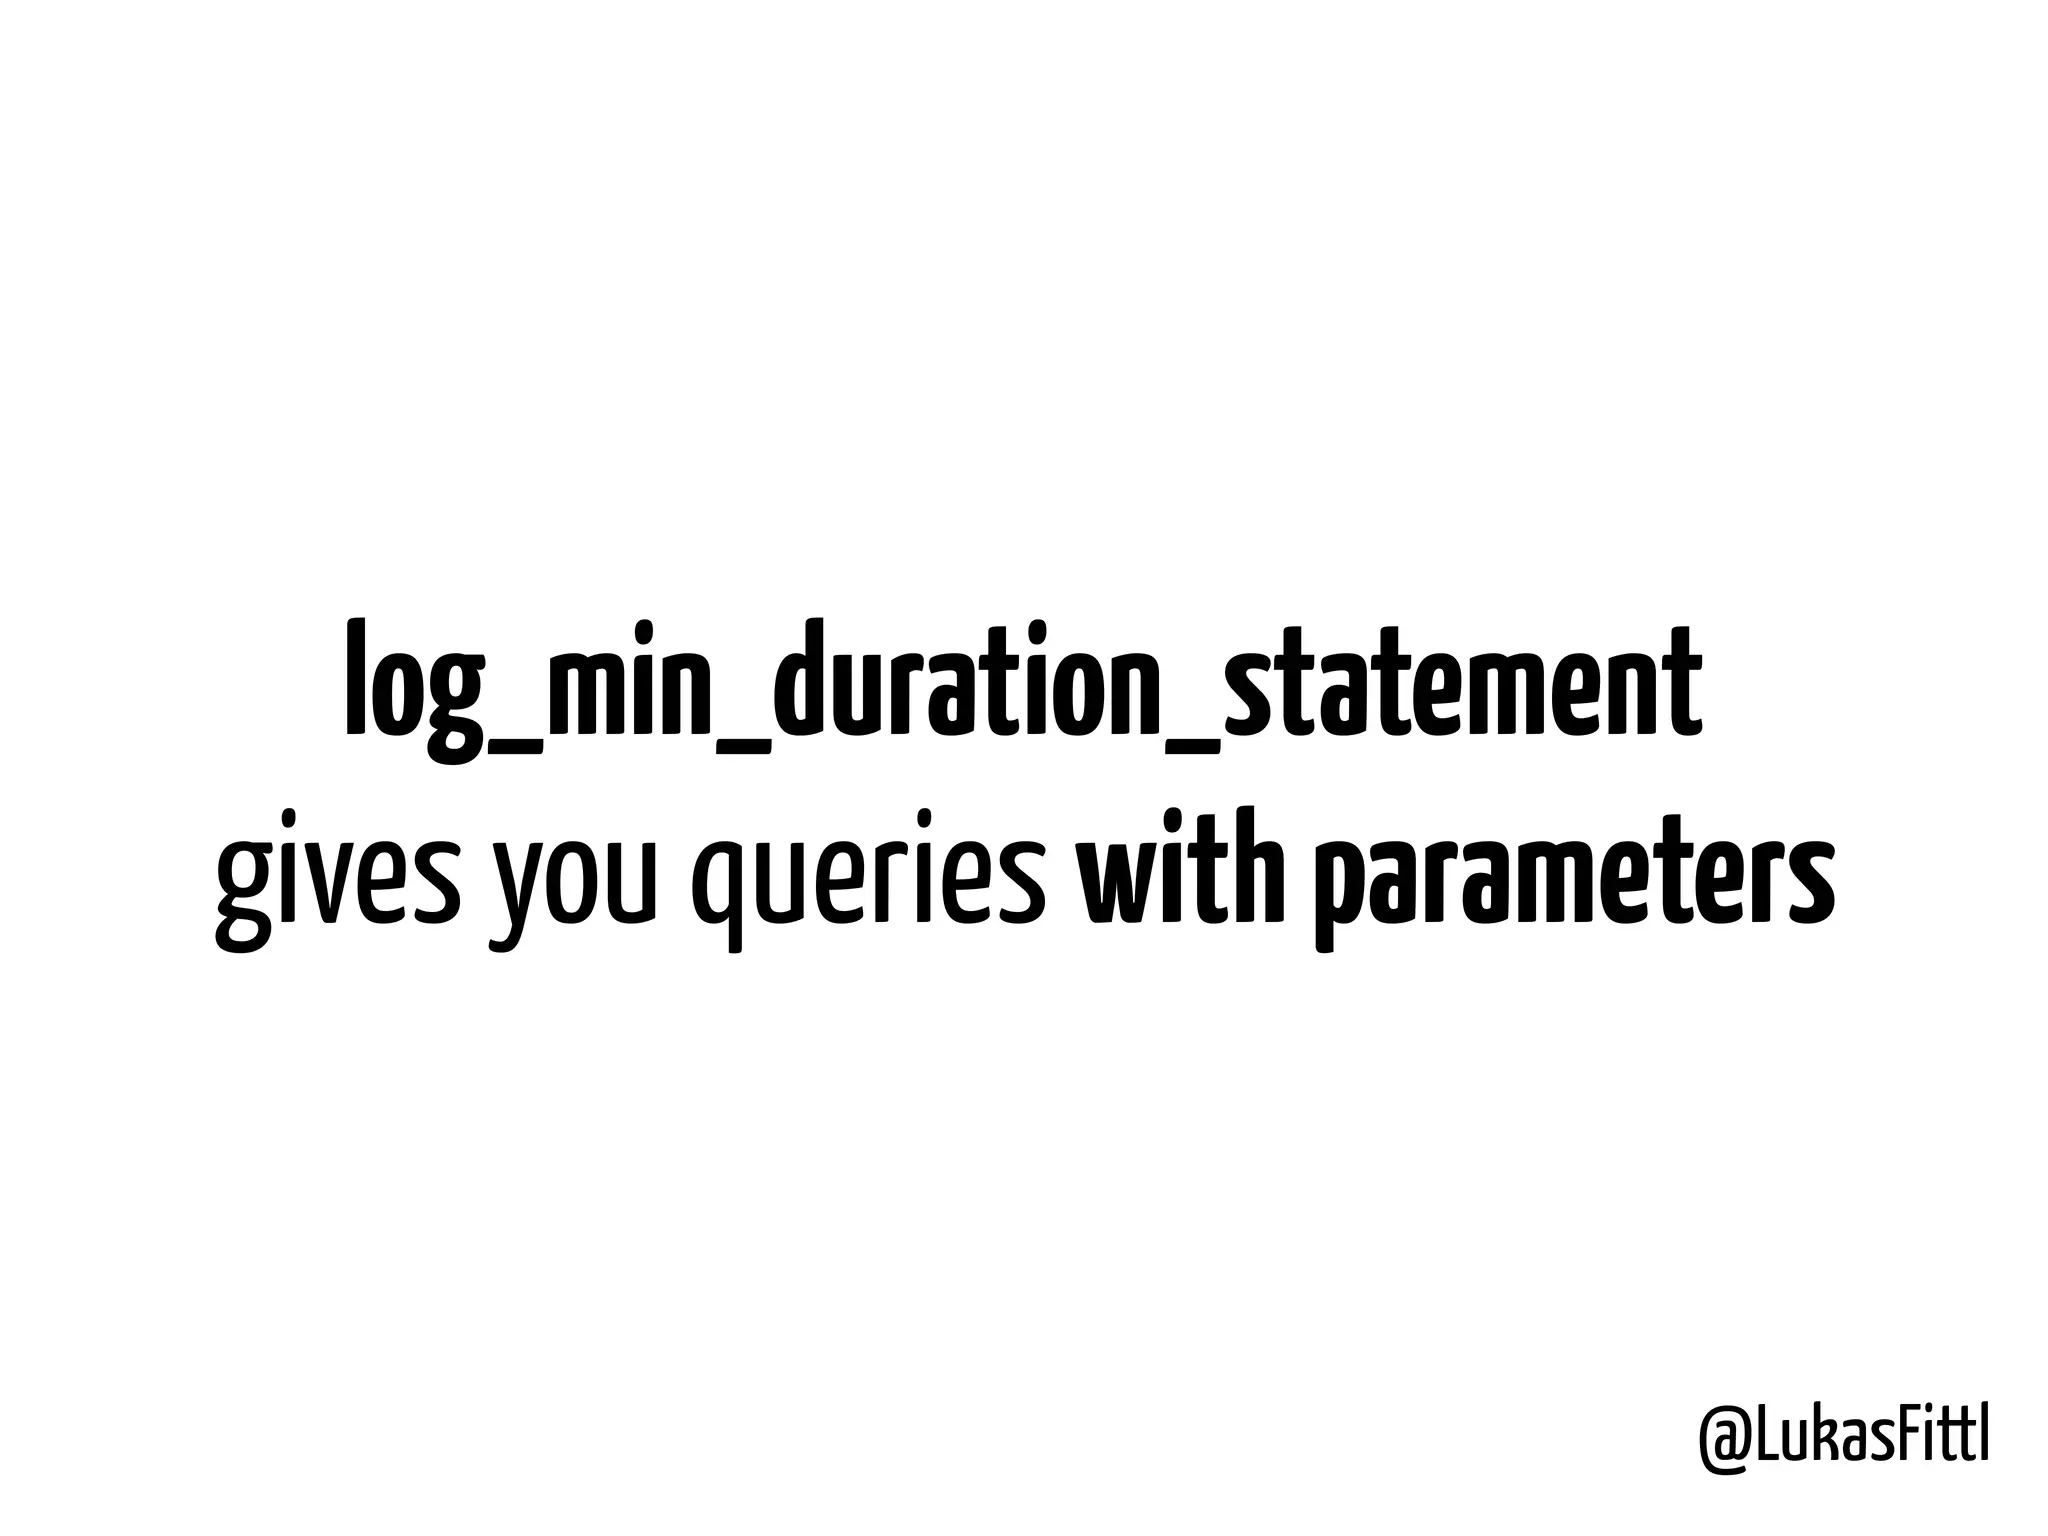
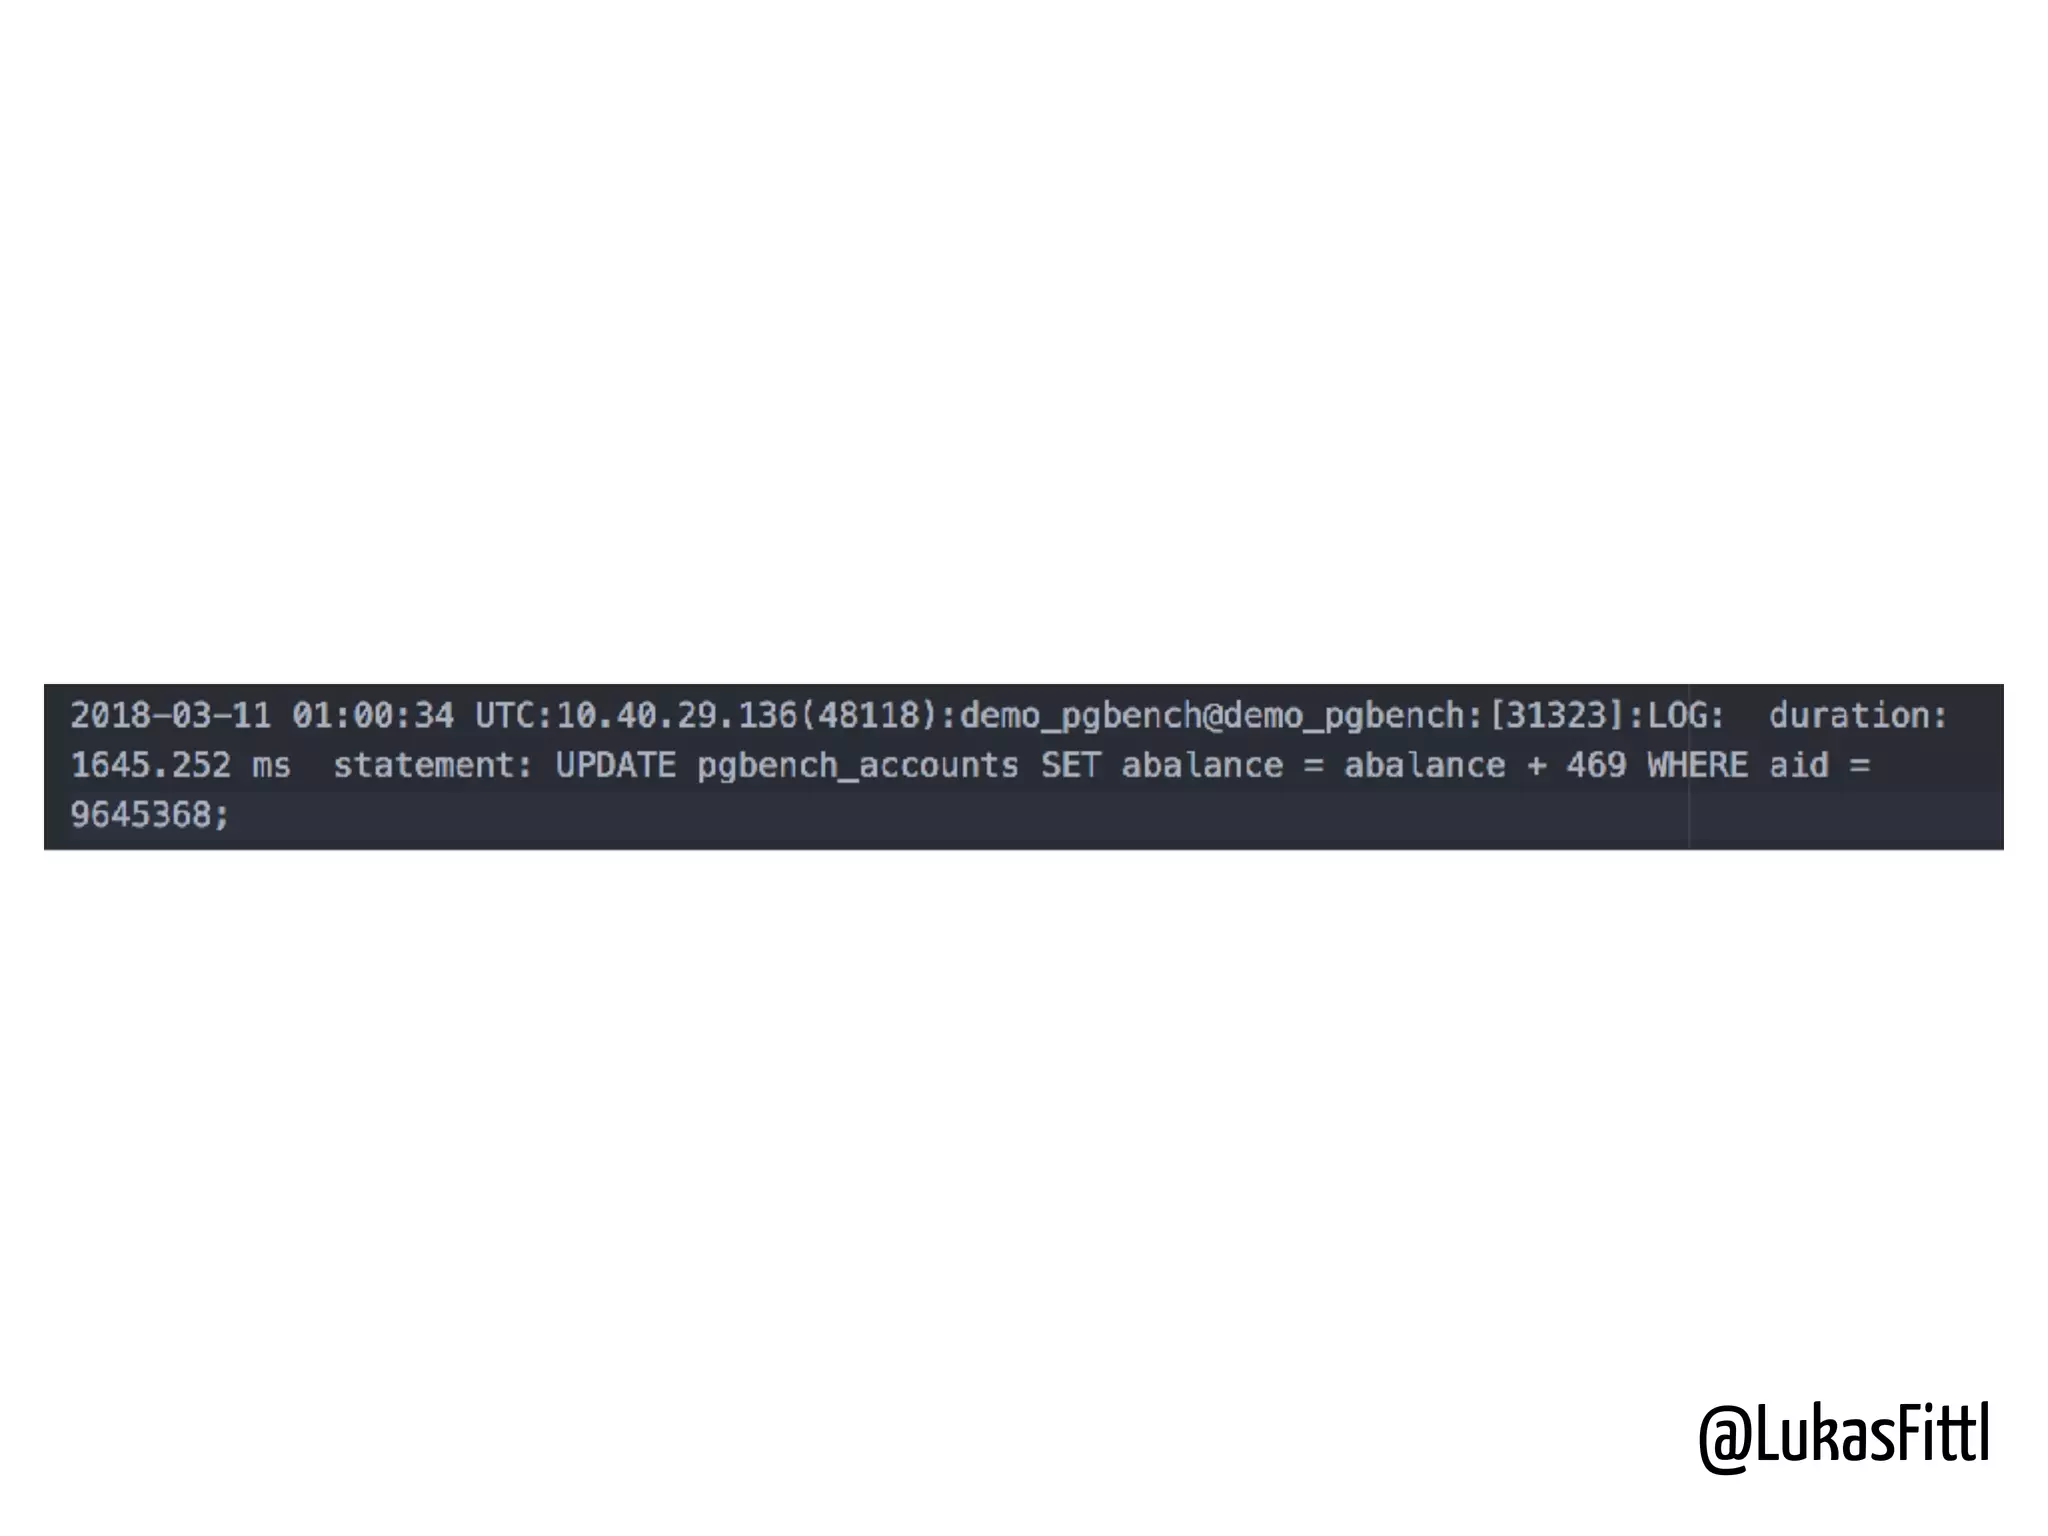


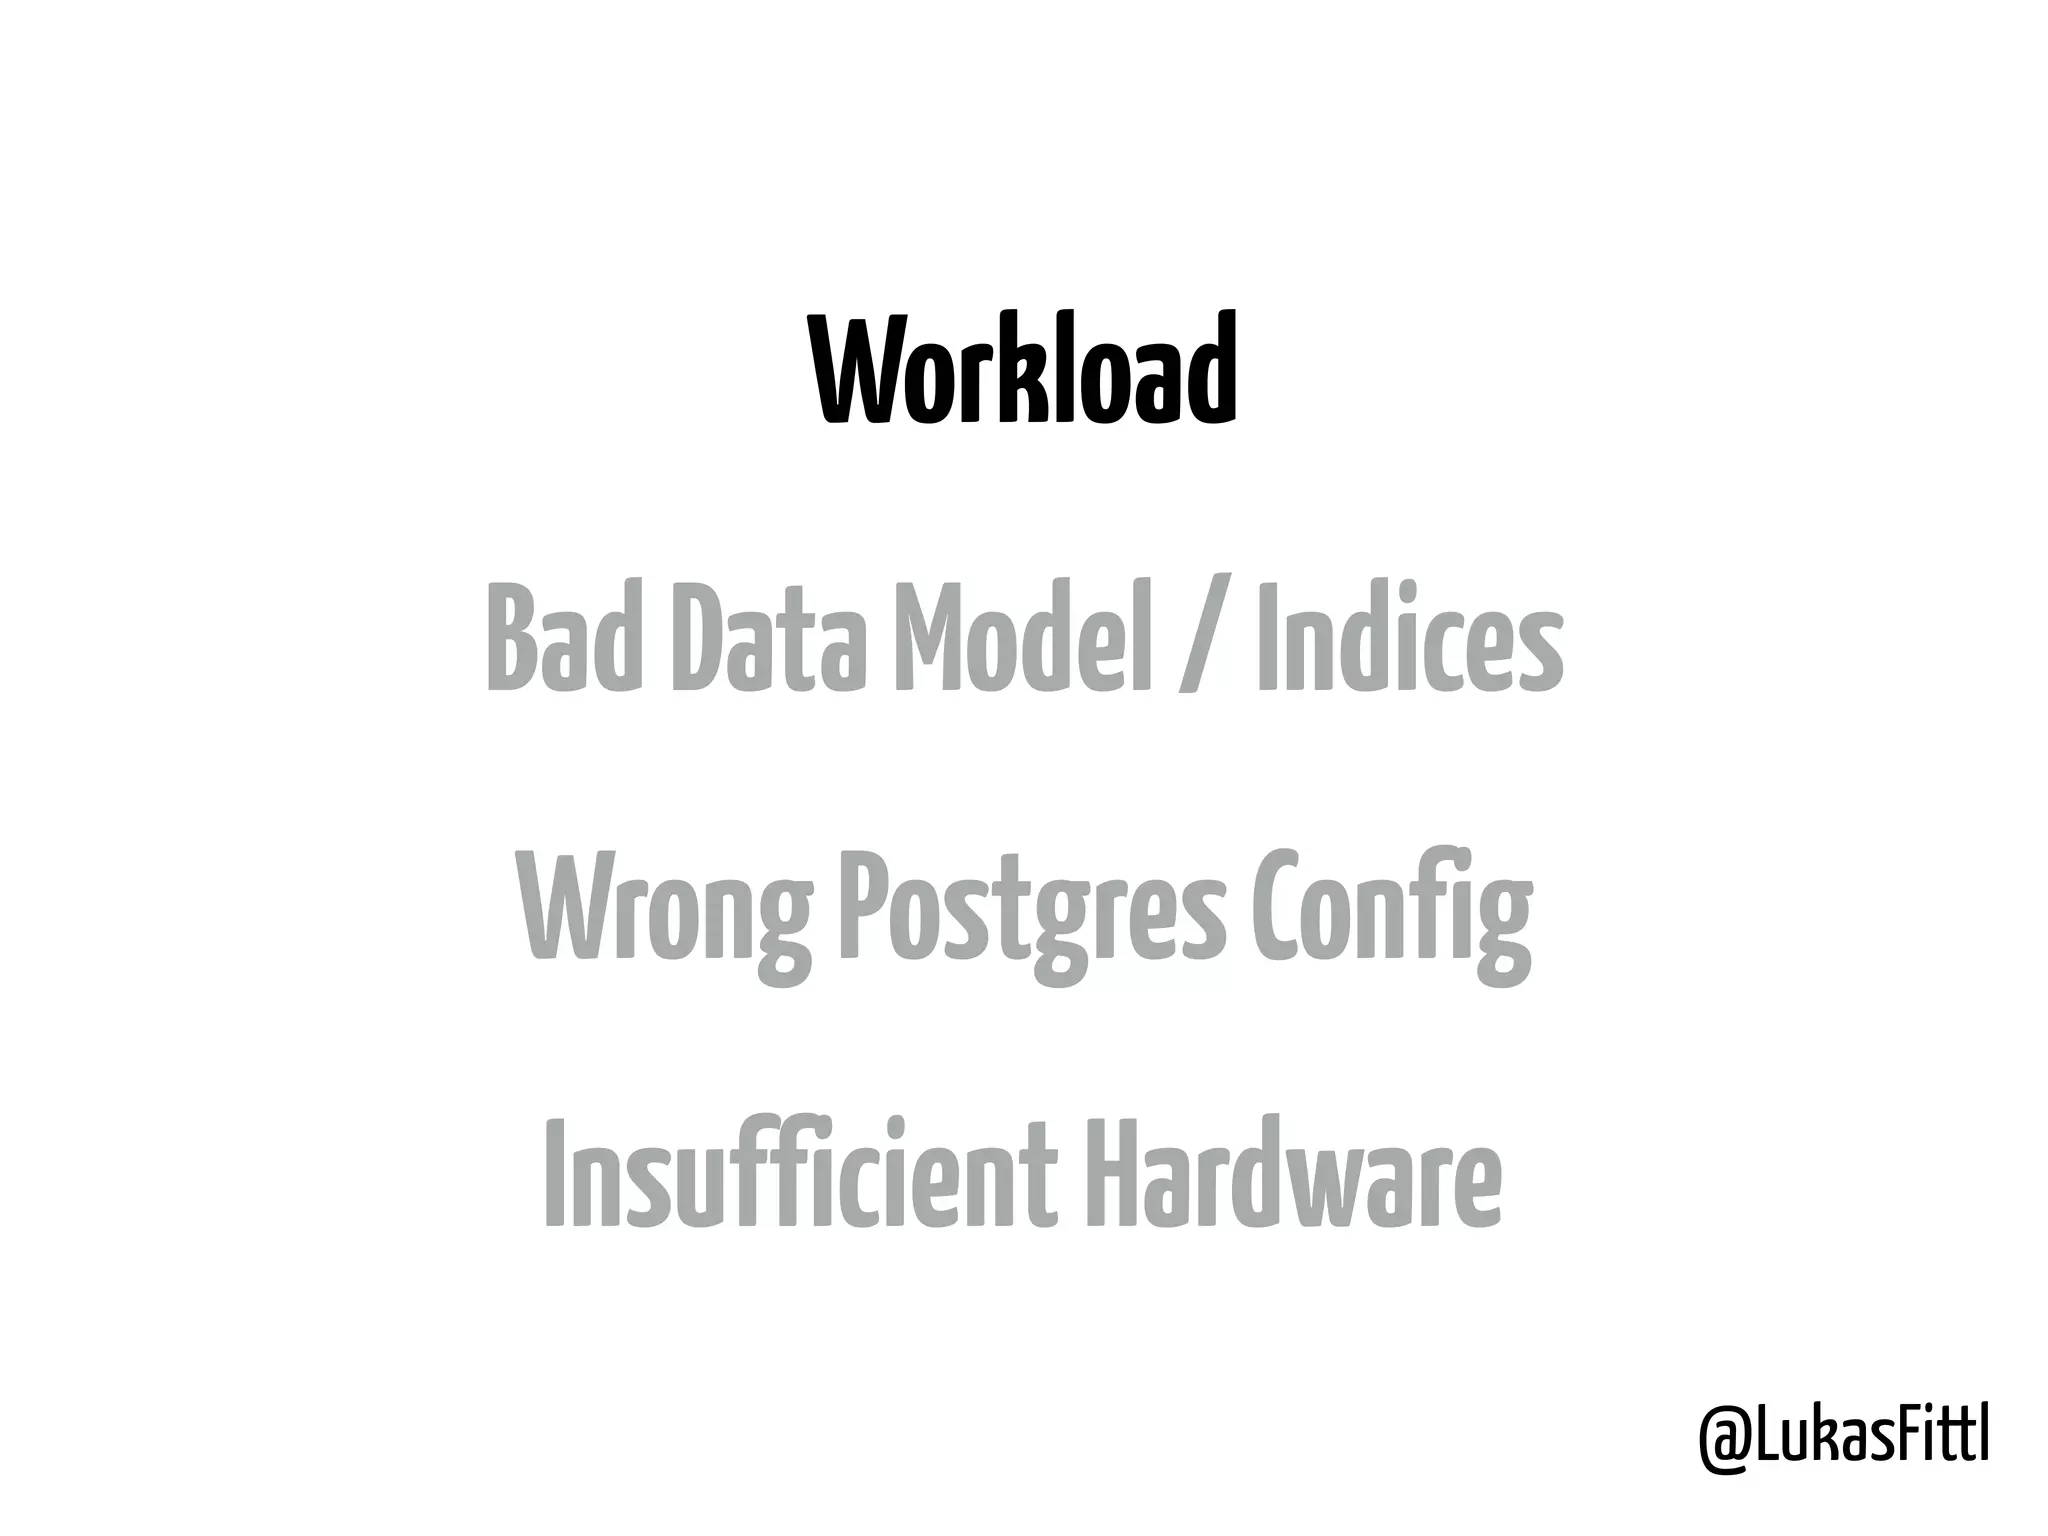
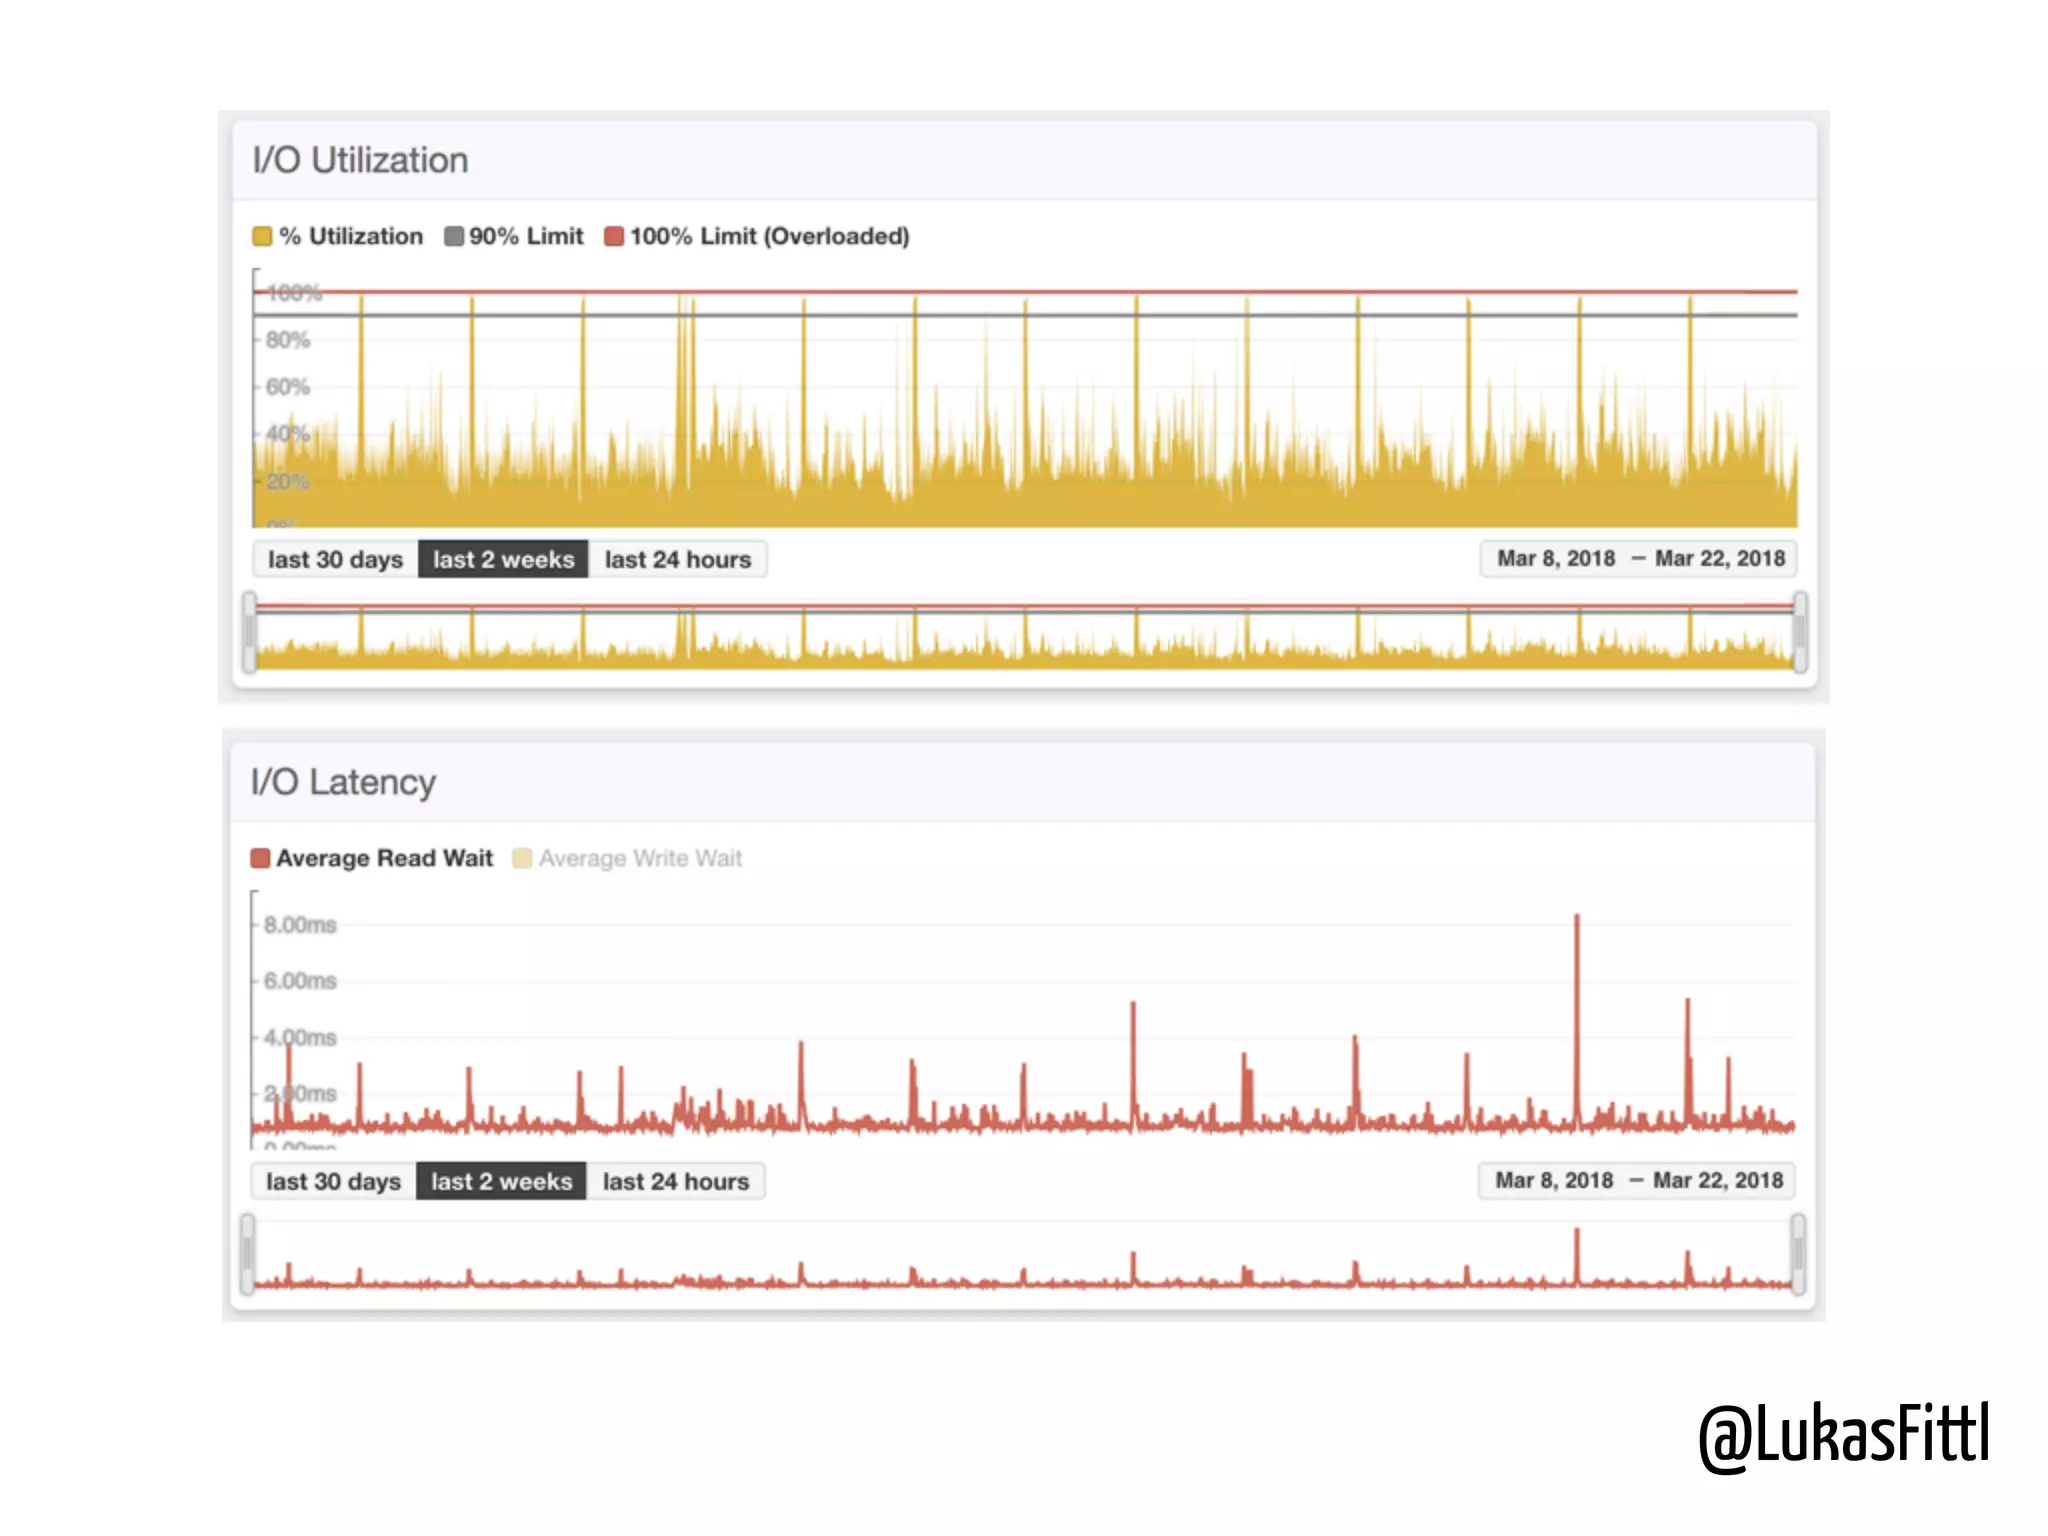
The document discusses strategies for monitoring and observability of PostgreSQL at scale, emphasizing the importance of tracking historical statistics and workload metrics. It outlines methods for gathering operational metrics, identifying problems related to configurations, and optimizing performance through query analysis. Additionally, it suggests best practices for alerting, documentation, and developer involvement in maintaining system efficiency.