Download as PDF, PPTX
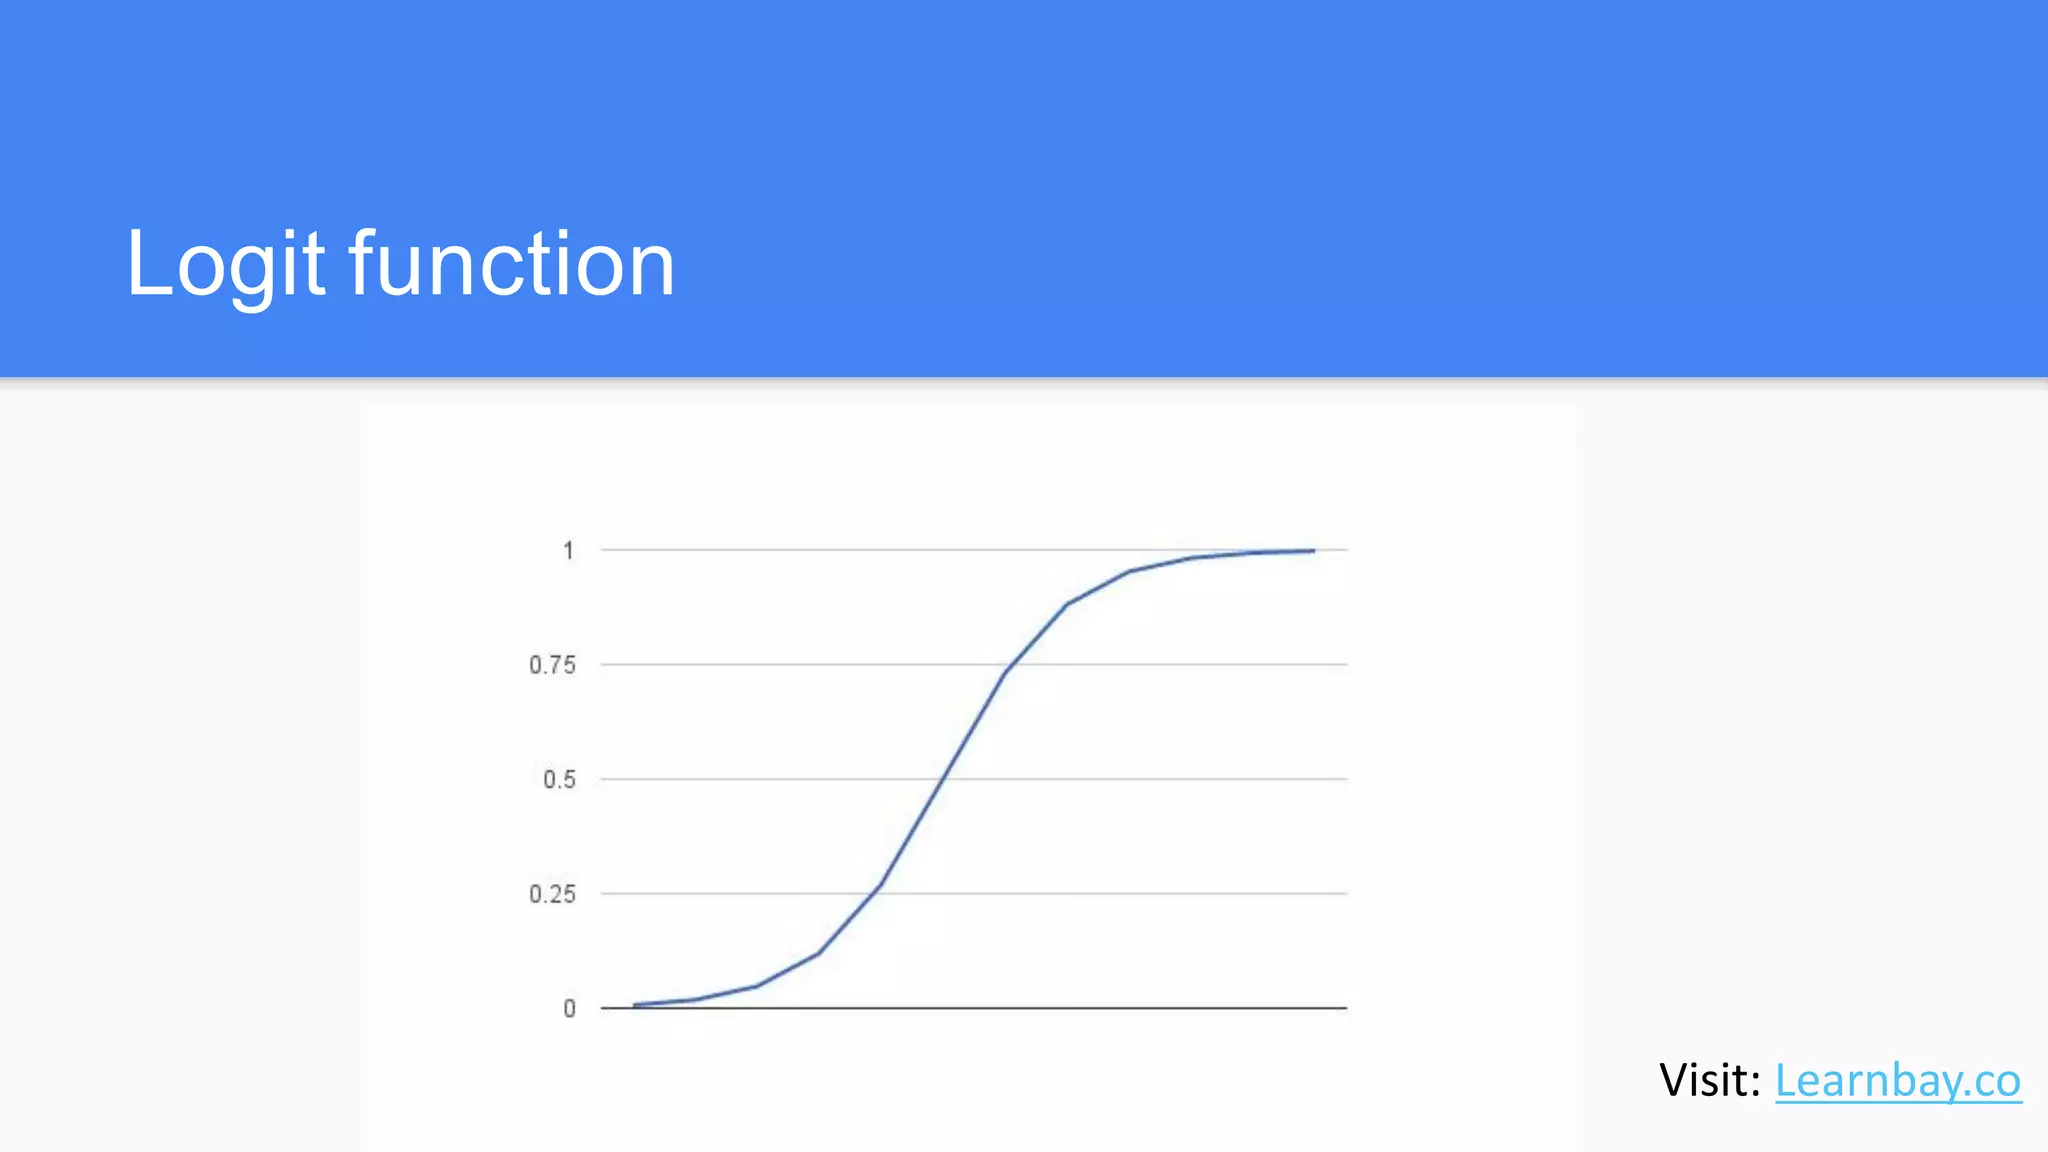
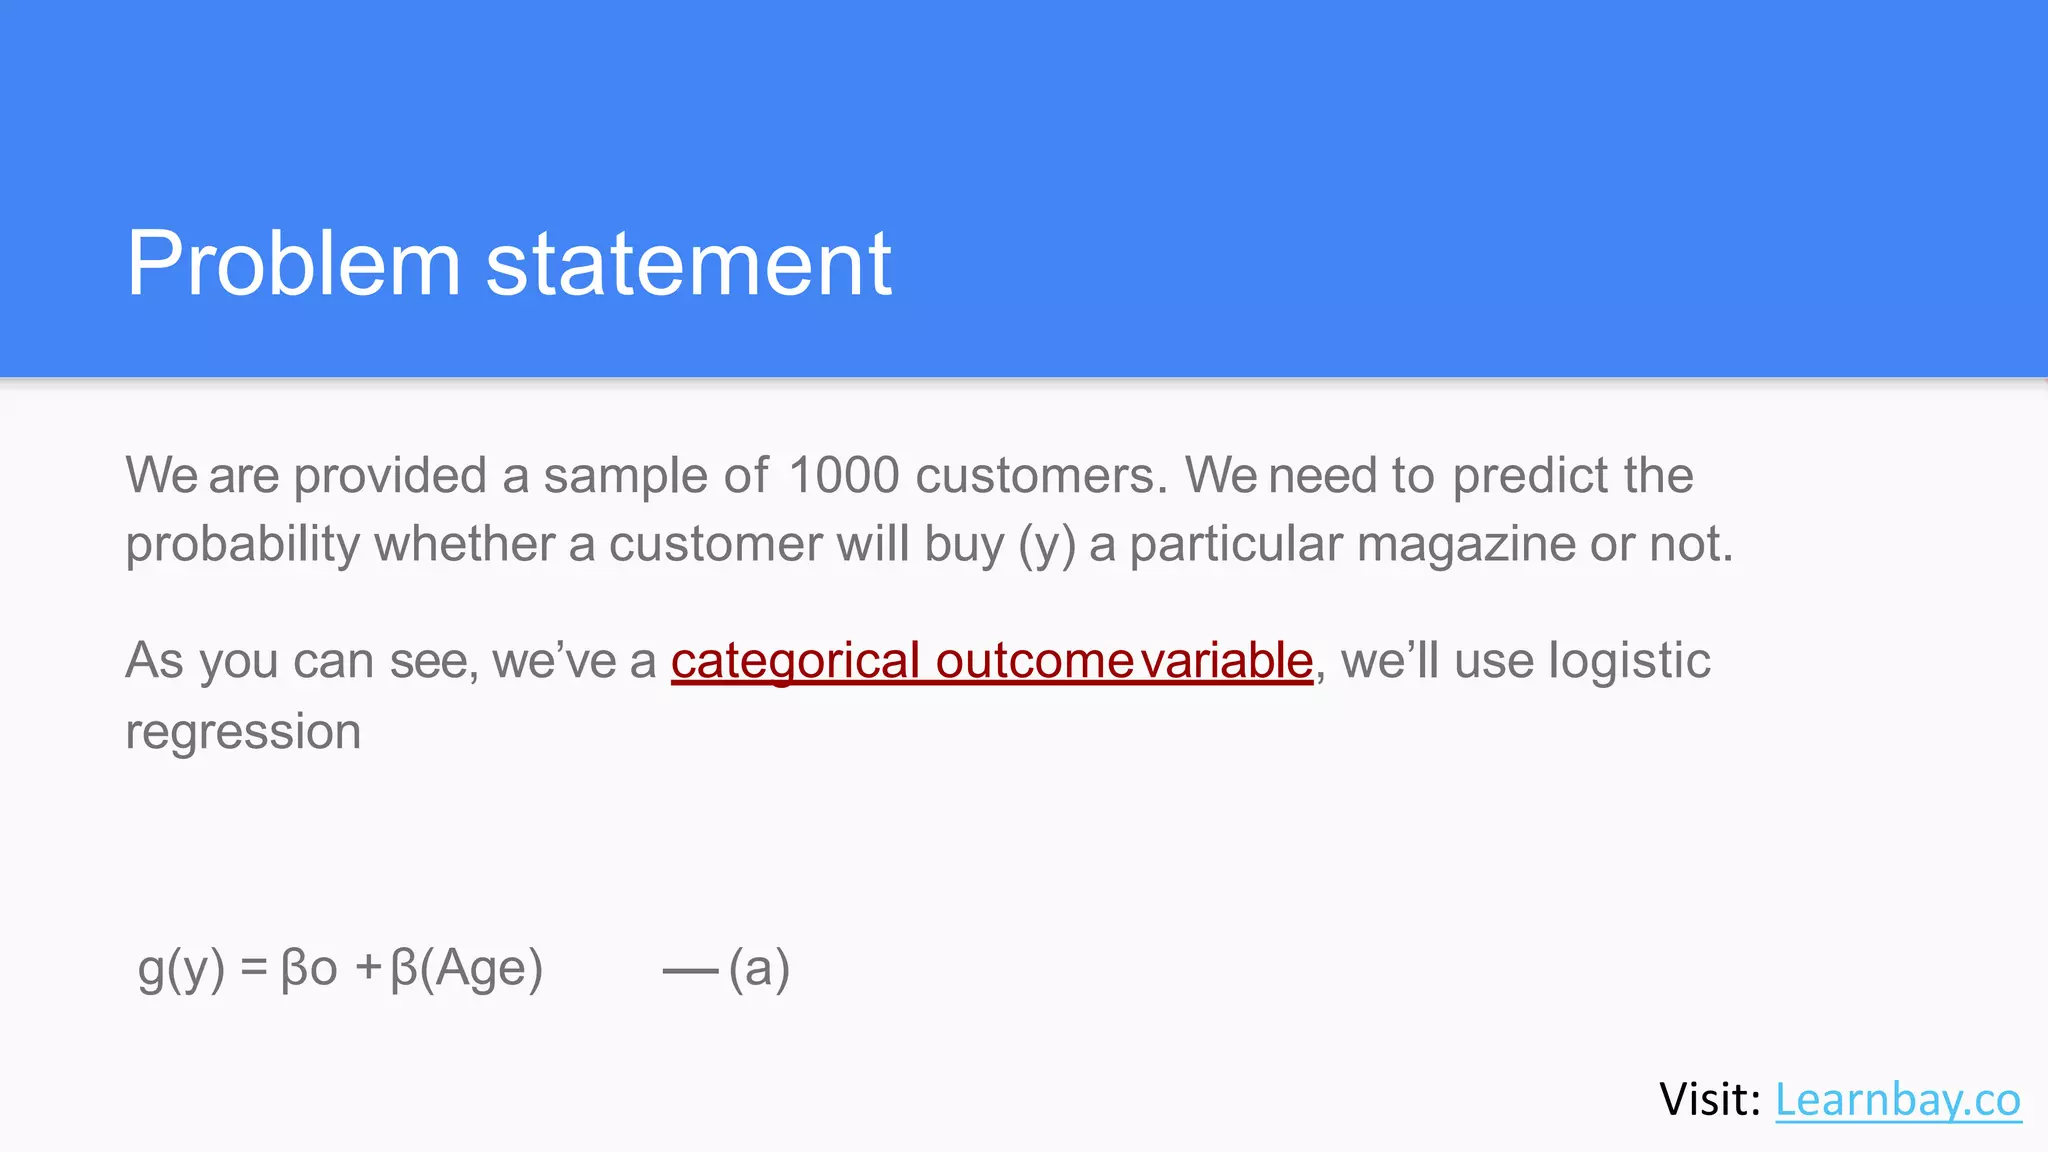


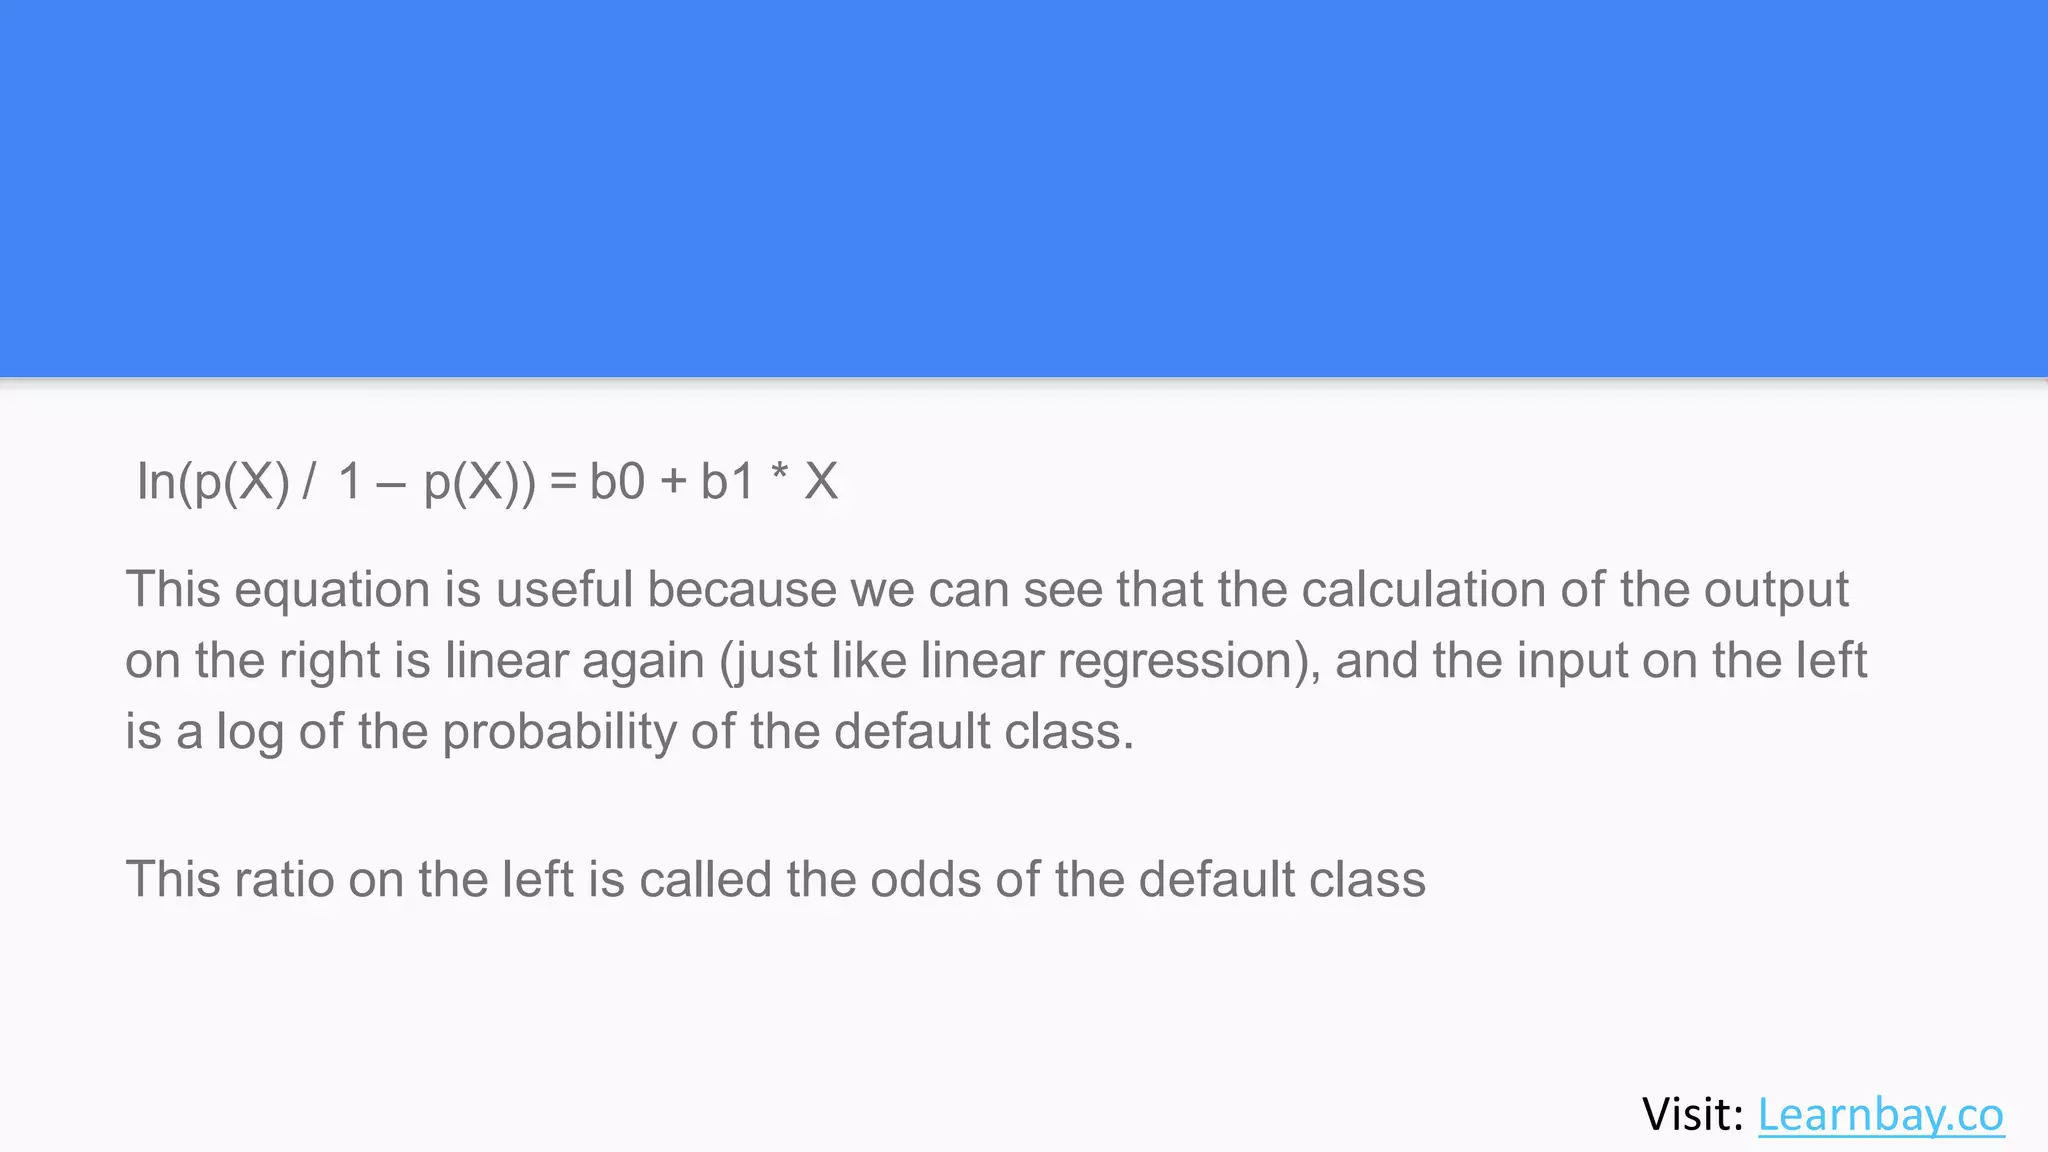
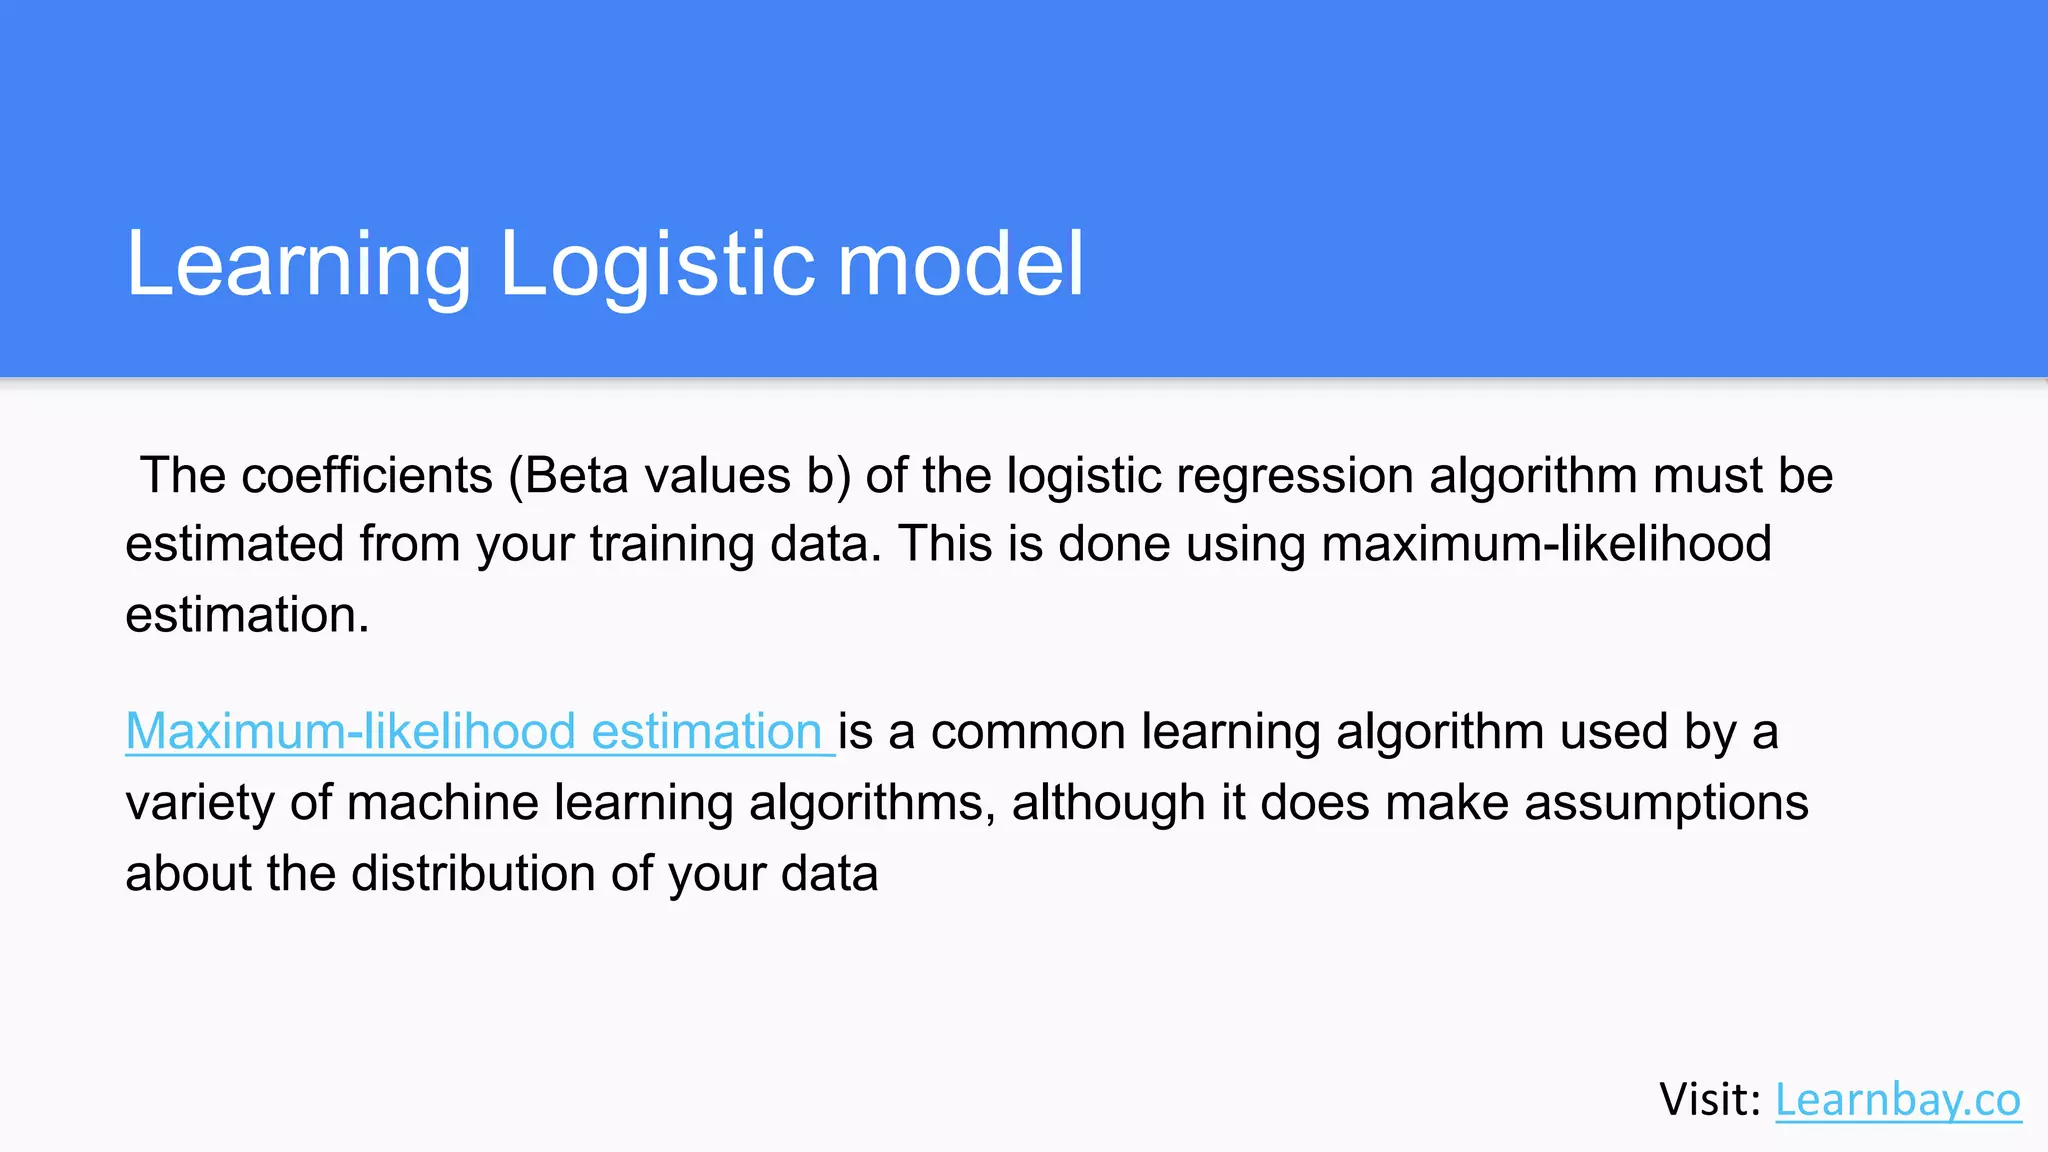
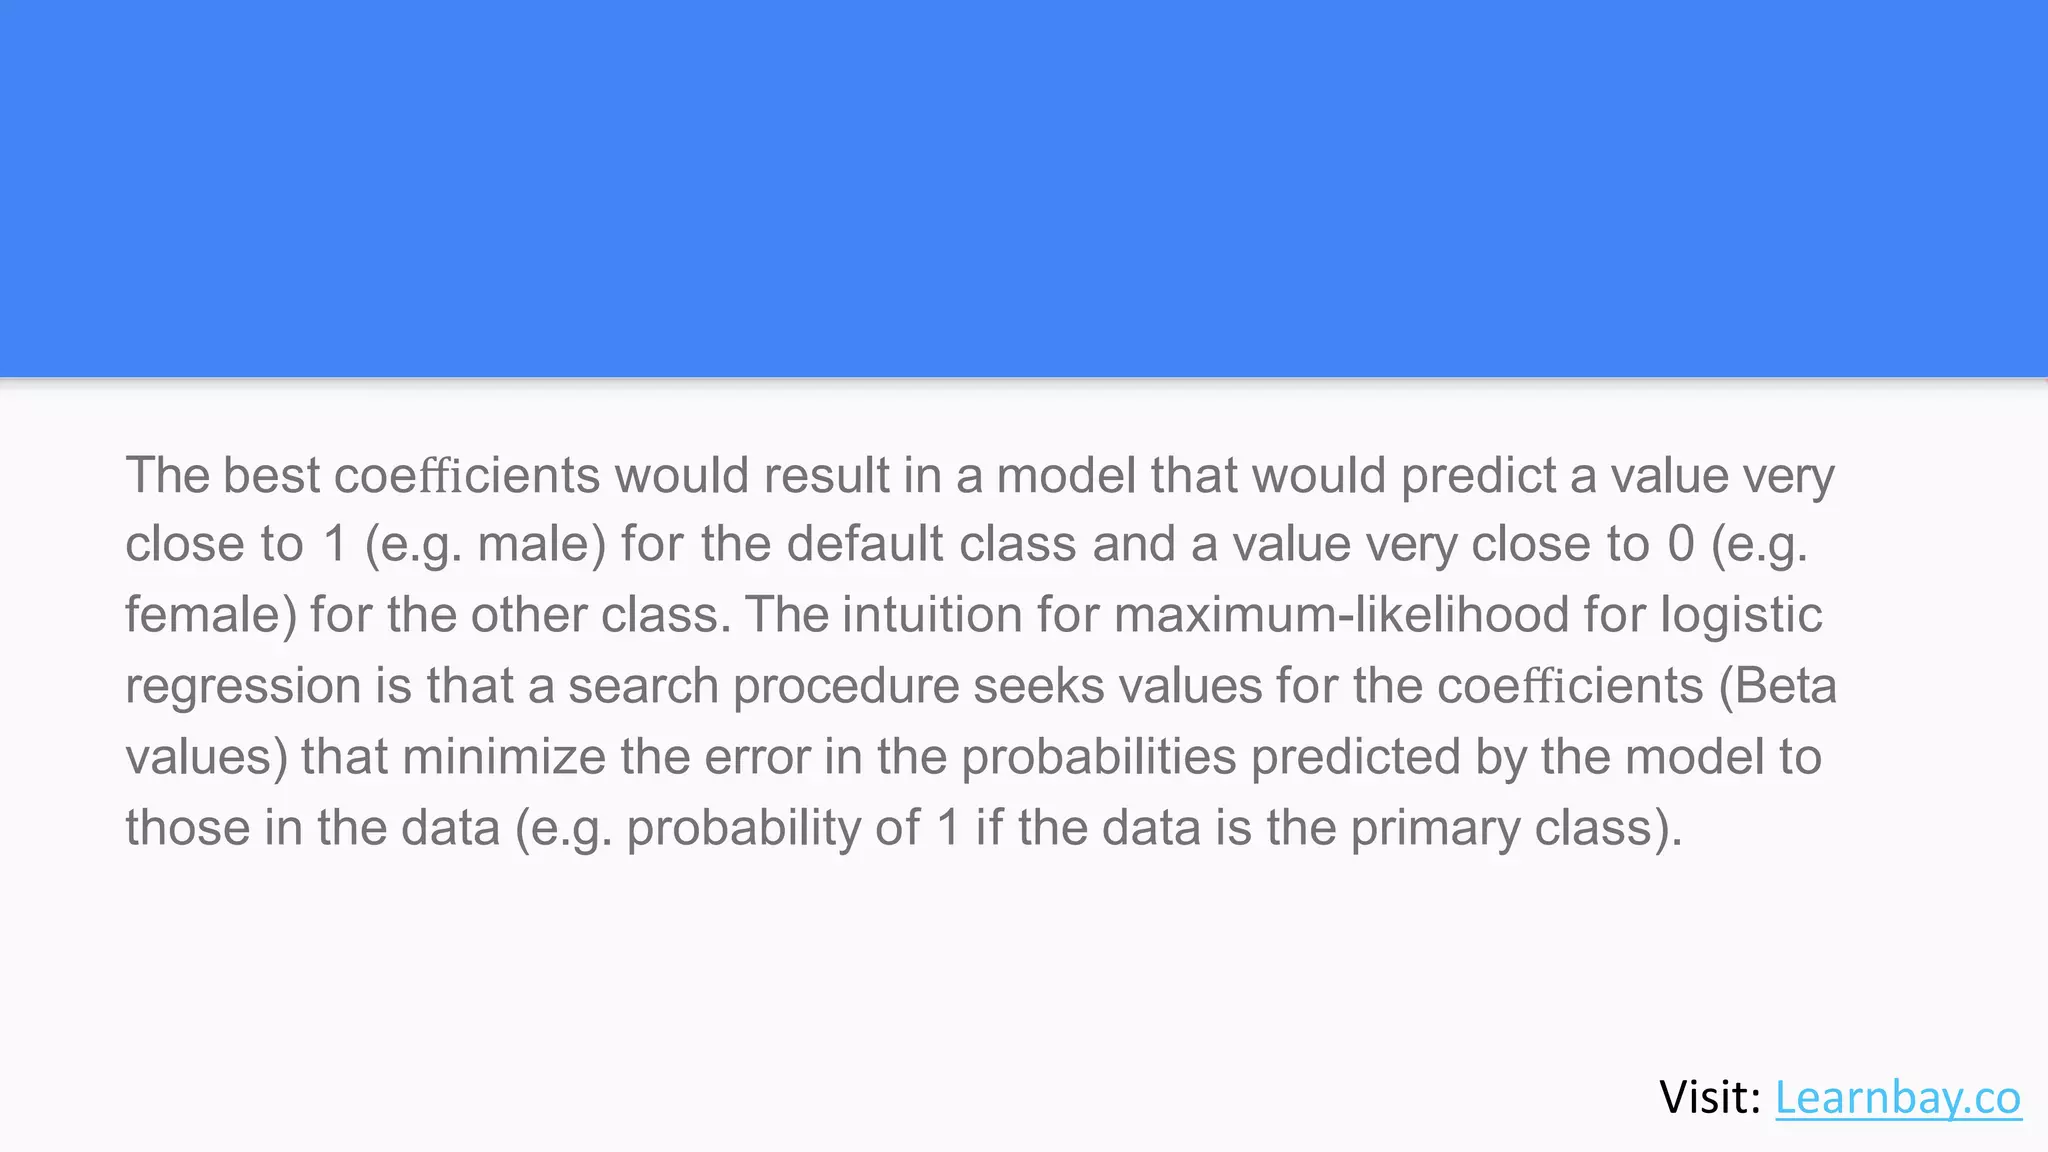
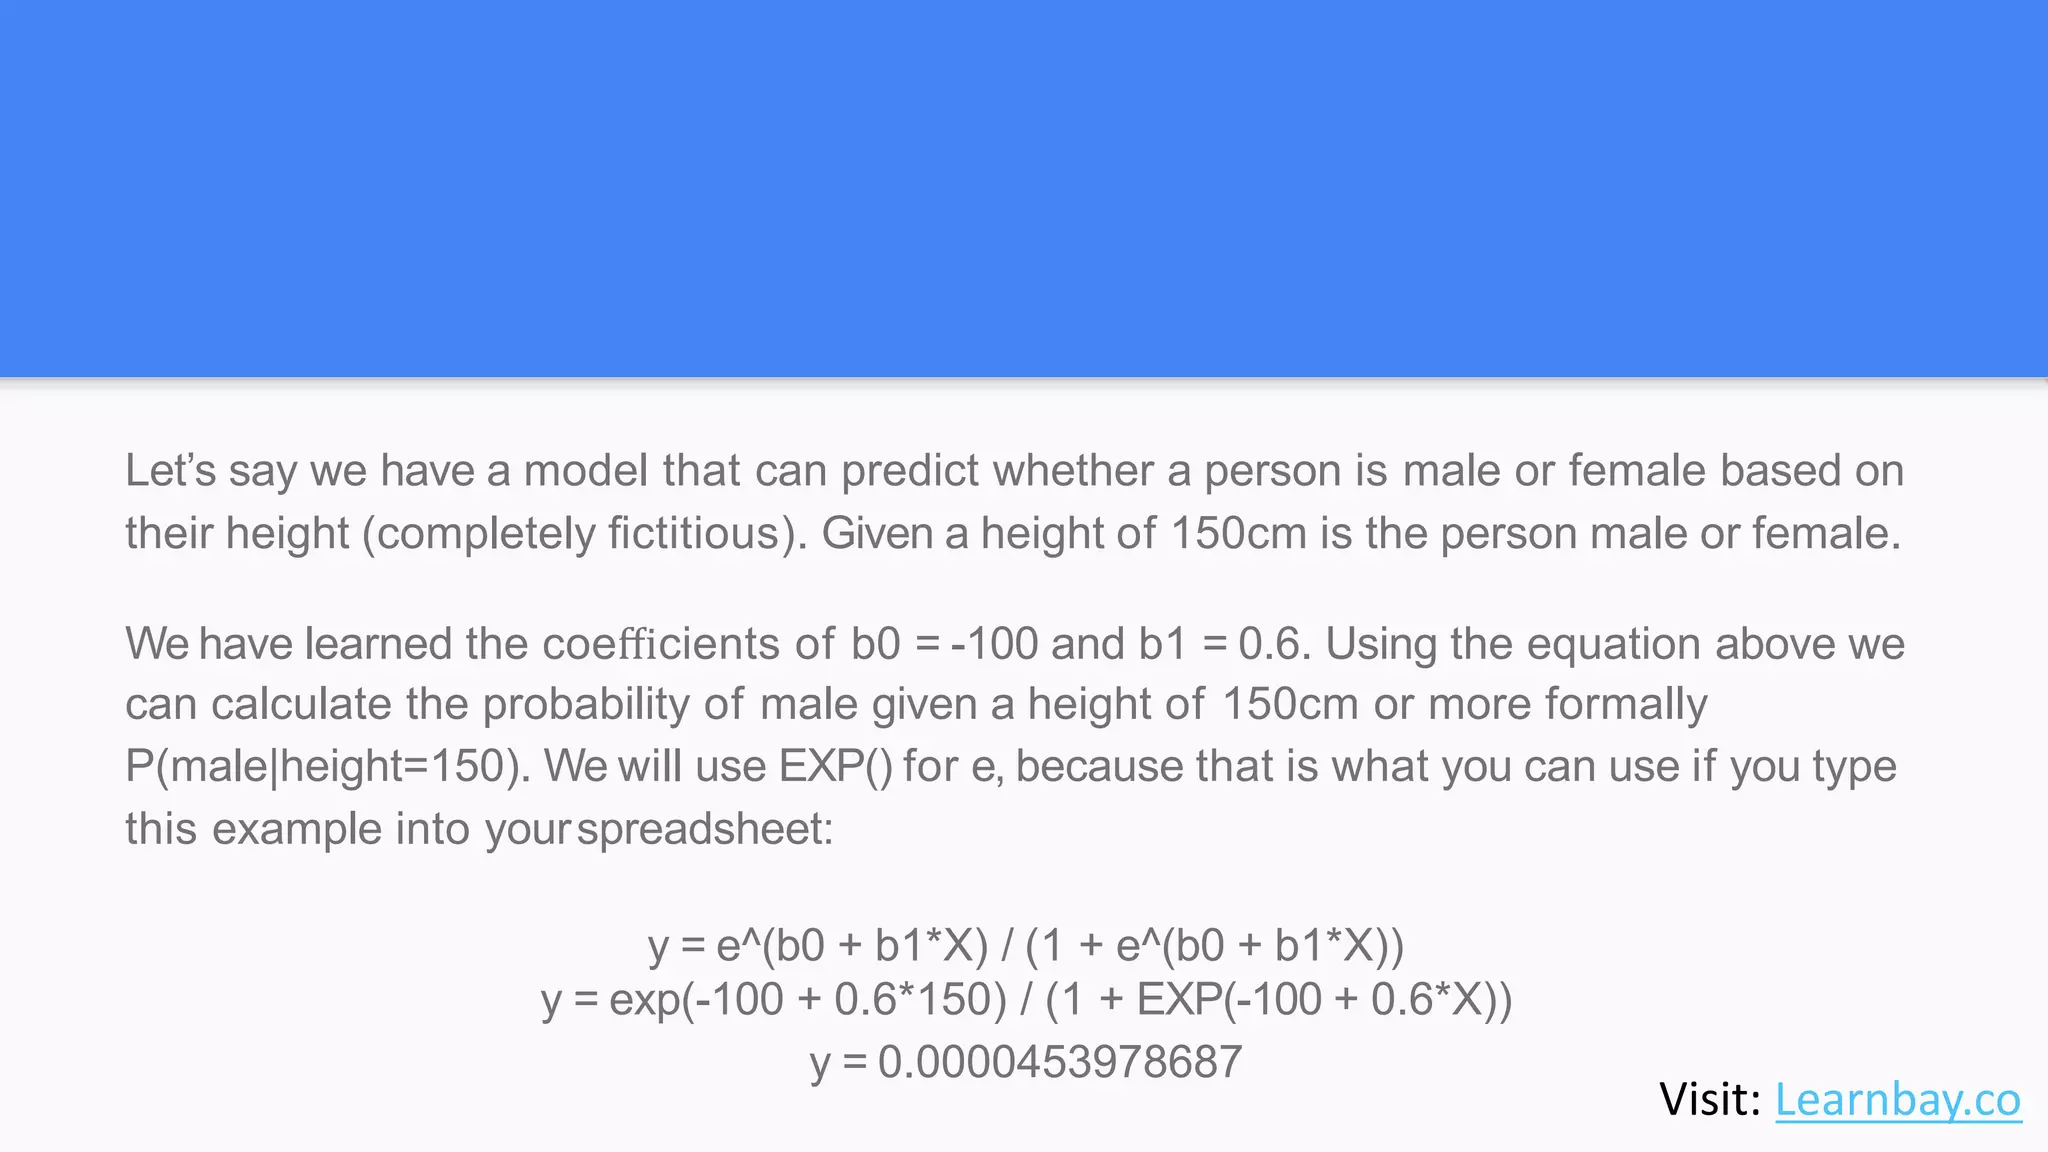


The document discusses logistic regression, a classification algorithm used to predict binary outcomes based on independent variables. It explains the mathematics behind logistic functions and the process of estimating coefficients using maximum-likelihood estimation. Additionally, it illustrates the application of logistic regression in predicting probabilities, such as determining a customer's likelihood to buy a magazine based on various factors.