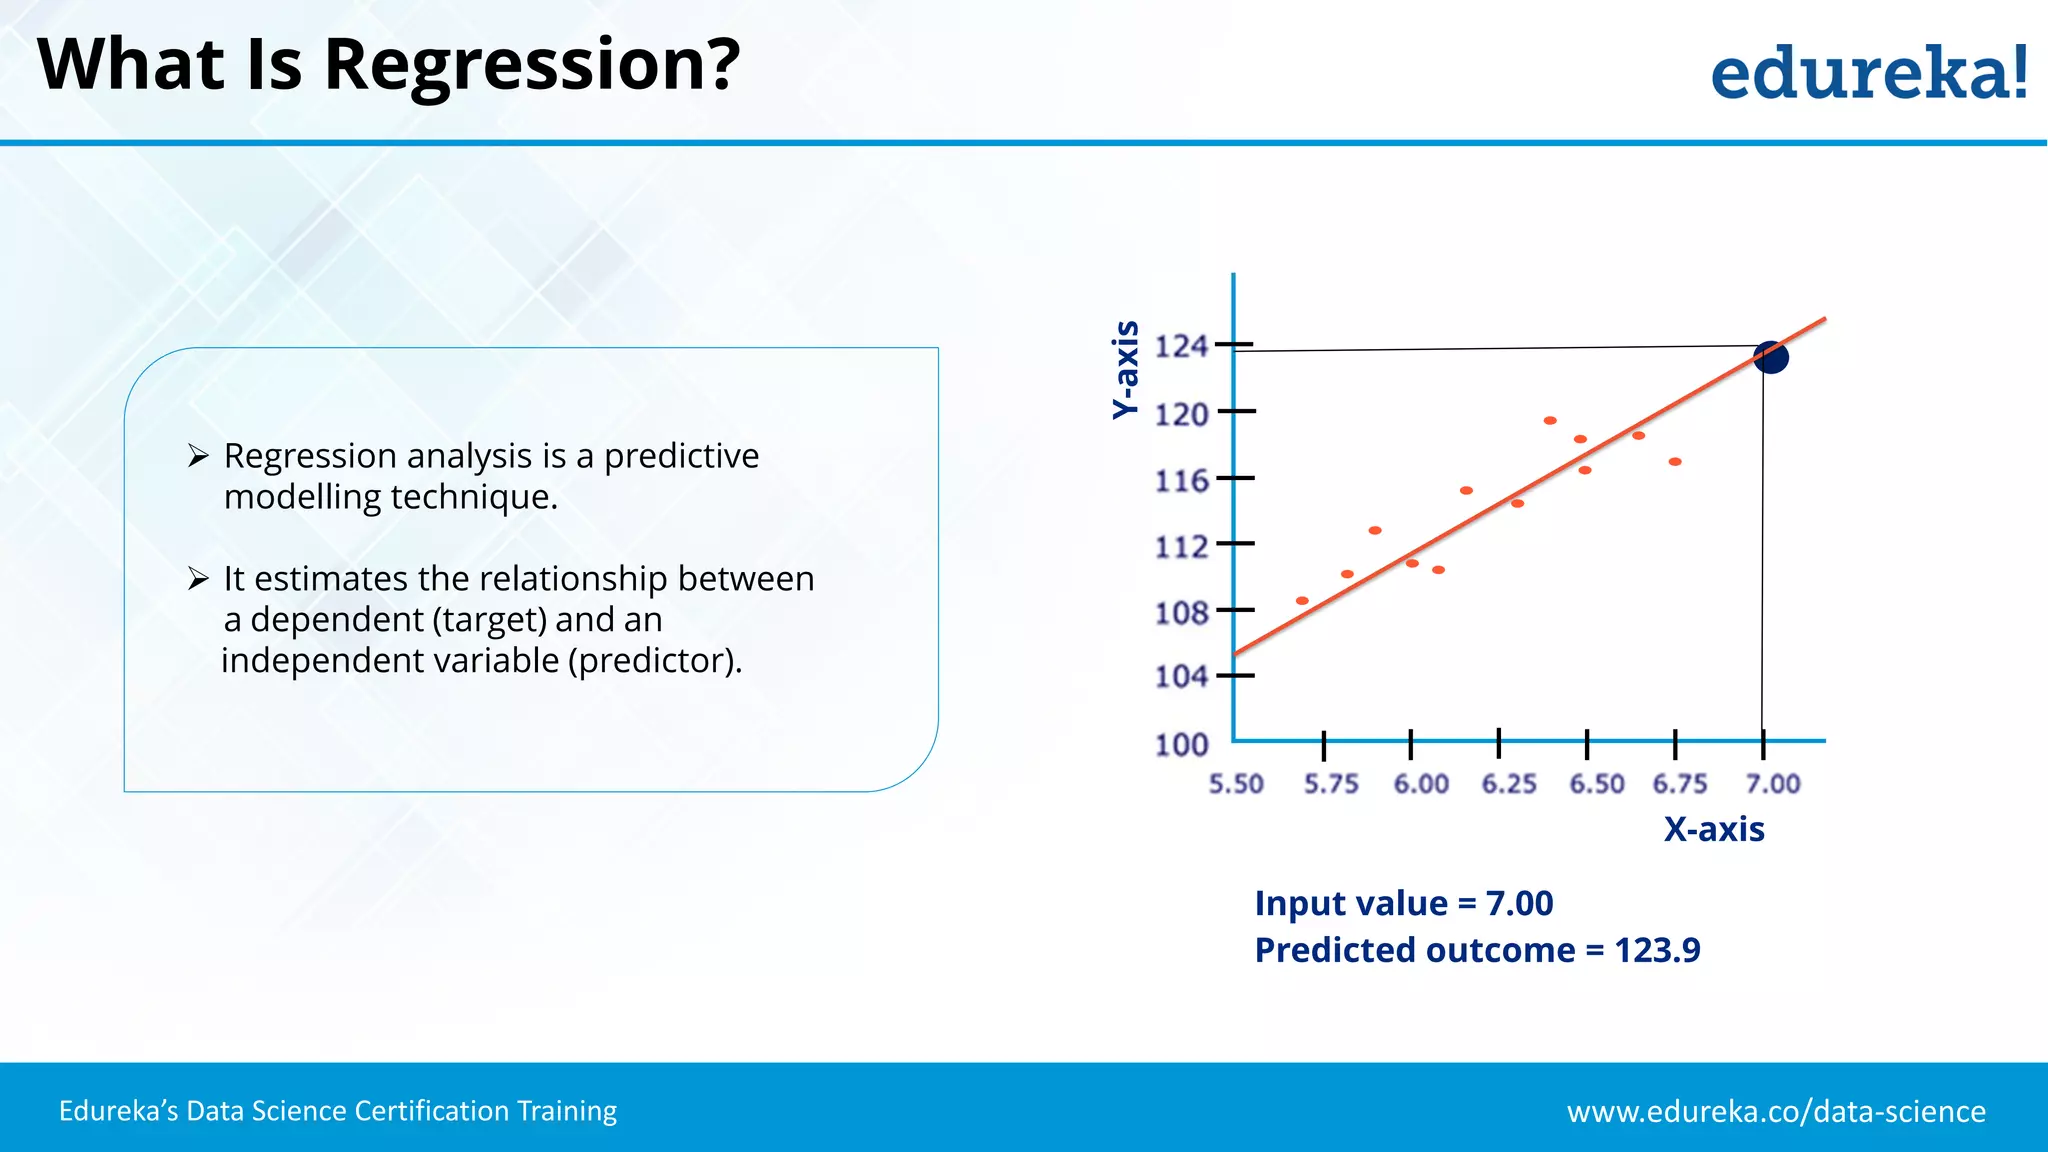
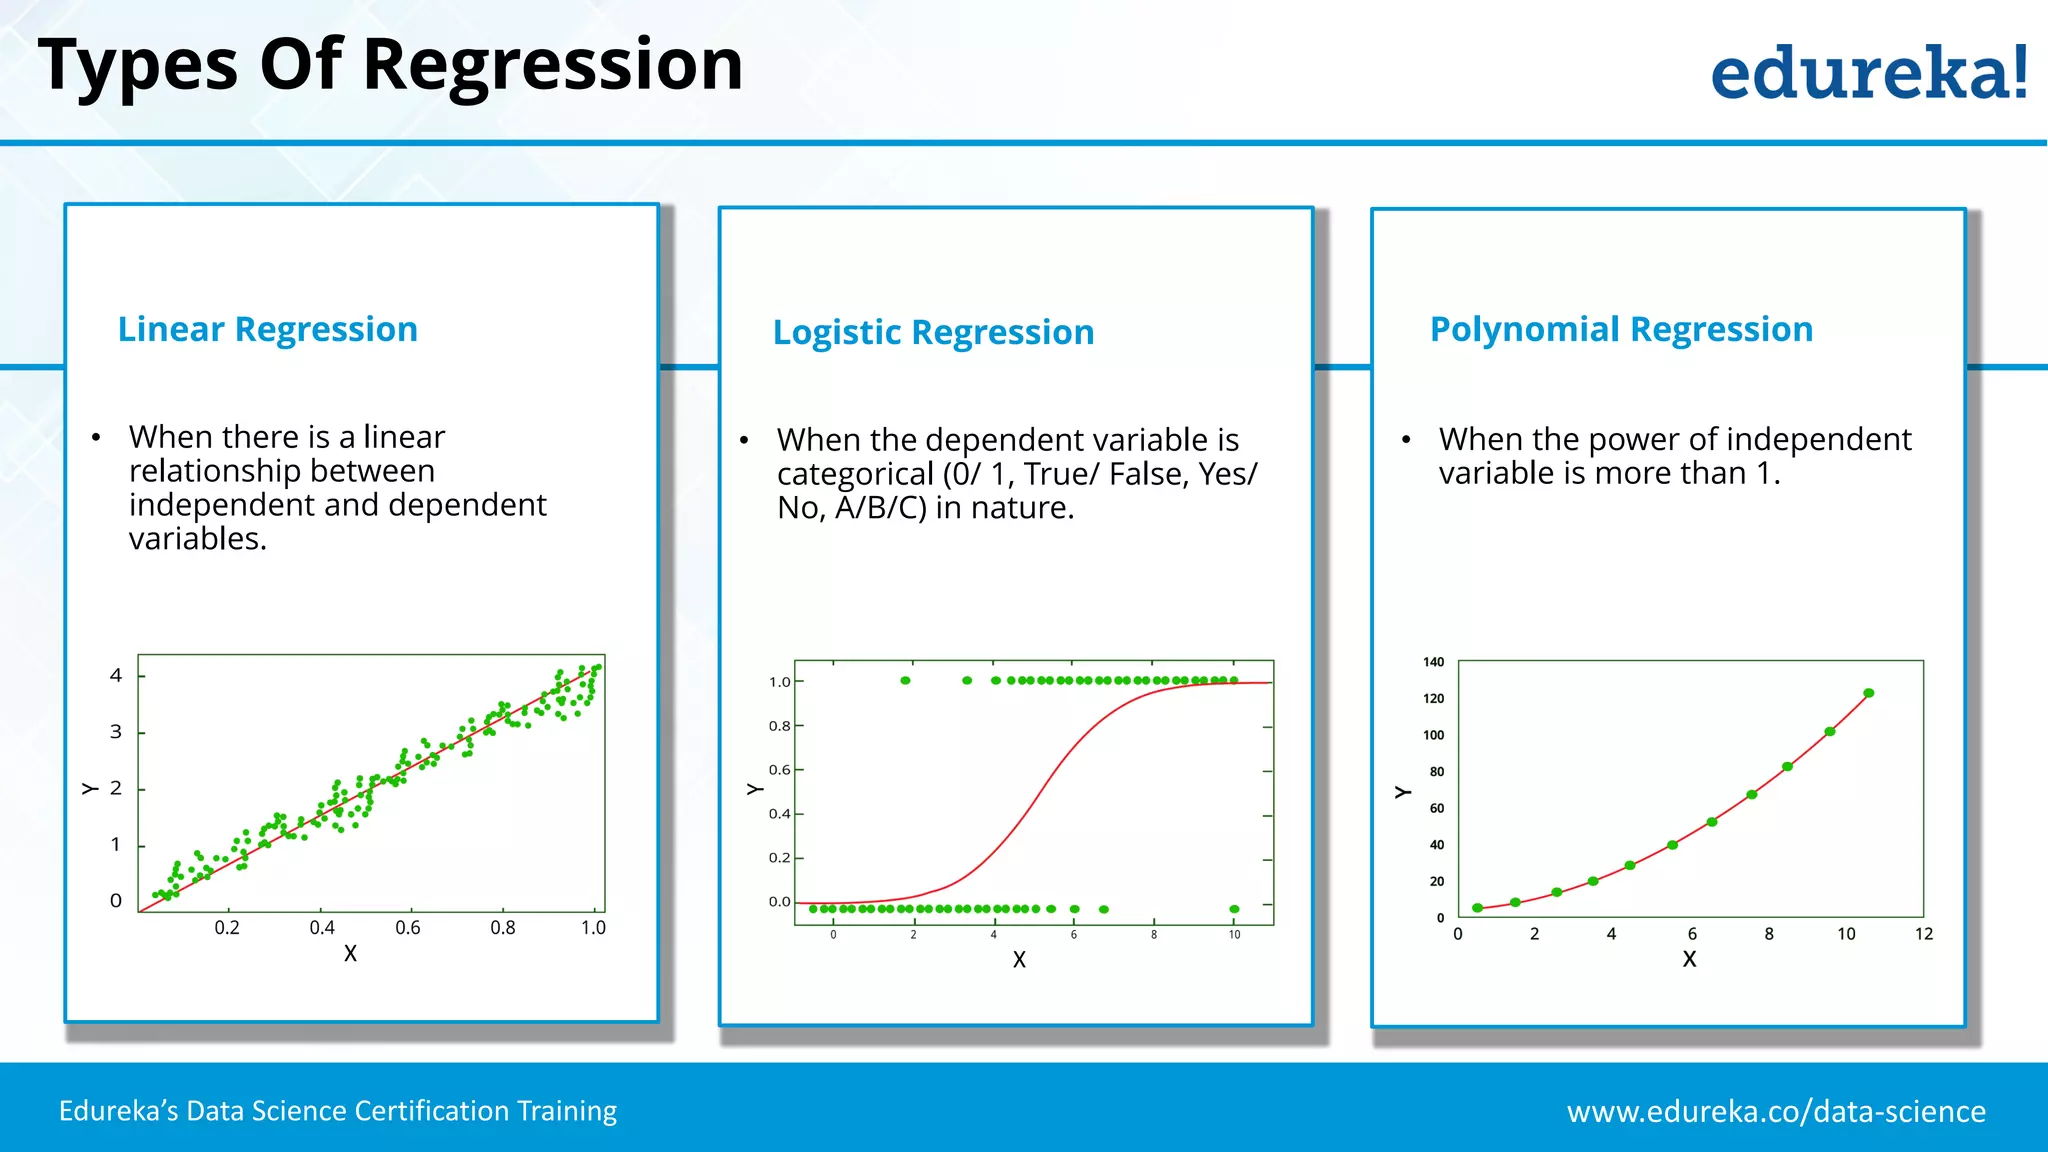
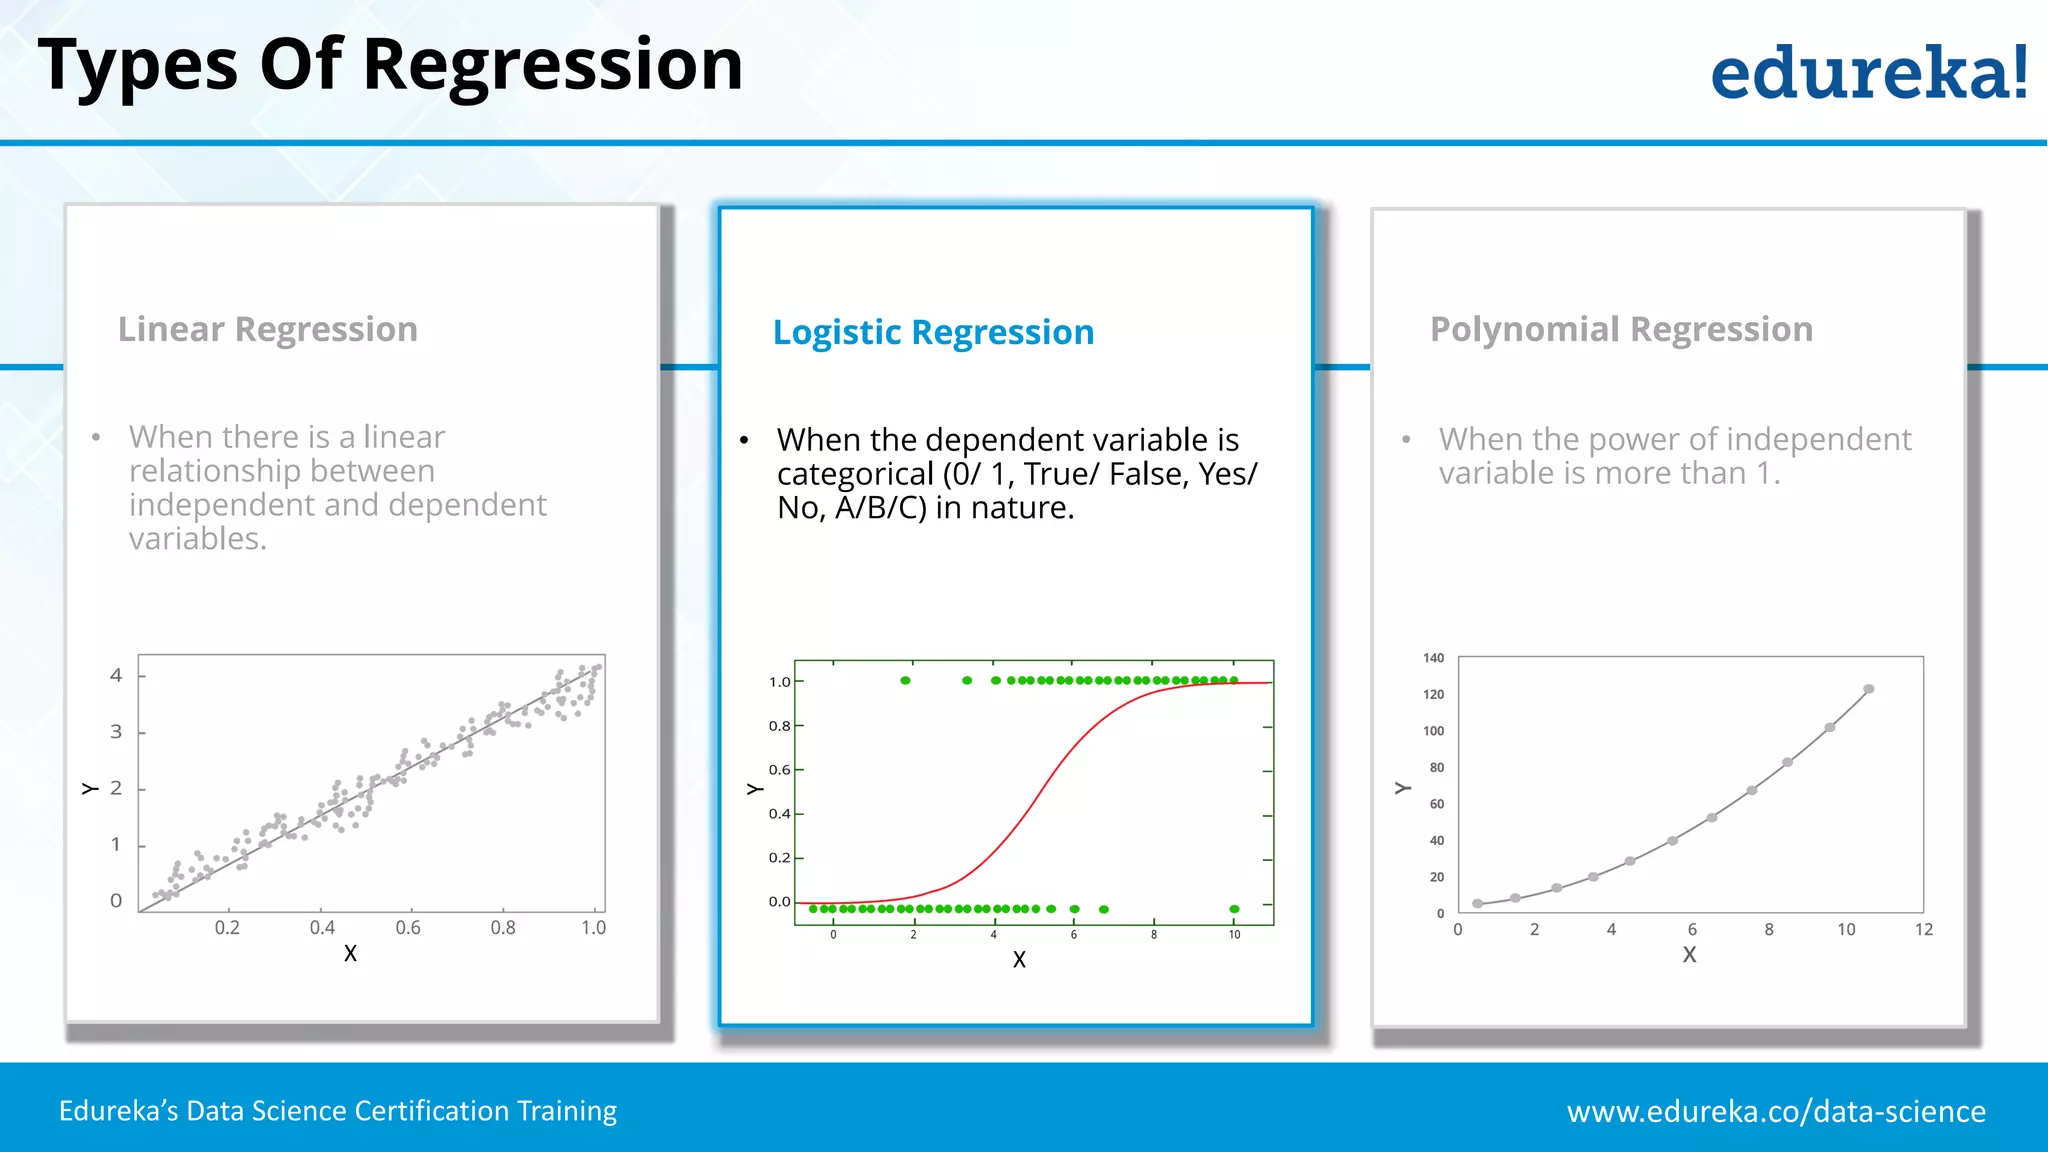
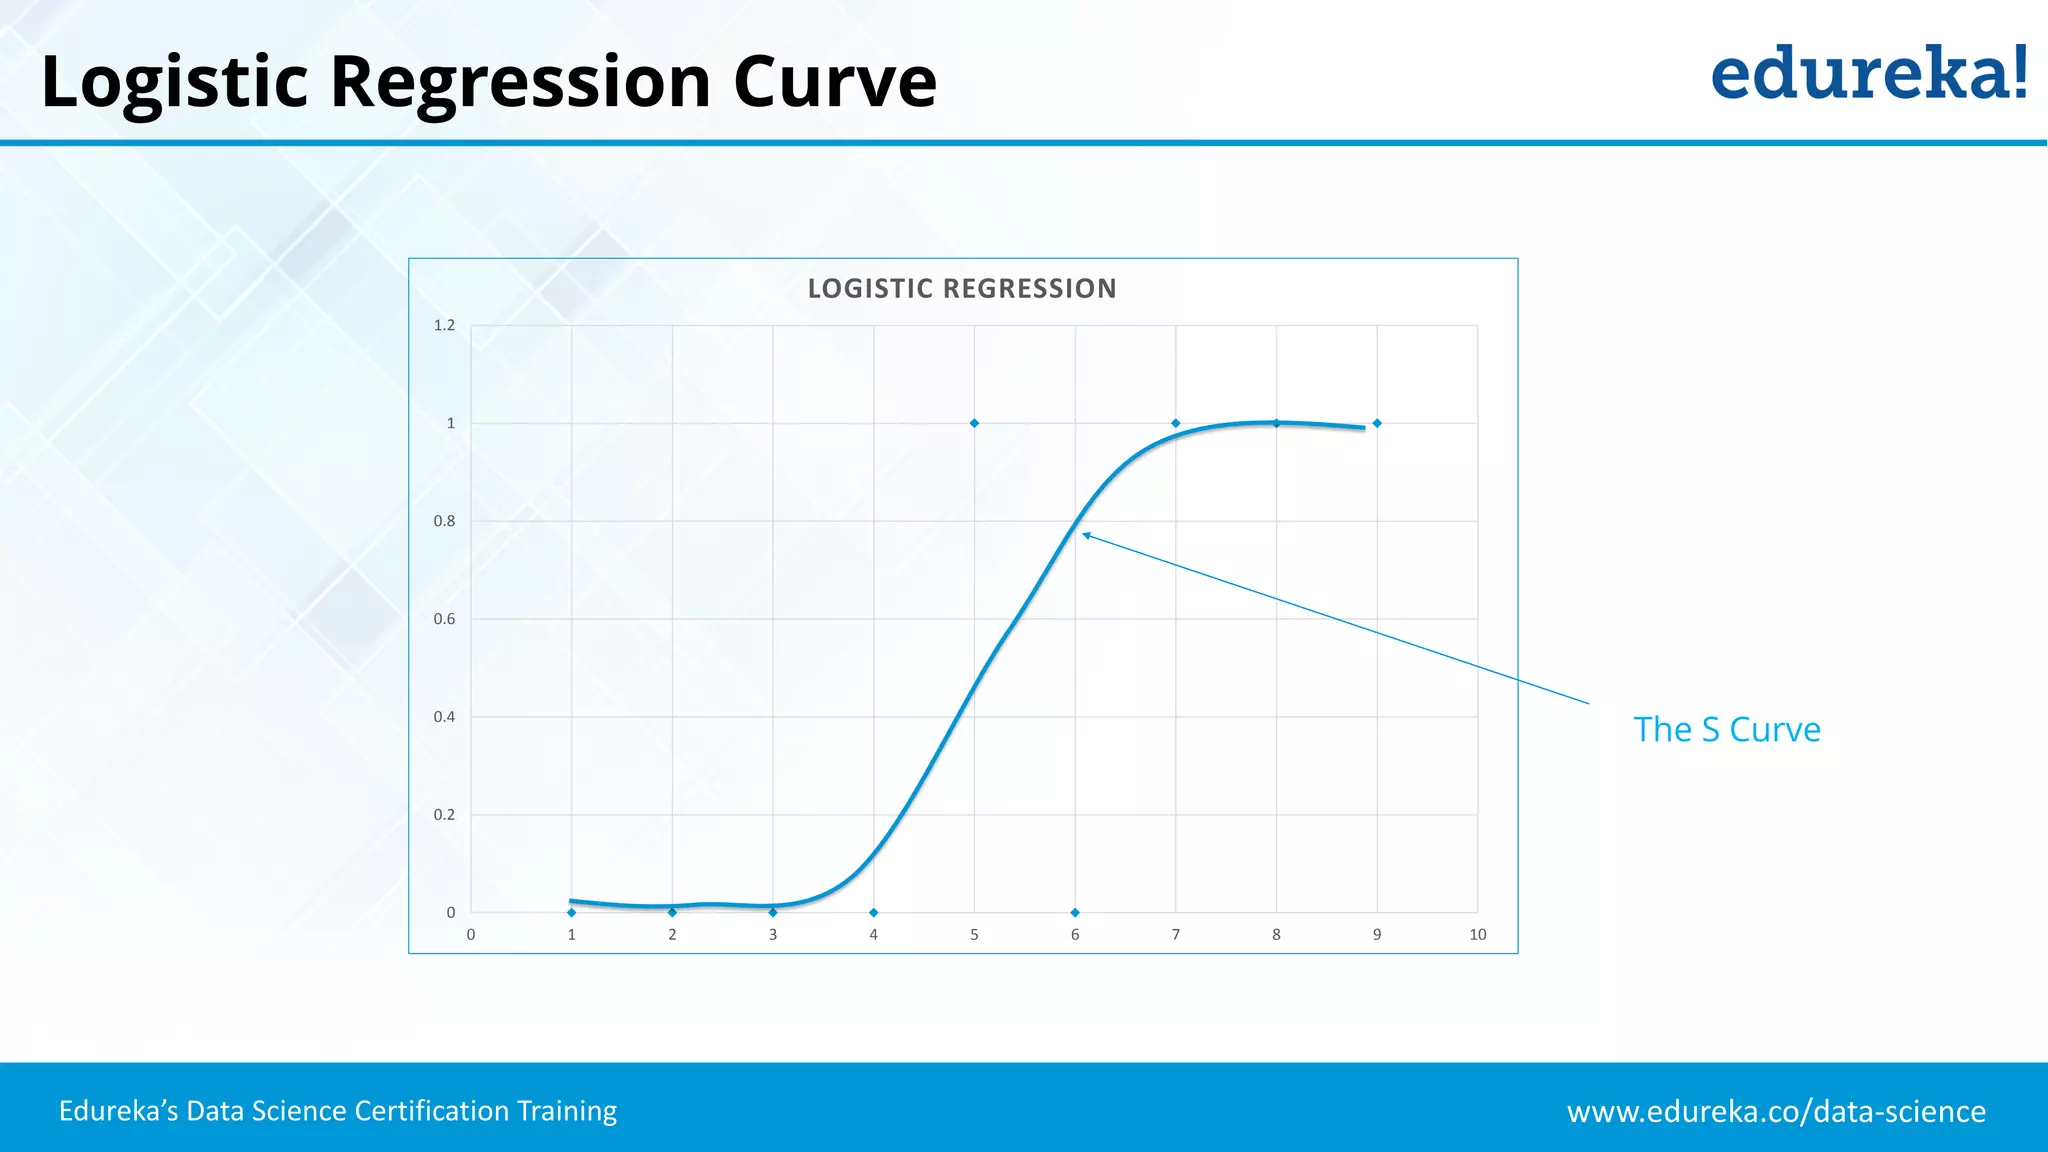
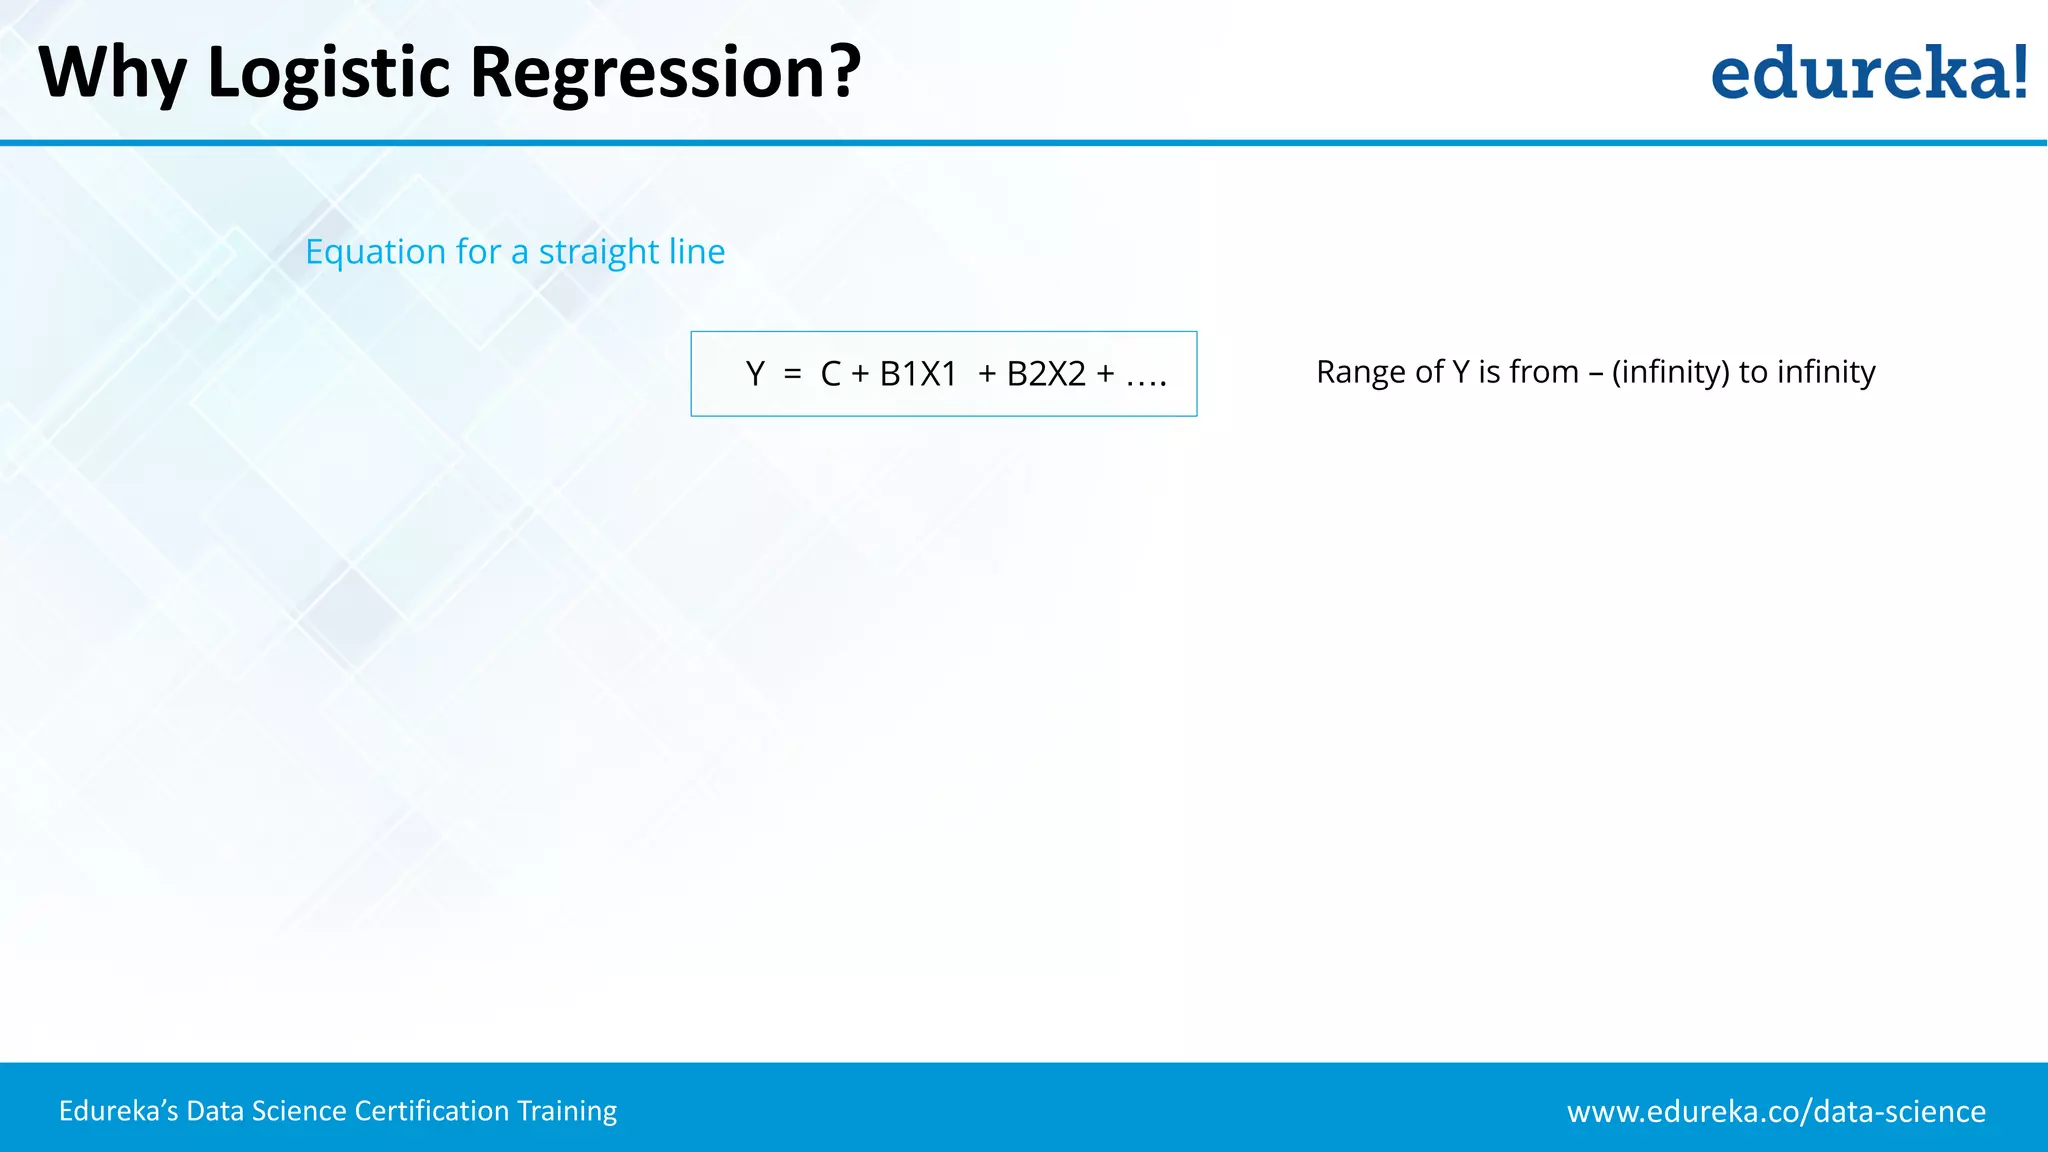
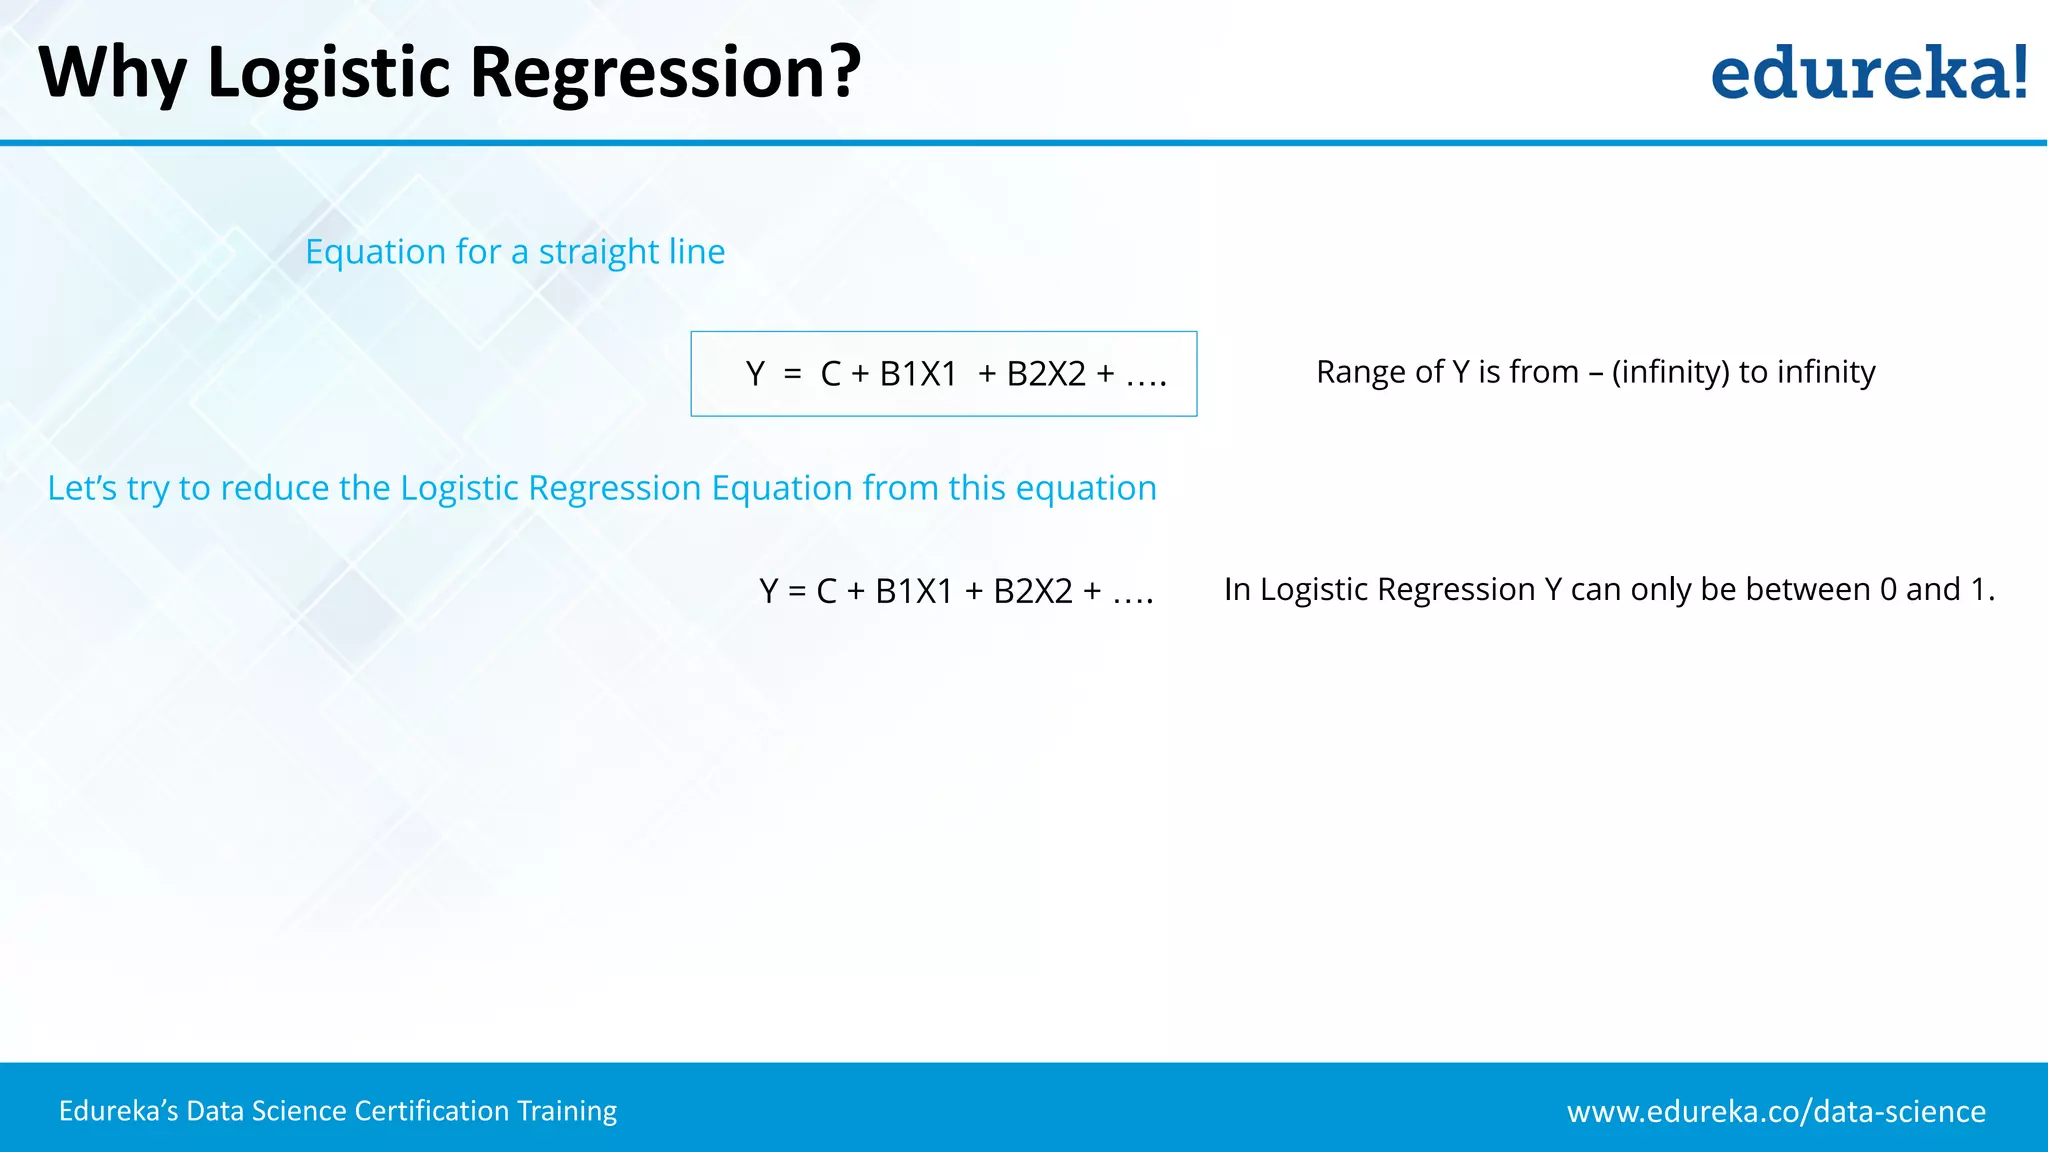
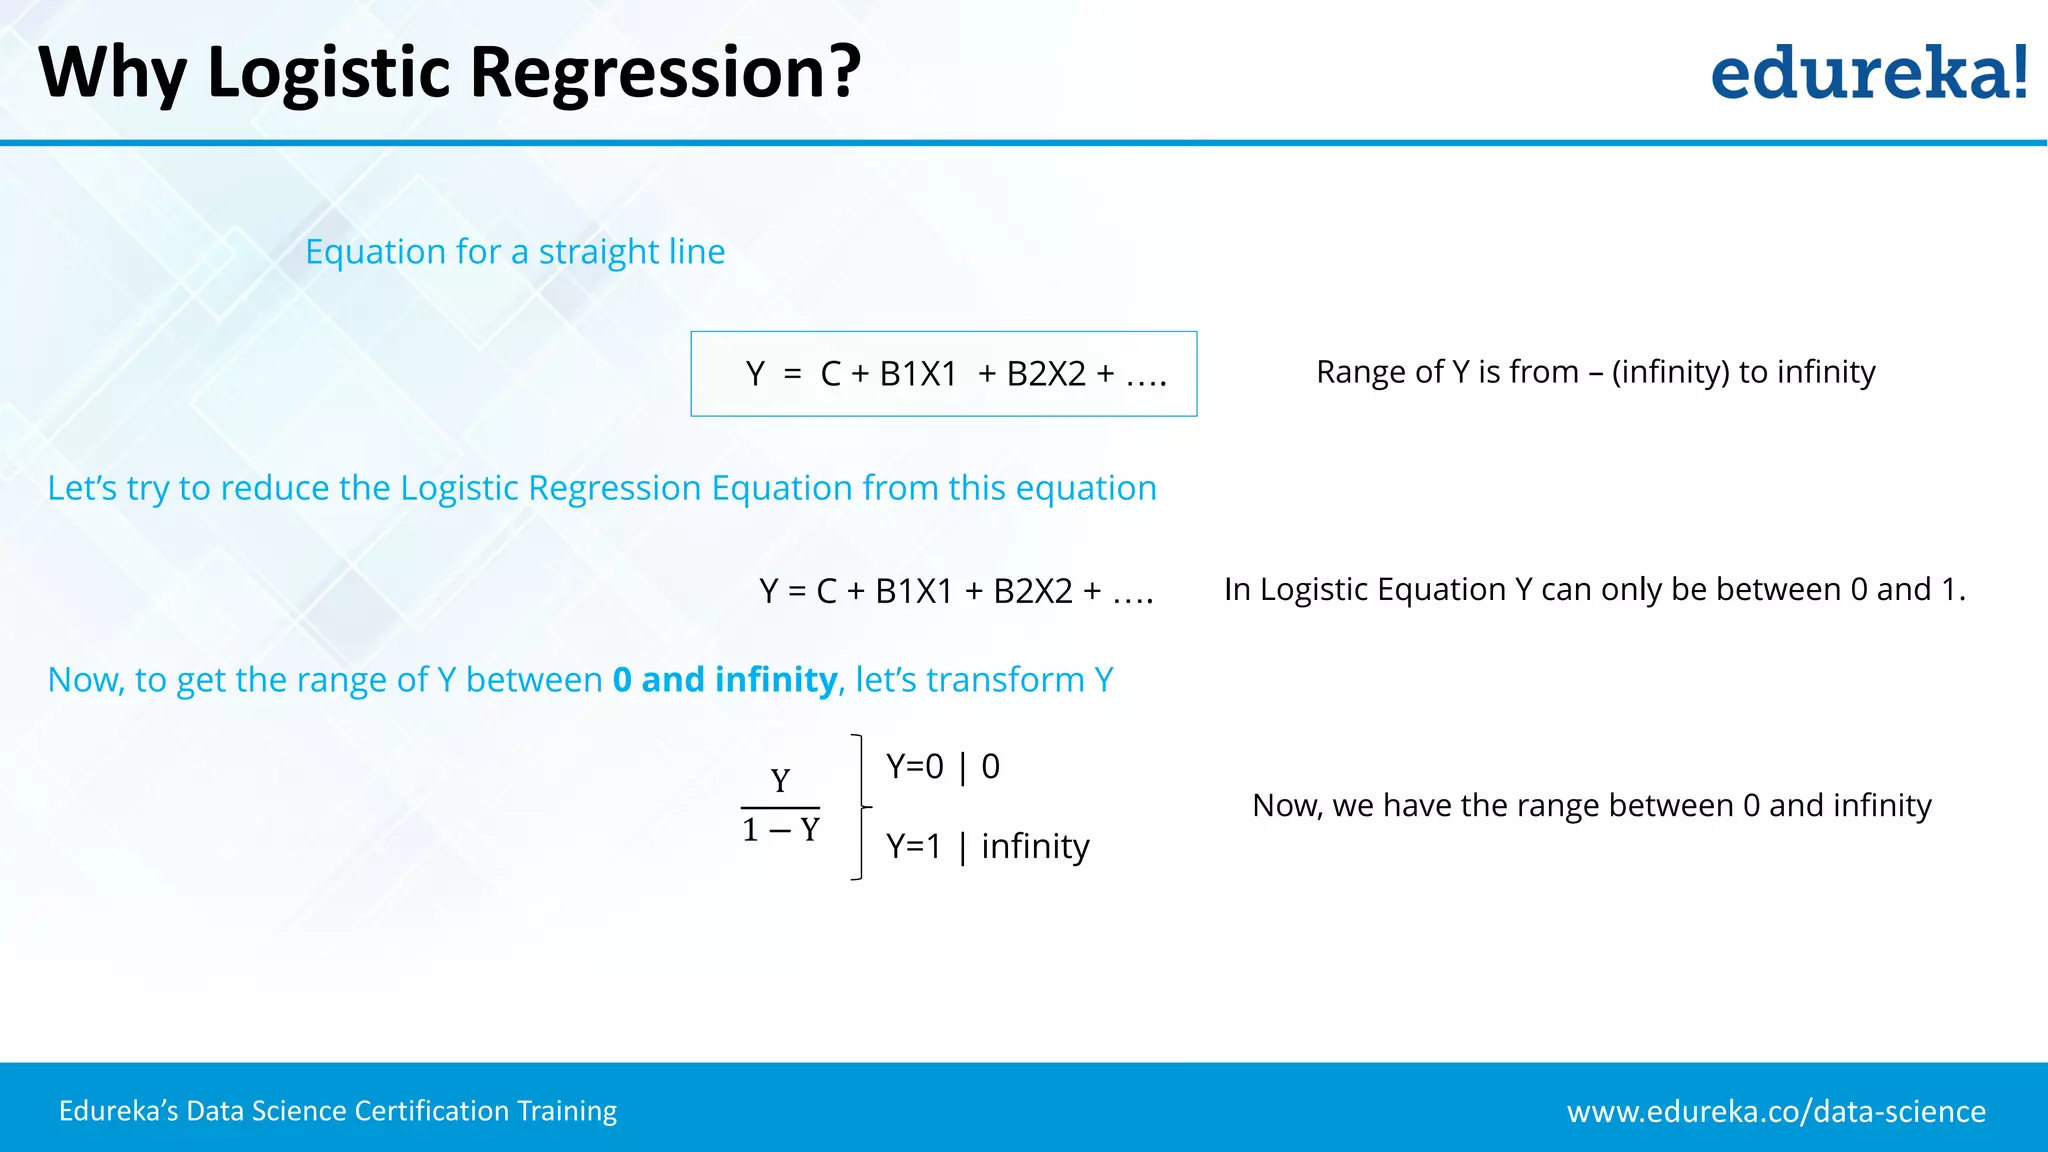
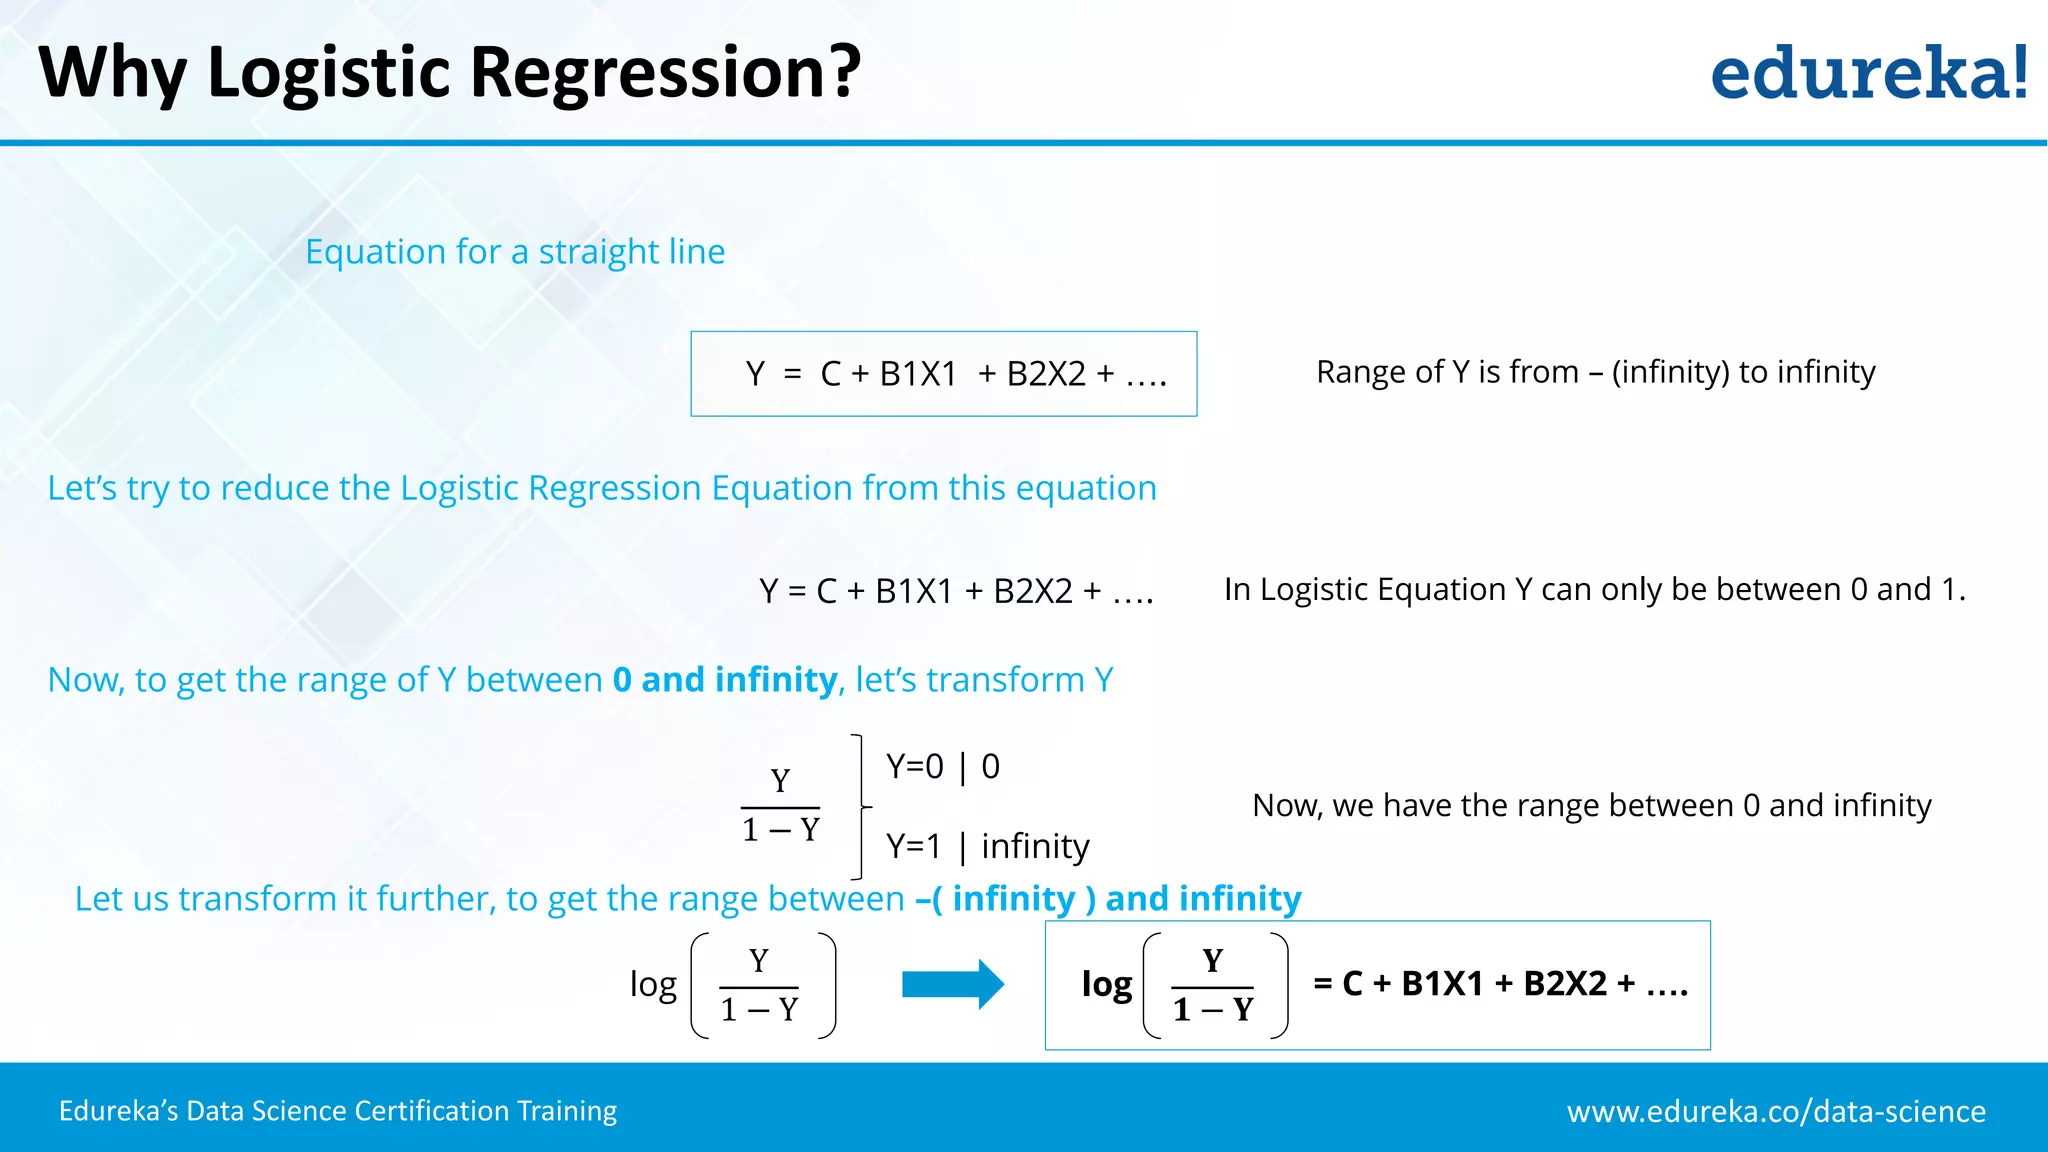
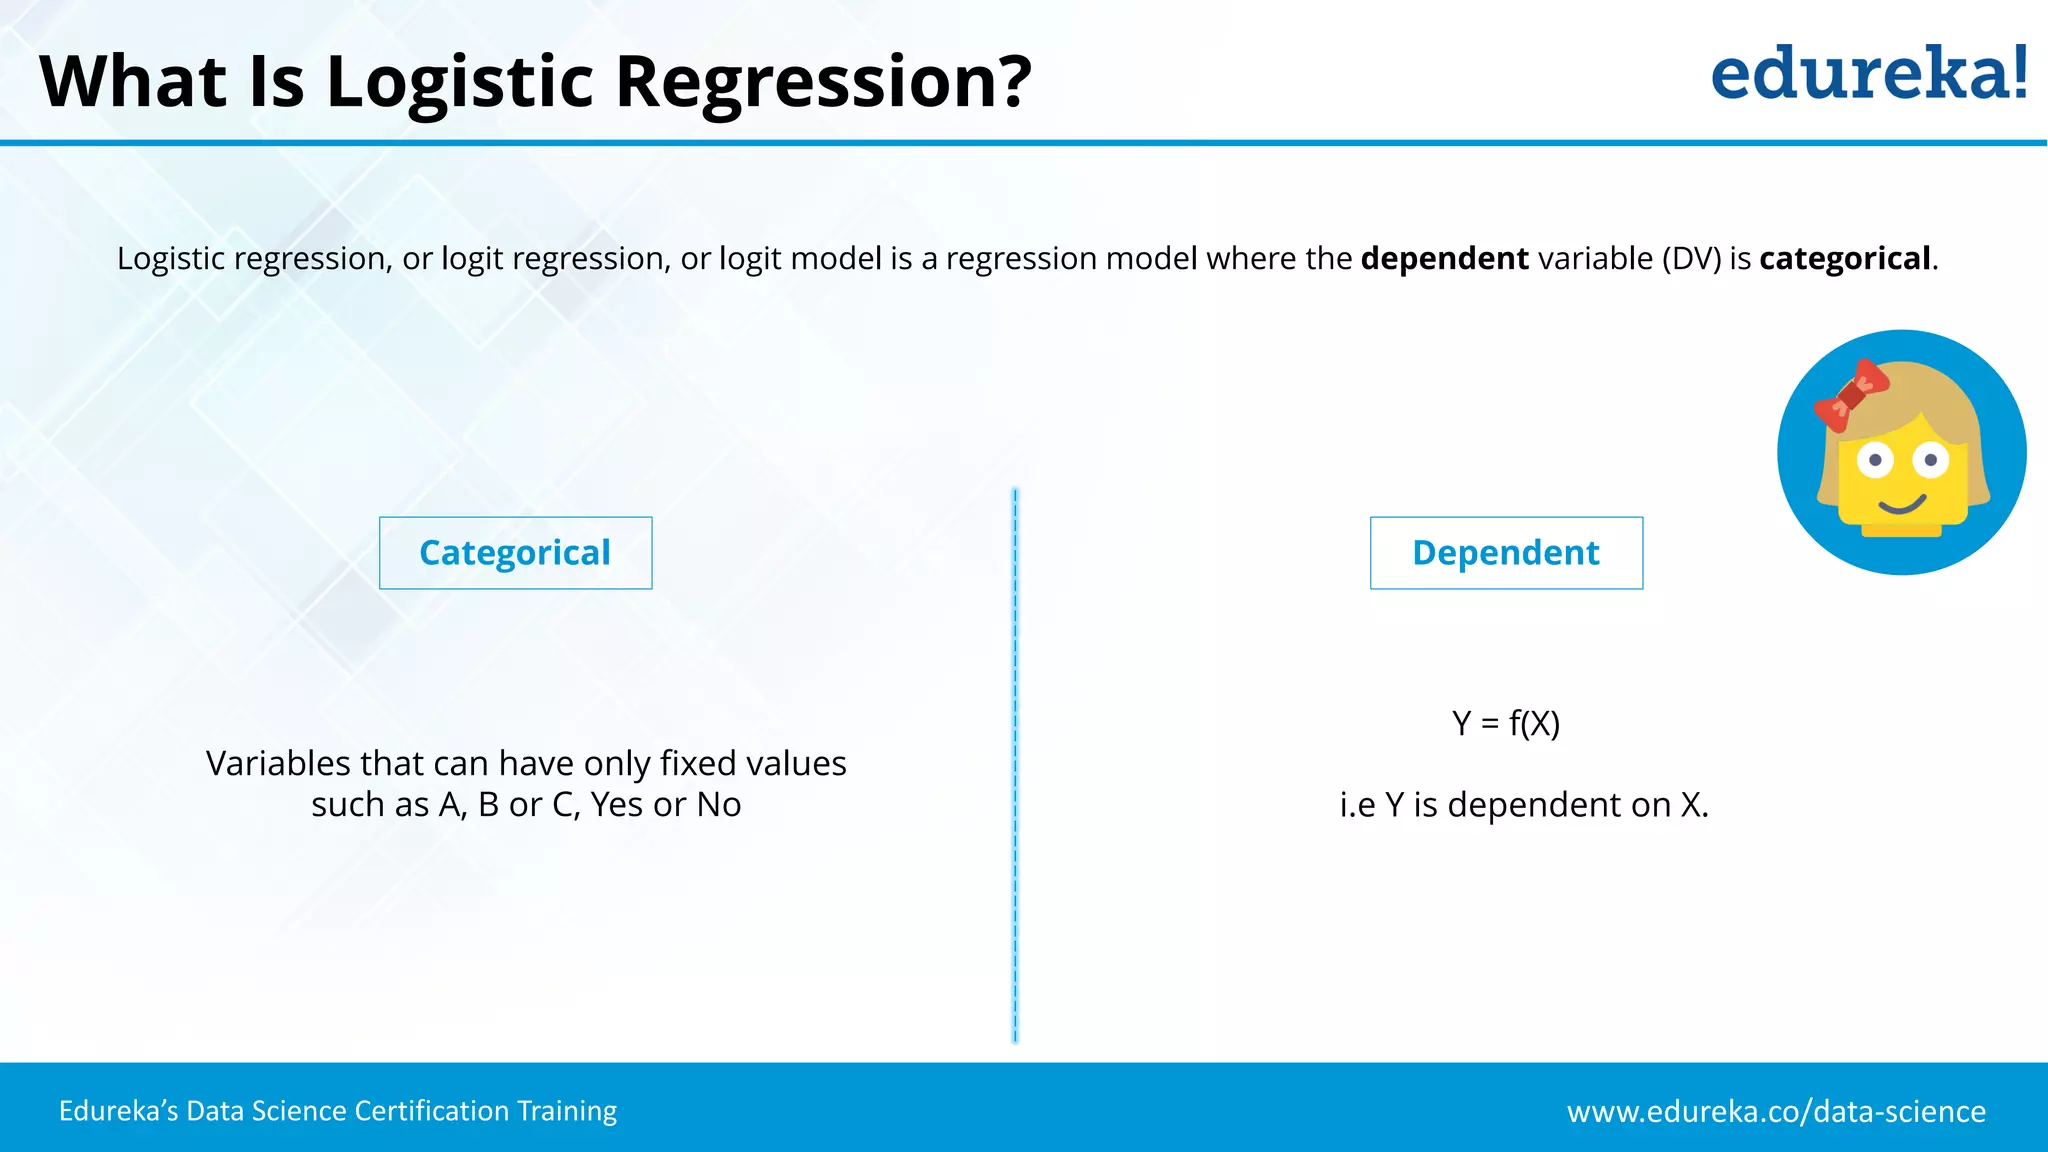
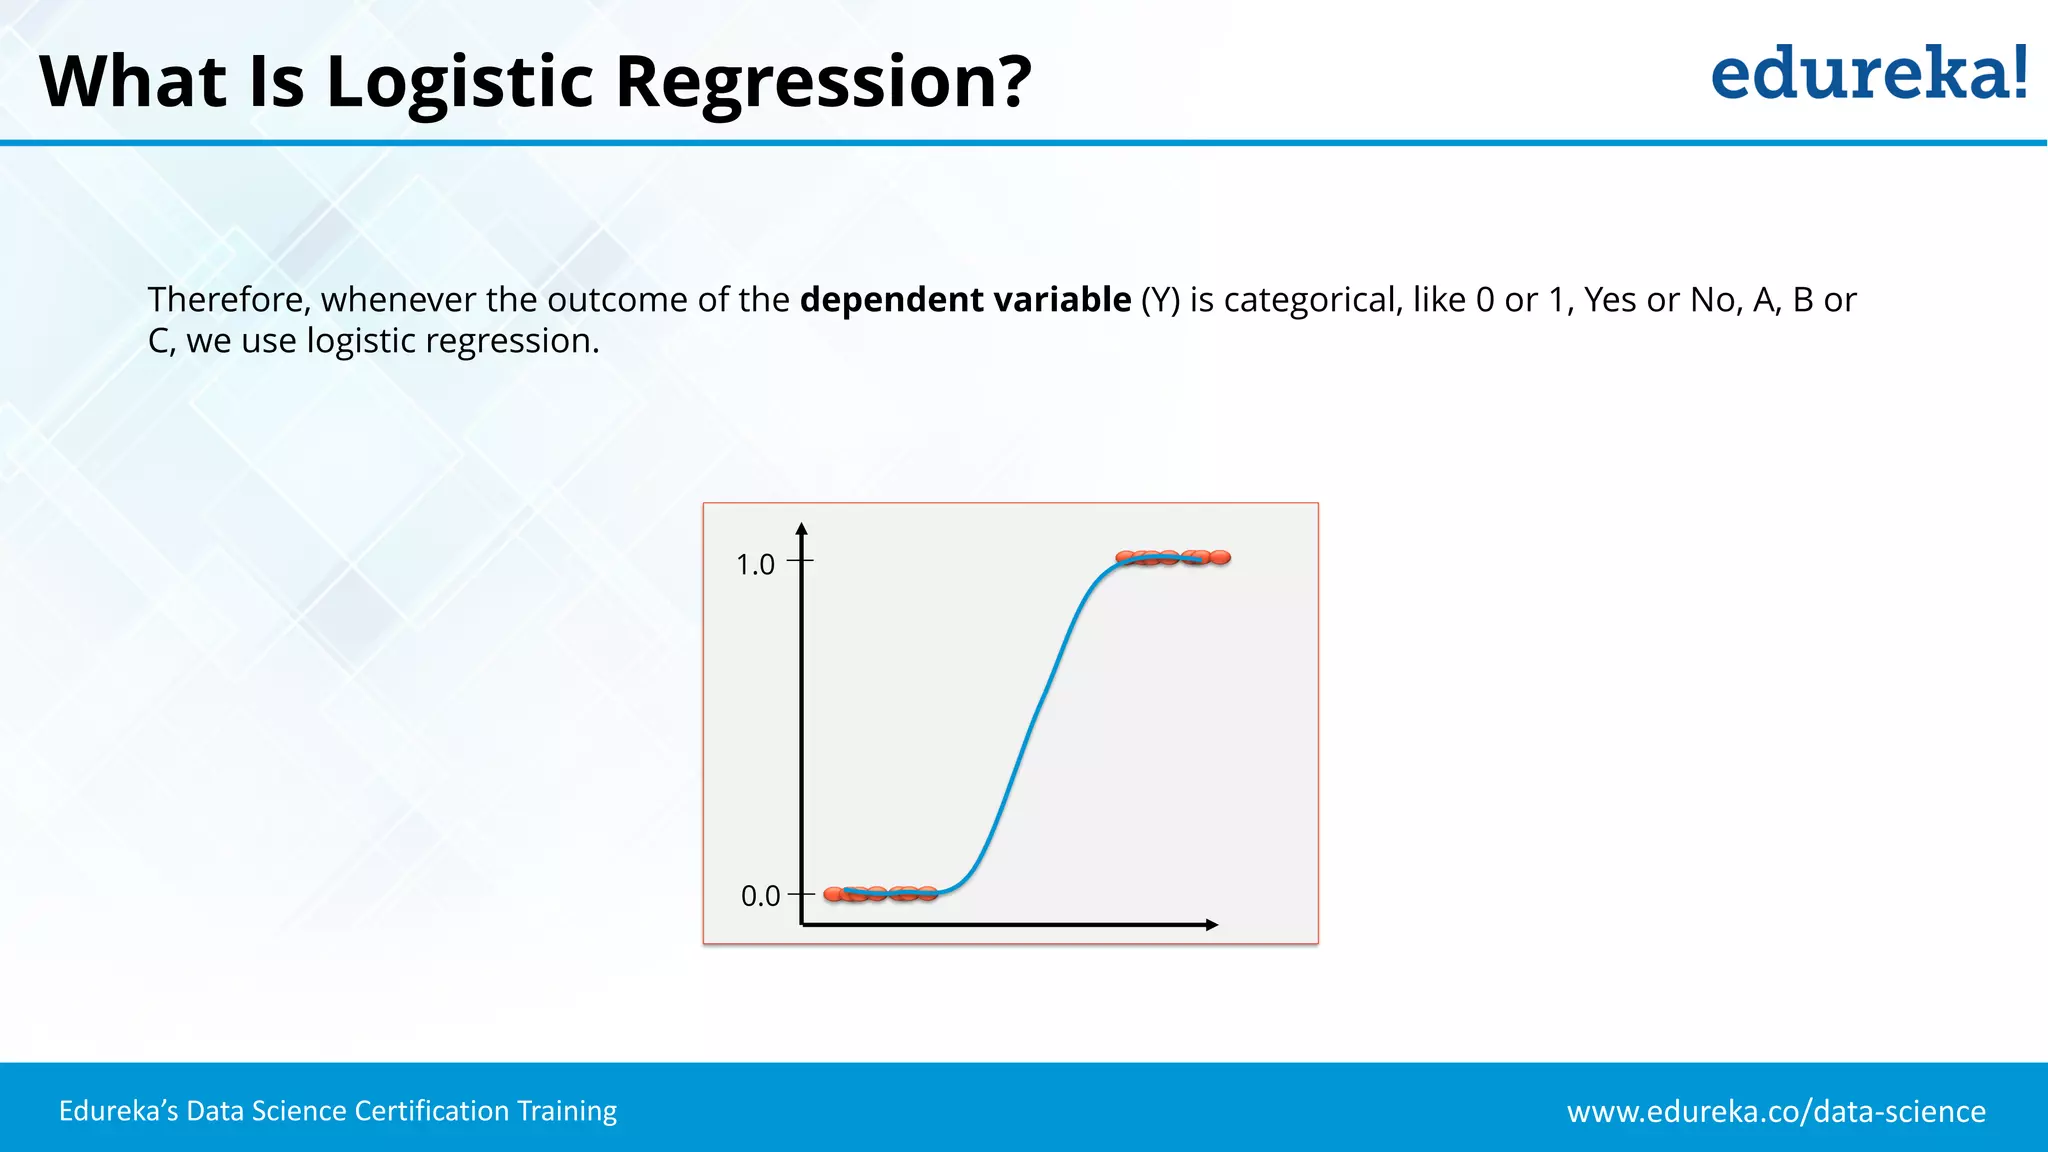
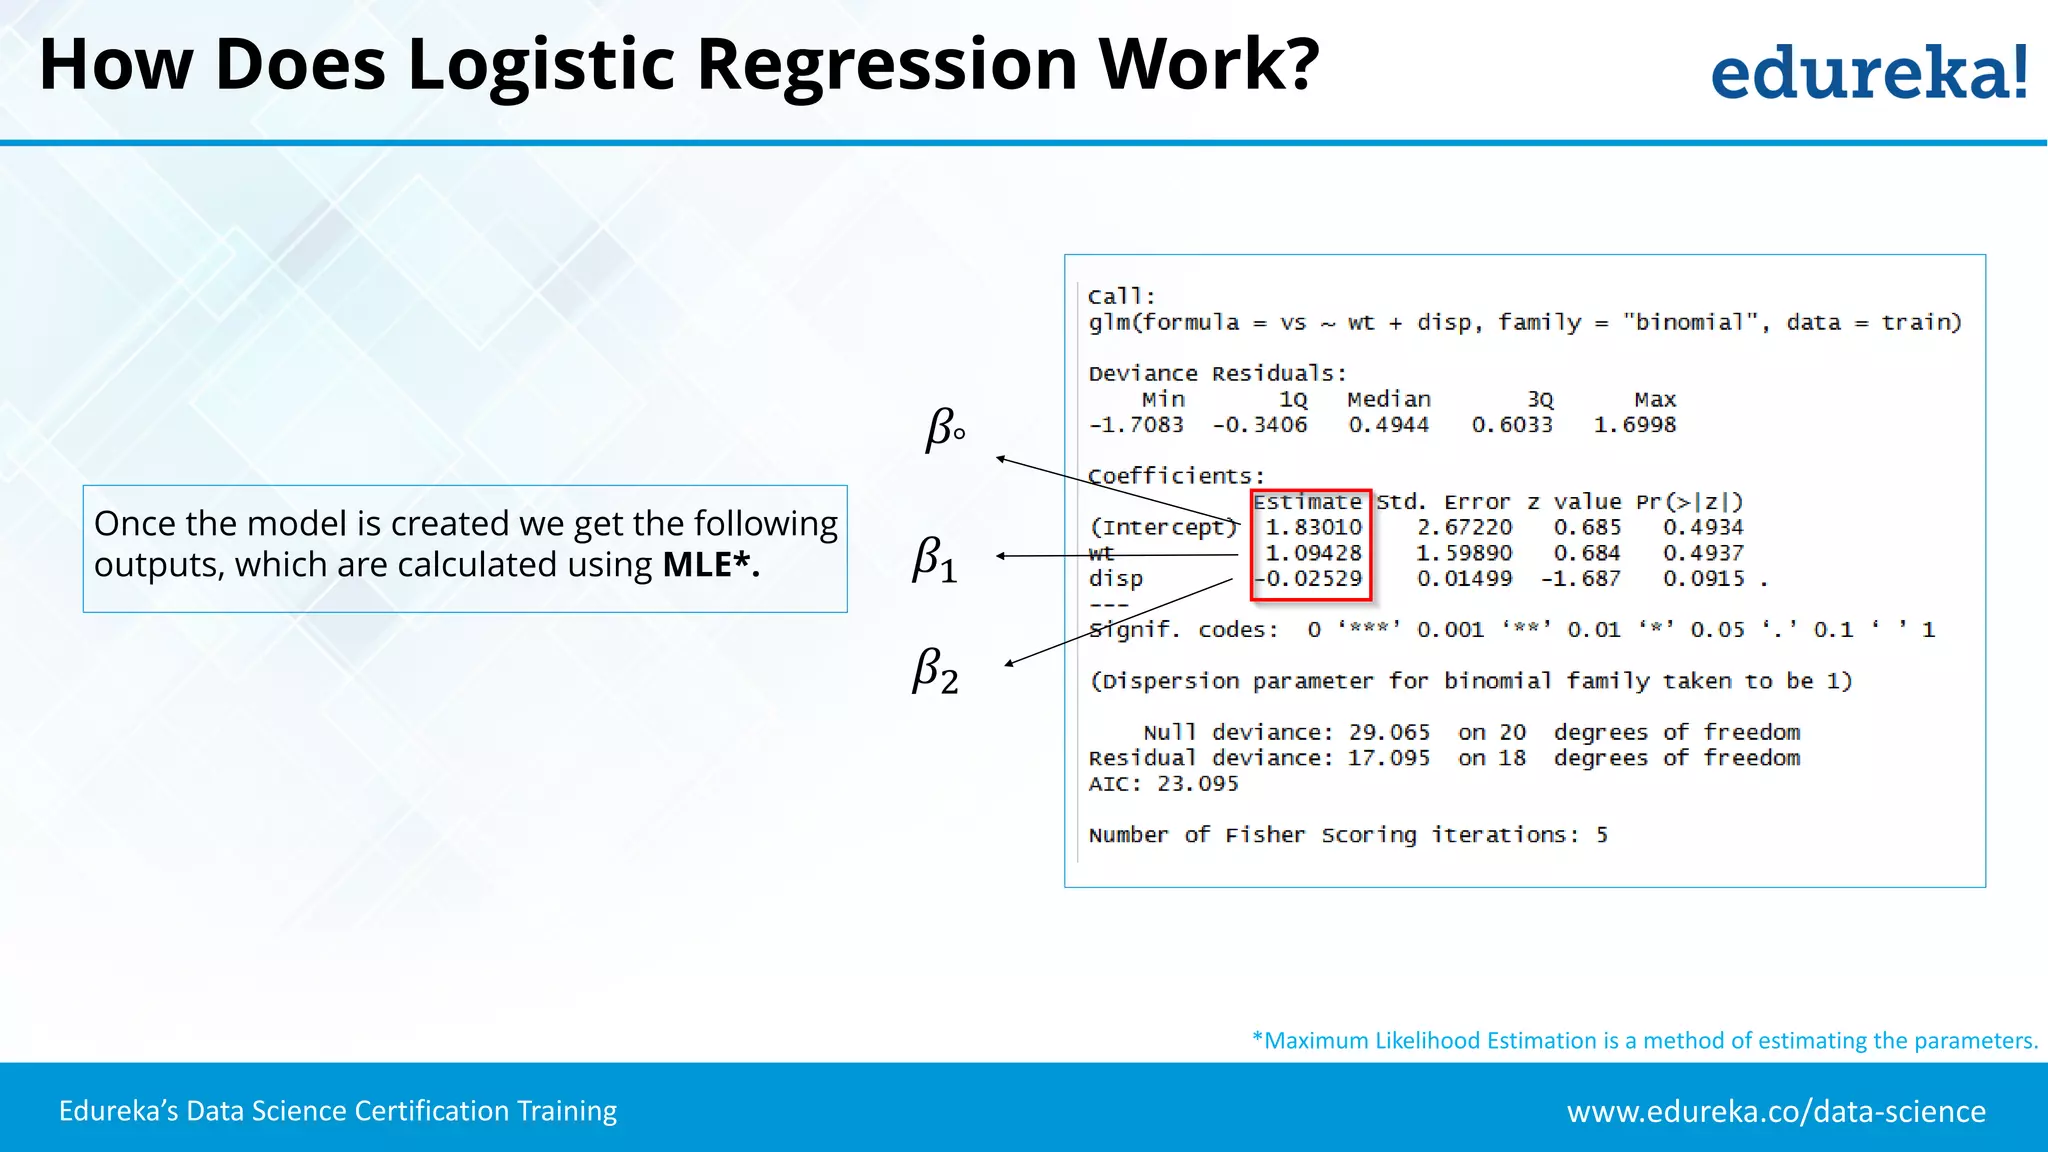
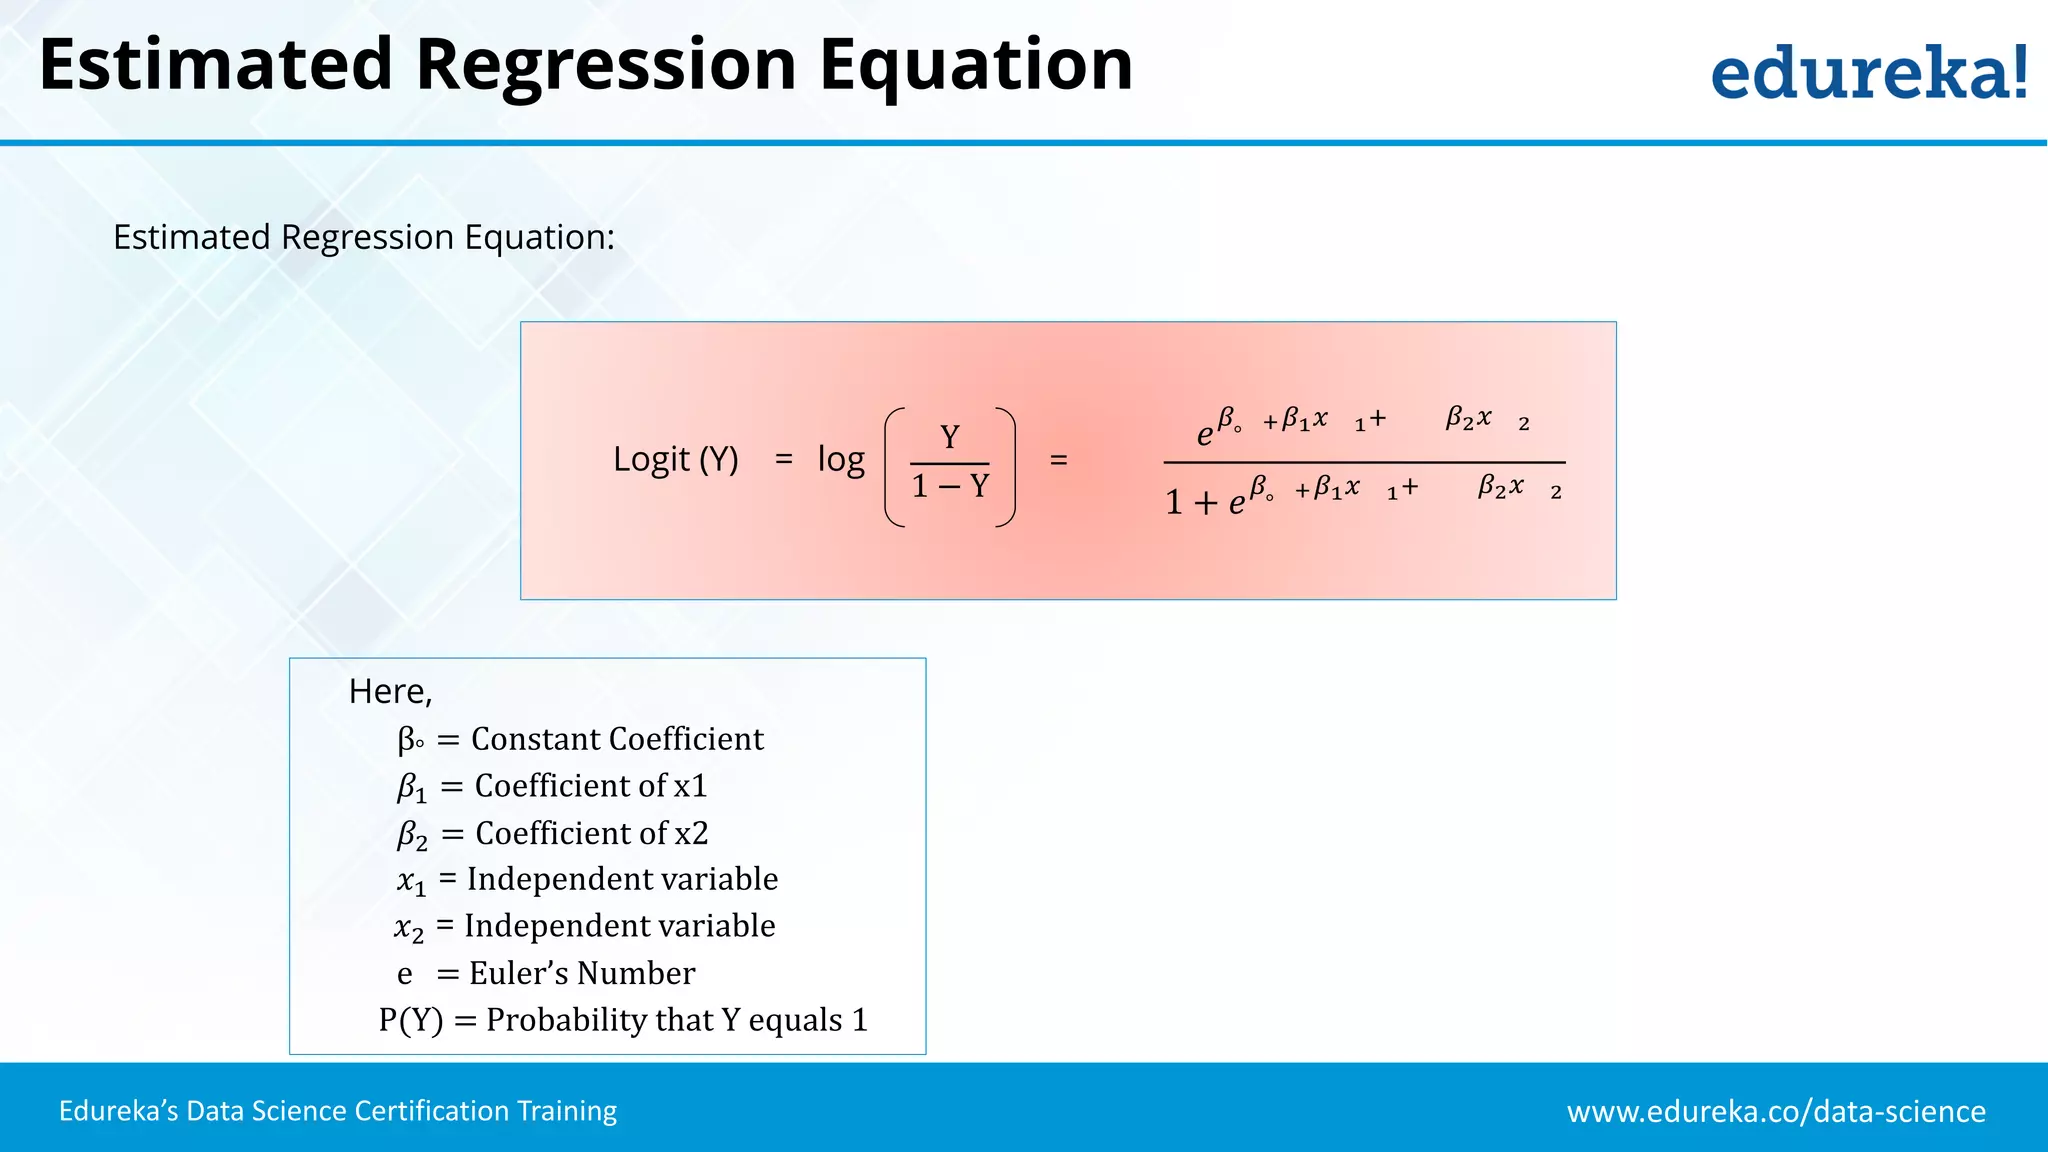
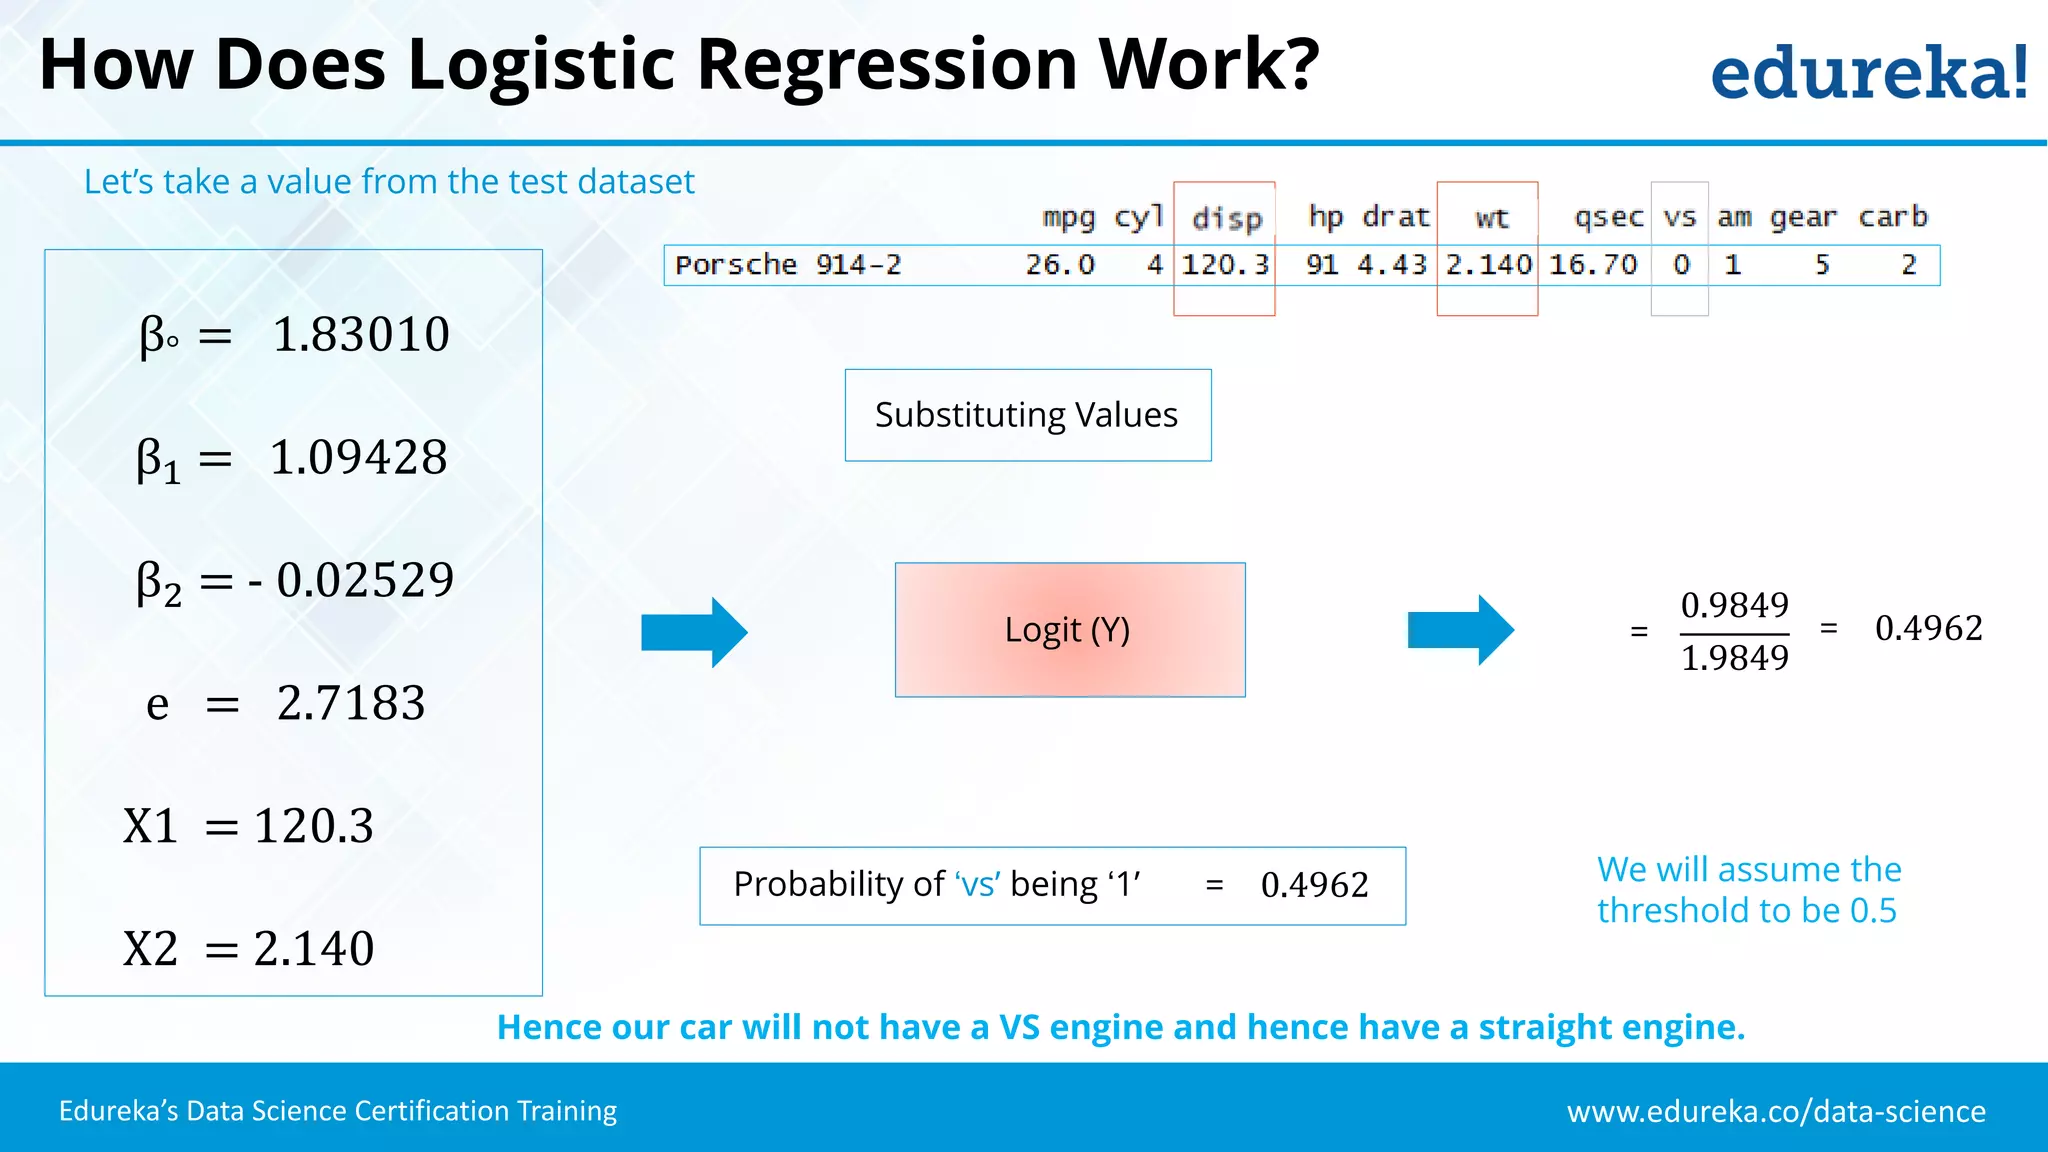
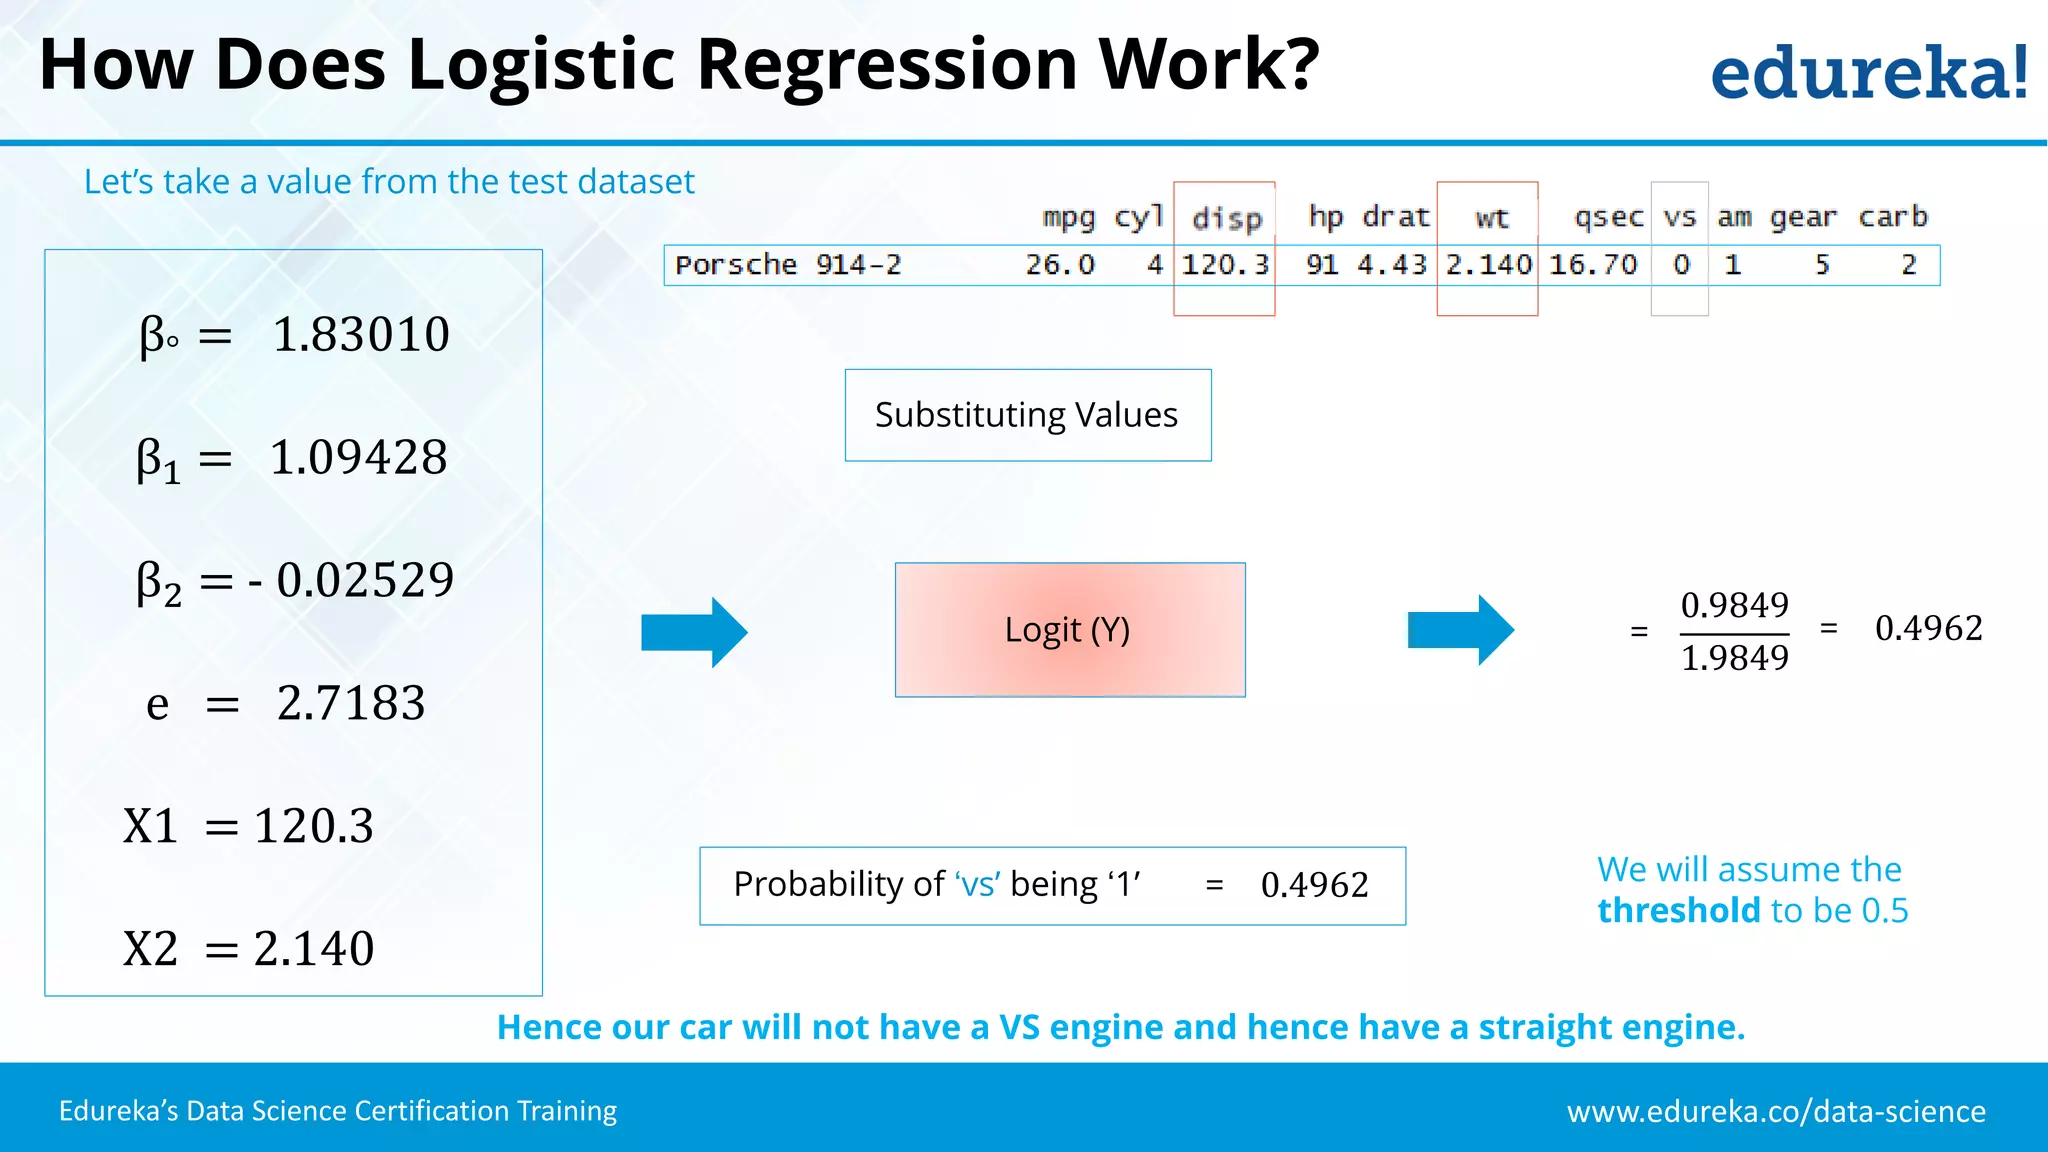
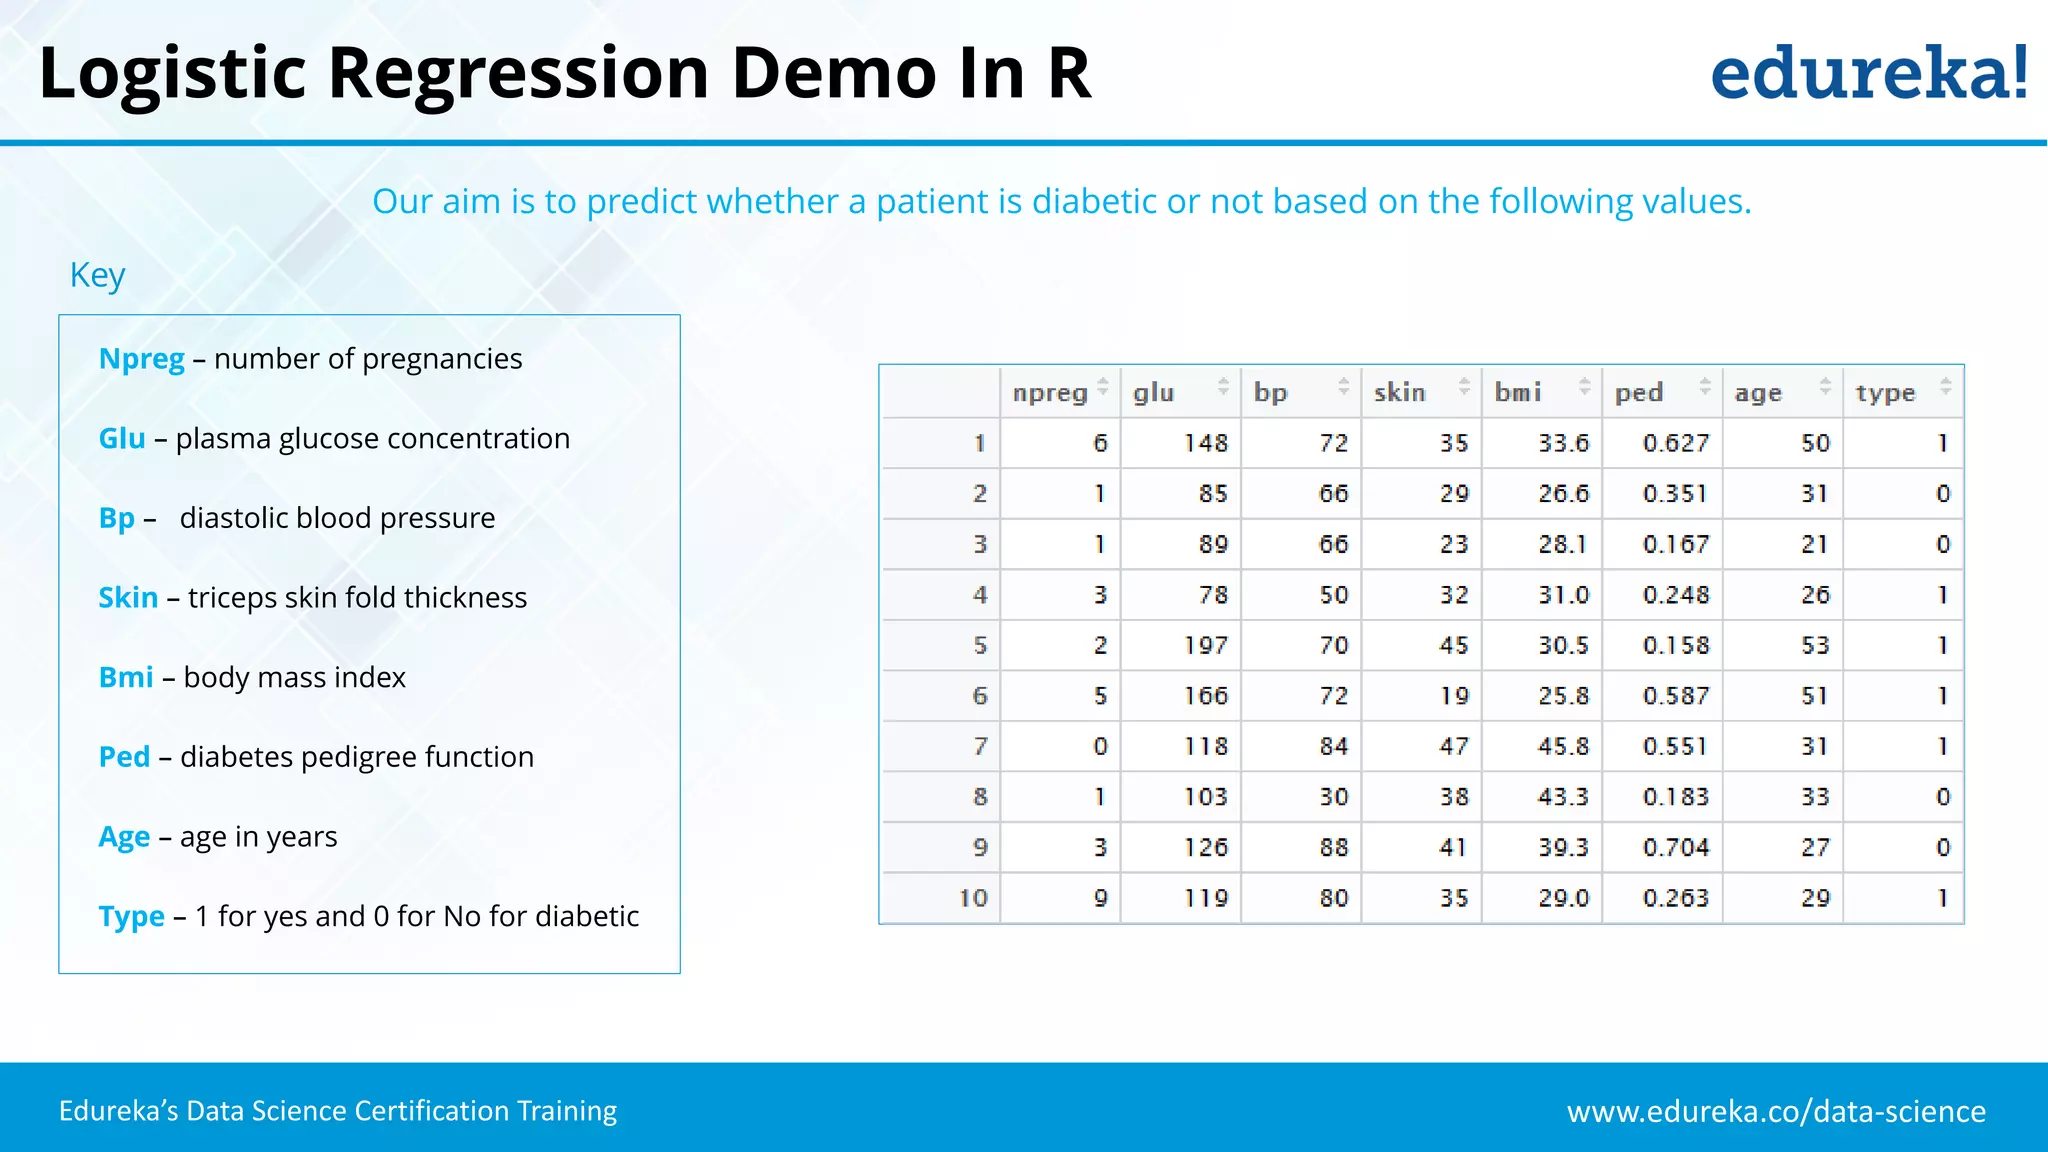
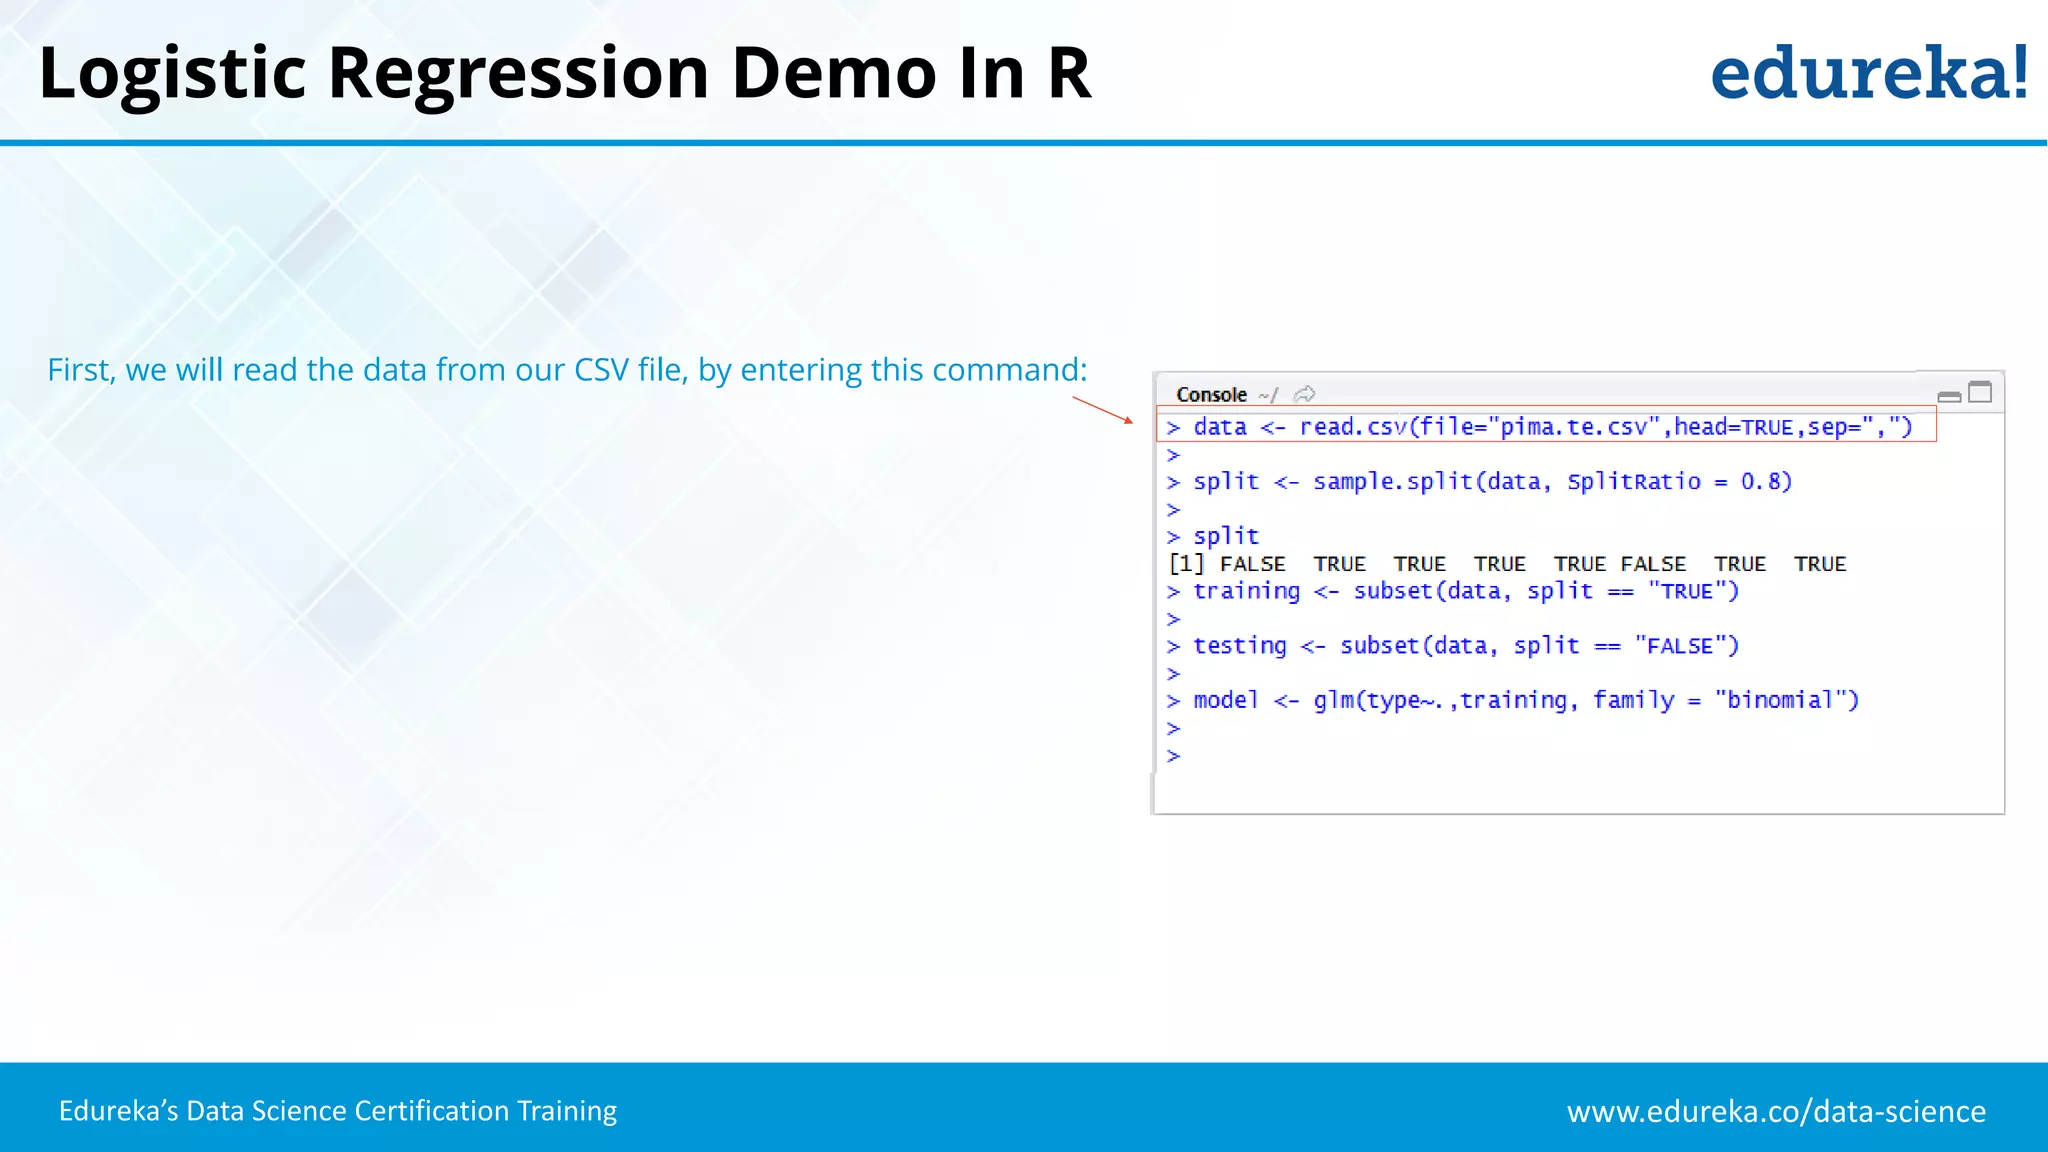
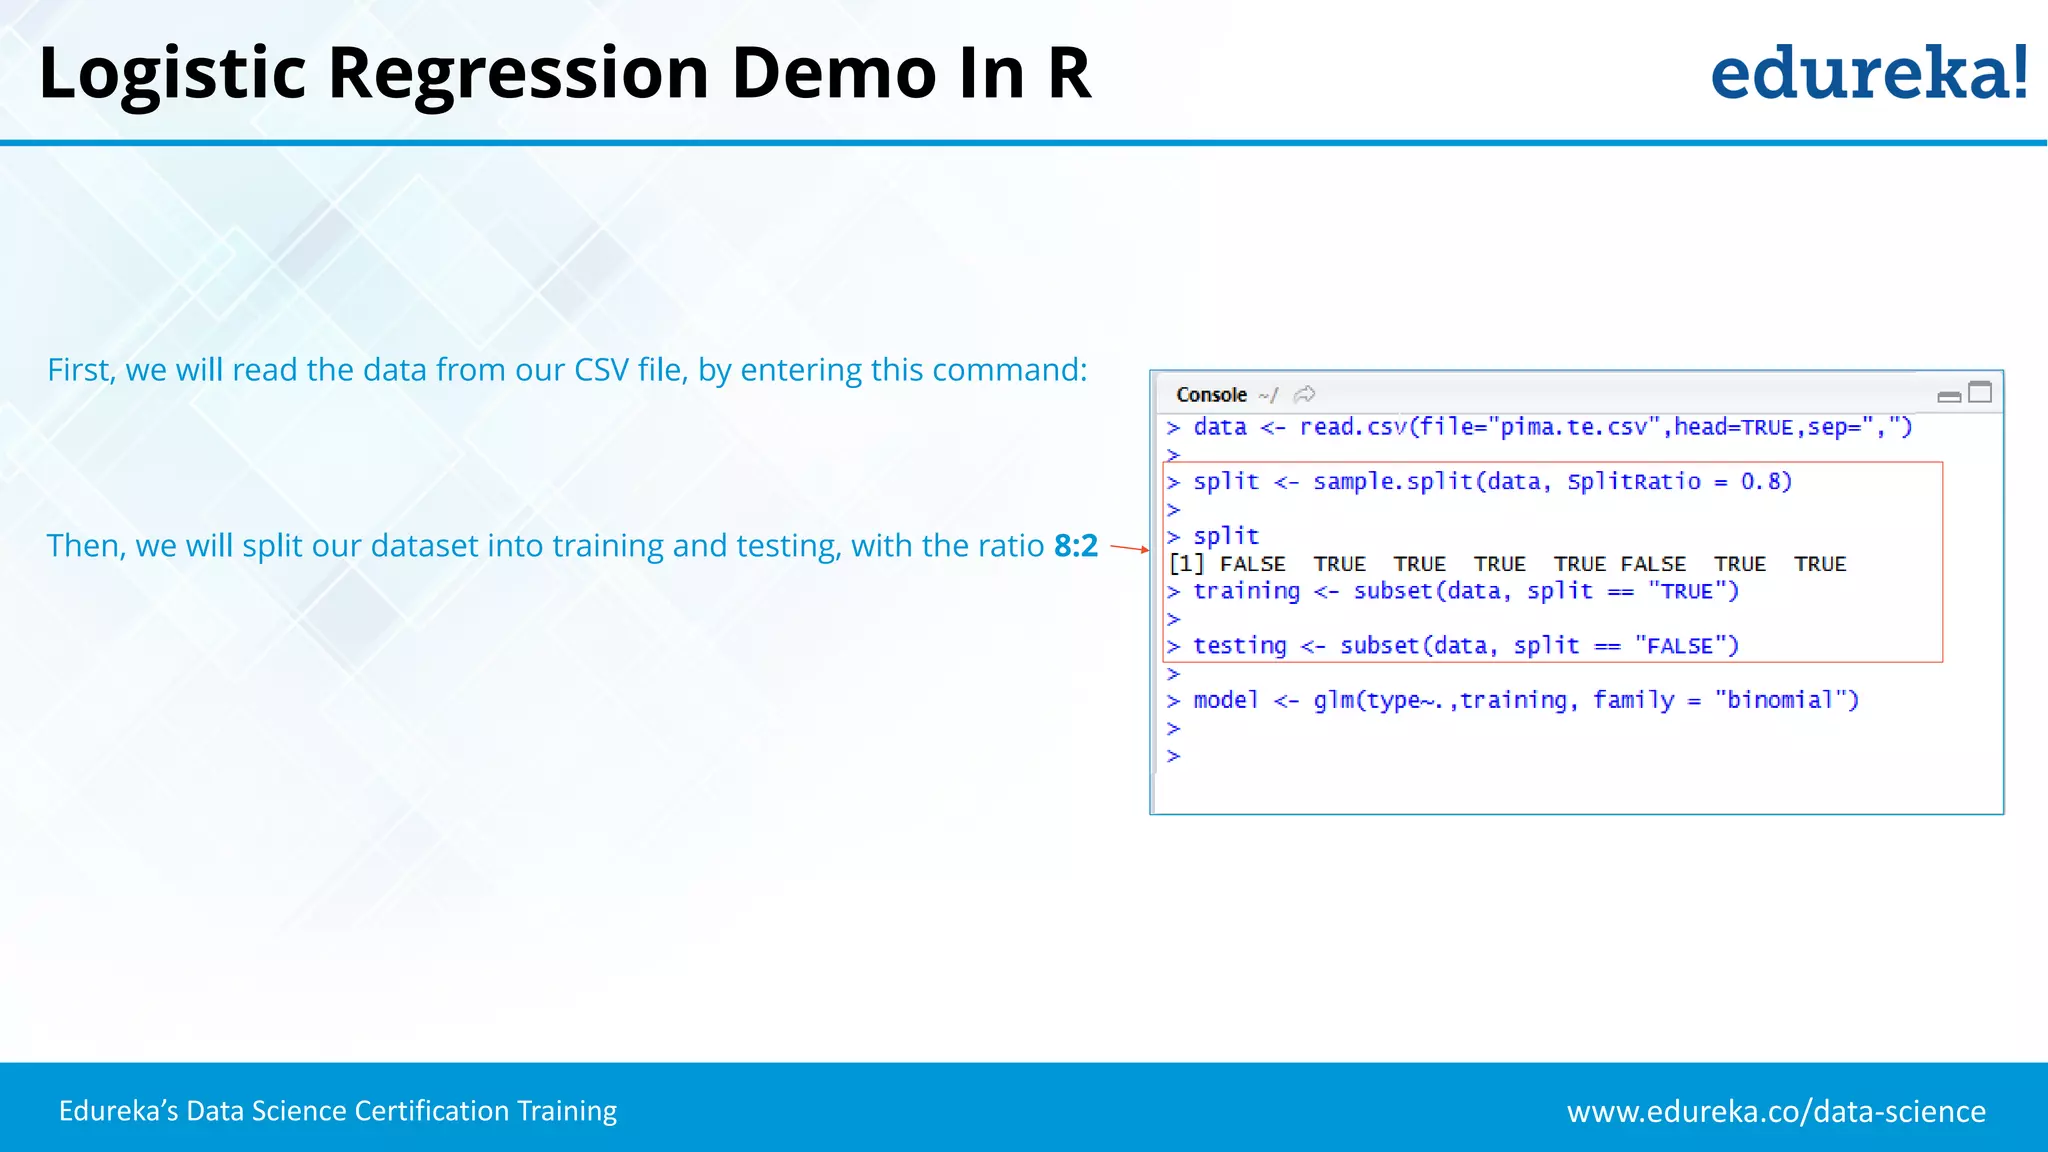
www.edureka.co/data-scienceEdureka’s Data Science Certification Training Logistic Regression
www.edureka.co/data-scienceEdureka’s Data Science Certification Training What Will You Learn Today? What is Regression? The 5 Questions asked in Data Science Logistic Regression – What and Why? How does Logistic Regression work? Demo In R: Diabetes Use Case 1 2 3 4 65 Logistic Regression – Use Cases
www.edureka.co/data-scienceEdureka’s Data Science Certification Training The 5 Questions Asked In Data Science
www.edureka.co/data-scienceEdureka’s Data Science Certification Training The 5 Questions Asked In Data Science In data science, basically we have 5 kind of problems. Classification Algorithm Anomaly Detection Algorithm Regression Algorithms Clustering Algorithms Reinforcement Learning Q1. Q2. Q4. Q3. Q5. Is this A or B? Is this weird? How much or how many? How is this organized? What should I do next?
www.edureka.co/data-scienceEdureka’s Data Science Certification Training The 5 Questions Asked In Data Science In data science, basically we have 5 kind of problems. Q1. Q2. Q4. Q3. Q5. Is this A or B? Is this weird? How is this organized? What should I do next? Classification Algorithm Anomaly Detection Algorithm Regression Algorithms Clustering Algorithms Reinforcement Learning How much or how many? Is this A or B?
www.edureka.co/data-scienceEdureka’s Data Science Certification Training What Is Regression?
www.edureka.co/data-scienceEdureka’s Data Science Certification Training What Is Regression? ➢ Regression analysis is a predictive modelling technique. ➢ It estimates the relationship between a dependent (target) and an independent variable (predictor). Input value = 7.00 Predicted outcome = 123.9 X-axis Y-axis
www.edureka.co/data-scienceEdureka’s Data Science Certification Training Types Of Regression
www.edureka.co/data-scienceEdureka’s Data Science Certification Training Types Of Regression Linear Regression • When there is a linear relationship between independent and dependent variables. • When the dependent variable is categorical (0/ 1, True/ False, Yes/ No, A/B/C) in nature. Logistic Regression Polynomial Regression • When the power of independent variable is more than 1. X Y X Y
www.edureka.co/data-scienceEdureka’s Data Science Certification Training Why Logistic Regression?
www.edureka.co/data-scienceEdureka’s Data Science Certification Training Why Logistic Regression? Whenever the outcome of the dependent variable (Y) is discrete, like 0 or 1, Yes or No, A, B or C, we use logistic regression.
www.edureka.co/data-scienceEdureka’s Data Science Certification Training Why can’t we use Linear Regression? Why Not Linear Regression? Whenever the outcome of the dependent variable (Y) is discrete, like 0 or 1, Yes or No, A, B or C, we use logistic regression.
www.edureka.co/data-scienceEdureka’s Data Science Certification Training Y-axis X-axis 0 1 Now since our value of Y will be between 0 and 1, the linear line has to be clipped at 0 and 1. Why Not Linear Regression?
www.edureka.co/data-scienceEdureka’s Data Science Certification Training Y-axis X-axis 0 1 With this, our resulting curve cannot be formulated into a single formula. We needed a new way to solve this kind of problem. Hence, we came up with Logistic Regression! Why Not Linear Regression?
www.edureka.co/data-scienceEdureka’s Data Science Certification Training 0 0.2 0.4 0.6 0.8 1 1.2 0 1 2 3 4 5 6 7 8 9 10 LOGISTIC REGRESSION The S Curve Logistic Regression Curve
www.edureka.co/data-scienceEdureka’s Data Science Certification Training Why Logistic Regression? Equation for a straight line Y = C + B1X1 + B2X2 + …. Range of Y is from – (infinity) to infinity
www.edureka.co/data-scienceEdureka’s Data Science Certification Training Why Logistic Regression? Equation for a straight line Y = C + B1X1 + B2X2 + …. Range of Y is from – (infinity) to infinity Let’s try to reduce the Logistic Regression Equation from this equation Y = C + B1X1 + B2X2 + …. In Logistic Regression Y can only be between 0 and 1.
www.edureka.co/data-scienceEdureka’s Data Science Certification Training Why Logistic Regression? Equation for a straight line Y = C + B1X1 + B2X2 + …. Range of Y is from – (infinity) to infinity Let’s try to reduce the Logistic Regression Equation from this equation Y = C + B1X1 + B2X2 + …. In Logistic Equation Y can only be between 0 and 1. Now, to get the range of Y between 0 and infinity, let’s transform Y Y 1 − Y Y=0 | 0 Y=1 | infinity Now, we have the range between 0 and infinity
www.edureka.co/data-scienceEdureka’s Data Science Certification Training Why Logistic Regression? Equation for a straight line Y = C + B1X1 + B2X2 + …. Range of Y is from – (infinity) to infinity Let’s try to reduce the Logistic Regression Equation from this equation Y = C + B1X1 + B2X2 + …. In Logistic Equation Y can only be between 0 and 1. Now, to get the range of Y between 0 and infinity, let’s transform Y Y 1 − Y Y=0 | 0 Y=1 | infinity Now, we have the range between 0 and infinity Let us transform it further, to get the range between –( infinity ) and infinity Y 1 − Y log 𝐘 𝟏 − 𝐘 log = C + B1X1 + B2X2 + ….
www.edureka.co/data-scienceEdureka’s Data Science Certification Training What Is Logistic Regression?
www.edureka.co/data-scienceEdureka’s Data Science Certification Training What Is Logistic Regression? Logistic regression, or logit regression, or logit model is a regression model where the dependent variable (DV) is categorical. DependentCategorical Variables that can have only fixed values such as A, B or C, Yes or No Y = f(X) i.e Y is dependent on X.
www.edureka.co/data-scienceEdureka’s Data Science Certification Training Therefore, whenever the outcome of the dependent variable (Y) is categorical, like 0 or 1, Yes or No, A, B or C, we use logistic regression. What Is Logistic Regression? 0.0 1.0
www.edureka.co/data-scienceEdureka’s Data Science Certification Training How Does Logistic Regression Work?
www.edureka.co/data-scienceEdureka’s Data Science Certification Training Let us take an example to understand this: MODEL Selected 147, 120, 121, 128, 110, 119, 133 Not Selected 107, 89, 92, 106, 104, 114 How does Logistic Regression Work?
www.edureka.co/data-scienceEdureka’s Data Science Certification Training How Does Logistic Regression Work? Let’s take a sample dataset in R, which is called mtcars. Our aim is to predict whether a car will have a V-engine or a Straight engine based on our inputs. Mpg - Miles/US Gallon Cyl – Number of cylinders Disp – Number of cylinders Hp – Gross horsepower Drat – Rear axle ratio Wt – Weight (lb/1000) Qsec – 1/4 mile time Vs – V Engine Am – Transmission Type Gear – Number of forward gears Carb - Number of carburetors Key
www.edureka.co/data-scienceEdureka’s Data Science Certification Training How Does Logistic Regression Work? For now, let’s take disp and wt as our primary independent variables. Why? We’ll be discussing it in our next section. Mpg - Miles/US Gallon Cyl – Number of cylinders Disp – Number of cylinders Hp – Gross horsepower Drat – Rear axle ratio Wt – Weight (lb/1000) Qsec – 1/4 mile time Vs – V Engine Am – Transmission Type Gear – Number of forward gears Carb - Number of carburetors Key
www.edureka.co/data-scienceEdureka’s Data Science Certification Training How Does Logistic Regression Work? Since our aim is to know which engine will fit, the engine will either be V – type or not, i.e either 1 or 0. Therefore, our dependent variable is Y. Mpg - Miles/US Gallon Cyl – Number of cylinders Disp – Number of cylinders Hp – Gross horsepower Drat – Rear axle ratio Wt – Weight (lb/1000) Qsec – 1/4 mile time Vs – V Engine Am – Transmission Type Gear – Number of forward gears Carb - Number of carburetors Key
www.edureka.co/data-scienceEdureka’s Data Science Certification Training How Does Logistic Regression Work? Before creating the model, we divide our dataset into training and testing. 80 % 20% Training Dataset Testing Dataset
www.edureka.co/data-scienceEdureka’s Data Science Certification Training How Does Logistic Regression Work? Training to create our model and testing to validate it. 80 % Create model from this Training Dataset
www.edureka.co/data-scienceEdureka’s Data Science Certification Training How Does Logistic Regression Work? Once the model is created we get the following outputs, which are calculated using MLE*. 𝛽° 𝛽1 𝛽2 *Maximum Likelihood Estimation is a method of estimating the parameters.
www.edureka.co/data-scienceEdureka’s Data Science Certification Training Estimated Regression Equation Estimated Regression Equation: Here, β° = Constant Coefficient 𝛽1 = Coefficient of x1 𝛽2 = Coefficient of x2 𝑥1 = Independent variable 𝑥2 = Independent variable e = Euler’s Number P(Y) = Probability that Y equals 1 𝑒 𝛽 ° + 𝛽1 𝑥 1+ 𝛽2 𝑥 2 1 + 𝑒 𝛽 ° + 𝛽1 𝑥 1+ 𝛽2 𝑥 2 Logit (Y) = Y 1 − Y log =
www.edureka.co/data-scienceEdureka’s Data Science Certification Training Substituting Values Let’s take a value from the test dataset How Does Logistic Regression Work? 0.9849 1.9849 = = 0.4962 β° = 1.83010 β1 = 1.09428 β2 = - 0.02529 e = 2.7183 X1 = 120.3 X2 = 2.140 = 0.4962Probability of ‘vs’ being ‘1’ We will assume the threshold to be 0.5 Hence our car will not have a VS engine and hence have a straight engine. Logit (Y)
www.edureka.co/data-scienceEdureka’s Data Science Certification Training Logistic Regression Demo In R
www.edureka.co/data-scienceEdureka’s Data Science Certification Training Logistic Regression Demo In R Key Npreg – number of pregnancies Glu – plasma glucose concentration Bp – diastolic blood pressure Skin – triceps skin fold thickness Bmi – body mass index Ped – diabetes pedigree function Age – age in years Type – 1 for yes and 0 for No for diabetic Our aim is to predict whether a patient is diabetic or not based on the following values.
www.edureka.co/data-scienceEdureka’s Data Science Certification Training Logistic Regression Demo In R First, we will read the data from our CSV file, by entering this command:
www.edureka.co/data-scienceEdureka’s Data Science Certification Training Logistic Regression Demo In R First, we will read the data from our CSV file, by entering this command: Then, we will split our dataset into training and testing, with the ratio 8:2
www.edureka.co/data-scienceEdureka’s Data Science Certification Training Logistic Regression Demo In R First, we will read the data from our CSV file, by entering this command: Then, we will split our dataset into training and testing, with the ratio 8:2 After that we’ll create our model using the training dataset
www.edureka.co/data-scienceEdureka’s Data Science Certification Training Logistic Regression Demo In R The summary of the model will give this.
www.edureka.co/data-scienceEdureka’s Data Science Certification Training Logistic Regression Demo In R The summary of the model will give this. *** - 99.9% confident ** - 99% confident * - 95% confident . - 90% confident
www.edureka.co/data-scienceEdureka’s Data Science Certification Training • This is the summary model that we get after improving our model. • So the insignificant fields is skin Logistic Regression Demo In R Null deviance shows how well the response variable is predicted by a model that includes only the intercept (grand mean) Residual deviance shows how well the response variable is predicted with inclusion of independent variables.
www.edureka.co/data-scienceEdureka’s Data Science Certification Training Logistic Regression Demo In R We will the predict the values for the test dataset and then categorize them according to threshold which is 0.5
www.edureka.co/data-scienceEdureka’s Data Science Certification Training Logistic Regression Demo In R We will the predict the values for the test dataset and then categorize them according to threshold which is 0.5 Create Confusion Matrix for the training dataset
www.edureka.co/data-scienceEdureka’s Data Science Certification Training Logistic Regression Demo In R We will the predict the values for the test dataset and then categorize them according to threshold which is 0.5 And then finding the accuracy Create Confusion Matrix for the training dataset
www.edureka.co/data-scienceEdureka’s Data Science Certification Training How To Find The Threshold?
www.edureka.co/data-scienceEdureka’s Data Science Certification Training Let us take a sample for our significant fields and see whether our patient is diabetic or not based on the model that we created. Store the predicted values for training dataset in ‘res’ variable Logistic Regression Demo In R
www.edureka.co/data-scienceEdureka’s Data Science Certification Training Let us take a sample for our significant fields and see whether our patient is diabetic or not based on the model that we created. Store the predicted values for training dataset in ‘res’ variable Logistic Regression Demo In R Import the library for the ROCR package
www.edureka.co/data-scienceEdureka’s Data Science Certification Training Let us take a sample for our significant fields and see whether our patient is diabetic or not based on the model that we created. Store the predicted values for training dataset in ‘res’ variable Logistic Regression Demo In R Import the library for the ROCR package Define the ‘ROCRPred’ and and ‘ROCRPerf’ variables
www.edureka.co/data-scienceEdureka’s Data Science Certification Training Let us take a sample for our significant fields and see whether our patient is diabetic or not based on the model that we created. Store the predicted values for training dataset in ‘res’ variable Logistic Regression Demo In R Import the library for the ROCR package Define the ‘ROCRPred’ and and ‘ROCRPerf’ variables Plot the graph!
www.edureka.co/data-scienceEdureka’s Data Science Certification Training Logistic Regression Demo In R
www.edureka.co/data-scienceEdureka’s Data Science Certification Training Logistic Regression Demo In R Confusion Matrix for Test Dataset with 0.5 threshold Confusion Matrix for Test Dataset with 0.3 threshold Accuracy = 73.8% TrueNegatives = 9 Accuracy = 67.8% TrueNegatives = 5
www.edureka.co/data-scienceEdureka’s Data Science Certification Training Logistic Regression Demo In R Confusion Matrix for Test Dataset with 0.5 threshold Confusion Matrix for Test Dataset with 0.3 threshold Accuracy = 73.8% TrueNegatives = 9 Accuracy = 67.8% TrueNegatives = 5 Confusion Matrix for Training Dataset with 0.3 threshold Accuracy = 79.4%
www.edureka.co/data-scienceEdureka’s Data Science Certification Training Logistic Regression: Use Cases
www.edureka.co/data-scienceEdureka’s Data Science Certification Training Logistic Regression – Use Case • Logistic Regression was used in conjugation with Geographic Information system in 2005, to predict the malaria breeding grounds in Africa. • Logistic regression was used to approximate areas where malaria patients would exist based on geographical inputs.
www.edureka.co/data-scienceEdureka’s Data Science Certification Training Logistic Regression – Use Case • Logit analysis is a statistical technique used by marketers to assess the scope of customer acceptance of a product, particularly a new product. • It attempts to determine the intensity or magnitude of customers' purchase intentions and translates that into a measure of actual buying behavior. • Many e-commerce websites assess this behavior using this model.
www.edureka.co/data-scienceEdureka’s Data Science Certification Training Session In A Minute The 5 Questions In Data Science Use CasesLogistic Regression Working? Logistic Regression – What & Why? Demo What Is Regression?
www.edureka.co/data-scienceEdureka’s Data Science Certification Training Course Details Go to www.edureka.co/data-science Get Edureka Certified in Data Science Today! What our learners have to say about us! Shravan Reddy says- “I would like to recommend any one who wants to be a Data Scientist just one place: Edureka. Explanations are clean, clear, easy to understand. Their support team works very well.. I took the Data Science course and I'm going to take Machine Learning with Mahout and then Big Data and Hadoop”. Gnana Sekhar says - “Edureka Data science course provided me a very good mixture of theoretical and practical training. LMS pre recorded sessions and assignments were very good as there is a lot of information in them that will help me in my job. Edureka is my teaching GURU now...Thanks EDUREKA.” Balu Samaga says - “It was a great experience to undergo and get certified in the Data Science course from Edureka. Quality of the training materials, assignments, project, support and other infrastructures are a top notch.”
www.edureka.co/data-scienceEdureka’s Data Science Certification Training

Logistic Regression in R | Machine Learning Algorithms | Data Science Training | Edureka

  • 1.
    www.edureka.co/data-scienceEdureka’s Data ScienceCertification Training Logistic Regression
  • 2.
    www.edureka.co/data-scienceEdureka’s Data ScienceCertification Training What Will You Learn Today? What is Regression? The 5 Questions asked in Data Science Logistic Regression – What and Why? How does Logistic Regression work? Demo In R: Diabetes Use Case 1 2 3 4 65 Logistic Regression – Use Cases
  • 3.
    www.edureka.co/data-scienceEdureka’s Data ScienceCertification Training The 5 Questions Asked In Data Science
  • 4.
    www.edureka.co/data-scienceEdureka’s Data ScienceCertification Training The 5 Questions Asked In Data Science In data science, basically we have 5 kind of problems. Classification Algorithm Anomaly Detection Algorithm Regression Algorithms Clustering Algorithms Reinforcement Learning Q1. Q2. Q4. Q3. Q5. Is this A or B? Is this weird? How much or how many? How is this organized? What should I do next?
  • 5.
    www.edureka.co/data-scienceEdureka’s Data ScienceCertification Training The 5 Questions Asked In Data Science In data science, basically we have 5 kind of problems. Q1. Q2. Q4. Q3. Q5. Is this A or B? Is this weird? How is this organized? What should I do next? Classification Algorithm Anomaly Detection Algorithm Regression Algorithms Clustering Algorithms Reinforcement Learning How much or how many? Is this A or B?
  • 6.
    www.edureka.co/data-scienceEdureka’s Data ScienceCertification Training What Is Regression?
  • 7.
    www.edureka.co/data-scienceEdureka’s Data ScienceCertification Training What Is Regression? ➢ Regression analysis is a predictive modelling technique. ➢ It estimates the relationship between a dependent (target) and an independent variable (predictor). Input value = 7.00 Predicted outcome = 123.9 X-axis Y-axis
  • 8.
    www.edureka.co/data-scienceEdureka’s Data ScienceCertification Training Types Of Regression
  • 9.
    www.edureka.co/data-scienceEdureka’s Data ScienceCertification Training Types Of Regression Linear Regression • When there is a linear relationship between independent and dependent variables. • When the dependent variable is categorical (0/ 1, True/ False, Yes/ No, A/B/C) in nature. Logistic Regression Polynomial Regression • When the power of independent variable is more than 1. X Y X Y
  • 10.
    www.edureka.co/data-scienceEdureka’s Data ScienceCertification Training Types Of Regression Linear Regression • When there is a linear relationship between independent and dependent variables. • When the dependent variable is categorical (0/ 1, True/ False, Yes/ No, A/B/C) in nature. Logistic Regression Polynomial Regression • When the power of independent variable is more than 1. X Y X Y
  • 11.
    www.edureka.co/data-scienceEdureka’s Data ScienceCertification Training Why Logistic Regression?
  • 12.
    www.edureka.co/data-scienceEdureka’s Data ScienceCertification Training Why Logistic Regression? Whenever the outcome of the dependent variable (Y) is discrete, like 0 or 1, Yes or No, A, B or C, we use logistic regression.
  • 13.
    www.edureka.co/data-scienceEdureka’s Data ScienceCertification Training Why can’t we use Linear Regression? Why Not Linear Regression? Whenever the outcome of the dependent variable (Y) is discrete, like 0 or 1, Yes or No, A, B or C, we use logistic regression.
  • 14.
    www.edureka.co/data-scienceEdureka’s Data ScienceCertification Training Y-axis X-axis 0 1 Now since our value of Y will be between 0 and 1, the linear line has to be clipped at 0 and 1. Why Not Linear Regression?
  • 15.
    www.edureka.co/data-scienceEdureka’s Data ScienceCertification Training Y-axis X-axis 0 1 With this, our resulting curve cannot be formulated into a single formula. We needed a new way to solve this kind of problem. Hence, we came up with Logistic Regression! Why Not Linear Regression?
  • 16.
    www.edureka.co/data-scienceEdureka’s Data ScienceCertification Training 0 0.2 0.4 0.6 0.8 1 1.2 0 1 2 3 4 5 6 7 8 9 10 LOGISTIC REGRESSION The S Curve Logistic Regression Curve
  • 17.
    www.edureka.co/data-scienceEdureka’s Data ScienceCertification Training Why Logistic Regression? Equation for a straight line Y = C + B1X1 + B2X2 + …. Range of Y is from – (infinity) to infinity
  • 18.
    www.edureka.co/data-scienceEdureka’s Data ScienceCertification Training Why Logistic Regression? Equation for a straight line Y = C + B1X1 + B2X2 + …. Range of Y is from – (infinity) to infinity Let’s try to reduce the Logistic Regression Equation from this equation Y = C + B1X1 + B2X2 + …. In Logistic Regression Y can only be between 0 and 1.
  • 19.
    www.edureka.co/data-scienceEdureka’s Data ScienceCertification Training Why Logistic Regression? Equation for a straight line Y = C + B1X1 + B2X2 + …. Range of Y is from – (infinity) to infinity Let’s try to reduce the Logistic Regression Equation from this equation Y = C + B1X1 + B2X2 + …. In Logistic Equation Y can only be between 0 and 1. Now, to get the range of Y between 0 and infinity, let’s transform Y Y 1 − Y Y=0 | 0 Y=1 | infinity Now, we have the range between 0 and infinity
  • 20.
    www.edureka.co/data-scienceEdureka’s Data ScienceCertification Training Why Logistic Regression? Equation for a straight line Y = C + B1X1 + B2X2 + …. Range of Y is from – (infinity) to infinity Let’s try to reduce the Logistic Regression Equation from this equation Y = C + B1X1 + B2X2 + …. In Logistic Equation Y can only be between 0 and 1. Now, to get the range of Y between 0 and infinity, let’s transform Y Y 1 − Y Y=0 | 0 Y=1 | infinity Now, we have the range between 0 and infinity Let us transform it further, to get the range between –( infinity ) and infinity Y 1 − Y log 𝐘 𝟏 − 𝐘 log = C + B1X1 + B2X2 + ….
  • 21.
    www.edureka.co/data-scienceEdureka’s Data ScienceCertification Training What Is Logistic Regression?
  • 22.
    www.edureka.co/data-scienceEdureka’s Data ScienceCertification Training What Is Logistic Regression? Logistic regression, or logit regression, or logit model is a regression model where the dependent variable (DV) is categorical. DependentCategorical Variables that can have only fixed values such as A, B or C, Yes or No Y = f(X) i.e Y is dependent on X.
  • 23.
    www.edureka.co/data-scienceEdureka’s Data ScienceCertification Training Therefore, whenever the outcome of the dependent variable (Y) is categorical, like 0 or 1, Yes or No, A, B or C, we use logistic regression. What Is Logistic Regression? 0.0 1.0
  • 24.
    www.edureka.co/data-scienceEdureka’s Data ScienceCertification Training How Does Logistic Regression Work?
  • 25.
    www.edureka.co/data-scienceEdureka’s Data ScienceCertification Training Let us take an example to understand this: MODEL Selected 147, 120, 121, 128, 110, 119, 133 Not Selected 107, 89, 92, 106, 104, 114 How does Logistic Regression Work?
  • 26.
    www.edureka.co/data-scienceEdureka’s Data ScienceCertification Training Let us take an example to understand this: MODEL Selected 147, 120, 121, 128, 110, 119, 133 Not Selected 107, 89, 92, 106, 104, 114 How does Logistic Regression Work?
  • 27.
    www.edureka.co/data-scienceEdureka’s Data ScienceCertification Training How Does Logistic Regression Work? Let’s take a sample dataset in R, which is called mtcars. Our aim is to predict whether a car will have a V-engine or a Straight engine based on our inputs. Mpg - Miles/US Gallon Cyl – Number of cylinders Disp – Number of cylinders Hp – Gross horsepower Drat – Rear axle ratio Wt – Weight (lb/1000) Qsec – 1/4 mile time Vs – V Engine Am – Transmission Type Gear – Number of forward gears Carb - Number of carburetors Key
  • 28.
    www.edureka.co/data-scienceEdureka’s Data ScienceCertification Training How Does Logistic Regression Work? For now, let’s take disp and wt as our primary independent variables. Why? We’ll be discussing it in our next section. Mpg - Miles/US Gallon Cyl – Number of cylinders Disp – Number of cylinders Hp – Gross horsepower Drat – Rear axle ratio Wt – Weight (lb/1000) Qsec – 1/4 mile time Vs – V Engine Am – Transmission Type Gear – Number of forward gears Carb - Number of carburetors Key
  • 29.
    www.edureka.co/data-scienceEdureka’s Data ScienceCertification Training How Does Logistic Regression Work? Since our aim is to know which engine will fit, the engine will either be V – type or not, i.e either 1 or 0. Therefore, our dependent variable is Y. Mpg - Miles/US Gallon Cyl – Number of cylinders Disp – Number of cylinders Hp – Gross horsepower Drat – Rear axle ratio Wt – Weight (lb/1000) Qsec – 1/4 mile time Vs – V Engine Am – Transmission Type Gear – Number of forward gears Carb - Number of carburetors Key
  • 30.
    www.edureka.co/data-scienceEdureka’s Data ScienceCertification Training How Does Logistic Regression Work? Before creating the model, we divide our dataset into training and testing. 80 % 20% Training Dataset Testing Dataset
  • 31.
    www.edureka.co/data-scienceEdureka’s Data ScienceCertification Training How Does Logistic Regression Work? Training to create our model and testing to validate it. 80 % Create model from this Training Dataset
  • 32.
    www.edureka.co/data-scienceEdureka’s Data ScienceCertification Training How Does Logistic Regression Work? Once the model is created we get the following outputs, which are calculated using MLE*. 𝛽° 𝛽1 𝛽2 *Maximum Likelihood Estimation is a method of estimating the parameters.
  • 33.
    www.edureka.co/data-scienceEdureka’s Data ScienceCertification Training Estimated Regression Equation Estimated Regression Equation: Here, β° = Constant Coefficient 𝛽1 = Coefficient of x1 𝛽2 = Coefficient of x2 𝑥1 = Independent variable 𝑥2 = Independent variable e = Euler’s Number P(Y) = Probability that Y equals 1 𝑒 𝛽 ° + 𝛽1 𝑥 1+ 𝛽2 𝑥 2 1 + 𝑒 𝛽 ° + 𝛽1 𝑥 1+ 𝛽2 𝑥 2 Logit (Y) = Y 1 − Y log =
  • 34.
    www.edureka.co/data-scienceEdureka’s Data ScienceCertification Training Substituting Values Let’s take a value from the test dataset How Does Logistic Regression Work? 0.9849 1.9849 = = 0.4962 β° = 1.83010 β1 = 1.09428 β2 = - 0.02529 e = 2.7183 X1 = 120.3 X2 = 2.140 = 0.4962Probability of ‘vs’ being ‘1’ We will assume the threshold to be 0.5 Hence our car will not have a VS engine and hence have a straight engine. Logit (Y)
  • 35.
    www.edureka.co/data-scienceEdureka’s Data ScienceCertification Training Substituting Values Let’s take a value from the test dataset How Does Logistic Regression Work? 0.9849 1.9849 = = 0.4962 β° = 1.83010 β1 = 1.09428 β2 = - 0.02529 e = 2.7183 X1 = 120.3 X2 = 2.140 = 0.4962Probability of ‘vs’ being ‘1’ We will assume the threshold to be 0.5 Hence our car will not have a VS engine and hence have a straight engine. Logit (Y)
  • 36.
    www.edureka.co/data-scienceEdureka’s Data ScienceCertification Training Logistic Regression Demo In R
  • 37.
    www.edureka.co/data-scienceEdureka’s Data ScienceCertification Training Logistic Regression Demo In R Key Npreg – number of pregnancies Glu – plasma glucose concentration Bp – diastolic blood pressure Skin – triceps skin fold thickness Bmi – body mass index Ped – diabetes pedigree function Age – age in years Type – 1 for yes and 0 for No for diabetic Our aim is to predict whether a patient is diabetic or not based on the following values.
  • 38.
    www.edureka.co/data-scienceEdureka’s Data ScienceCertification Training Logistic Regression Demo In R First, we will read the data from our CSV file, by entering this command:
  • 39.
    www.edureka.co/data-scienceEdureka’s Data ScienceCertification Training Logistic Regression Demo In R First, we will read the data from our CSV file, by entering this command: Then, we will split our dataset into training and testing, with the ratio 8:2
  • 40.
    www.edureka.co/data-scienceEdureka’s Data ScienceCertification Training Logistic Regression Demo In R First, we will read the data from our CSV file, by entering this command: Then, we will split our dataset into training and testing, with the ratio 8:2 After that we’ll create our model using the training dataset
  • 41.
    www.edureka.co/data-scienceEdureka’s Data ScienceCertification Training Logistic Regression Demo In R The summary of the model will give this.
  • 42.
    www.edureka.co/data-scienceEdureka’s Data ScienceCertification Training Logistic Regression Demo In R The summary of the model will give this. *** - 99.9% confident ** - 99% confident * - 95% confident . - 90% confident
  • 43.
    www.edureka.co/data-scienceEdureka’s Data ScienceCertification Training • This is the summary model that we get after improving our model. • So the insignificant fields is skin Logistic Regression Demo In R Null deviance shows how well the response variable is predicted by a model that includes only the intercept (grand mean) Residual deviance shows how well the response variable is predicted with inclusion of independent variables.
  • 44.
    www.edureka.co/data-scienceEdureka’s Data ScienceCertification Training Logistic Regression Demo In R We will the predict the values for the test dataset and then categorize them according to threshold which is 0.5
  • 45.
    www.edureka.co/data-scienceEdureka’s Data ScienceCertification Training Logistic Regression Demo In R We will the predict the values for the test dataset and then categorize them according to threshold which is 0.5 Create Confusion Matrix for the training dataset
  • 46.
    www.edureka.co/data-scienceEdureka’s Data ScienceCertification Training Logistic Regression Demo In R We will the predict the values for the test dataset and then categorize them according to threshold which is 0.5 And then finding the accuracy Create Confusion Matrix for the training dataset
  • 47.
    www.edureka.co/data-scienceEdureka’s Data ScienceCertification Training How To Find The Threshold?
  • 48.
    www.edureka.co/data-scienceEdureka’s Data ScienceCertification Training Let us take a sample for our significant fields and see whether our patient is diabetic or not based on the model that we created. Store the predicted values for training dataset in ‘res’ variable Logistic Regression Demo In R
  • 49.
    www.edureka.co/data-scienceEdureka’s Data ScienceCertification Training Let us take a sample for our significant fields and see whether our patient is diabetic or not based on the model that we created. Store the predicted values for training dataset in ‘res’ variable Logistic Regression Demo In R Import the library for the ROCR package
  • 50.
    www.edureka.co/data-scienceEdureka’s Data ScienceCertification Training Let us take a sample for our significant fields and see whether our patient is diabetic or not based on the model that we created. Store the predicted values for training dataset in ‘res’ variable Logistic Regression Demo In R Import the library for the ROCR package Define the ‘ROCRPred’ and and ‘ROCRPerf’ variables
  • 51.
    www.edureka.co/data-scienceEdureka’s Data ScienceCertification Training Let us take a sample for our significant fields and see whether our patient is diabetic or not based on the model that we created. Store the predicted values for training dataset in ‘res’ variable Logistic Regression Demo In R Import the library for the ROCR package Define the ‘ROCRPred’ and and ‘ROCRPerf’ variables Plot the graph!
  • 52.
    www.edureka.co/data-scienceEdureka’s Data ScienceCertification Training Logistic Regression Demo In R
  • 53.
    www.edureka.co/data-scienceEdureka’s Data ScienceCertification Training Logistic Regression Demo In R Confusion Matrix for Test Dataset with 0.5 threshold Confusion Matrix for Test Dataset with 0.3 threshold Accuracy = 73.8% TrueNegatives = 9 Accuracy = 67.8% TrueNegatives = 5
  • 54.
    www.edureka.co/data-scienceEdureka’s Data ScienceCertification Training Logistic Regression Demo In R Confusion Matrix for Test Dataset with 0.5 threshold Confusion Matrix for Test Dataset with 0.3 threshold Accuracy = 73.8% TrueNegatives = 9 Accuracy = 67.8% TrueNegatives = 5 Confusion Matrix for Training Dataset with 0.3 threshold Accuracy = 79.4%
  • 55.
    www.edureka.co/data-scienceEdureka’s Data ScienceCertification Training Logistic Regression: Use Cases
  • 56.
    www.edureka.co/data-scienceEdureka’s Data ScienceCertification Training Logistic Regression – Use Case • Logistic Regression was used in conjugation with Geographic Information system in 2005, to predict the malaria breeding grounds in Africa. • Logistic regression was used to approximate areas where malaria patients would exist based on geographical inputs.
  • 57.
    www.edureka.co/data-scienceEdureka’s Data ScienceCertification Training Logistic Regression – Use Case • Logit analysis is a statistical technique used by marketers to assess the scope of customer acceptance of a product, particularly a new product. • It attempts to determine the intensity or magnitude of customers' purchase intentions and translates that into a measure of actual buying behavior. • Many e-commerce websites assess this behavior using this model.
  • 58.
    www.edureka.co/data-scienceEdureka’s Data ScienceCertification Training Session In A Minute The 5 Questions In Data Science Use CasesLogistic Regression Working? Logistic Regression – What & Why? Demo What Is Regression?
  • 59.
    www.edureka.co/data-scienceEdureka’s Data ScienceCertification Training Course Details Go to www.edureka.co/data-science Get Edureka Certified in Data Science Today! What our learners have to say about us! Shravan Reddy says- “I would like to recommend any one who wants to be a Data Scientist just one place: Edureka. Explanations are clean, clear, easy to understand. Their support team works very well.. I took the Data Science course and I'm going to take Machine Learning with Mahout and then Big Data and Hadoop”. Gnana Sekhar says - “Edureka Data science course provided me a very good mixture of theoretical and practical training. LMS pre recorded sessions and assignments were very good as there is a lot of information in them that will help me in my job. Edureka is my teaching GURU now...Thanks EDUREKA.” Balu Samaga says - “It was a great experience to undergo and get certified in the Data Science course from Edureka. Quality of the training materials, assignments, project, support and other infrastructures are a top notch.”
  • 60.