Graphics 1 Graphics & Graphical Programming Lecture 2 - Graphics Fundamentals
Graphics 2 Fundamentals Outline • Historical perspective • Model of a Computer - Memory & Graphics • Devices • Raster Model & Bitmaps • Coordinates • Drawing Spaces • Colours • Graphics Libraries
Graphics 3 Brief History • Teletypes(pre 1950s), Display Tubes(post WW2), CRTs(last half of 20th century), Flat Panels (modern era) • Size and Quality (eg resolution) driven by economics (eg 640x320…1024x768…) • Vector (circa WW2) & Raster/Bitmap models • Devices & Human / Machine Interaction • Memory and Processing Speed limitations
Graphics 4 Computer Memory Model • Main Memory • Graphics memory – Used to be limited to separate amount on eg graphics card – Modern idea is to partition main memory dynamically (ie by software instruction) • Modern idea is to map memory to the display • Independent of display hardware type • CPU + Cache memory + Main memory • Cache memory is fast but expensive so (still often) only have small amount eg 512kBytes available • Main memory relatively plentiful (eg GBytes) but slow
Graphics 5 Memory & Graphics • Idea is that we can write programs that interact with the graphical display device simply by writing to a predetermined area of the computer’s memory • Known as Bitmap graphics • The bits are mapped to the pixels • Flexible, portable software • Independent of Hardware & Operating System
Graphics 6 Graphical Devices • Devices eg mouse, stereo glasses, tracker ball, light pen, touch screen, 3d-wand, “rat”, sensor gloves, head tracker, iris tracker,… • Even Mouse varies in form factor and number of buttons • Mouse - most well known device • Buttons, and scan movements • Jargon ideas that have become common: – Drag – Click – Double-Click – Left -Click • Main idea is to let you specify a location in a space eg x,y (or x,y,z) coordinates
Graphics 7 Raster Model - Pixels • Pixel or sometimes “pel” Picture Element • Each pixel is a sample that can be rendered as a dot or rectangle on the screen • Often try to design them as squares but not always • Might be implemented as small area of phosphor on a monochrome monitor • Or three areas of eg red, green and blue phosphors for colour • Or simple a transistor logic gate assembly on a flat panel display
Graphics 8 Coordinate Systems • Pixel Coordinate System - rows and columns • Rectilinear • Usually for graphics, we start at top left corner and work our way across and down • Same as raster orientation • Array[row][column] • Row major used in C and C+ ( last index moves fastest in memory) • Not all languages do it this way - eg Fortran uses column major (first index moves fastest)
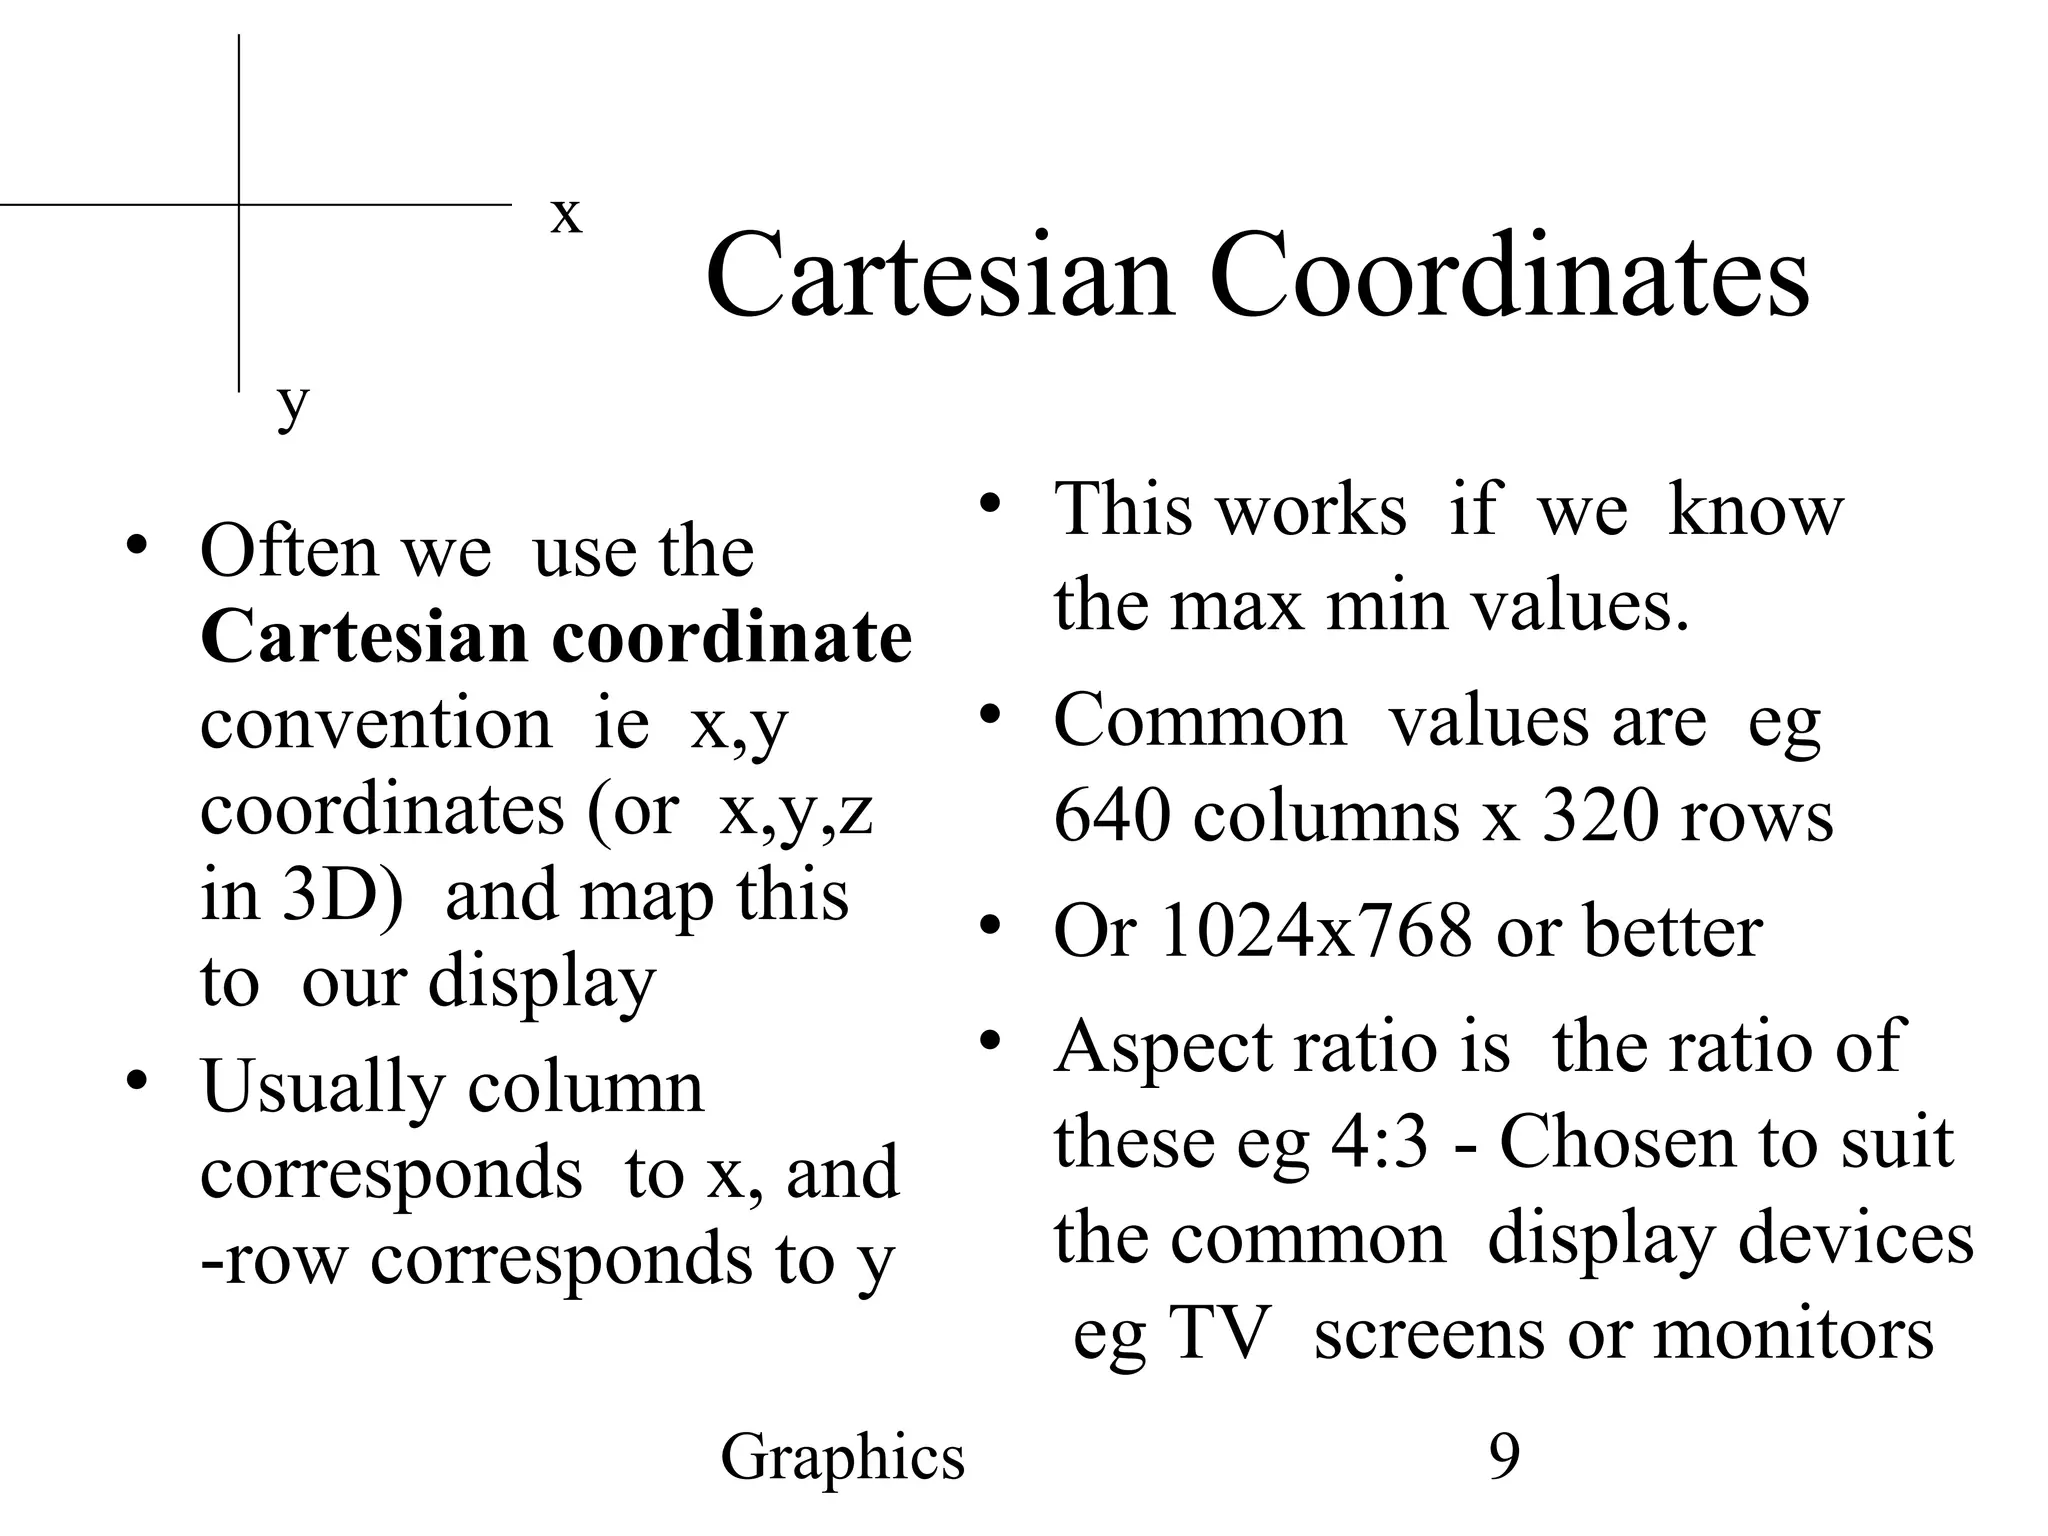
Graphics 9 Cartesian Coordinates • Often we use the Cartesian coordinate convention ie x,y coordinates (or x,y,z in 3D) and map this to our display • Usually column corresponds to x, and -row corresponds to y • This works if we know the max min values. • Common values are eg 640 columns x 320 rows • Or 1024x768 or better • Aspect ratio is the ratio of these eg 4:3 - Chosen to suit the common display devices eg TV screens or monitors x y
Graphics 10 Drawing Space or Canvas • Coordinate Systems • Drawing Primitives • Library of utilities – eg drawDot( int x, int y); – Or drawLine( x1, y1, x2, y2 ); • Usually we have “Primitive” Models for coordinate spaces and colours • We do not want to write our application programs worrying about pixel resolutions • We may have libraries that allow us to do so, but often they will support more general coordinates • Eg real space “normalised” coordinates [0.0,1.0]
Graphics 11 Colours in Brief • Red Green Blue is not the Only colour model although still most common • We specify separate RGB values for each pixel • They map to intensities • All colours can be expressed as combination of these • Sometimes also an “alpha” or transparency value • These will conveniently pack into a computer word of 4 bytes, one byte for each entity • 1 Byte gives us 256 values - hence numbers of colours • Need not use this resolution • Can also use Look-up tables to save memory
Graphics 12 Graphics Libraries and packages • What is a graphics system? • A package or Library that links to a Language or environment and lets us write programs that are independent of the graphics hardware and devices • Java Development Kit and Java 2D and Java 3D libraries • GL and OpenGL (Graphics Library), VOGL • X11, DirectX, PHIGS,… and lots of others
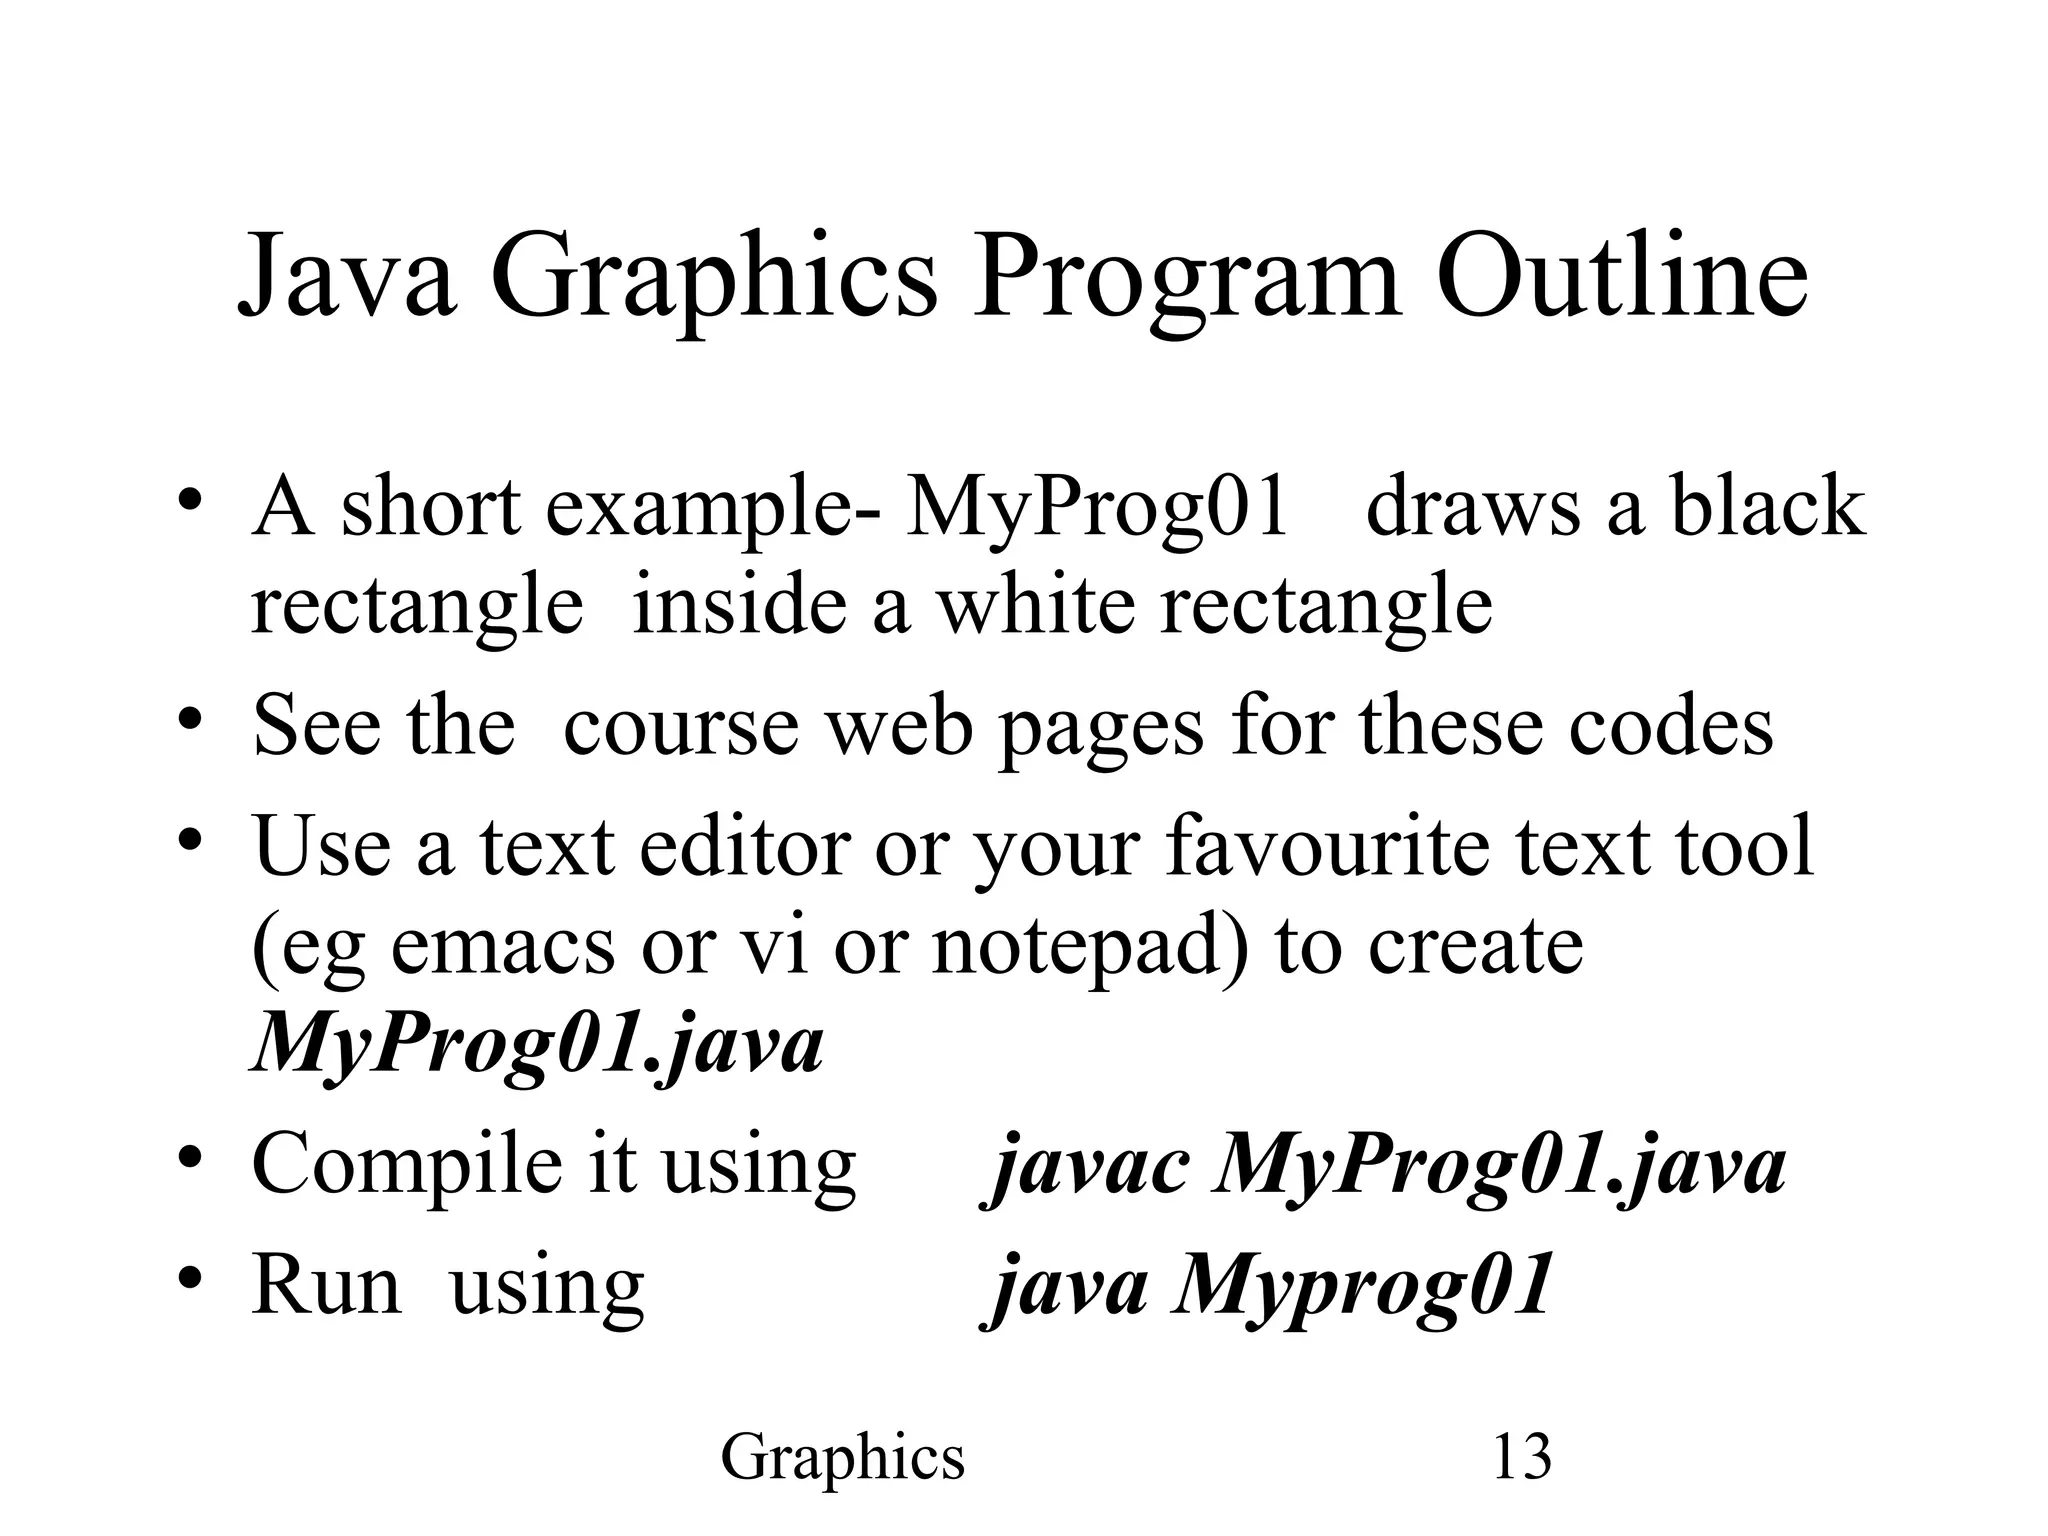
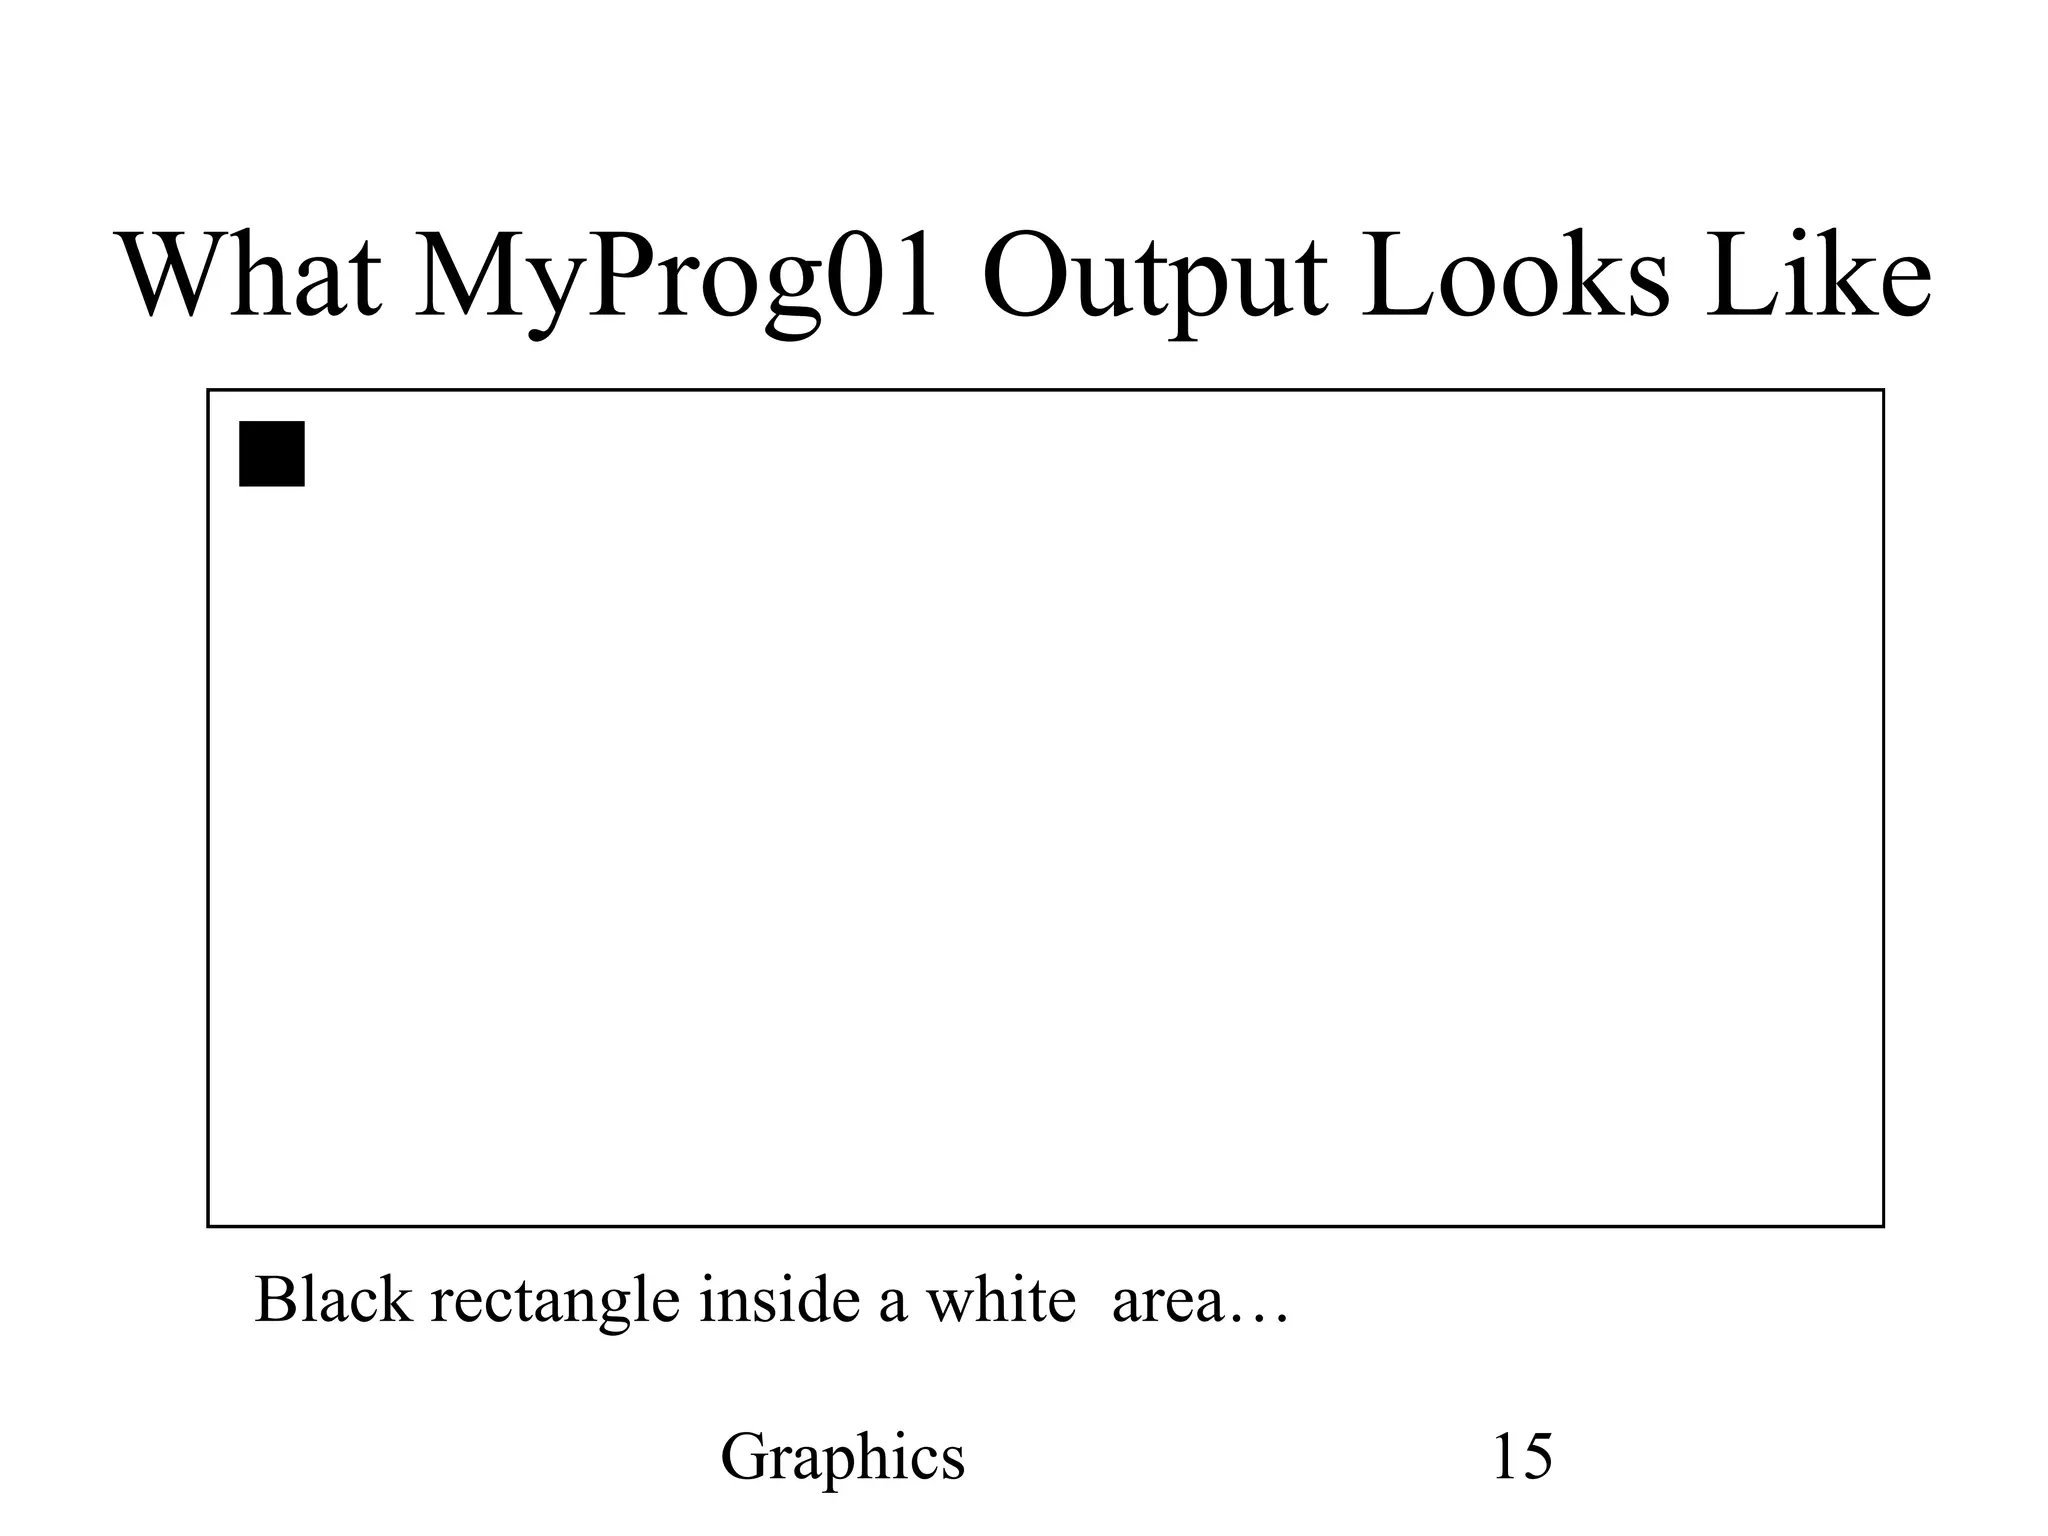
Graphics 13 Java Graphics Program Outline • A short example- MyProg01 draws a black rectangle inside a white rectangle • See the course web pages for these codes • Use a text editor or your favourite text tool (eg emacs or vi or notepad) to create MyProg01.java • Compile it using javac MyProg01.java • Run using java Myprog01
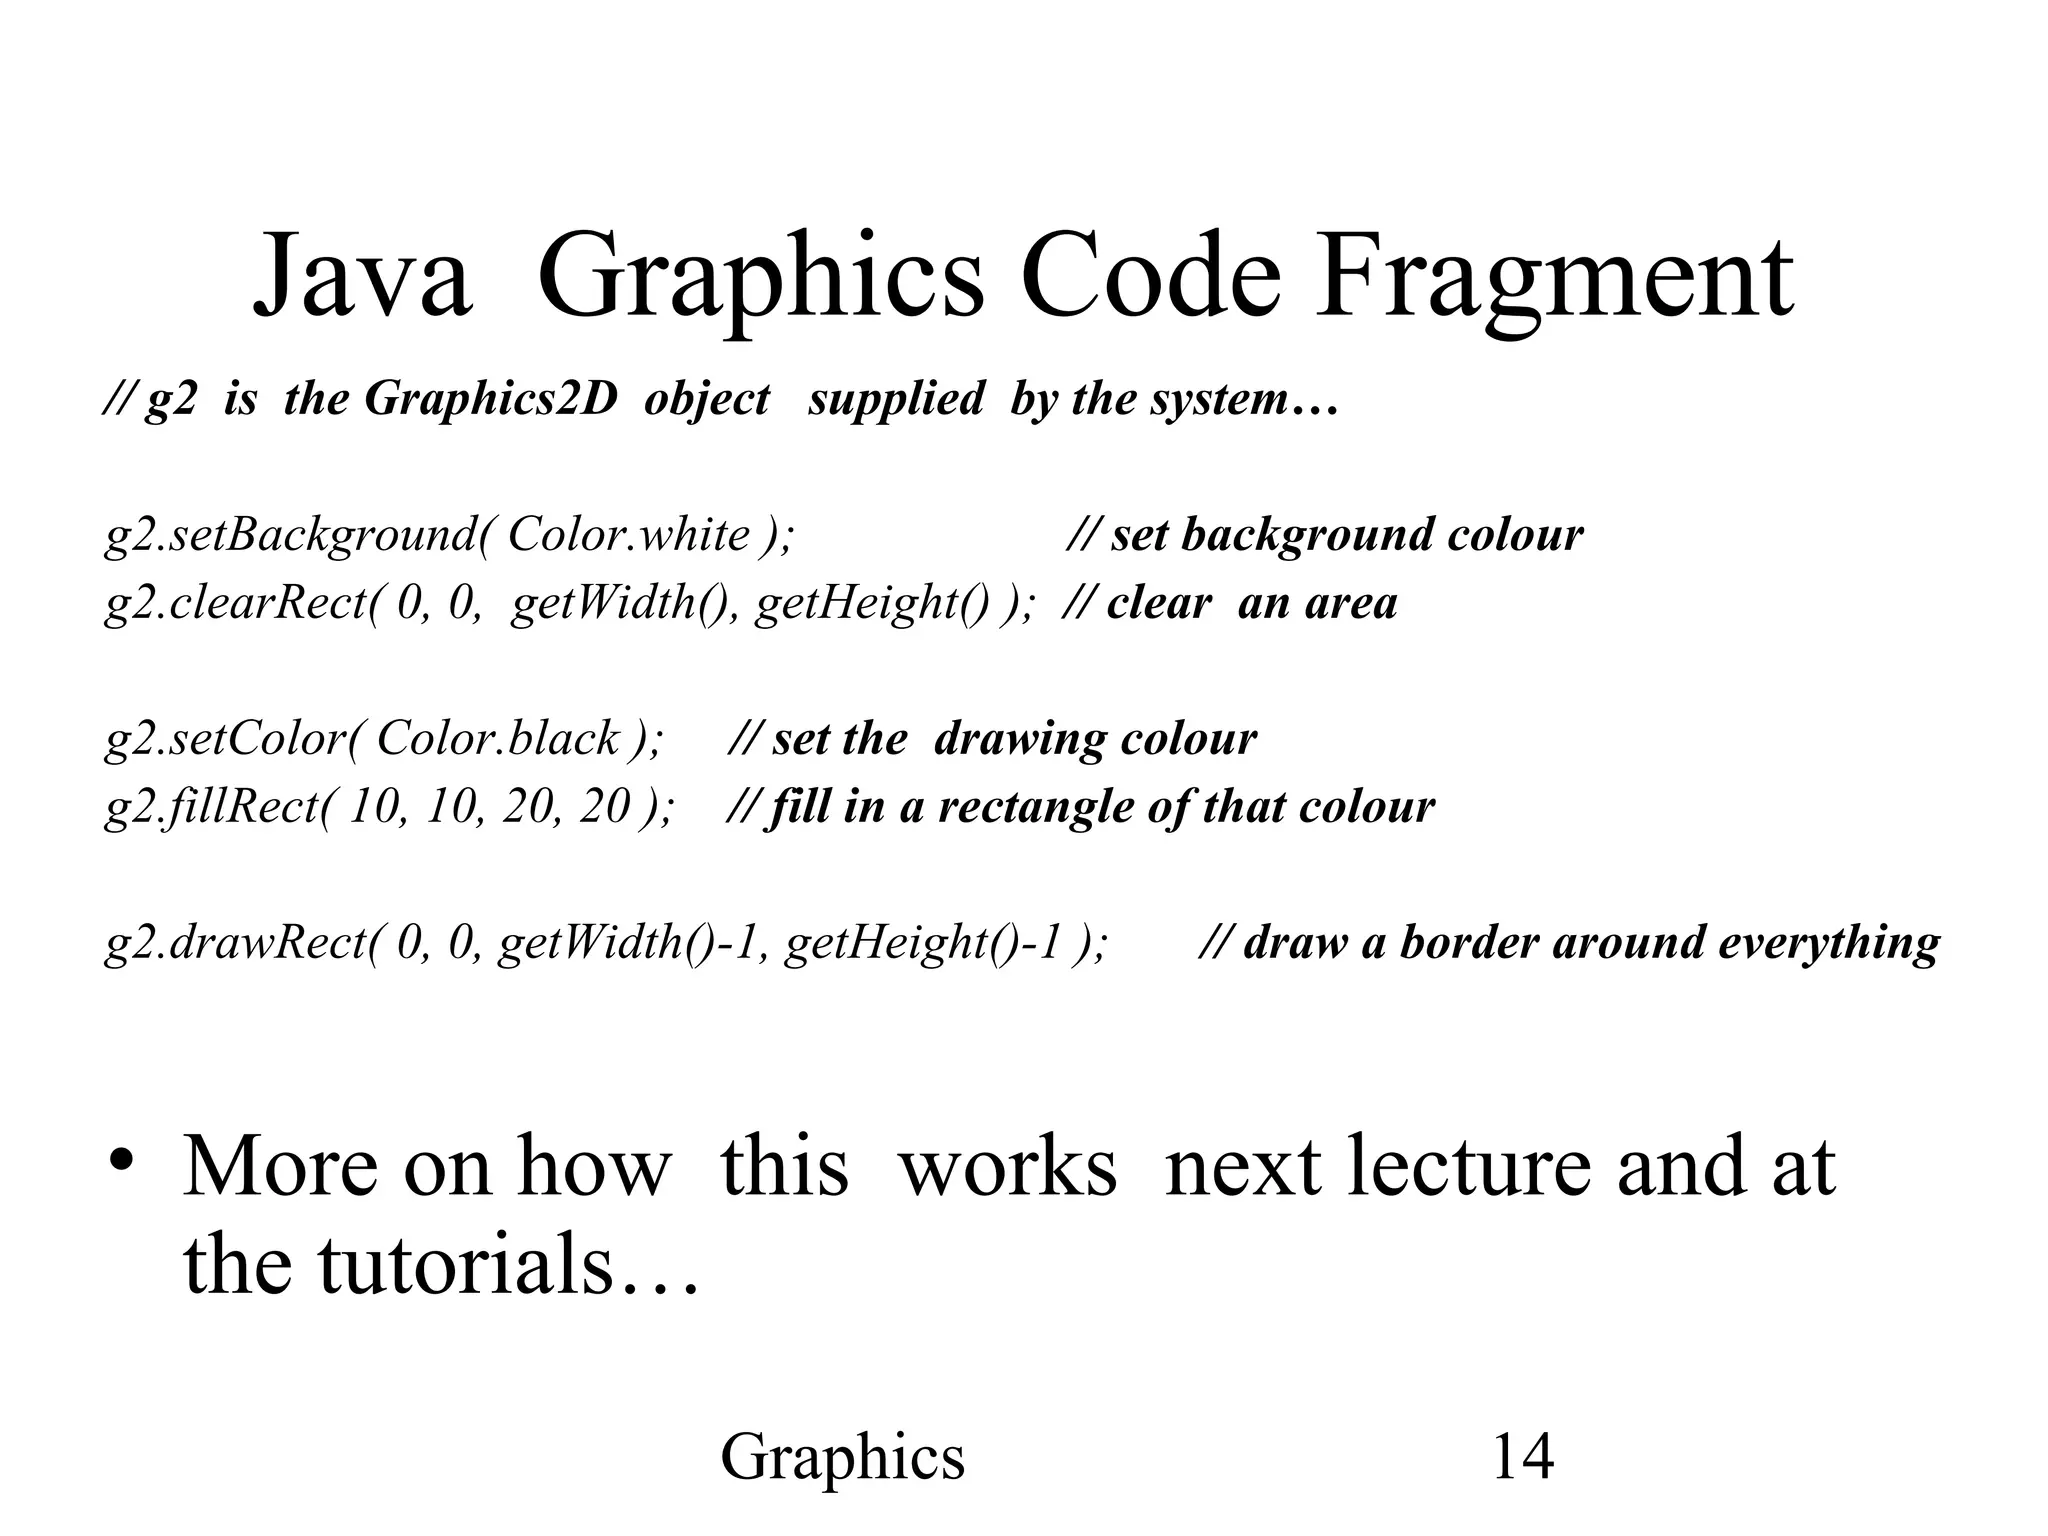
Graphics 14 Java Graphics Code Fragment // g2 is the Graphics2D object supplied by the system… g2.setBackground( Color.white ); // set background colour g2.clearRect( 0, 0, getWidth(), getHeight() ); // clear an area g2.setColor( Color.black ); // set the drawing colour g2.fillRect( 10, 10, 20, 20 ); // fill in a rectangle of that colour g2.drawRect( 0, 0, getWidth()-1, getHeight()-1 ); // draw a border around everything • More on how this works next lecture and at the tutorials…
Graphics 15 What MyProg01 Output Looks Like Black rectangle inside a white area…
Graphics 16 Summary • Graphics has a varied history • Very technology driven • Good advances in recent years with adequate memory and processing power • Primitives and library layers approach is very common • Note devices and memory model • Colour models and drawing spaces are important ideas for our programs • We will use the Java Development Kit graphics libraries and primitives

fundamentals of Computer graphics(Computer graphics tutorials)

  • 1.
    Graphics 1 Graphics &Graphical Programming Lecture 2 - Graphics Fundamentals
  • 2.
    Graphics 2 Fundamentals Outline •Historical perspective • Model of a Computer - Memory & Graphics • Devices • Raster Model & Bitmaps • Coordinates • Drawing Spaces • Colours • Graphics Libraries
  • 3.
    Graphics 3 Brief History •Teletypes(pre 1950s), Display Tubes(post WW2), CRTs(last half of 20th century), Flat Panels (modern era) • Size and Quality (eg resolution) driven by economics (eg 640x320…1024x768…) • Vector (circa WW2) & Raster/Bitmap models • Devices & Human / Machine Interaction • Memory and Processing Speed limitations
  • 4.
    Graphics 4 Computer MemoryModel • Main Memory • Graphics memory – Used to be limited to separate amount on eg graphics card – Modern idea is to partition main memory dynamically (ie by software instruction) • Modern idea is to map memory to the display • Independent of display hardware type • CPU + Cache memory + Main memory • Cache memory is fast but expensive so (still often) only have small amount eg 512kBytes available • Main memory relatively plentiful (eg GBytes) but slow
  • 5.
    Graphics 5 Memory &Graphics • Idea is that we can write programs that interact with the graphical display device simply by writing to a predetermined area of the computer’s memory • Known as Bitmap graphics • The bits are mapped to the pixels • Flexible, portable software • Independent of Hardware & Operating System
  • 6.
    Graphics 6 Graphical Devices •Devices eg mouse, stereo glasses, tracker ball, light pen, touch screen, 3d-wand, “rat”, sensor gloves, head tracker, iris tracker,… • Even Mouse varies in form factor and number of buttons • Mouse - most well known device • Buttons, and scan movements • Jargon ideas that have become common: – Drag – Click – Double-Click – Left -Click • Main idea is to let you specify a location in a space eg x,y (or x,y,z) coordinates
  • 7.
    Graphics 7 Raster Model- Pixels • Pixel or sometimes “pel” Picture Element • Each pixel is a sample that can be rendered as a dot or rectangle on the screen • Often try to design them as squares but not always • Might be implemented as small area of phosphor on a monochrome monitor • Or three areas of eg red, green and blue phosphors for colour • Or simple a transistor logic gate assembly on a flat panel display
  • 8.
    Graphics 8 Coordinate Systems •Pixel Coordinate System - rows and columns • Rectilinear • Usually for graphics, we start at top left corner and work our way across and down • Same as raster orientation • Array[row][column] • Row major used in C and C+ ( last index moves fastest in memory) • Not all languages do it this way - eg Fortran uses column major (first index moves fastest)
  • 9.
    Graphics 9 Cartesian Coordinates •Often we use the Cartesian coordinate convention ie x,y coordinates (or x,y,z in 3D) and map this to our display • Usually column corresponds to x, and -row corresponds to y • This works if we know the max min values. • Common values are eg 640 columns x 320 rows • Or 1024x768 or better • Aspect ratio is the ratio of these eg 4:3 - Chosen to suit the common display devices eg TV screens or monitors x y
  • 10.
    Graphics 10 Drawing Spaceor Canvas • Coordinate Systems • Drawing Primitives • Library of utilities – eg drawDot( int x, int y); – Or drawLine( x1, y1, x2, y2 ); • Usually we have “Primitive” Models for coordinate spaces and colours • We do not want to write our application programs worrying about pixel resolutions • We may have libraries that allow us to do so, but often they will support more general coordinates • Eg real space “normalised” coordinates [0.0,1.0]
  • 11.
    Graphics 11 Colours inBrief • Red Green Blue is not the Only colour model although still most common • We specify separate RGB values for each pixel • They map to intensities • All colours can be expressed as combination of these • Sometimes also an “alpha” or transparency value • These will conveniently pack into a computer word of 4 bytes, one byte for each entity • 1 Byte gives us 256 values - hence numbers of colours • Need not use this resolution • Can also use Look-up tables to save memory
  • 12.
    Graphics 12 Graphics Librariesand packages • What is a graphics system? • A package or Library that links to a Language or environment and lets us write programs that are independent of the graphics hardware and devices • Java Development Kit and Java 2D and Java 3D libraries • GL and OpenGL (Graphics Library), VOGL • X11, DirectX, PHIGS,… and lots of others
  • 13.
    Graphics 13 Java GraphicsProgram Outline • A short example- MyProg01 draws a black rectangle inside a white rectangle • See the course web pages for these codes • Use a text editor or your favourite text tool (eg emacs or vi or notepad) to create MyProg01.java • Compile it using javac MyProg01.java • Run using java Myprog01
  • 14.
    Graphics 14 Java GraphicsCode Fragment // g2 is the Graphics2D object supplied by the system… g2.setBackground( Color.white ); // set background colour g2.clearRect( 0, 0, getWidth(), getHeight() ); // clear an area g2.setColor( Color.black ); // set the drawing colour g2.fillRect( 10, 10, 20, 20 ); // fill in a rectangle of that colour g2.drawRect( 0, 0, getWidth()-1, getHeight()-1 ); // draw a border around everything • More on how this works next lecture and at the tutorials…
  • 15.
    Graphics 15 What MyProg01Output Looks Like Black rectangle inside a white area…
  • 16.
    Graphics 16 Summary • Graphicshas a varied history • Very technology driven • Good advances in recent years with adequate memory and processing power • Primitives and library layers approach is very common • Note devices and memory model • Colour models and drawing spaces are important ideas for our programs • We will use the Java Development Kit graphics libraries and primitives