4 Q&A • What isclustering? • What is one application of the clustering?
5.
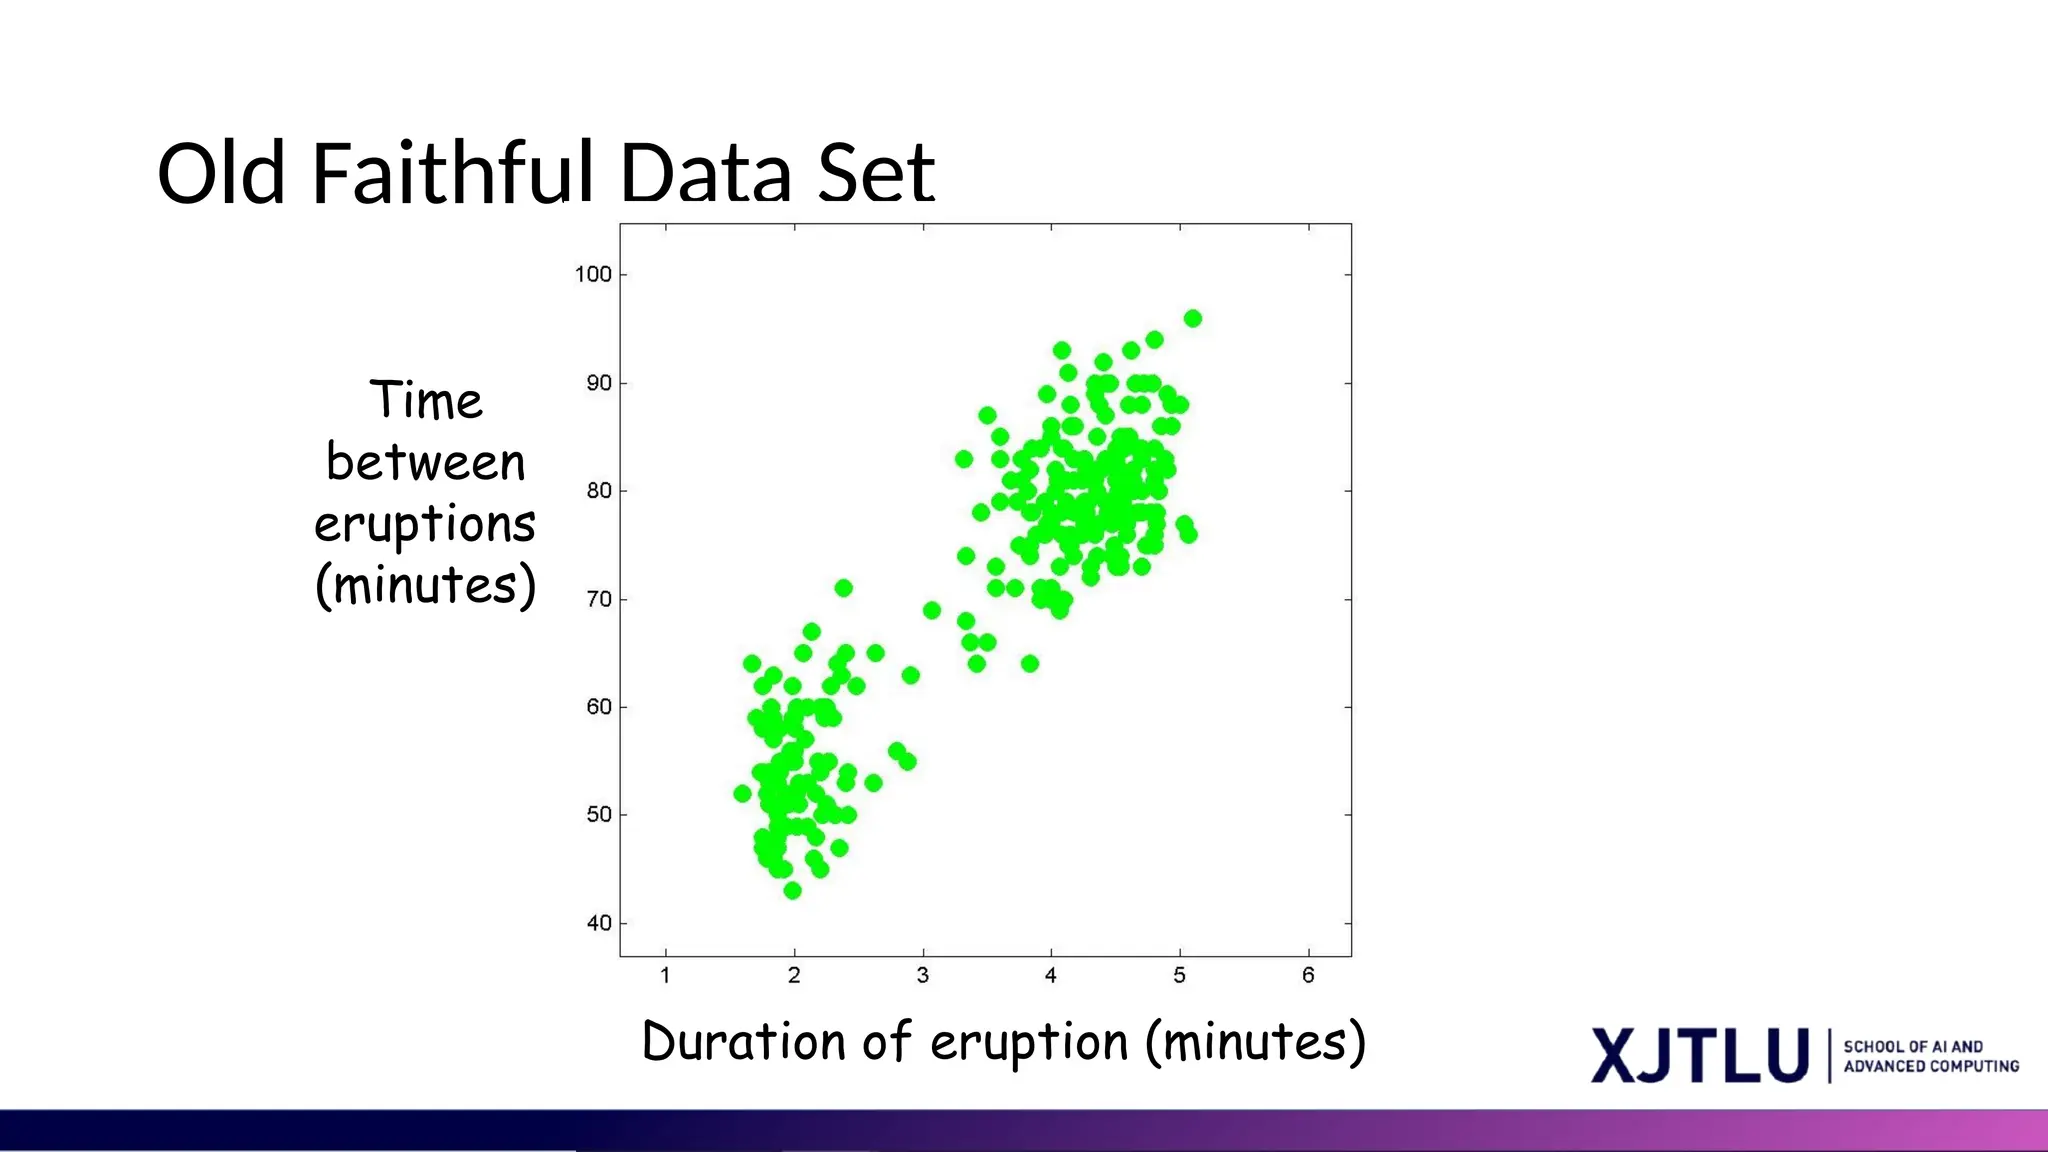
Old Faithful DataSet Duration of eruption (minutes) Time between eruptions (minutes)
6.
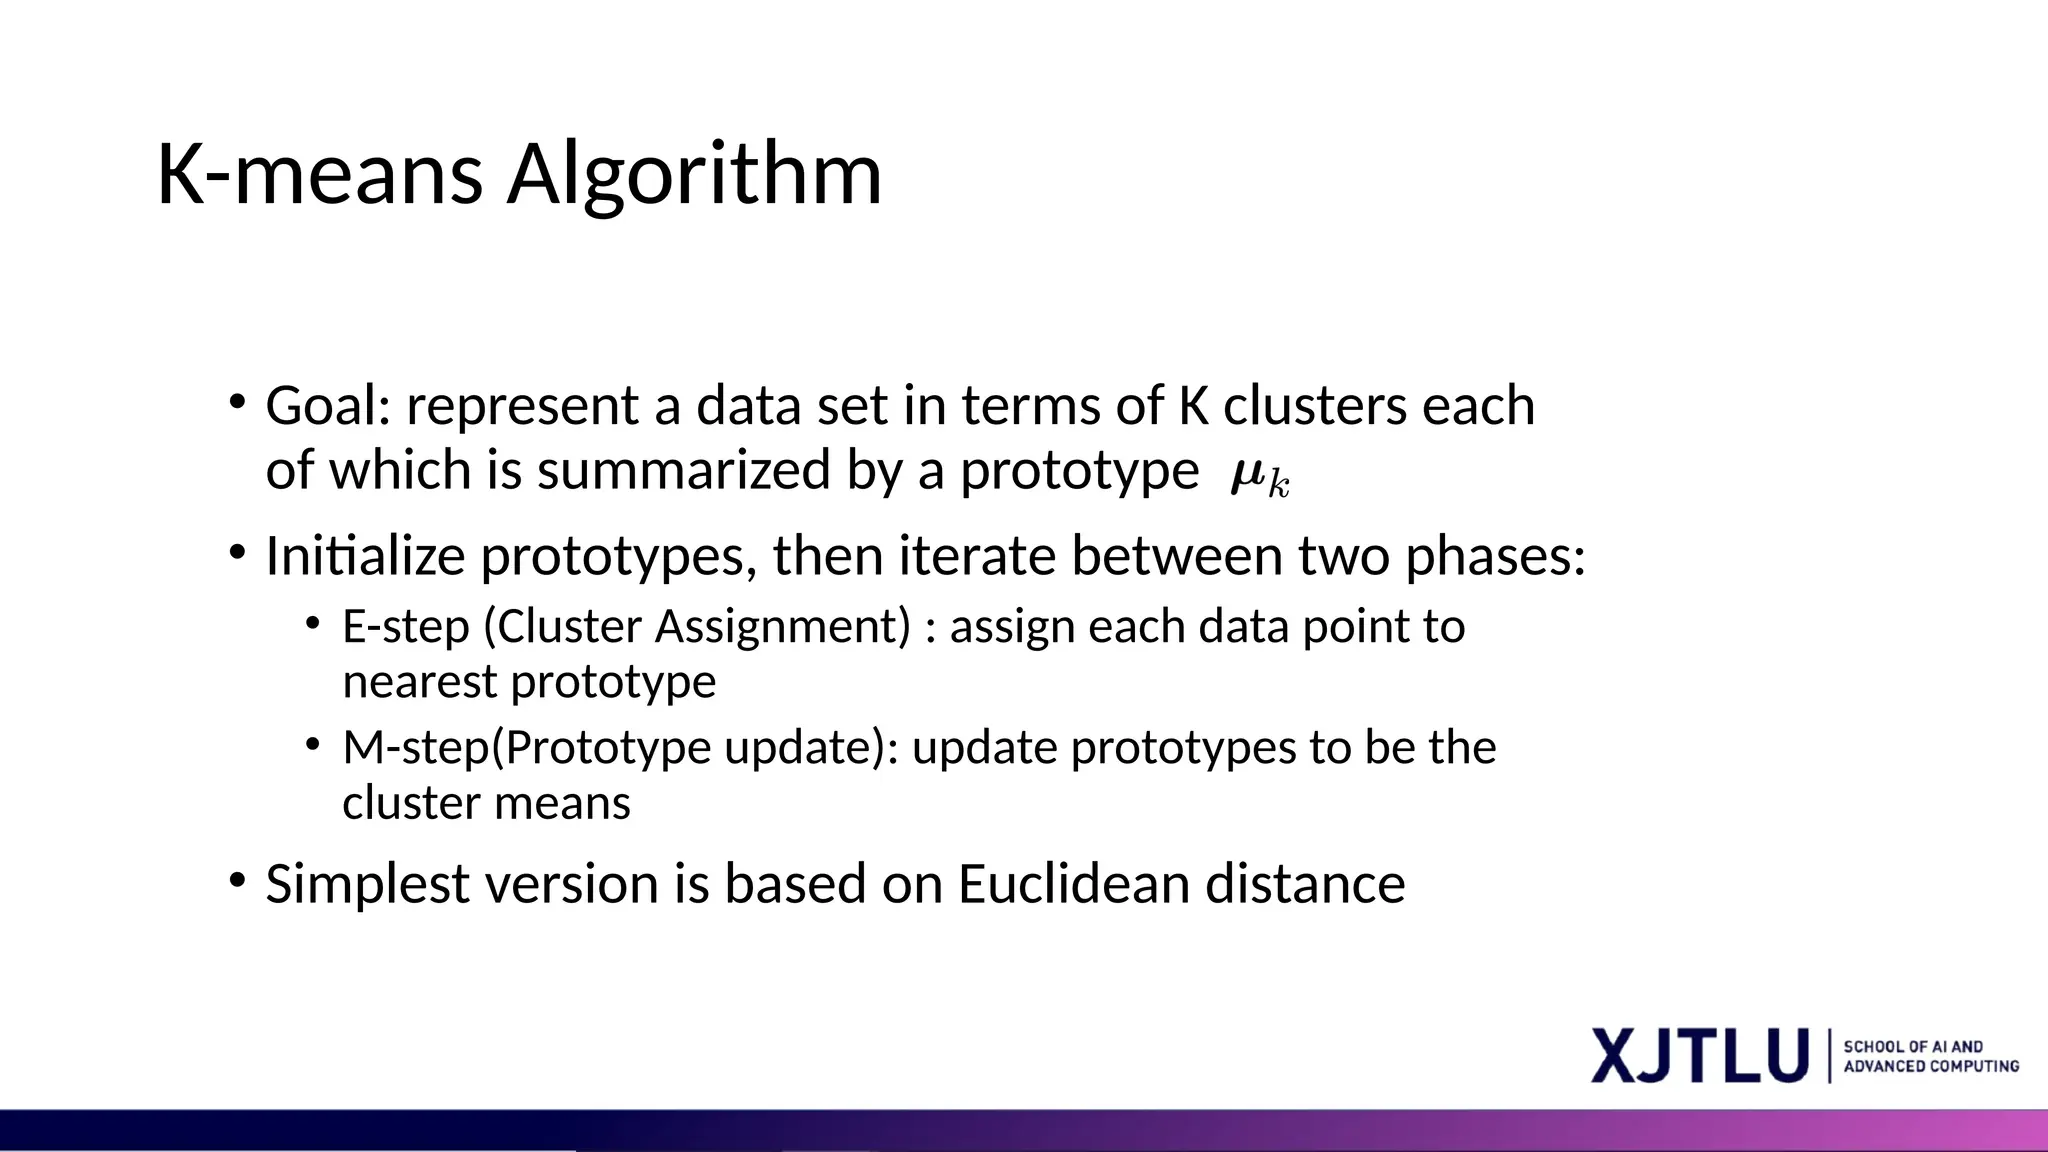
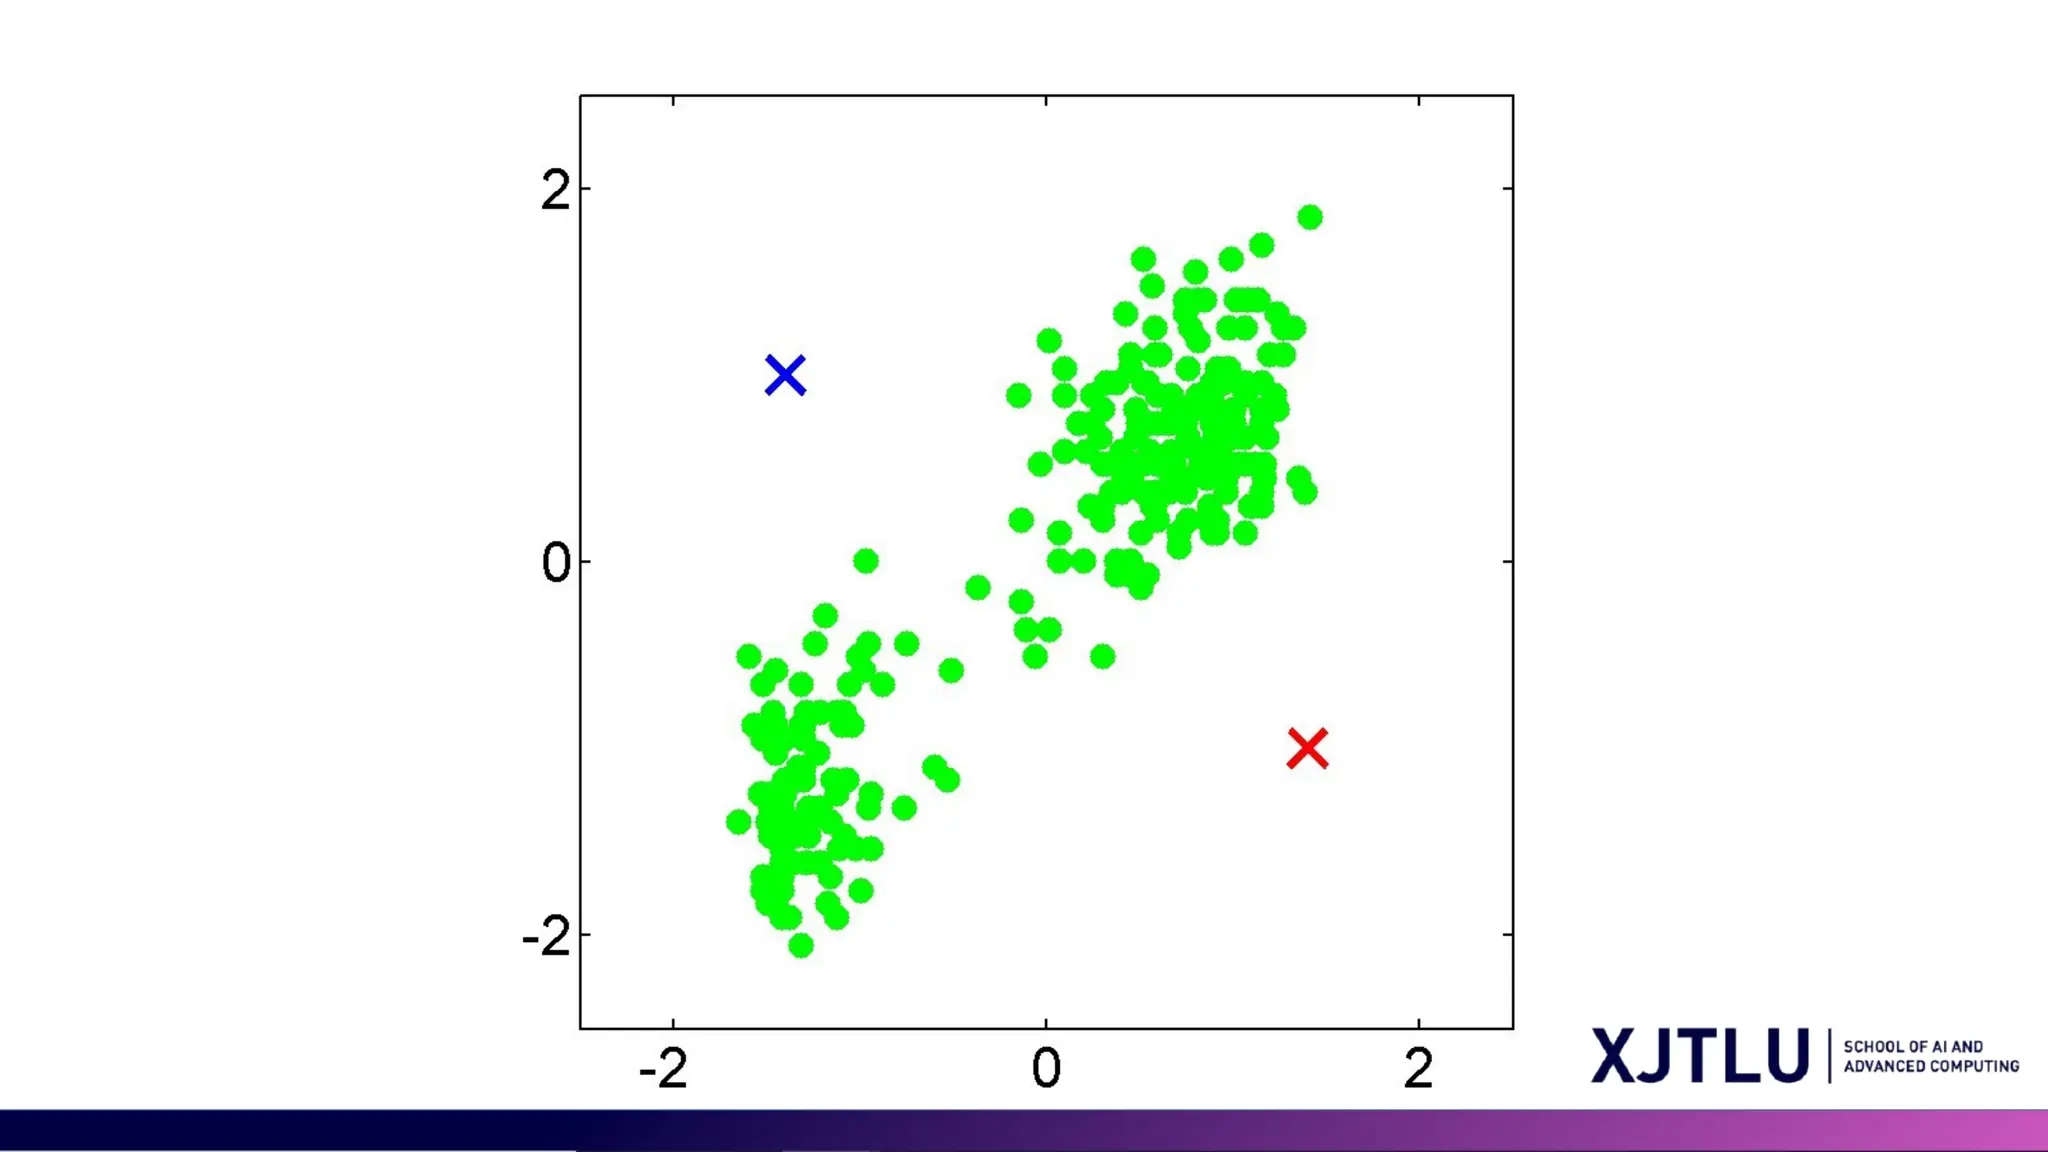
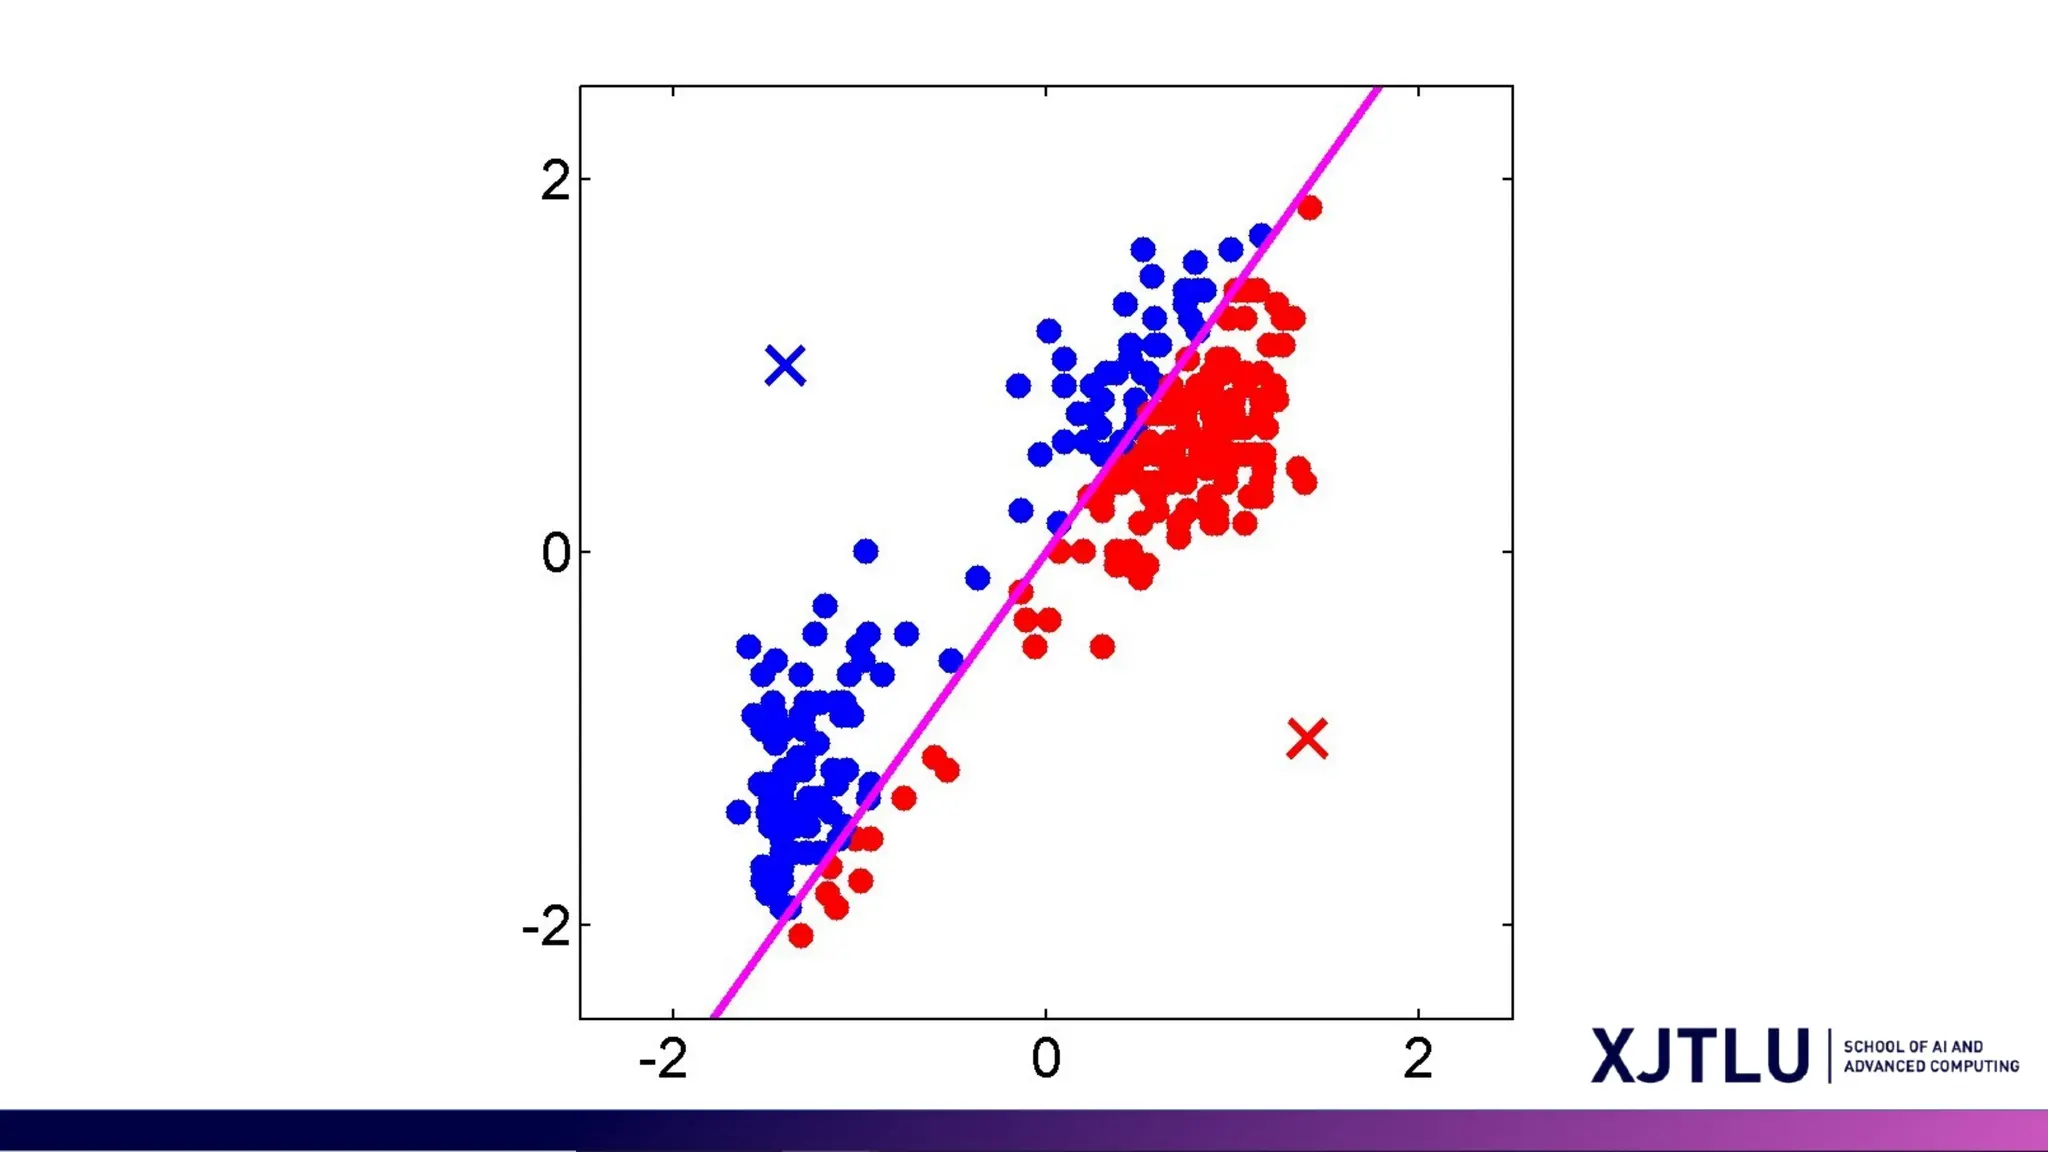
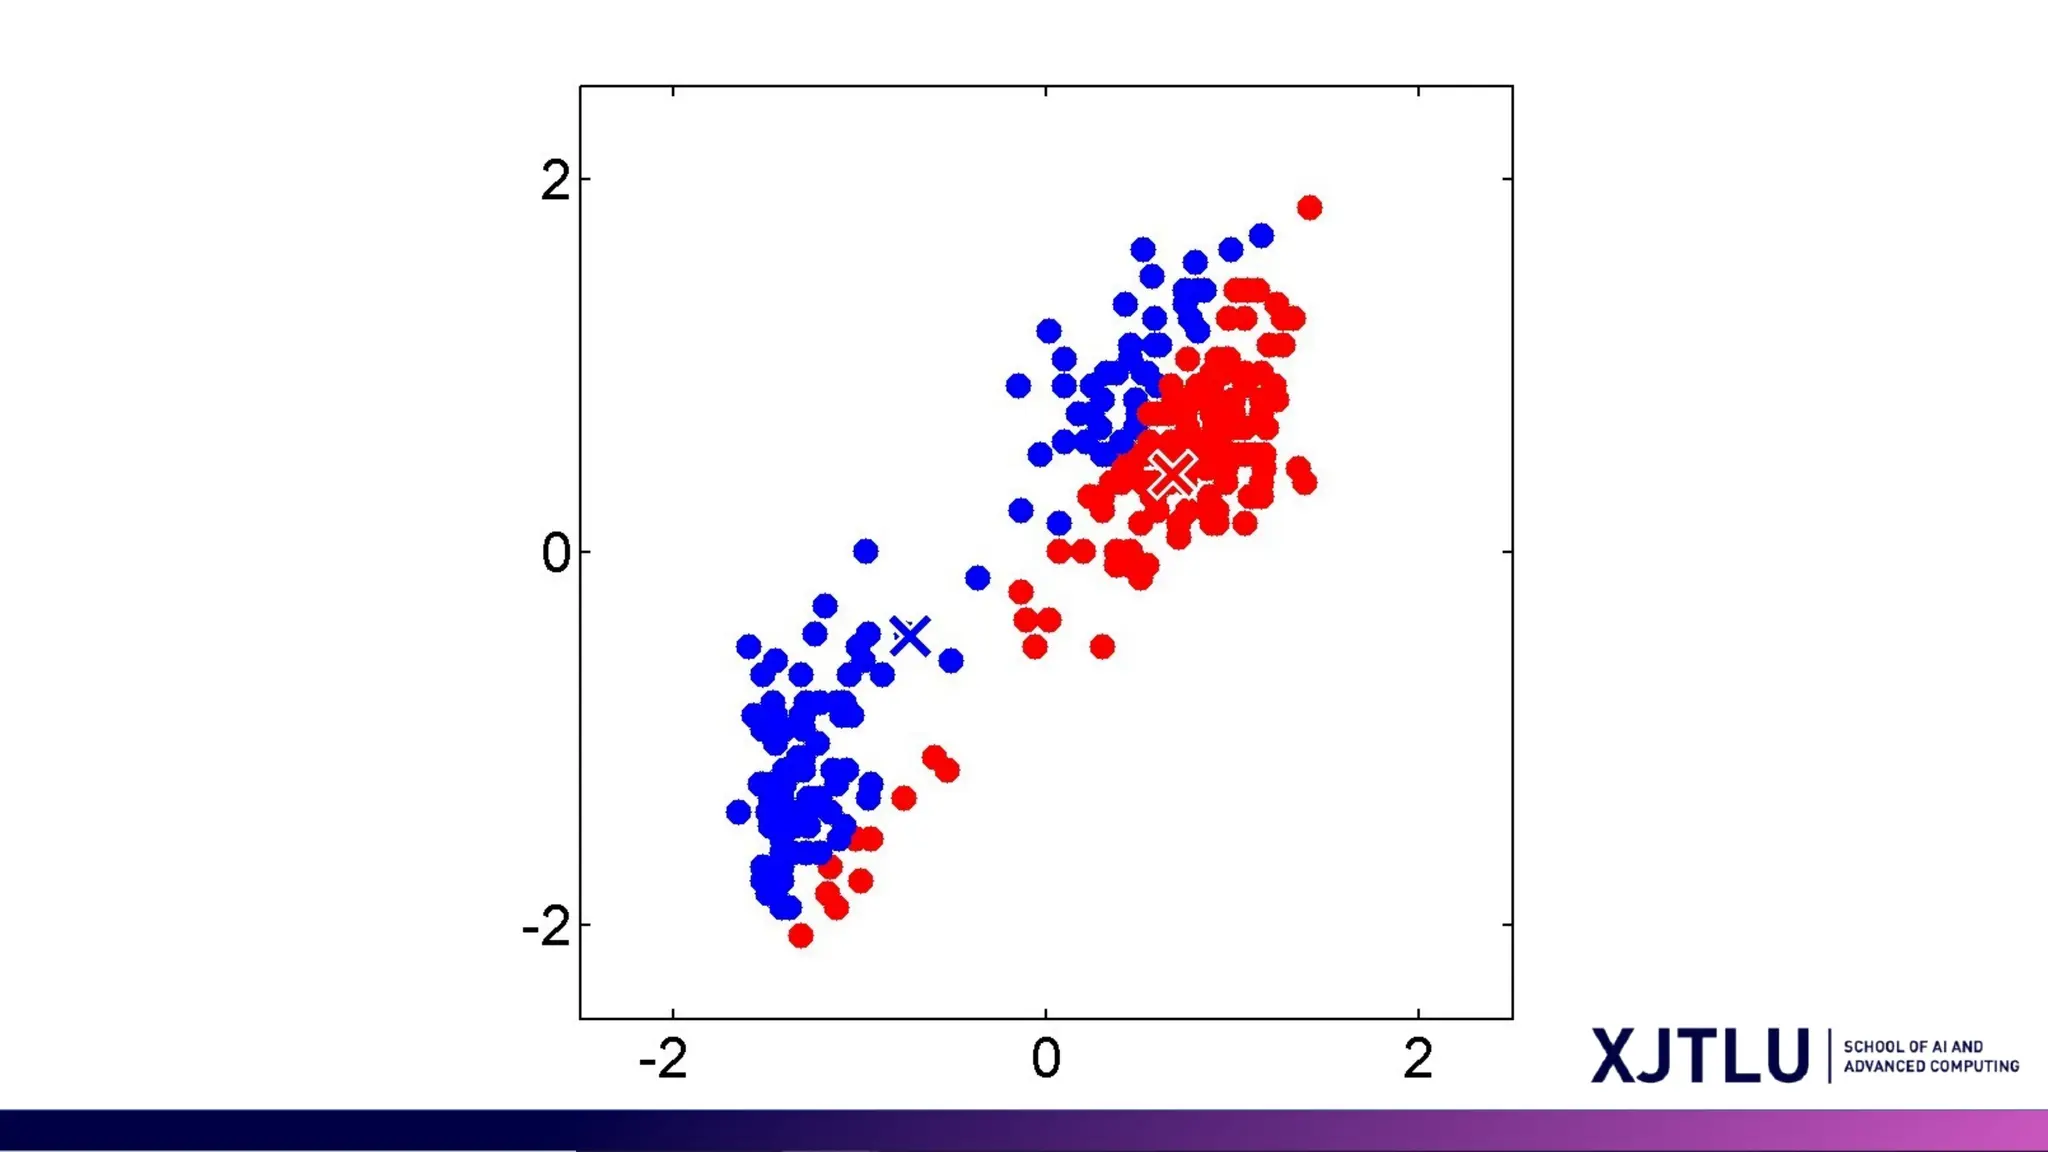
K-means Algorithm • Goal:represent a data set in terms of K clusters each of which is summarized by a prototype • Initialize prototypes, then iterate between two phases: • E-step (Cluster Assignment) : assign each data point to nearest prototype • M-step(Prototype update): update prototypes to be the cluster means • Simplest version is based on Euclidean distance
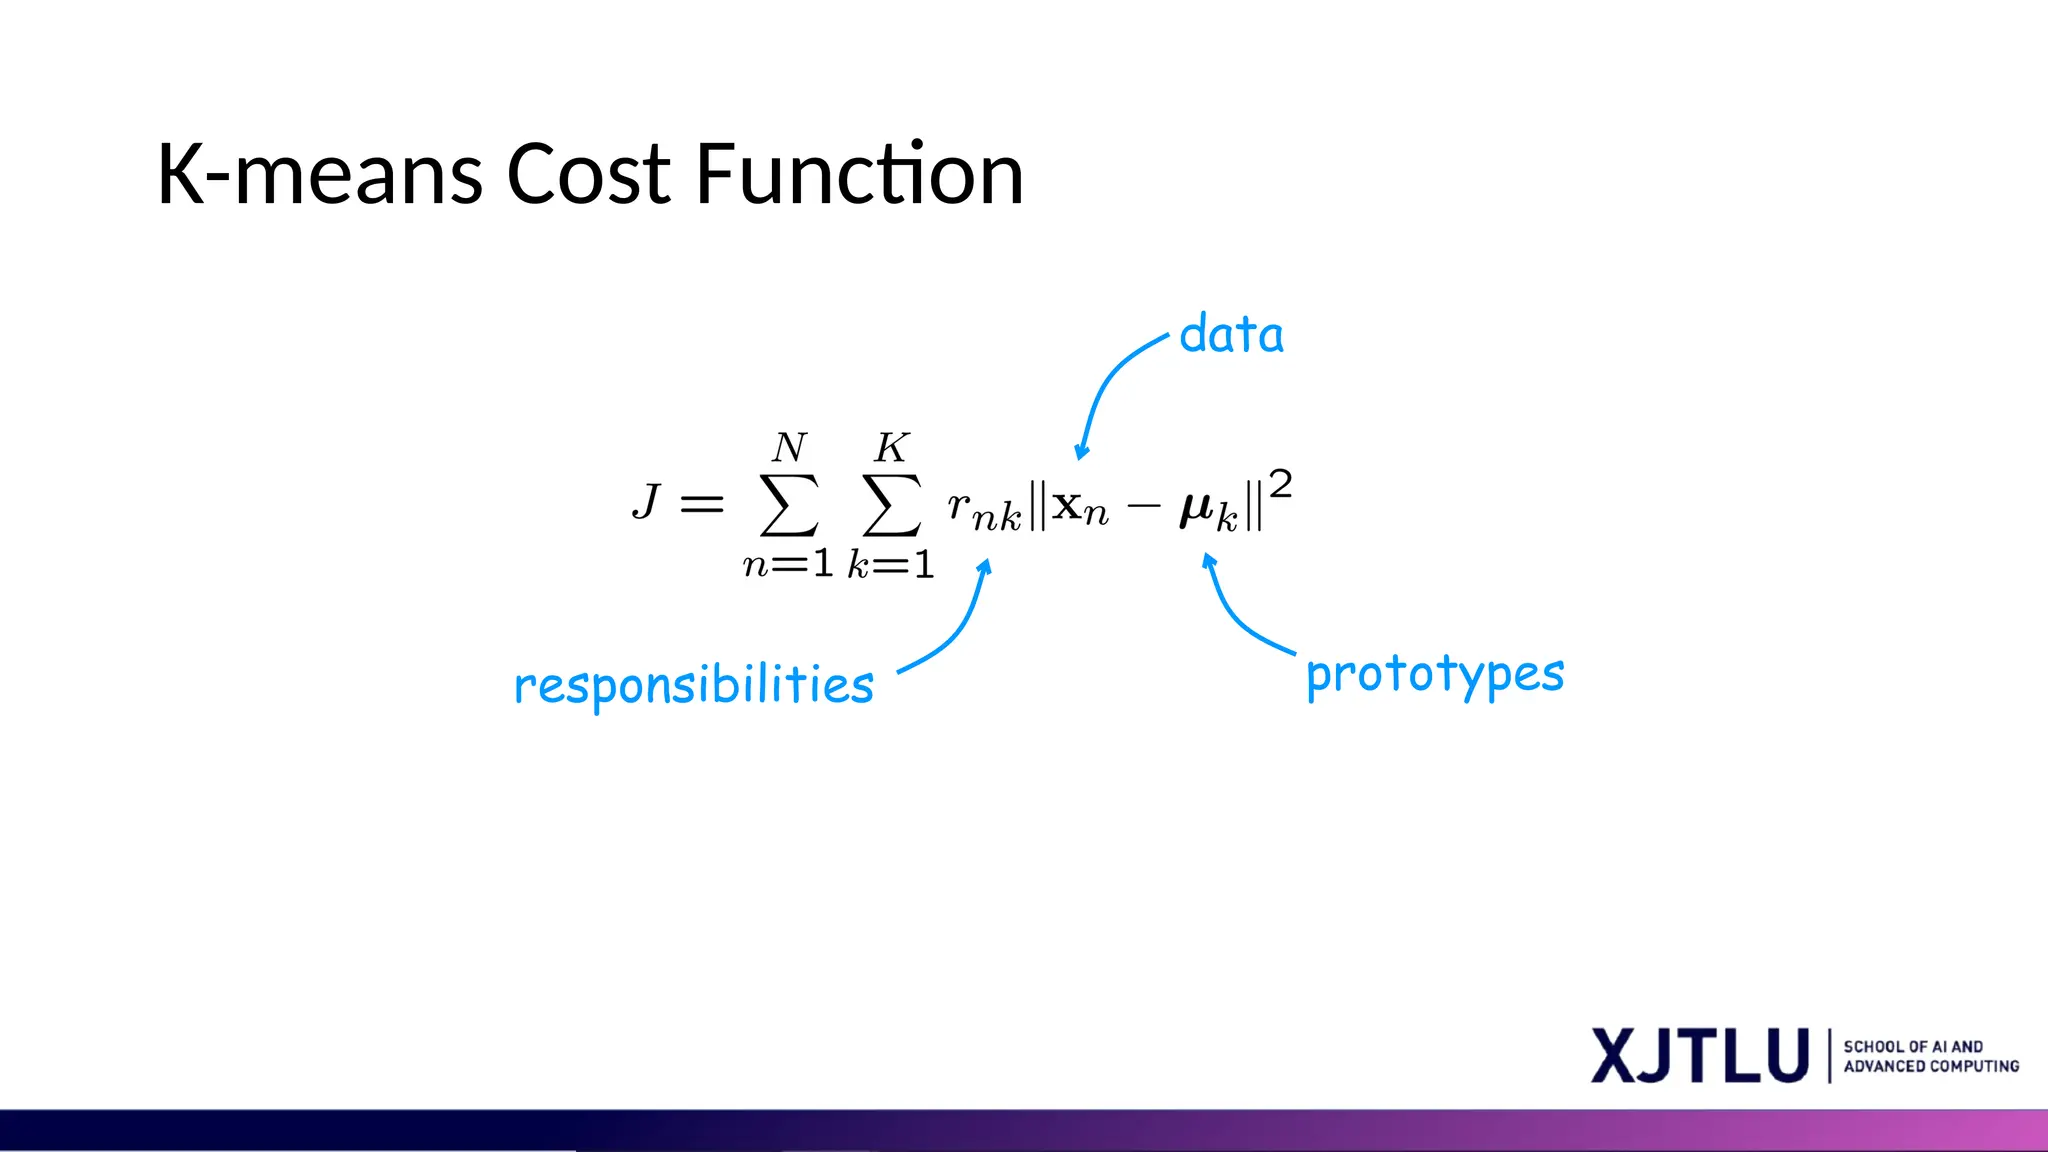
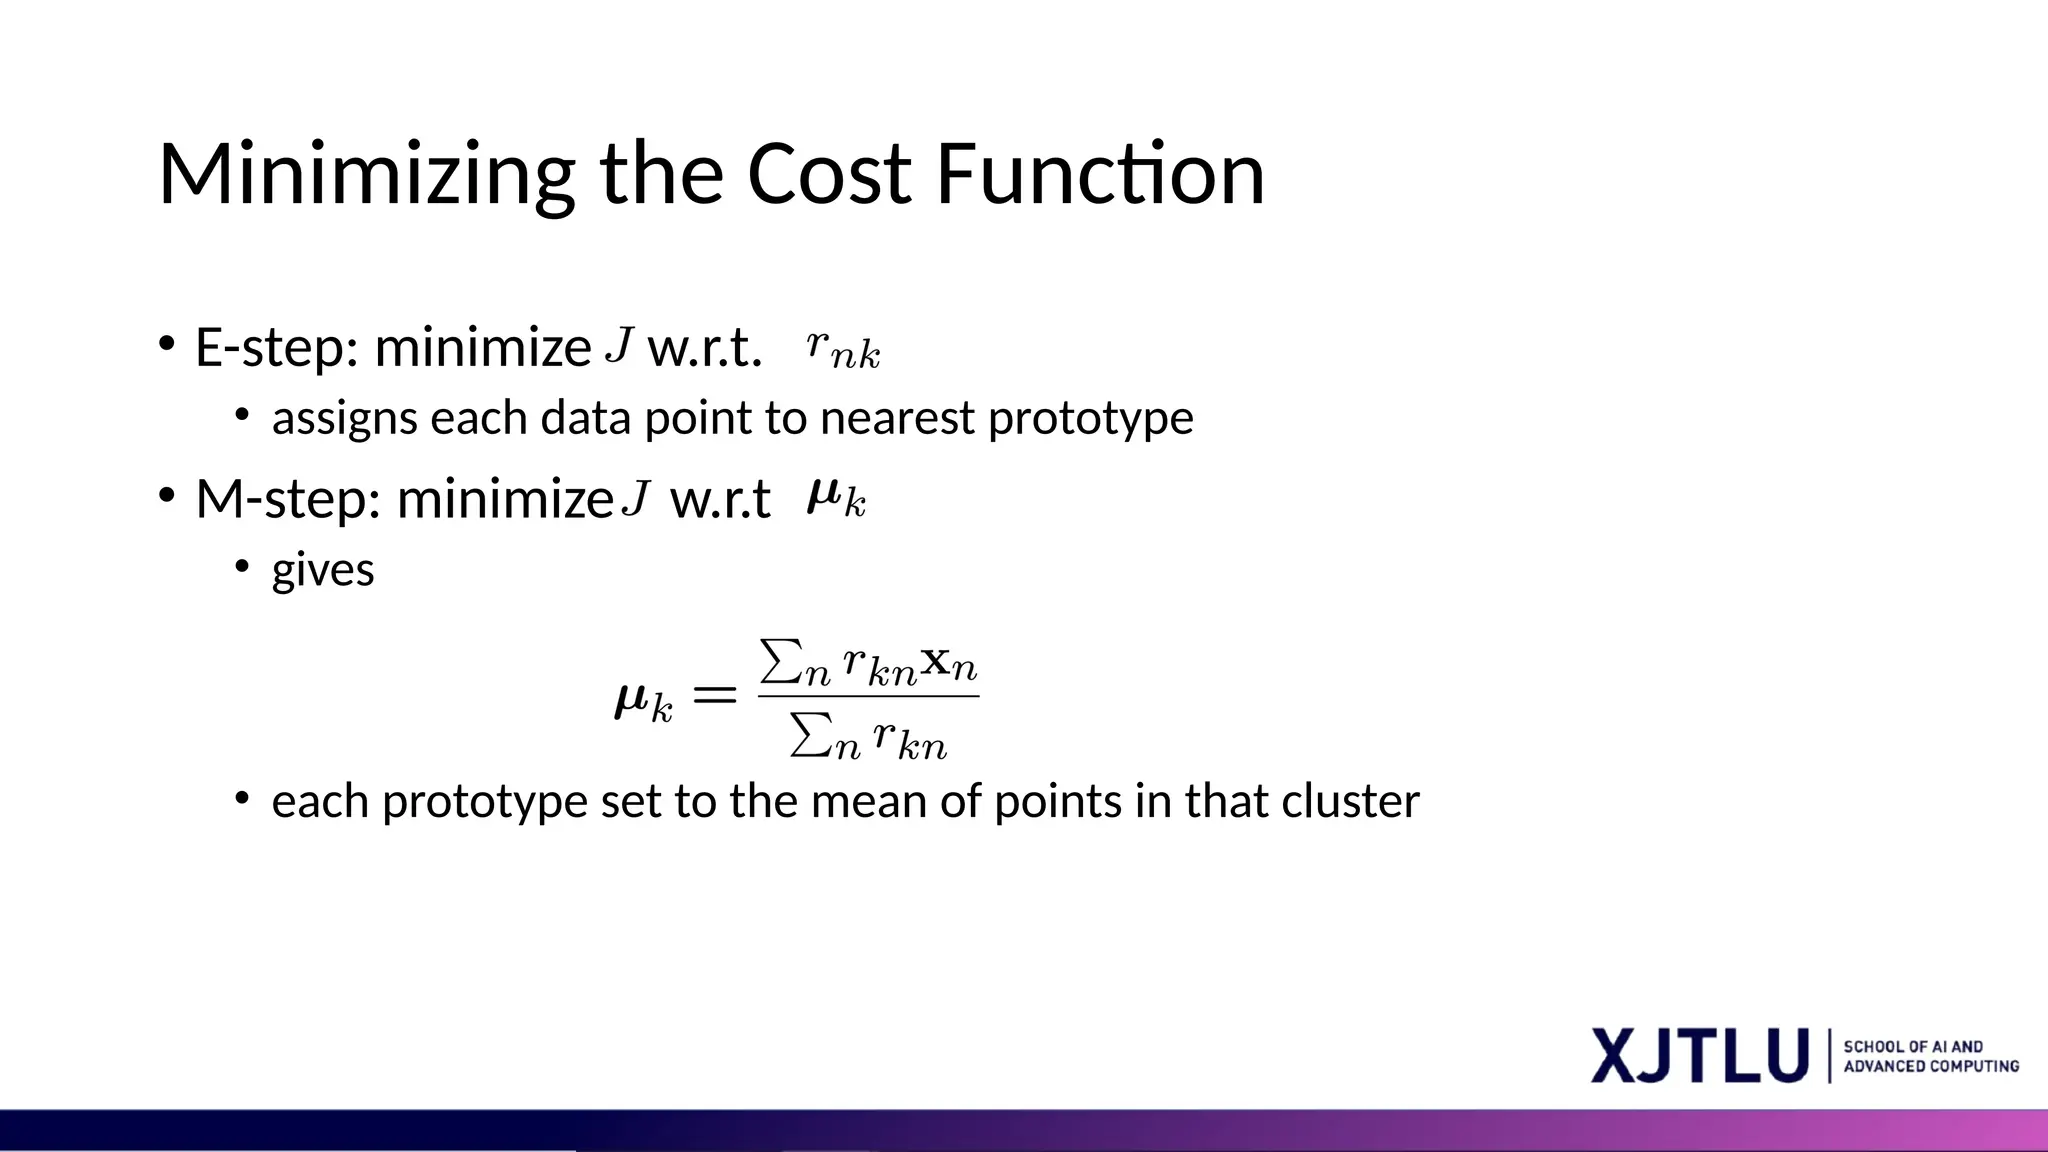
Minimizing the CostFunction • E-step: minimize w.r.t. • assigns each data point to nearest prototype • M-step: minimize w.r.t • gives • each prototype set to the mean of points in that cluster
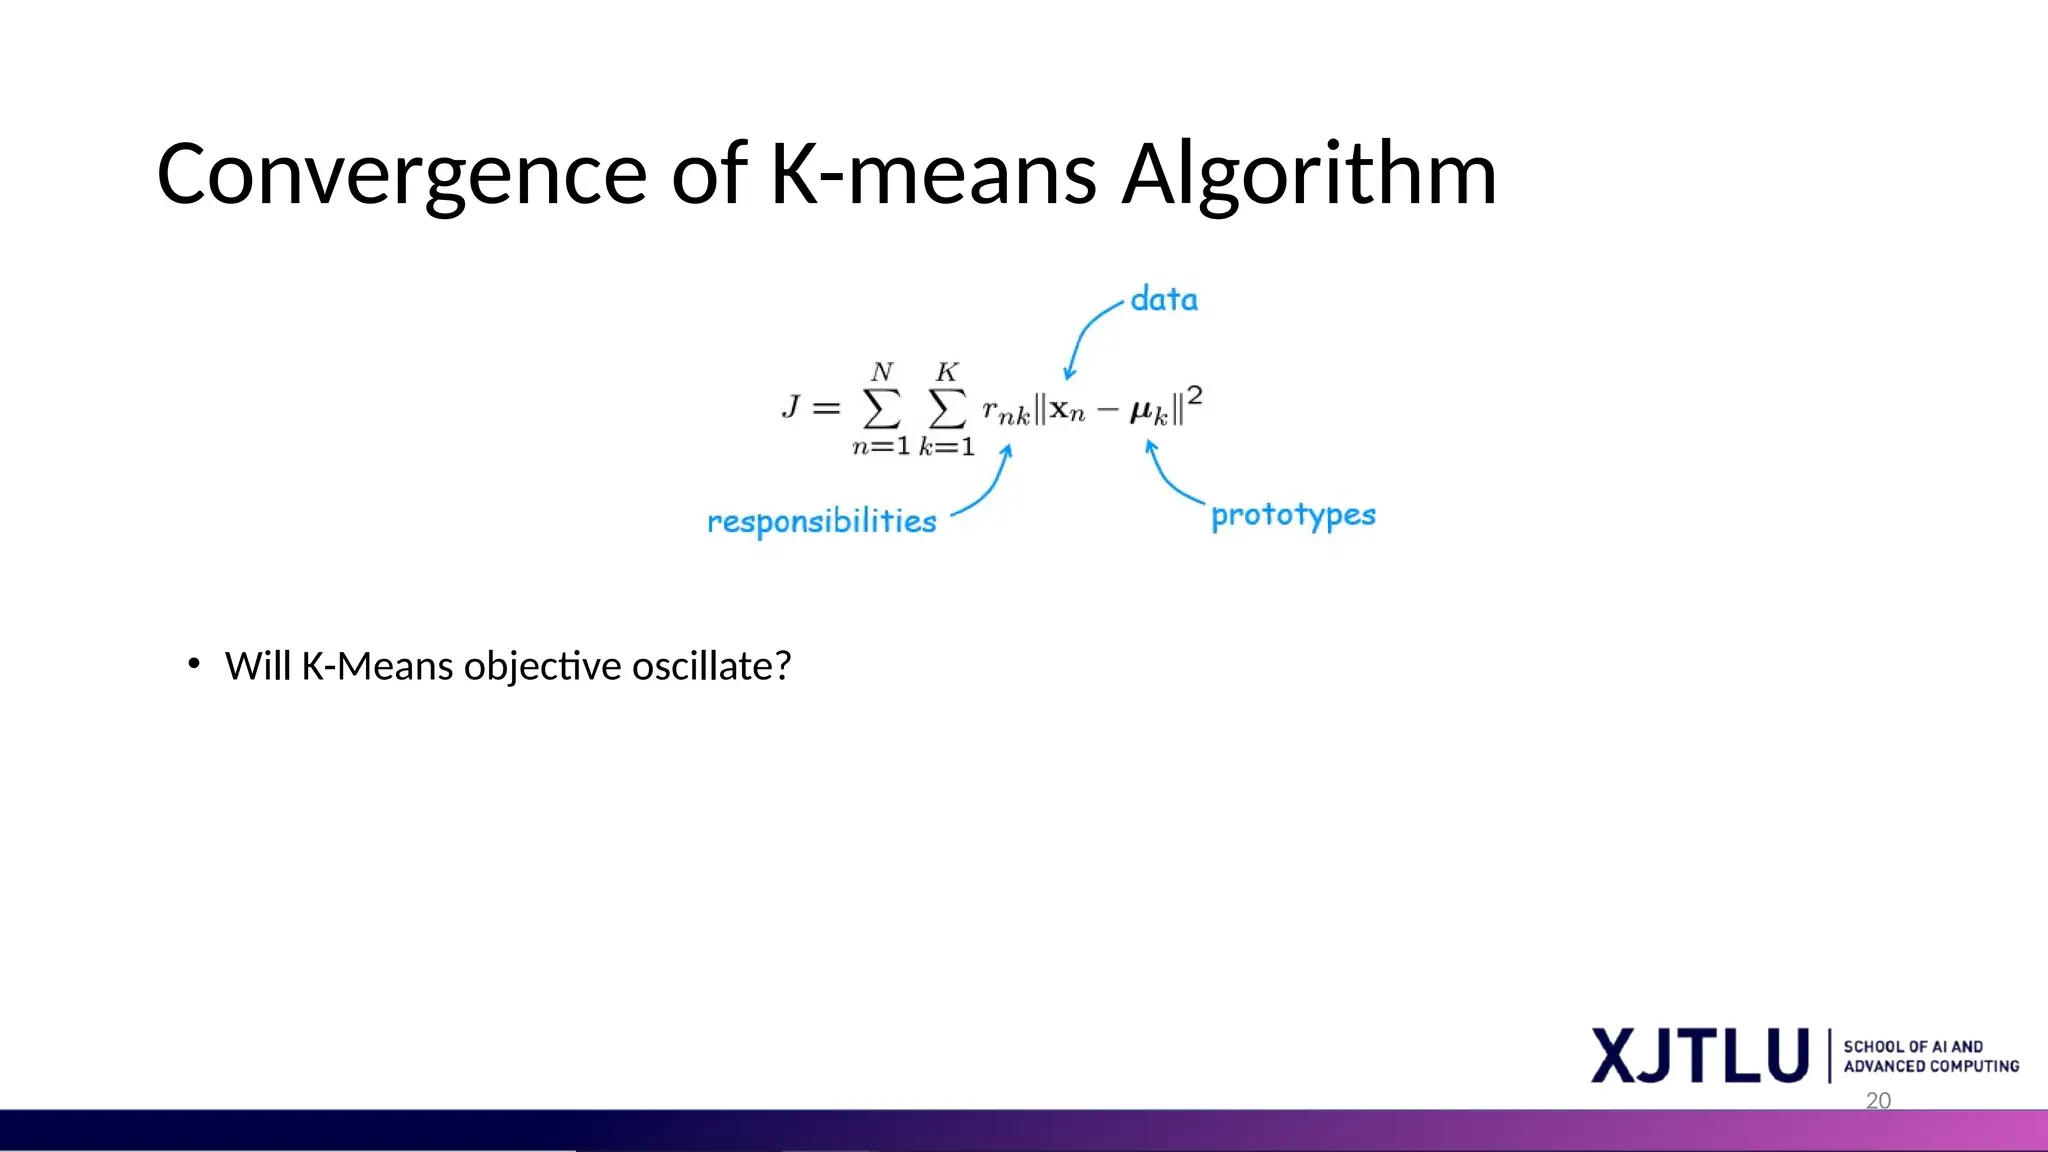
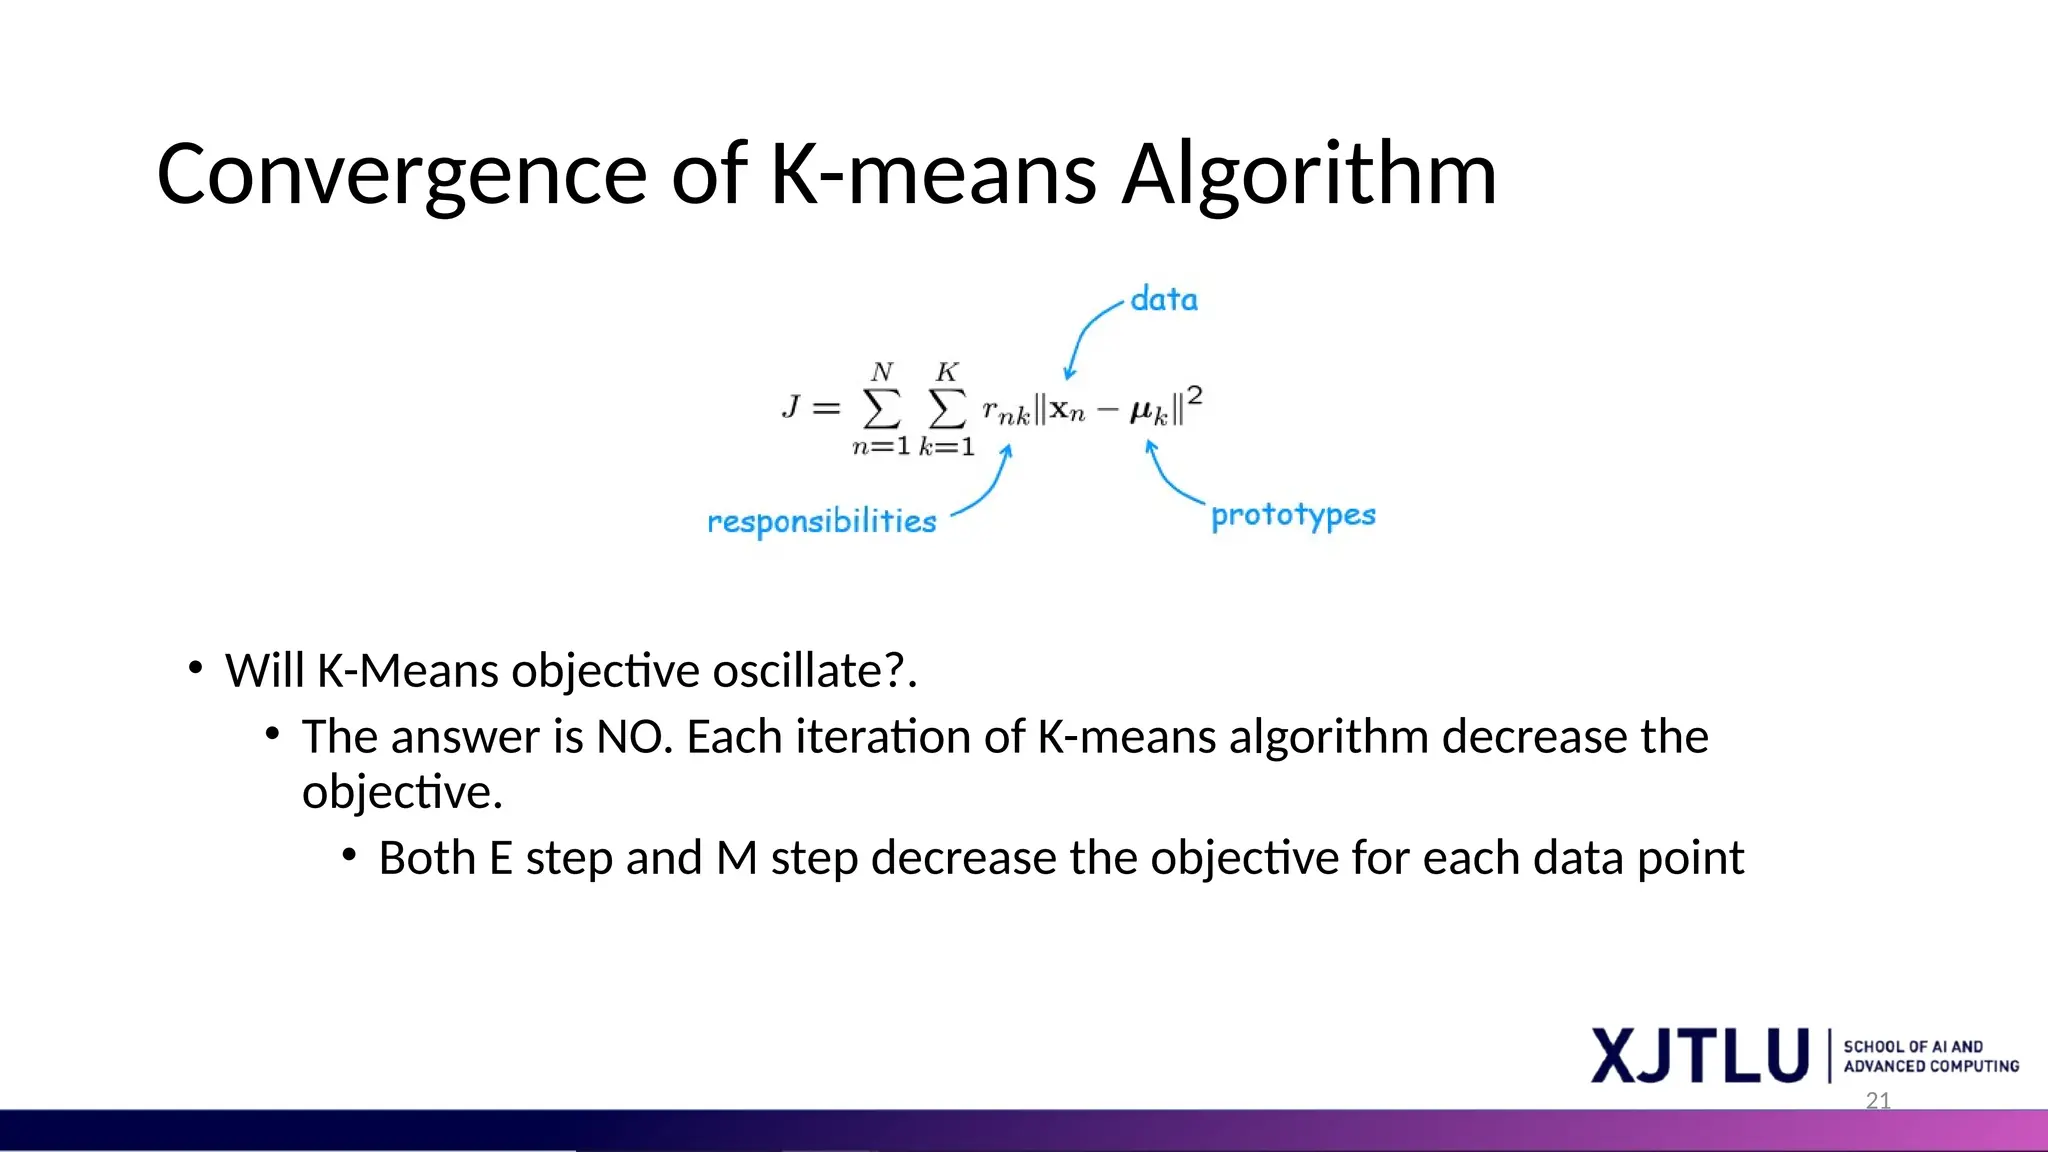
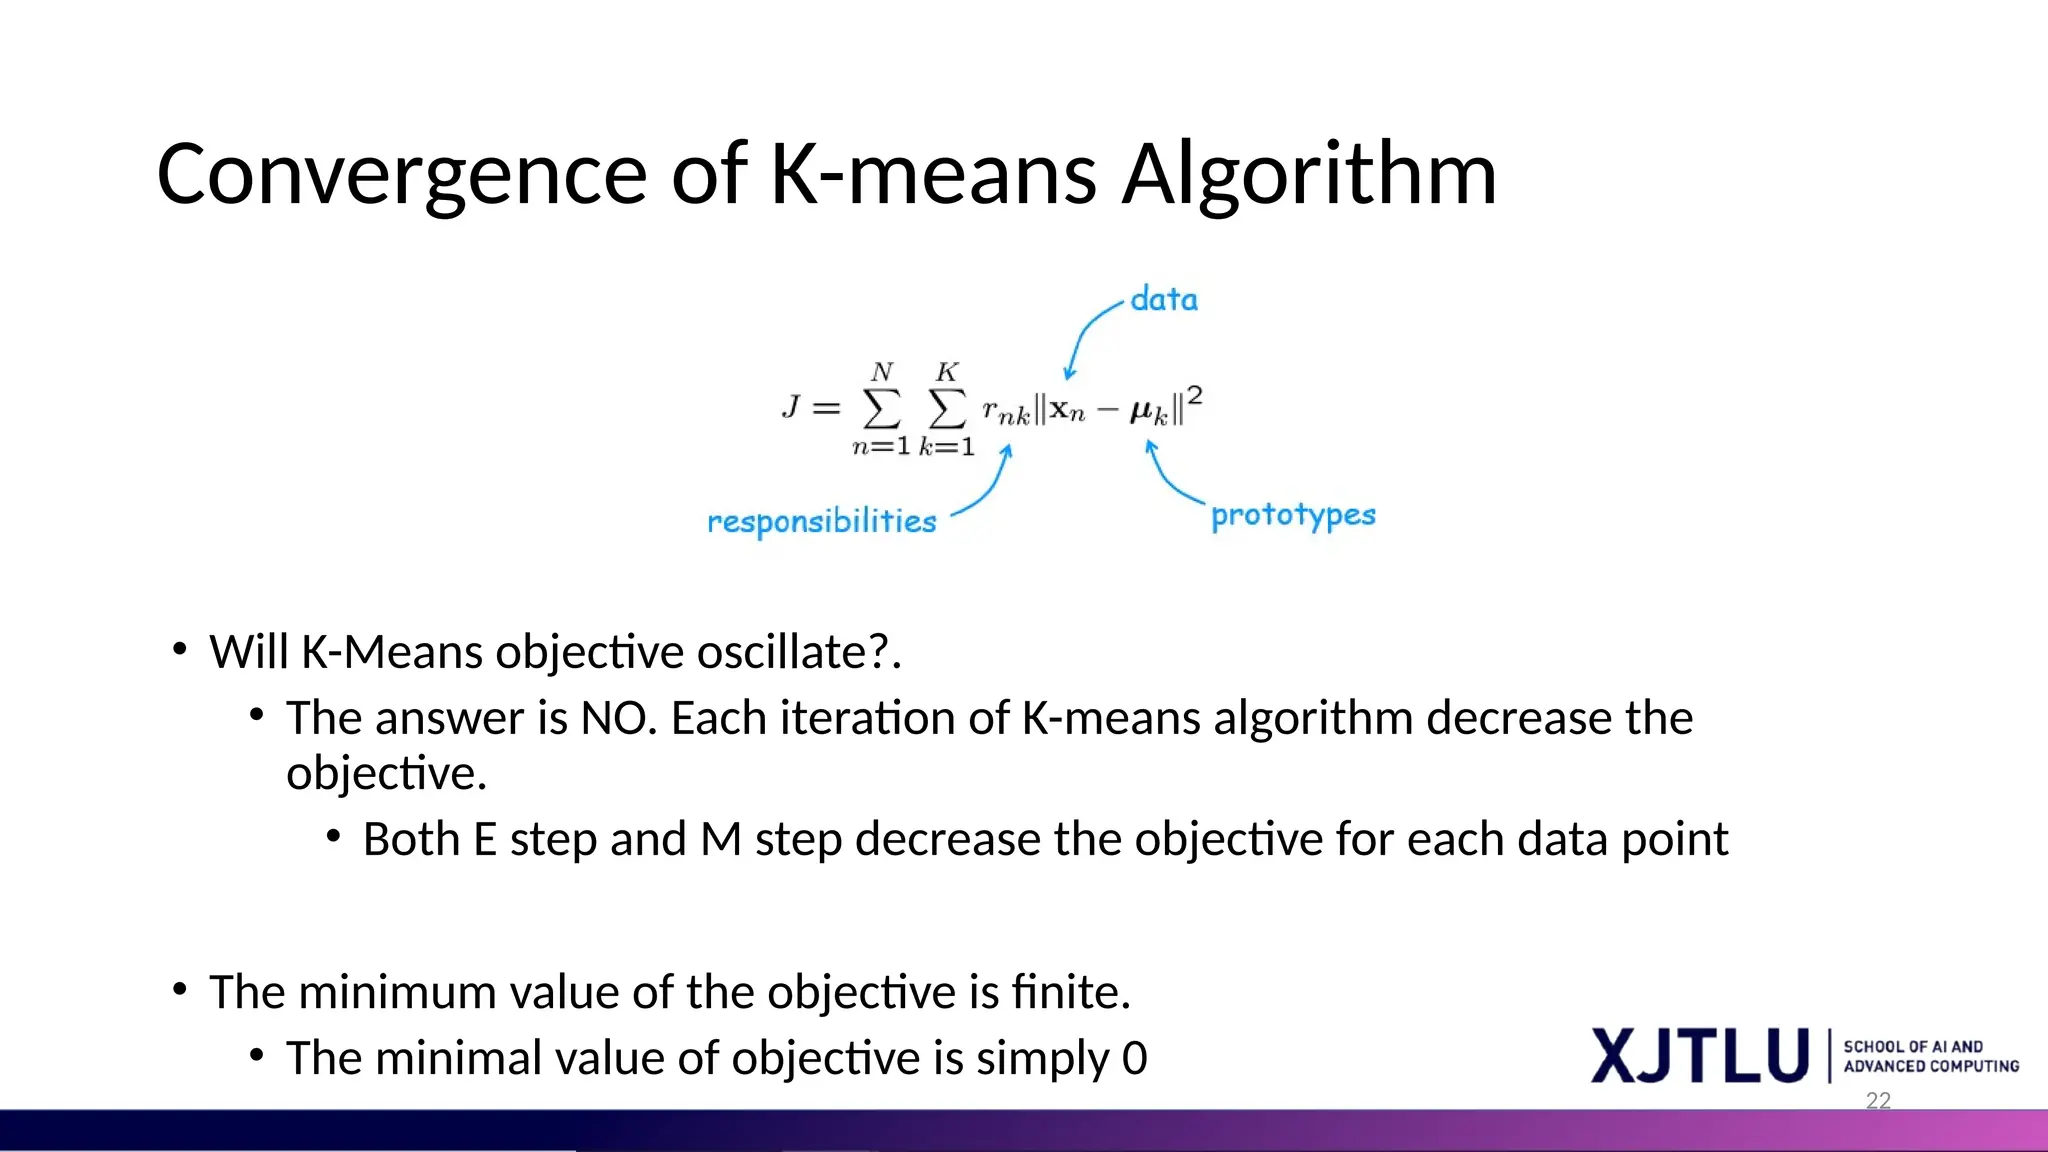
21 Convergence of K-meansAlgorithm • Will K-Means objective oscillate?. • The answer is NO. Each iteration of K-means algorithm decrease the objective. • Both E step and M step decrease the objective for each data point
22.
22 Convergence of K-meansAlgorithm • Will K-Means objective oscillate?. • The answer is NO. Each iteration of K-means algorithm decrease the objective. • Both E step and M step decrease the objective for each data point • The minimum value of the objective is finite. • The minimal value of objective is simply 0
23.
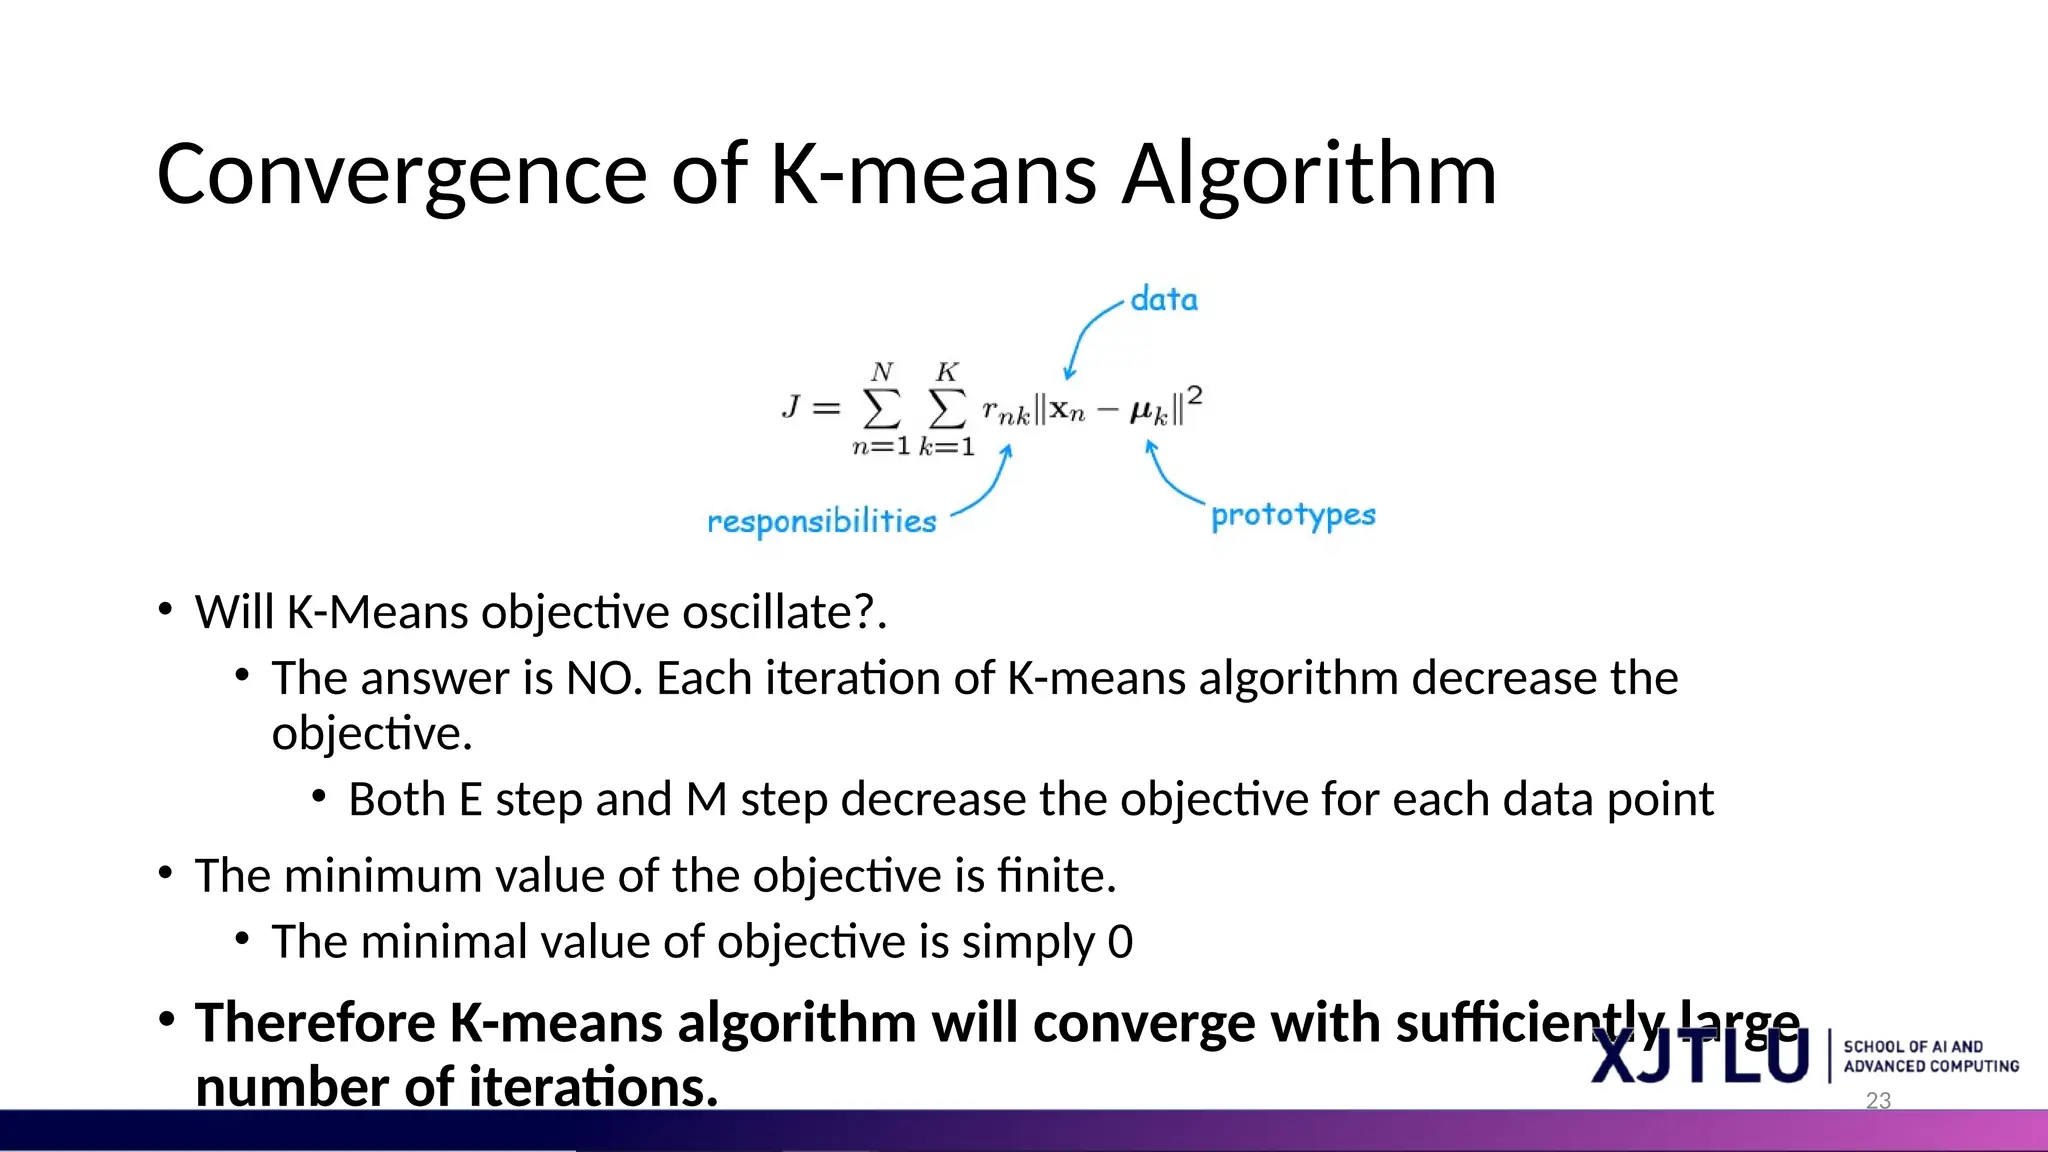
23 Convergence of K-meansAlgorithm • Will K-Means objective oscillate?. • The answer is NO. Each iteration of K-means algorithm decrease the objective. • Both E step and M step decrease the objective for each data point • The minimum value of the objective is finite. • The minimal value of objective is simply 0 • Therefore K-means algorithm will converge with sufficiently large number of iterations.
24.
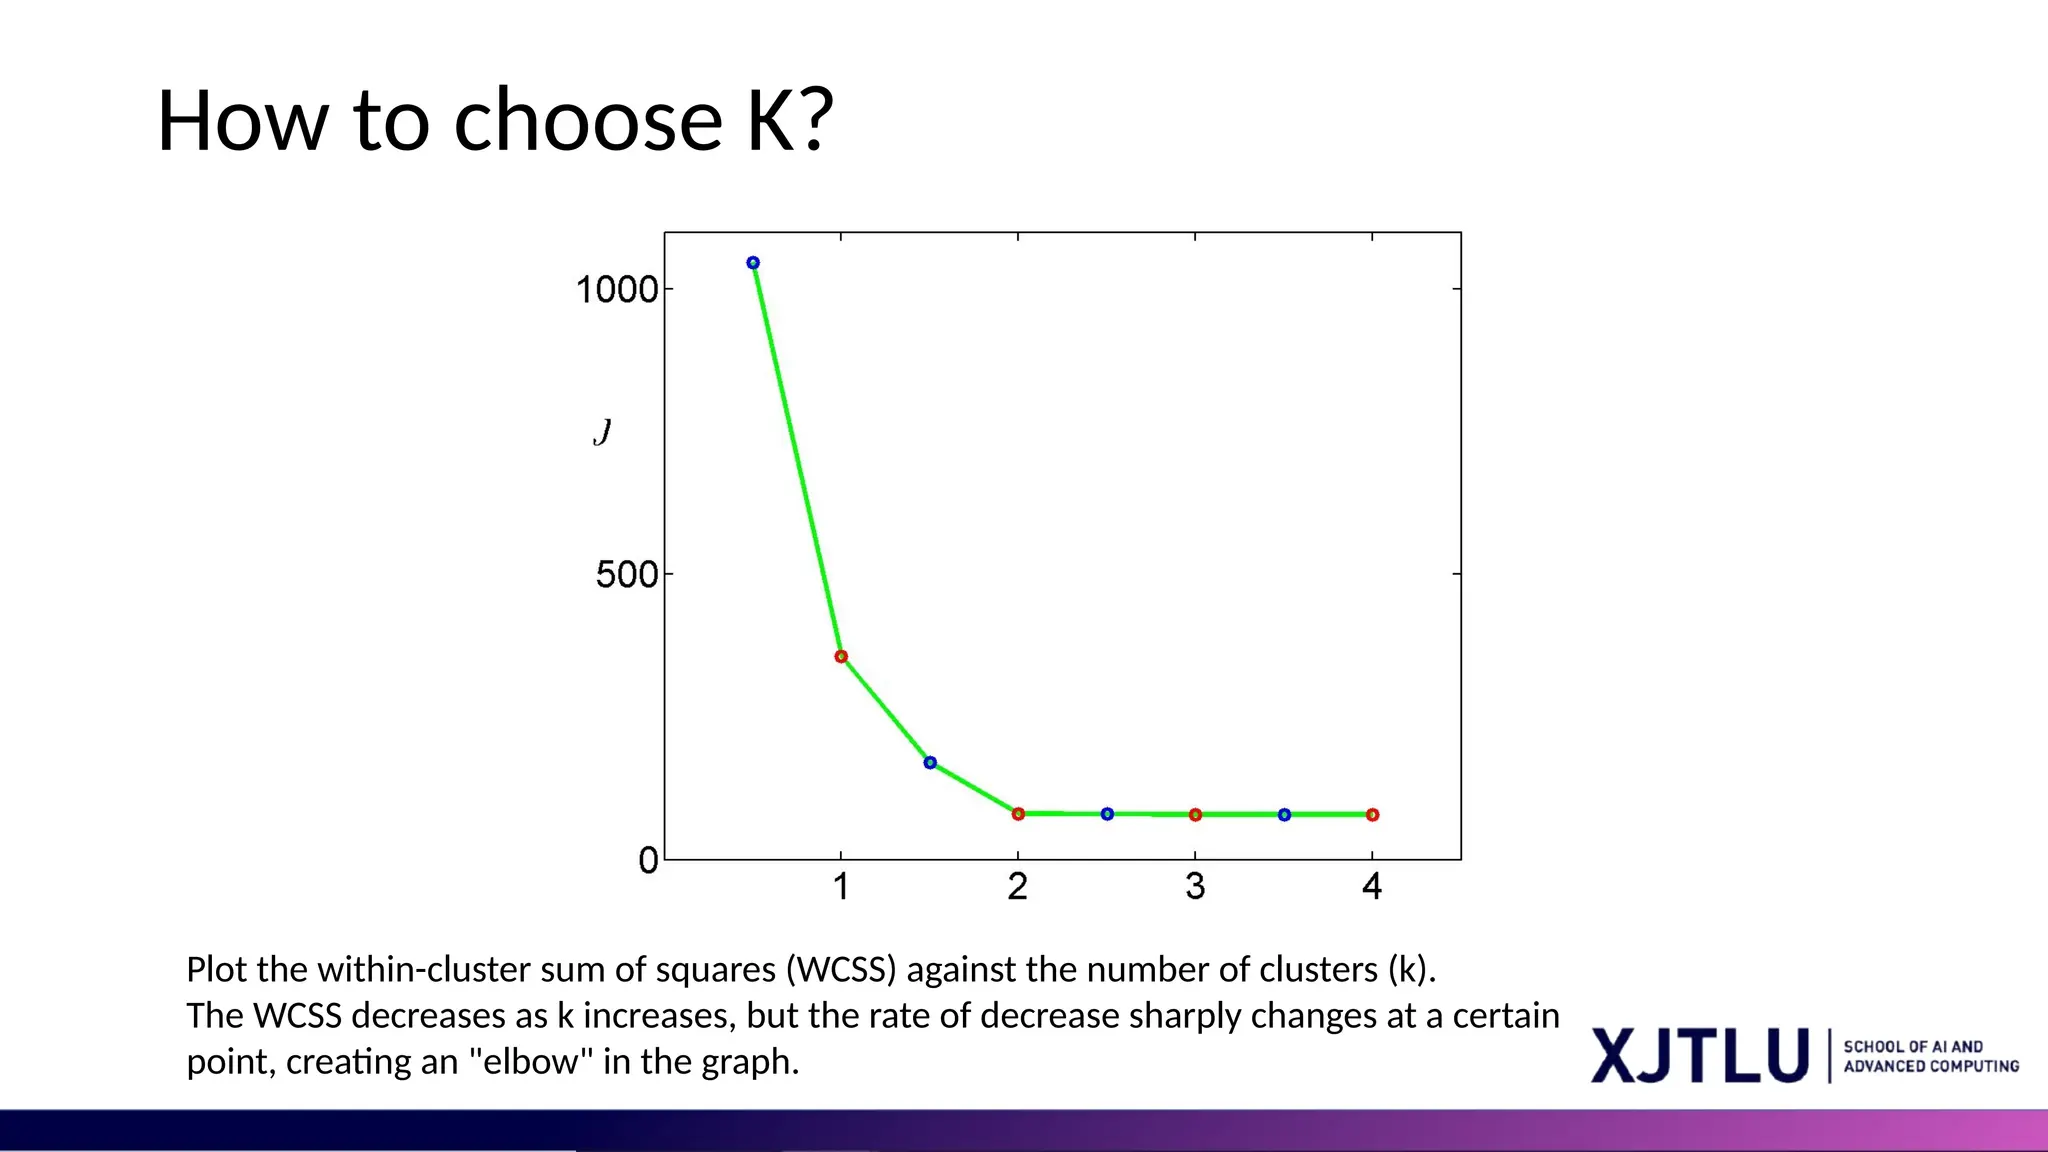
How to chooseK? Plot the within-cluster sum of squares (WCSS) against the number of clusters (k). The WCSS decreases as k increases, but the rate of decrease sharply changes at a certain point, creating an "elbow" in the graph.
25.
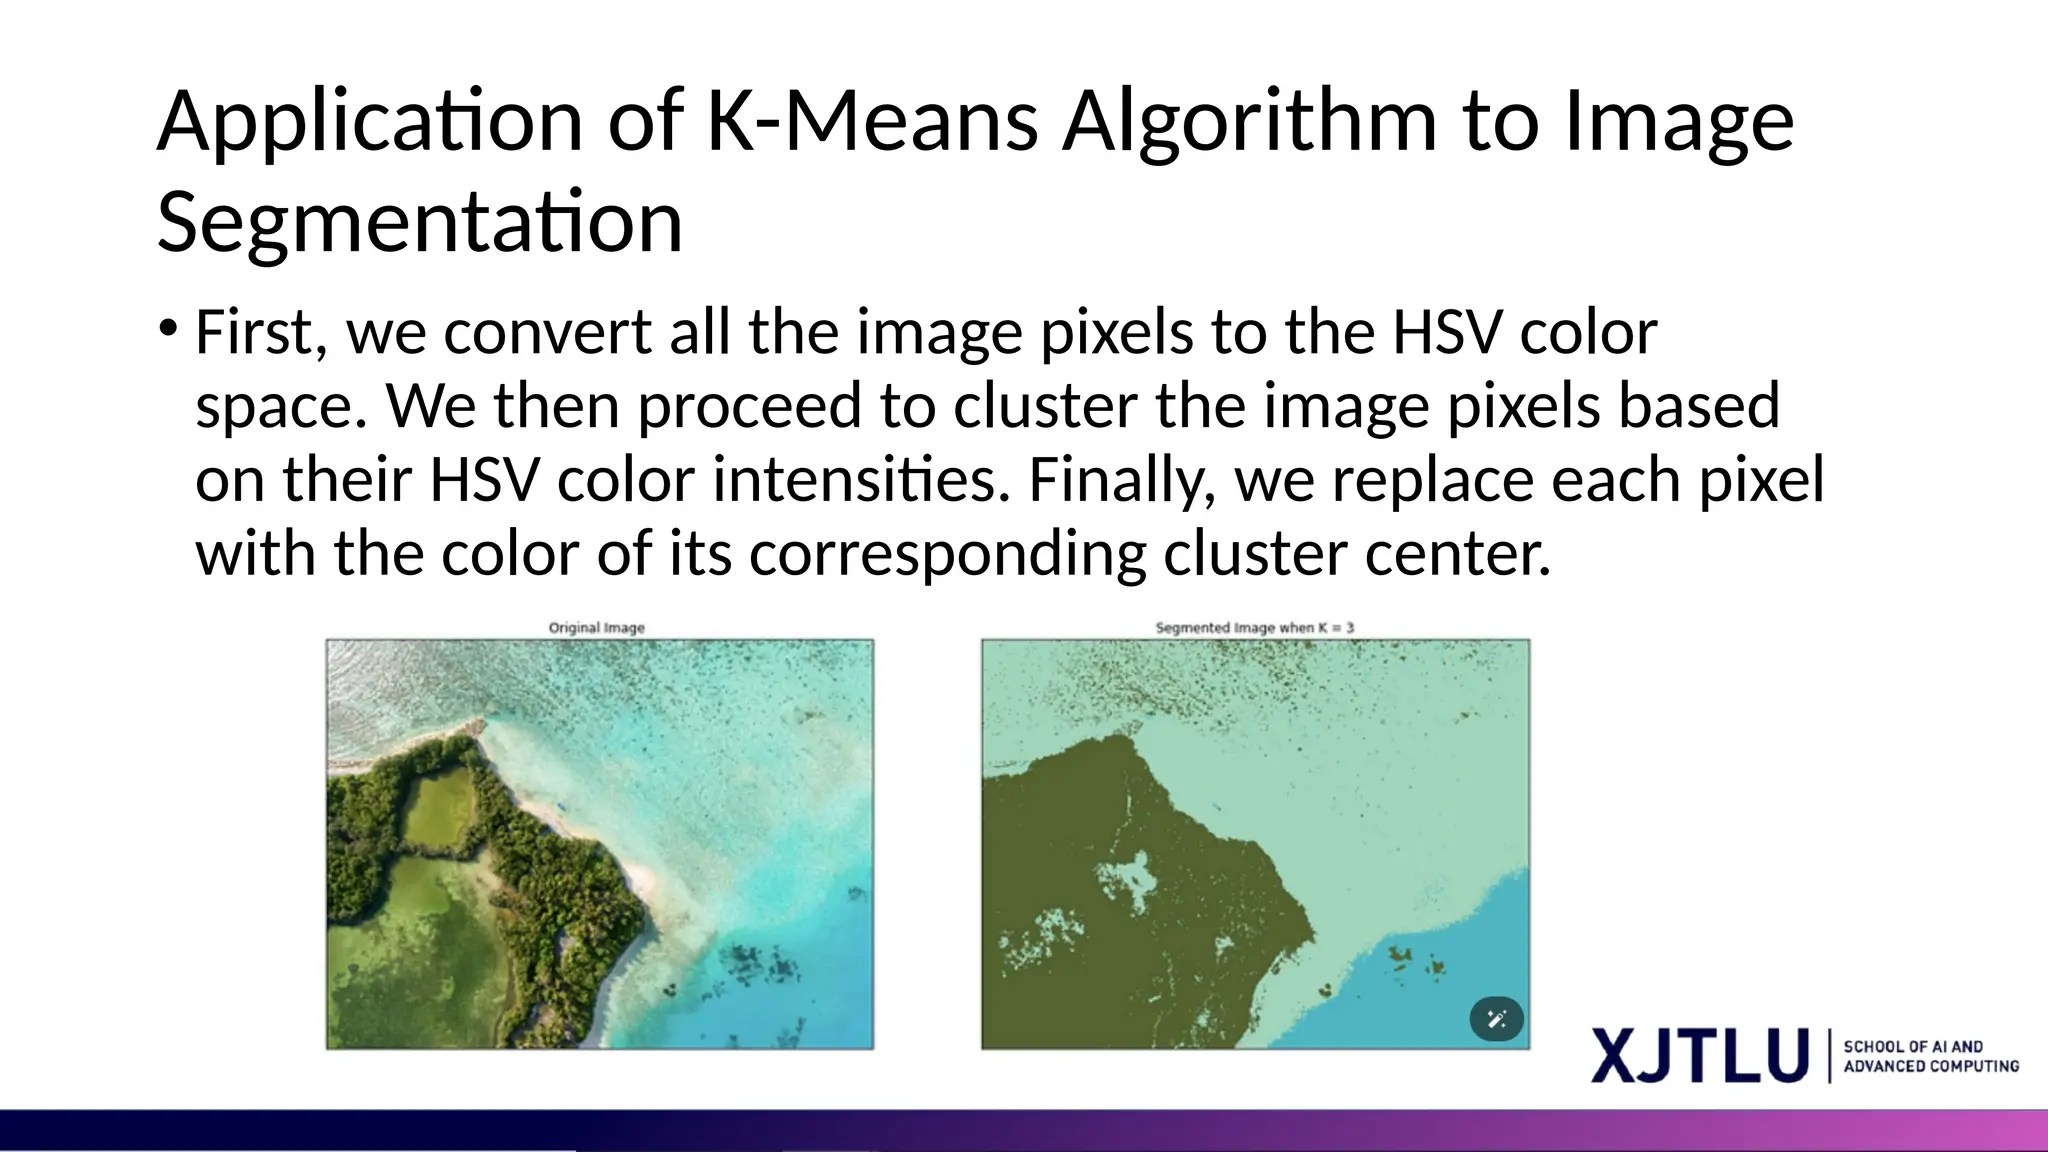
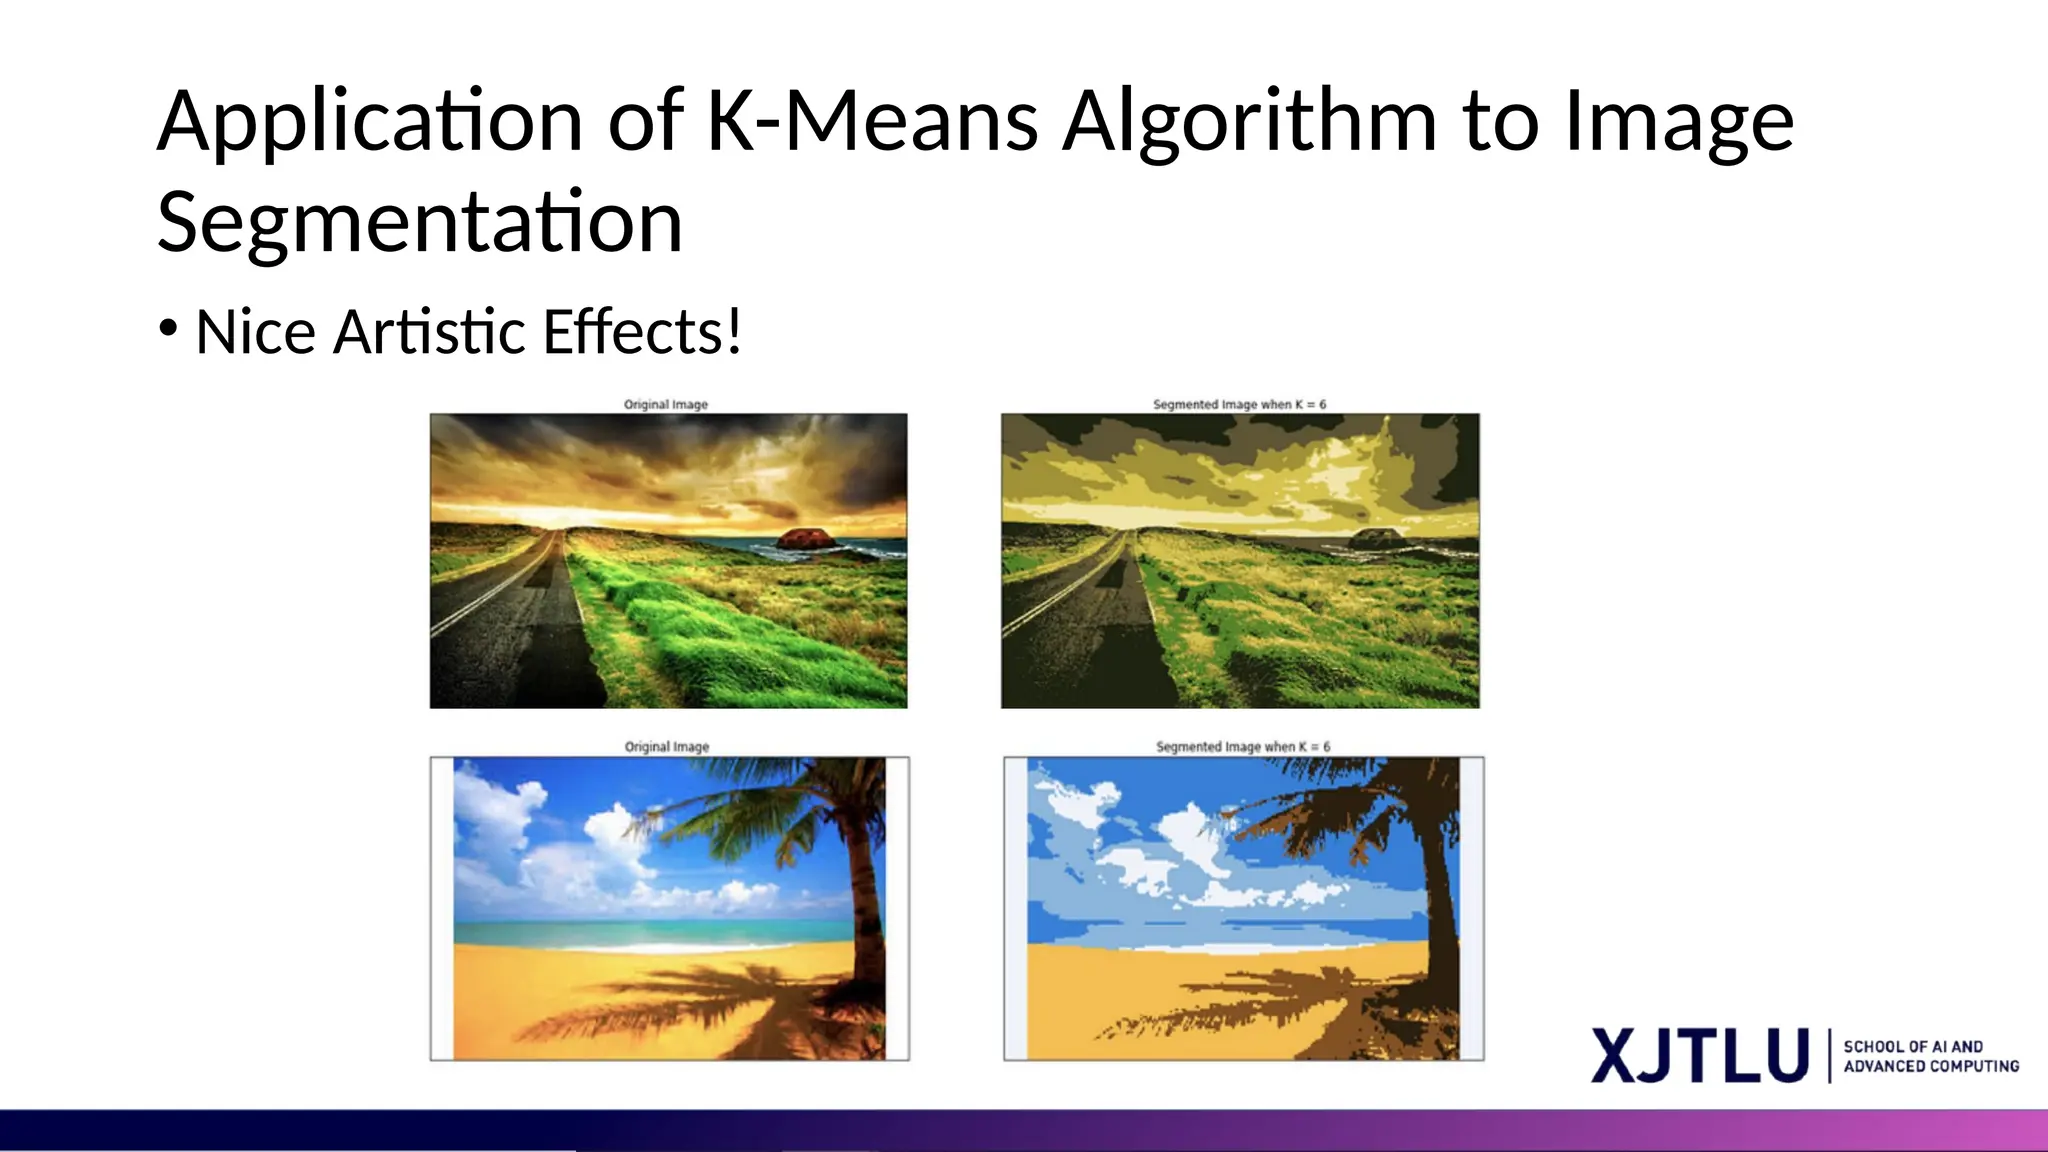
Application of K-MeansAlgorithm to Image Segmentation • First, we convert all the image pixels to the HSV color space. We then proceed to cluster the image pixels based on their HSV color intensities. Finally, we replace each pixel with the color of its corresponding cluster center.
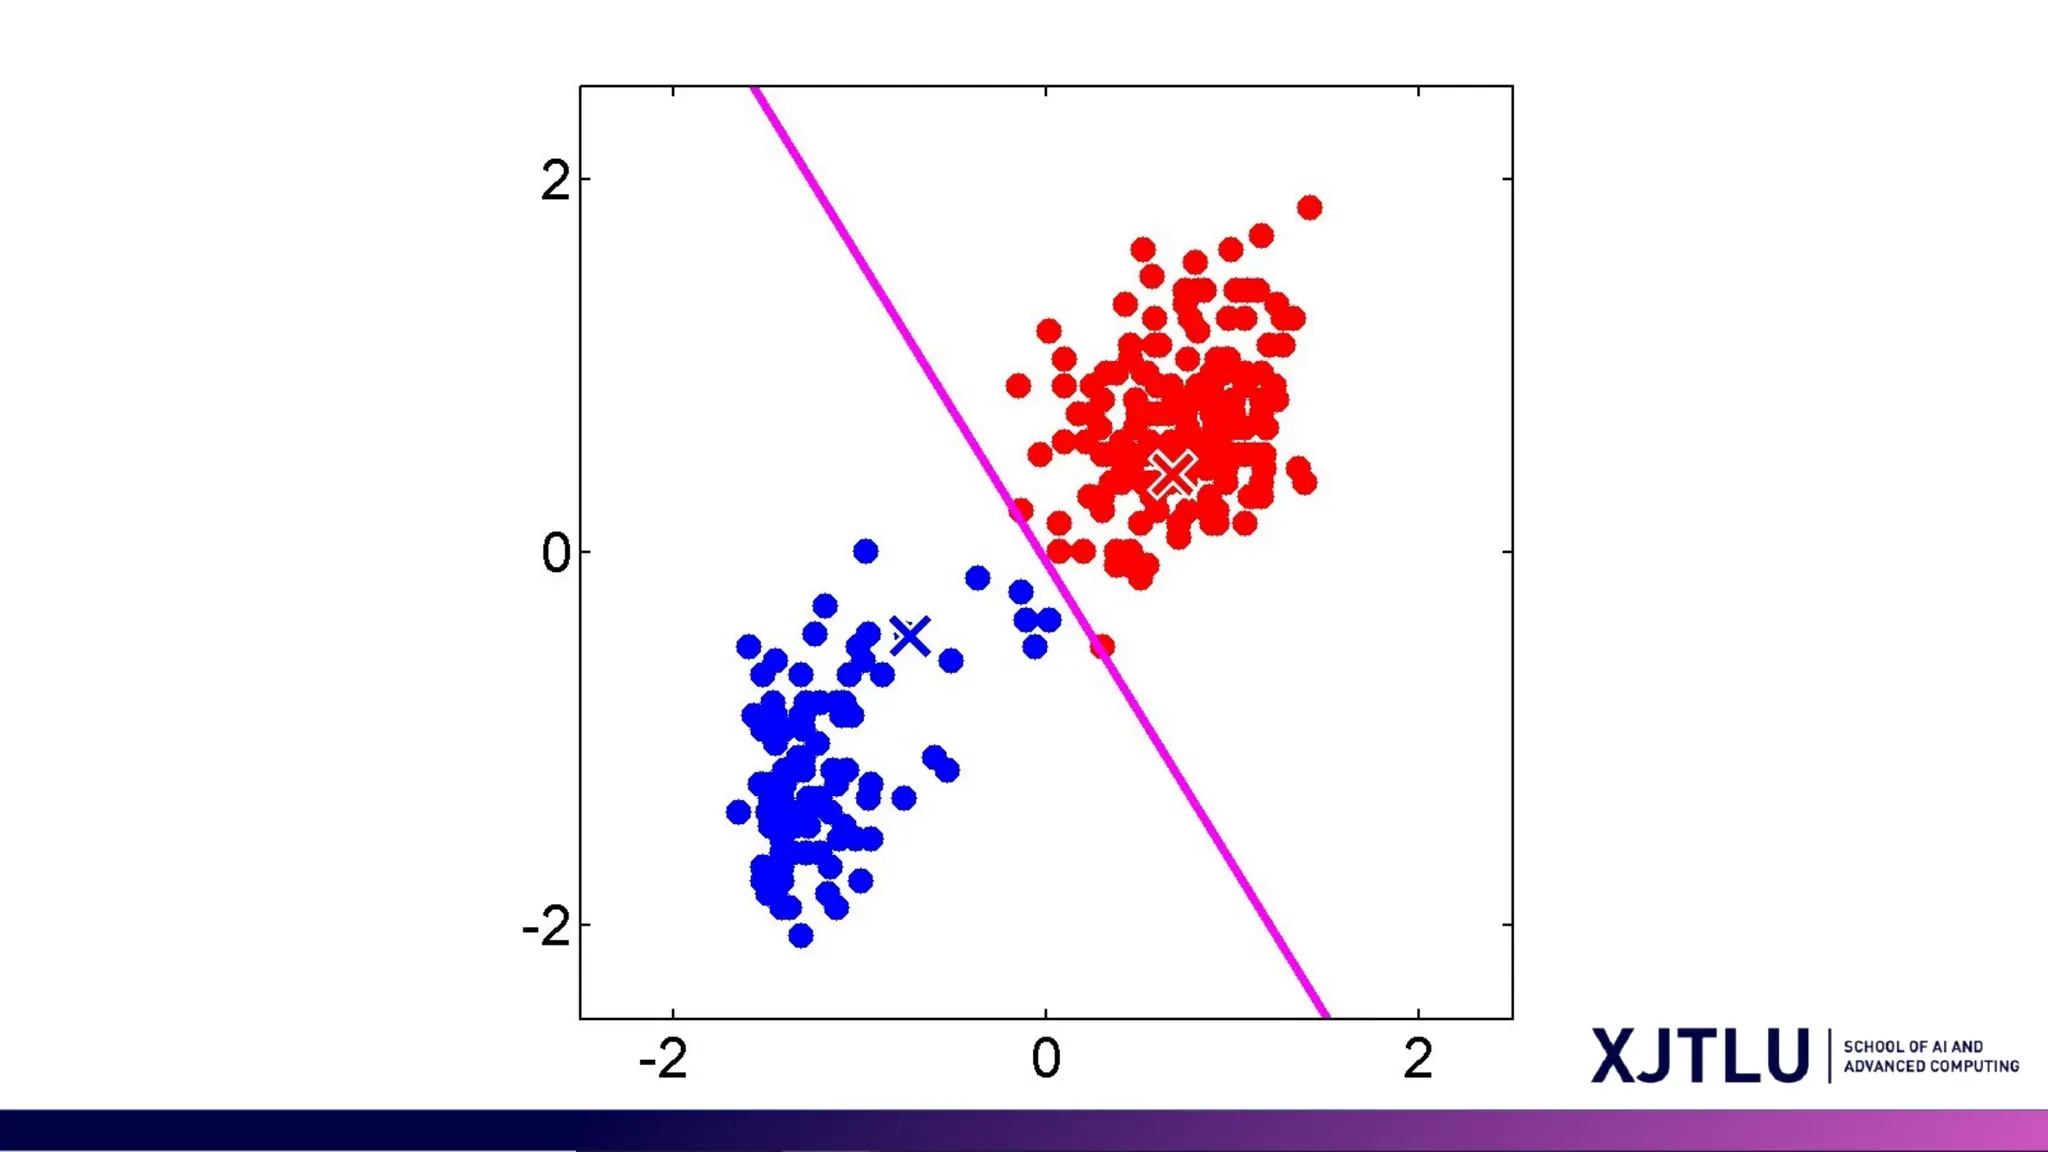
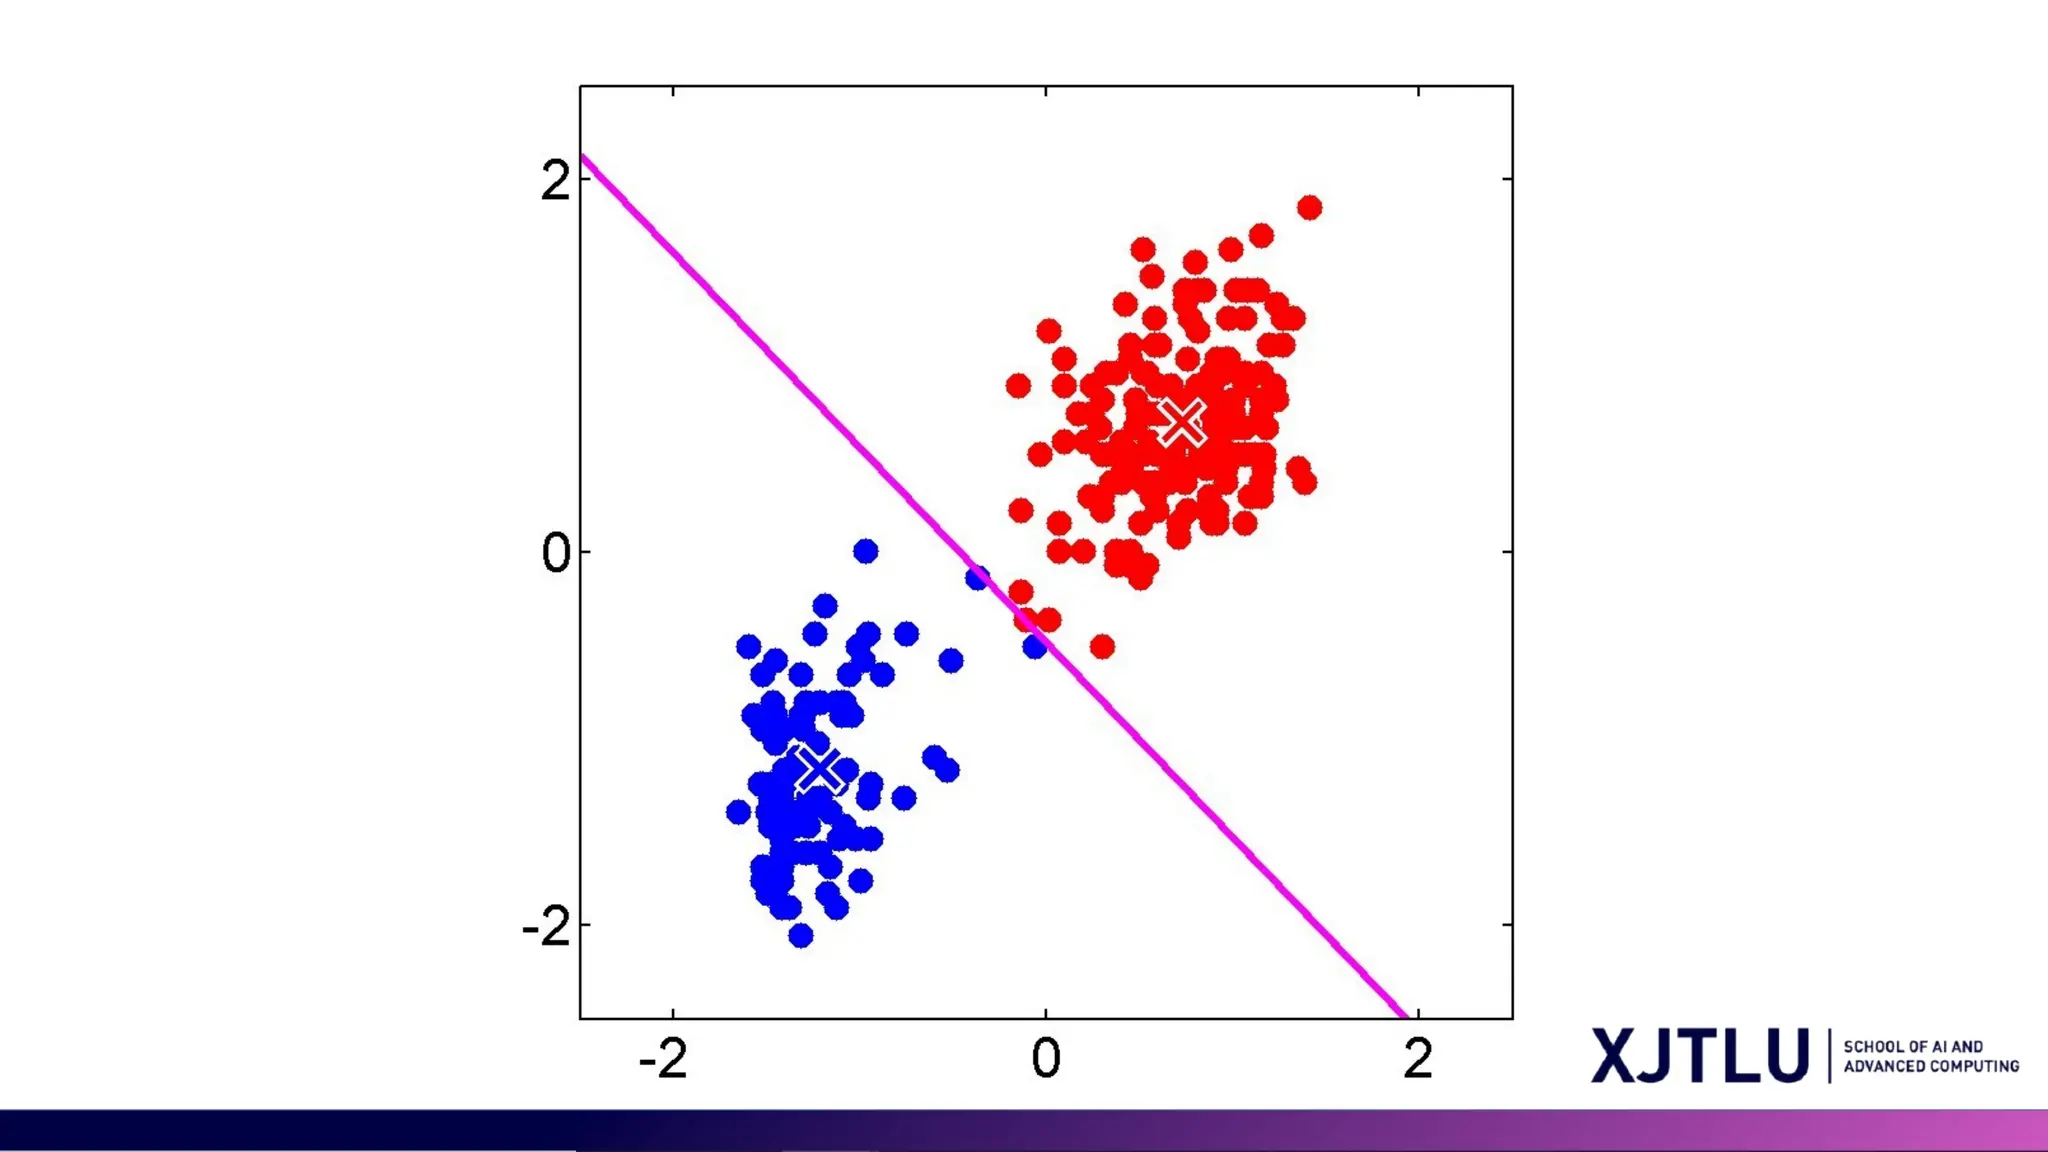
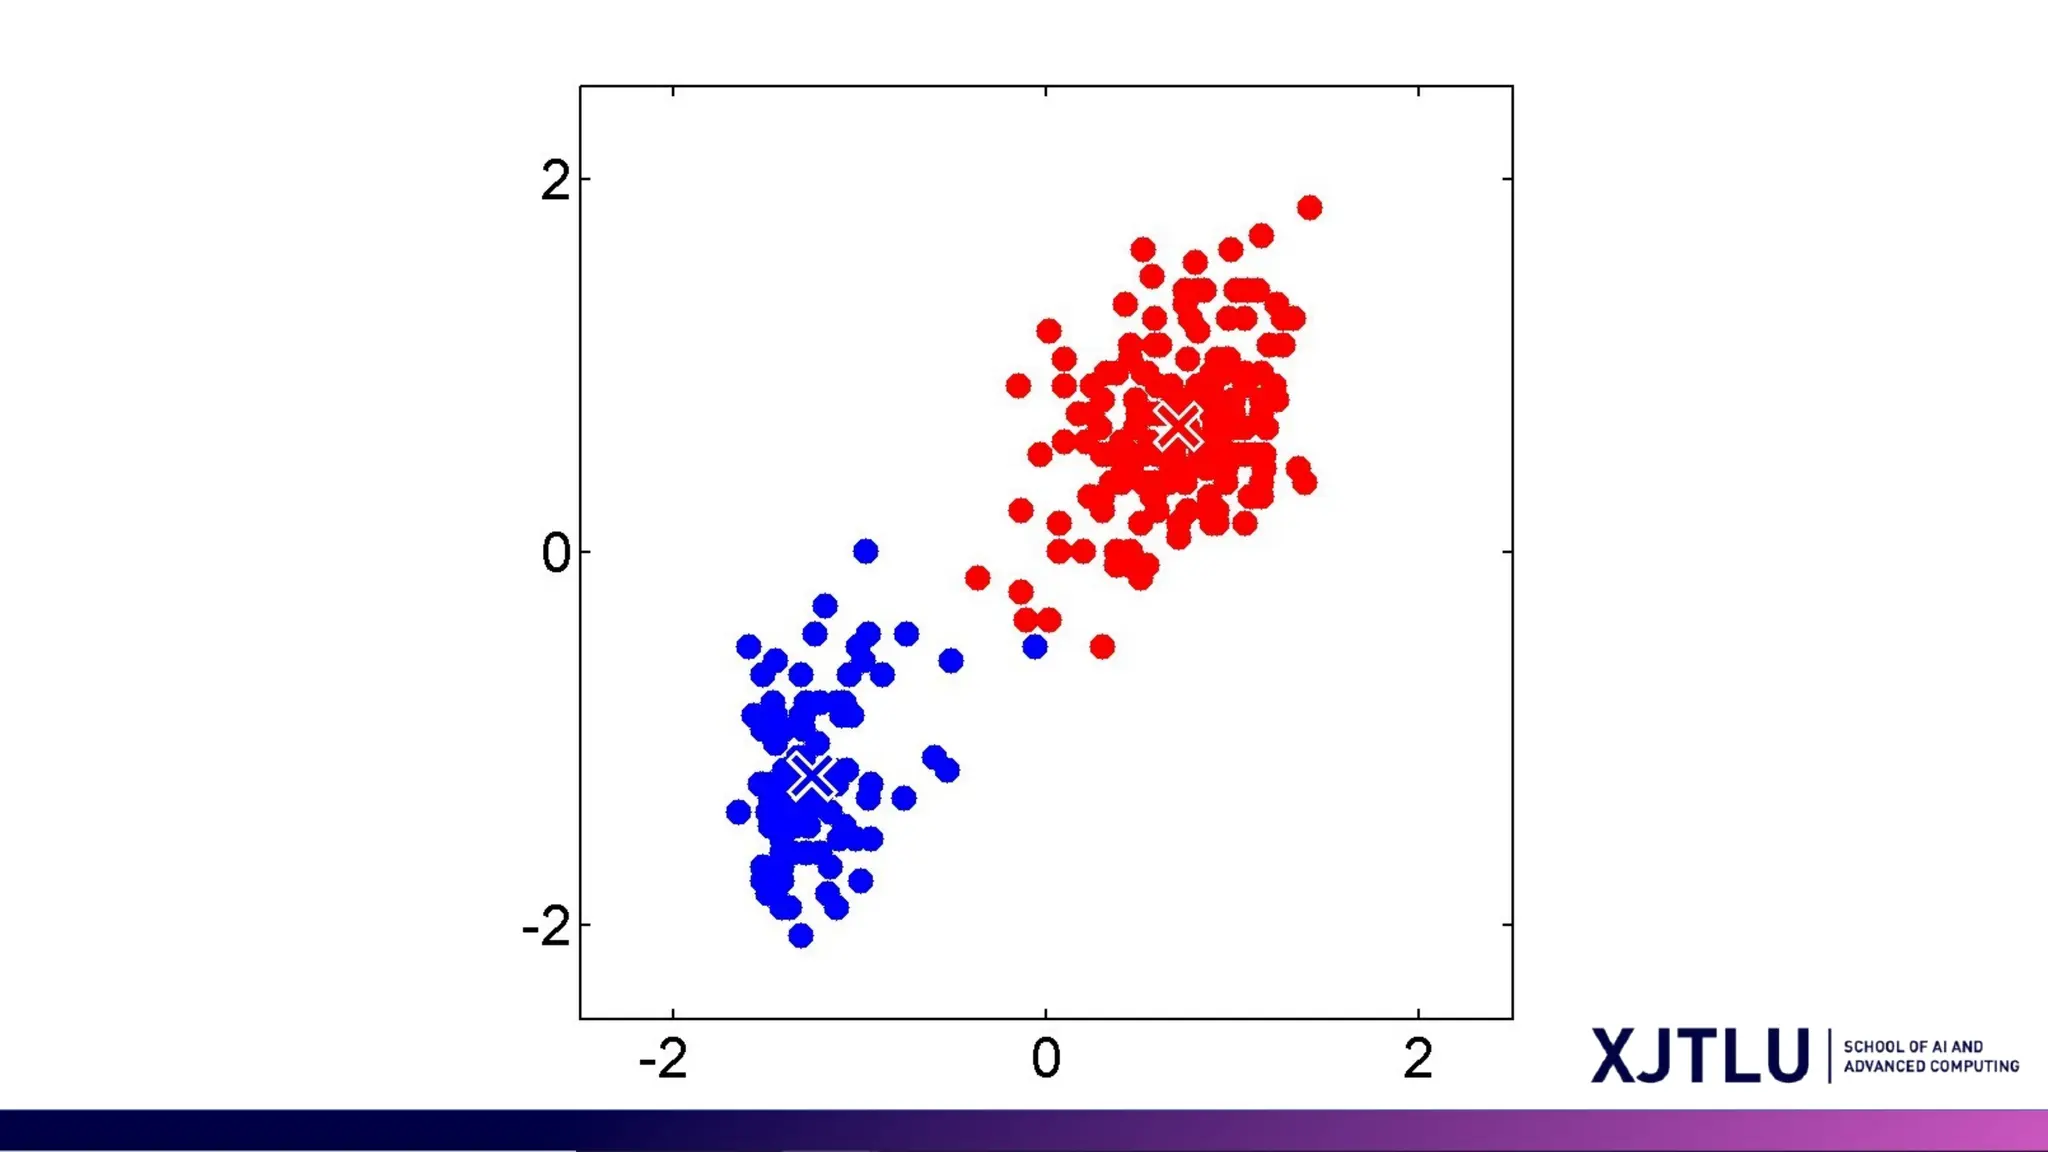
Limitations of K-means •Sensitivity to Initial Centroids: • The final results of k-means clustering are sensitive to the initial random selection of cluster centers. This can lead to different results each time k- means is run. • For certain initialization, k-means clustering will perform badly. • Q&A: How to handle the bad initialization issue?
28.
Limitations of K-means •Sensitivity to Initial Centroids: • The final results of k-means clustering are sensitive to the initial random selection of cluster centers. This can lead to different results each time k- means is run. • For certain initialization, k-means clustering will perform badly. • Q&A: How to handle the bad initialization issue? • Run k-means several times with different random initializations and choose the clustering result with the lowest objective score (lowest within-cluster sum of squares (WCSS))
29.
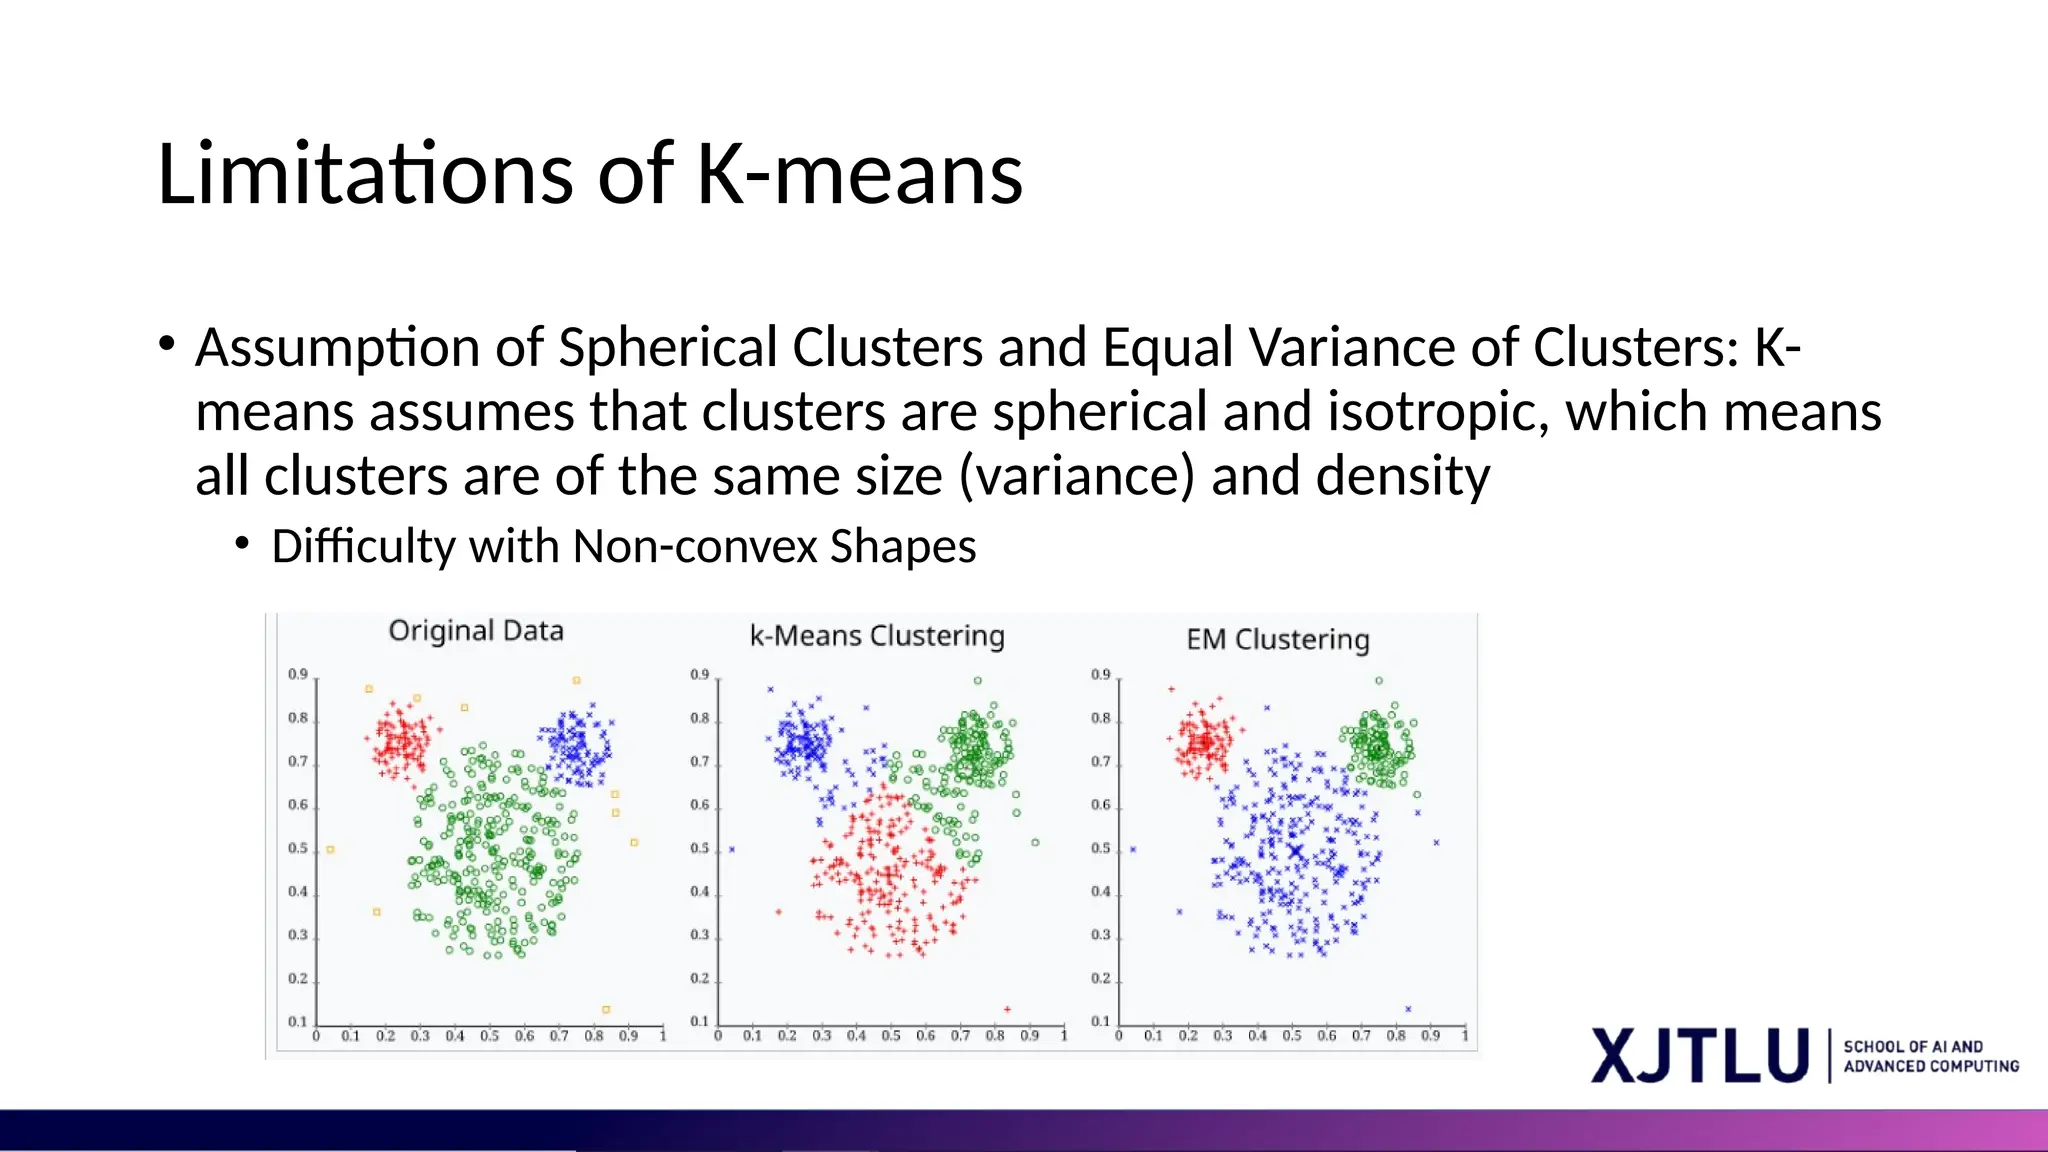
Limitations of K-means •Assumption of Spherical Clusters and Equal Variance of Clusters: K- means assumes that clusters are spherical and isotropic, which means all clusters are of the same size (variance) and density • Difficulty with Non-convex Shapes
30.
30 Limitations of Kmeans • Other limitations: • Not clear how to choose the value of K • Sensitivity to Outliers • Scalability with High Dimensionality GMM can resolve some but not all the above issues.
Editor's Notes
#6 Our goal is to organize a big bunch of data into K groups, and for each group, we'll pick one item to be its example or "prototype." First, we choose some starting prototypes. Then we do two steps over and over: First, the E-step, where we put each piece of data into the group with the closest prototype. Second, the M-step, where we find the average of all the items in each group and make that the new prototype. We keep doing this until the groups make sense. We measure closeness by the simplest method, which is like measuring a straight line distance between points, called Euclidean distance.
#24 Plot the within-cluster sum of squares (WCSS) against the number of clusters (k). The WCSS decreases as k increases, but the rate of decrease sharply changes at a certain point, creating an "elbow" in the graph. The elbow generally represents a point where adding more clusters doesn't explain much more variance in the data. Choose k at this point.