


![Demo: K-Means Clustering %matplotlib inline import matplotlib.pyplot as plt # for plot styling import seaborn as sns; sns.set() import numpy as np from sklearn.datasets.samples_generator import make_blobs X, y_true = make_blobs(n_samples=300, centers=4, cluster_std=0.60, random_state=0) plt.scatter(X[:, 0], X[:, 1], s=50);](https://image.slidesharecdn.com/kmeansclusteringalgorithmkmeansclusteringexamplemachinelearningalgorithmssimplilearn-180323072616/75/K-Means-Clustering-Algorithm-K-Means-Clustering-Example-Machine-Learning-Algorithms-Simplilearn-48-2048.jpg)

![Demo: K-Means Clustering # assign four clusters from sklearn.cluster import KMeans kmeans = KMeans(n_clusters=4) kmeans.fit(X) y_kmeans = kmeans.predict(X) # import library from sklearn.metrics import pairwise_distances_argmin def find_clusters(X, n_clusters, rseed=2): # 1. randomly choose clusters rng = np.random.RandomState(rseed) i = rng.permutation(X.shape[0])[:n_clusters] centers = X[i] while True:](https://image.slidesharecdn.com/kmeansclusteringalgorithmkmeansclusteringexamplemachinelearningalgorithmssimplilearn-180323072616/75/K-Means-Clustering-Algorithm-K-Means-Clustering-Example-Machine-Learning-Algorithms-Simplilearn-50-2048.jpg)
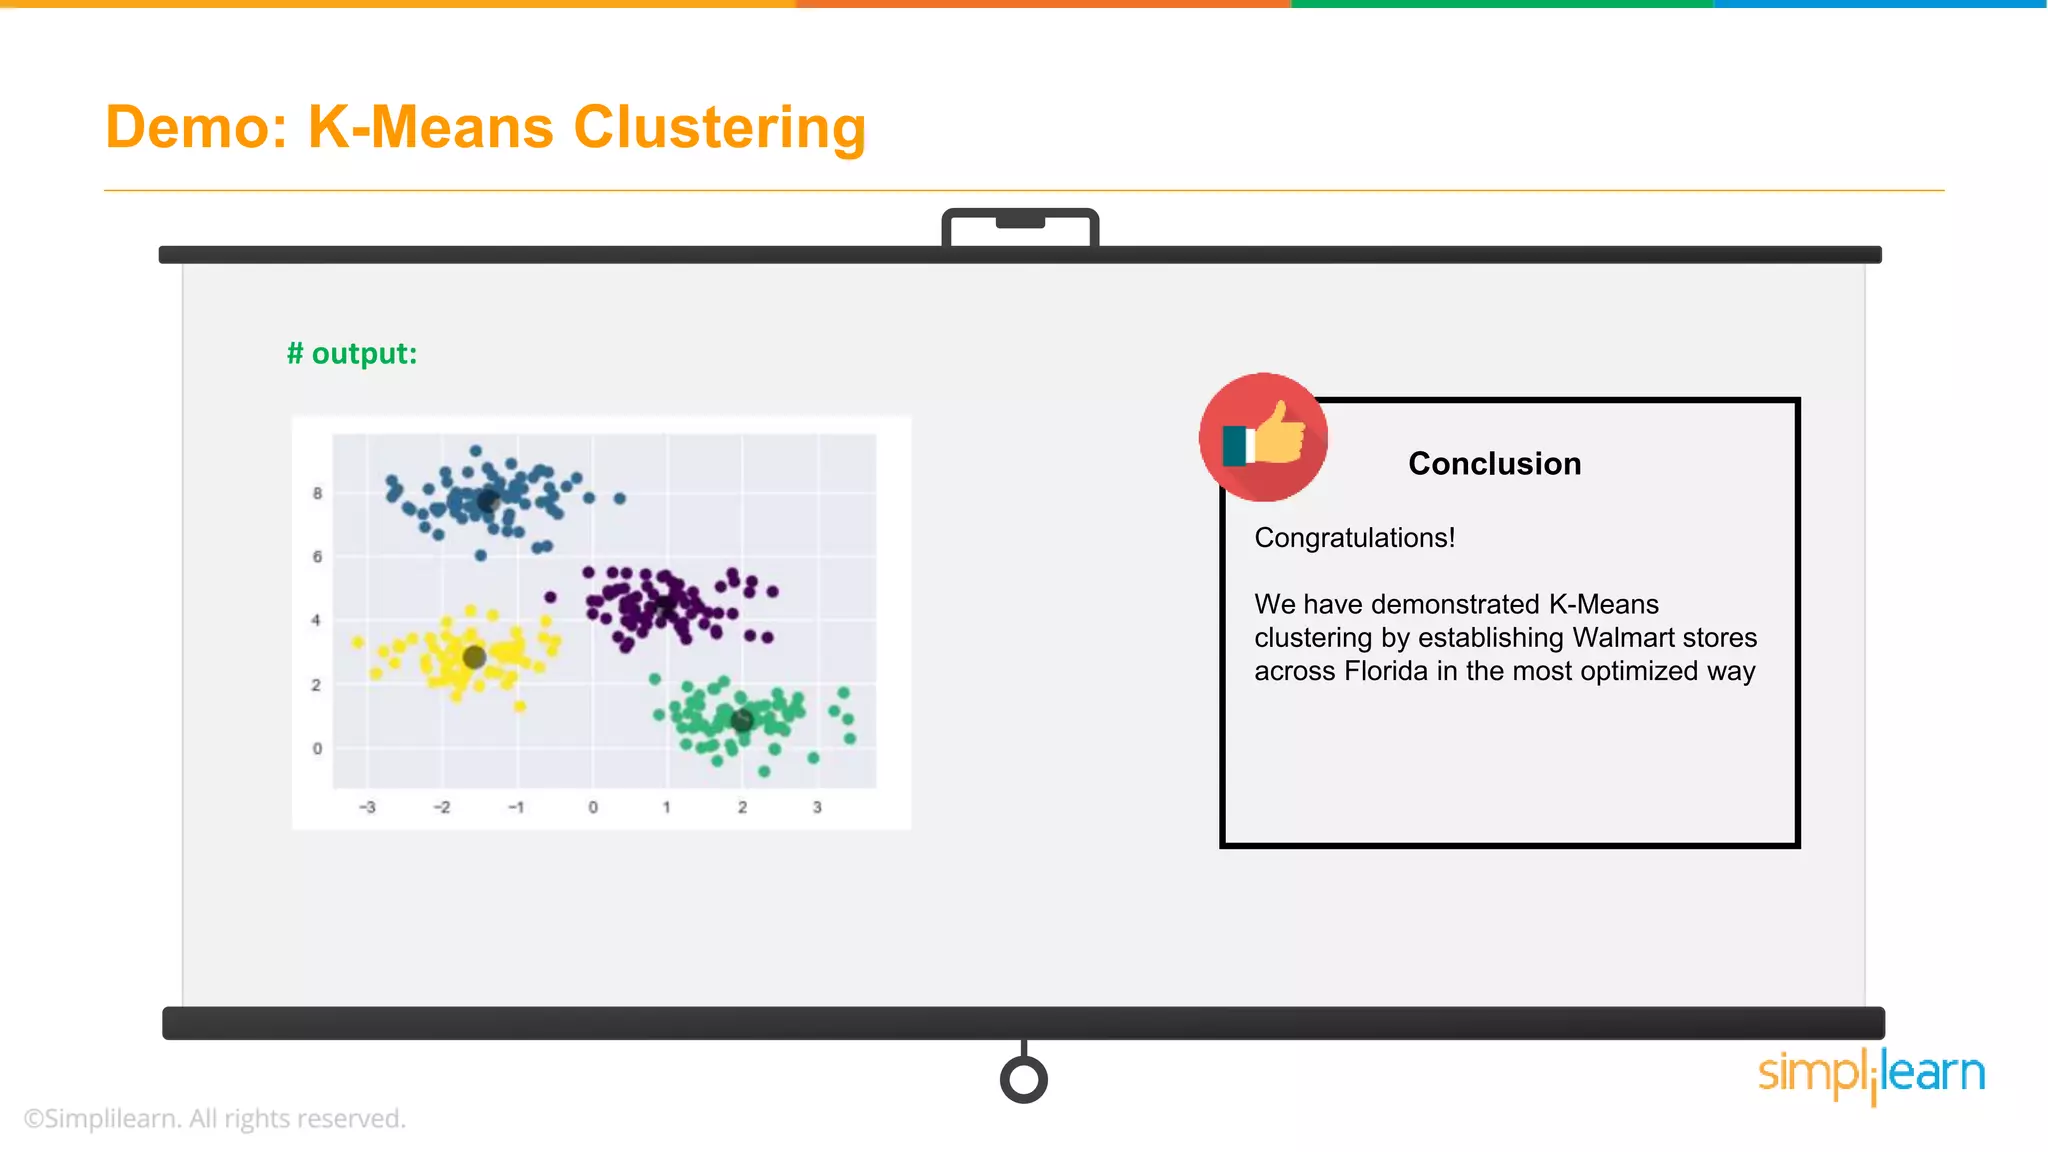
![Demo: K-Means Clustering # 2. assign labels based on closest center labels = pairwise_distances_argmin(X, centers) # 3. find new centers from means of points new_centers = np.array([X[labels == i].mean(0) for i in range(n_clusters)]) centers, labels = find_clusters(X, 4) plt.scatter(X[:, 0], X[:, 1], c=labels, s=50, cmap='viridis’)](https://image.slidesharecdn.com/kmeansclusteringalgorithmkmeansclusteringexamplemachinelearningalgorithmssimplilearn-180323072616/75/K-Means-Clustering-Algorithm-K-Means-Clustering-Example-Machine-Learning-Algorithms-Simplilearn-51-2048.jpg)
![Demo: K-Means Clustering # 4. check for convergence if np.all(centers == new_centers): break centers = new_centers return centers, labels centers, labels = find_clusters(X, 4) plt.scatter(X[:, 0], X[:, 1], c=y_kmeans, s=50, cmap='viridis') plt.scatter(centers[:, 0], centers[:, 1], c='black', s=200, alpha=0.5);](https://image.slidesharecdn.com/kmeansclusteringalgorithmkmeansclusteringexamplemachinelearningalgorithmssimplilearn-180323072616/75/K-Means-Clustering-Algorithm-K-Means-Clustering-Example-Machine-Learning-Algorithms-Simplilearn-52-2048.jpg)
![Use Case: K-Means for Color Compression # example 1: # note: this requires the ``pillow`` package to be installed from sklearn.datasets import load_sample_image china = load_sample_image("flower.jpg") ax = plt.axes(xticks=[], yticks=[]) ax.imshow(china); #Output:](https://image.slidesharecdn.com/kmeansclusteringalgorithmkmeansclusteringexamplemachinelearningalgorithmssimplilearn-180323072616/75/K-Means-Clustering-Algorithm-K-Means-Clustering-Example-Machine-Learning-Algorithms-Simplilearn-56-2048.jpg)
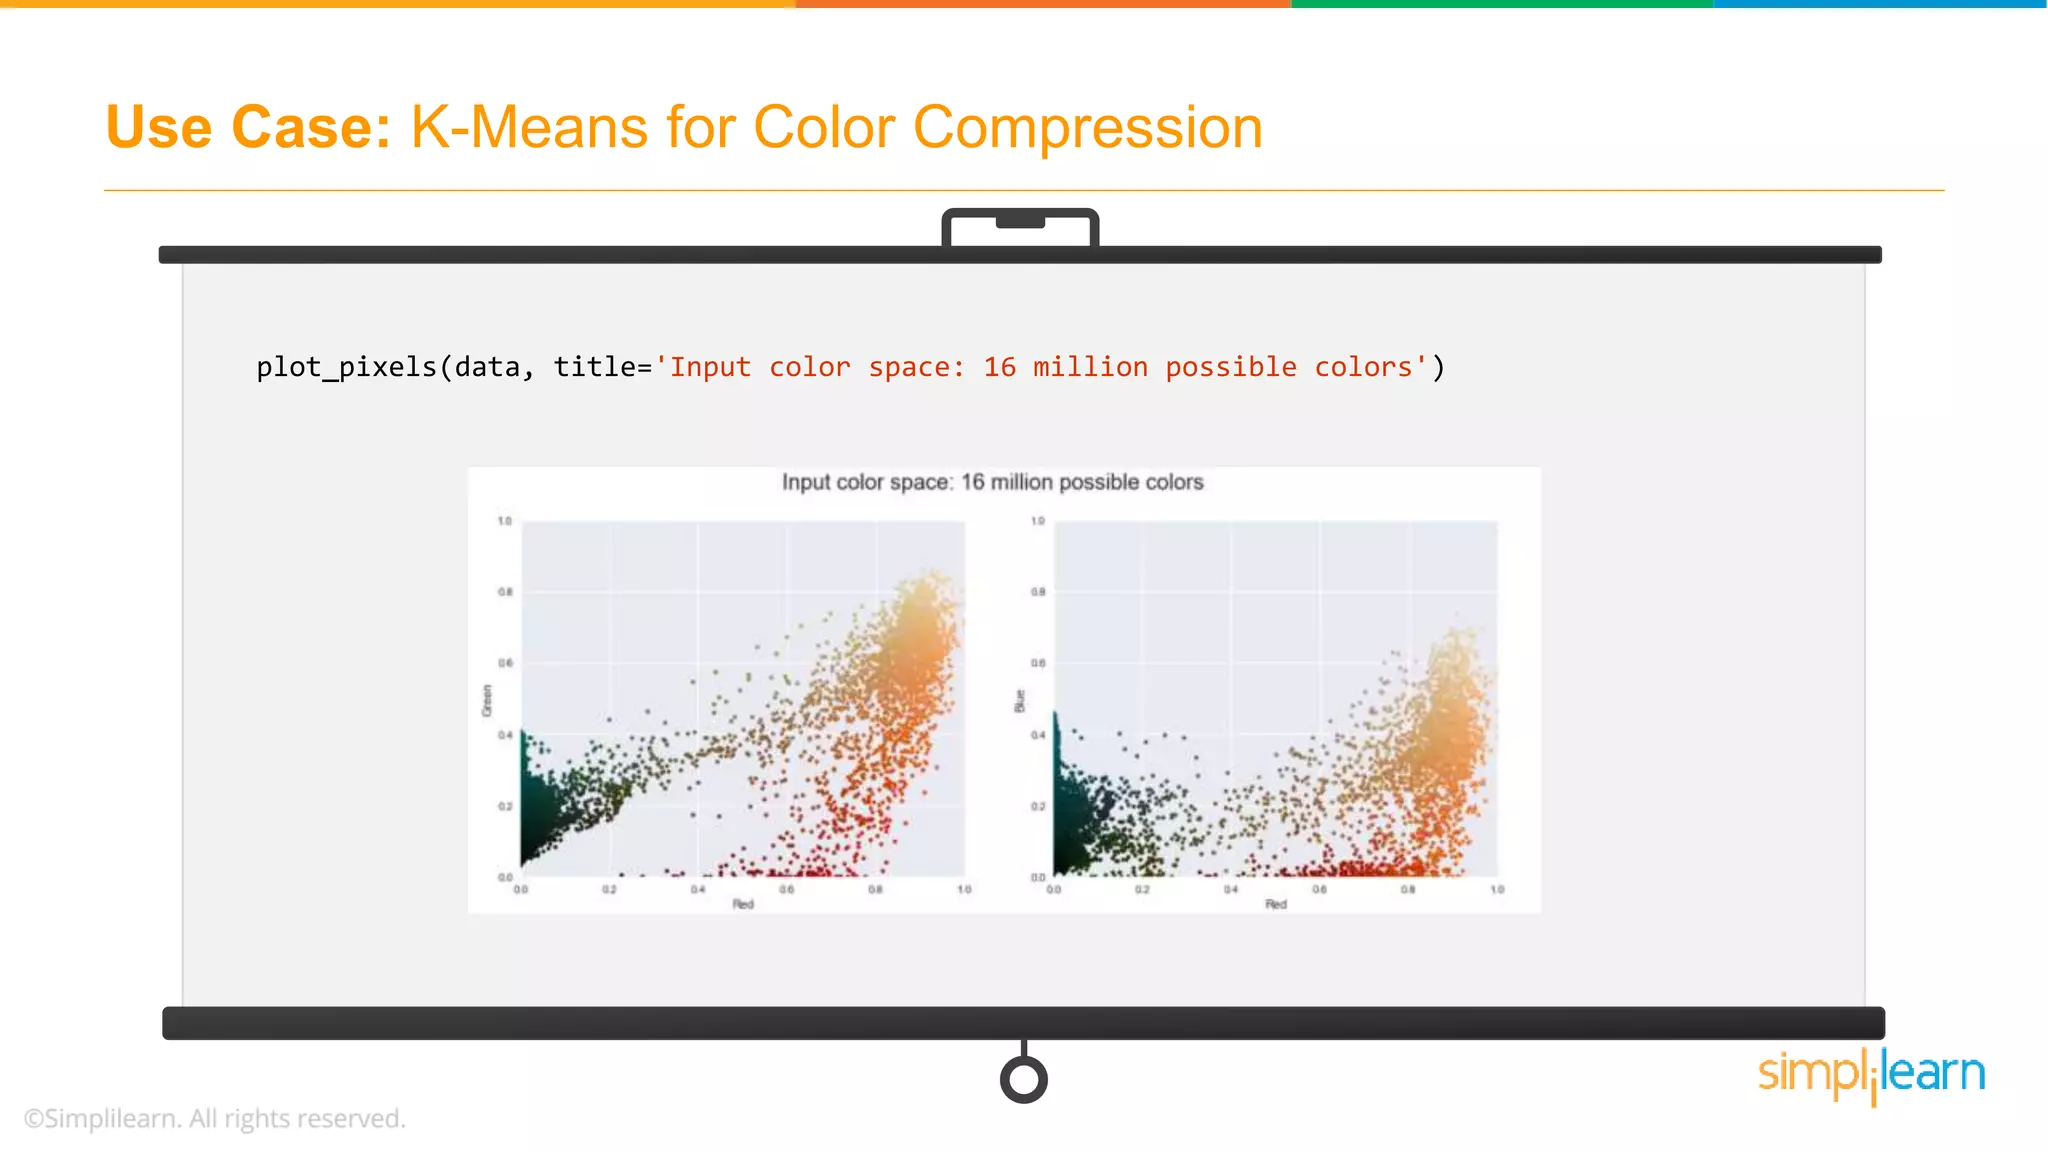
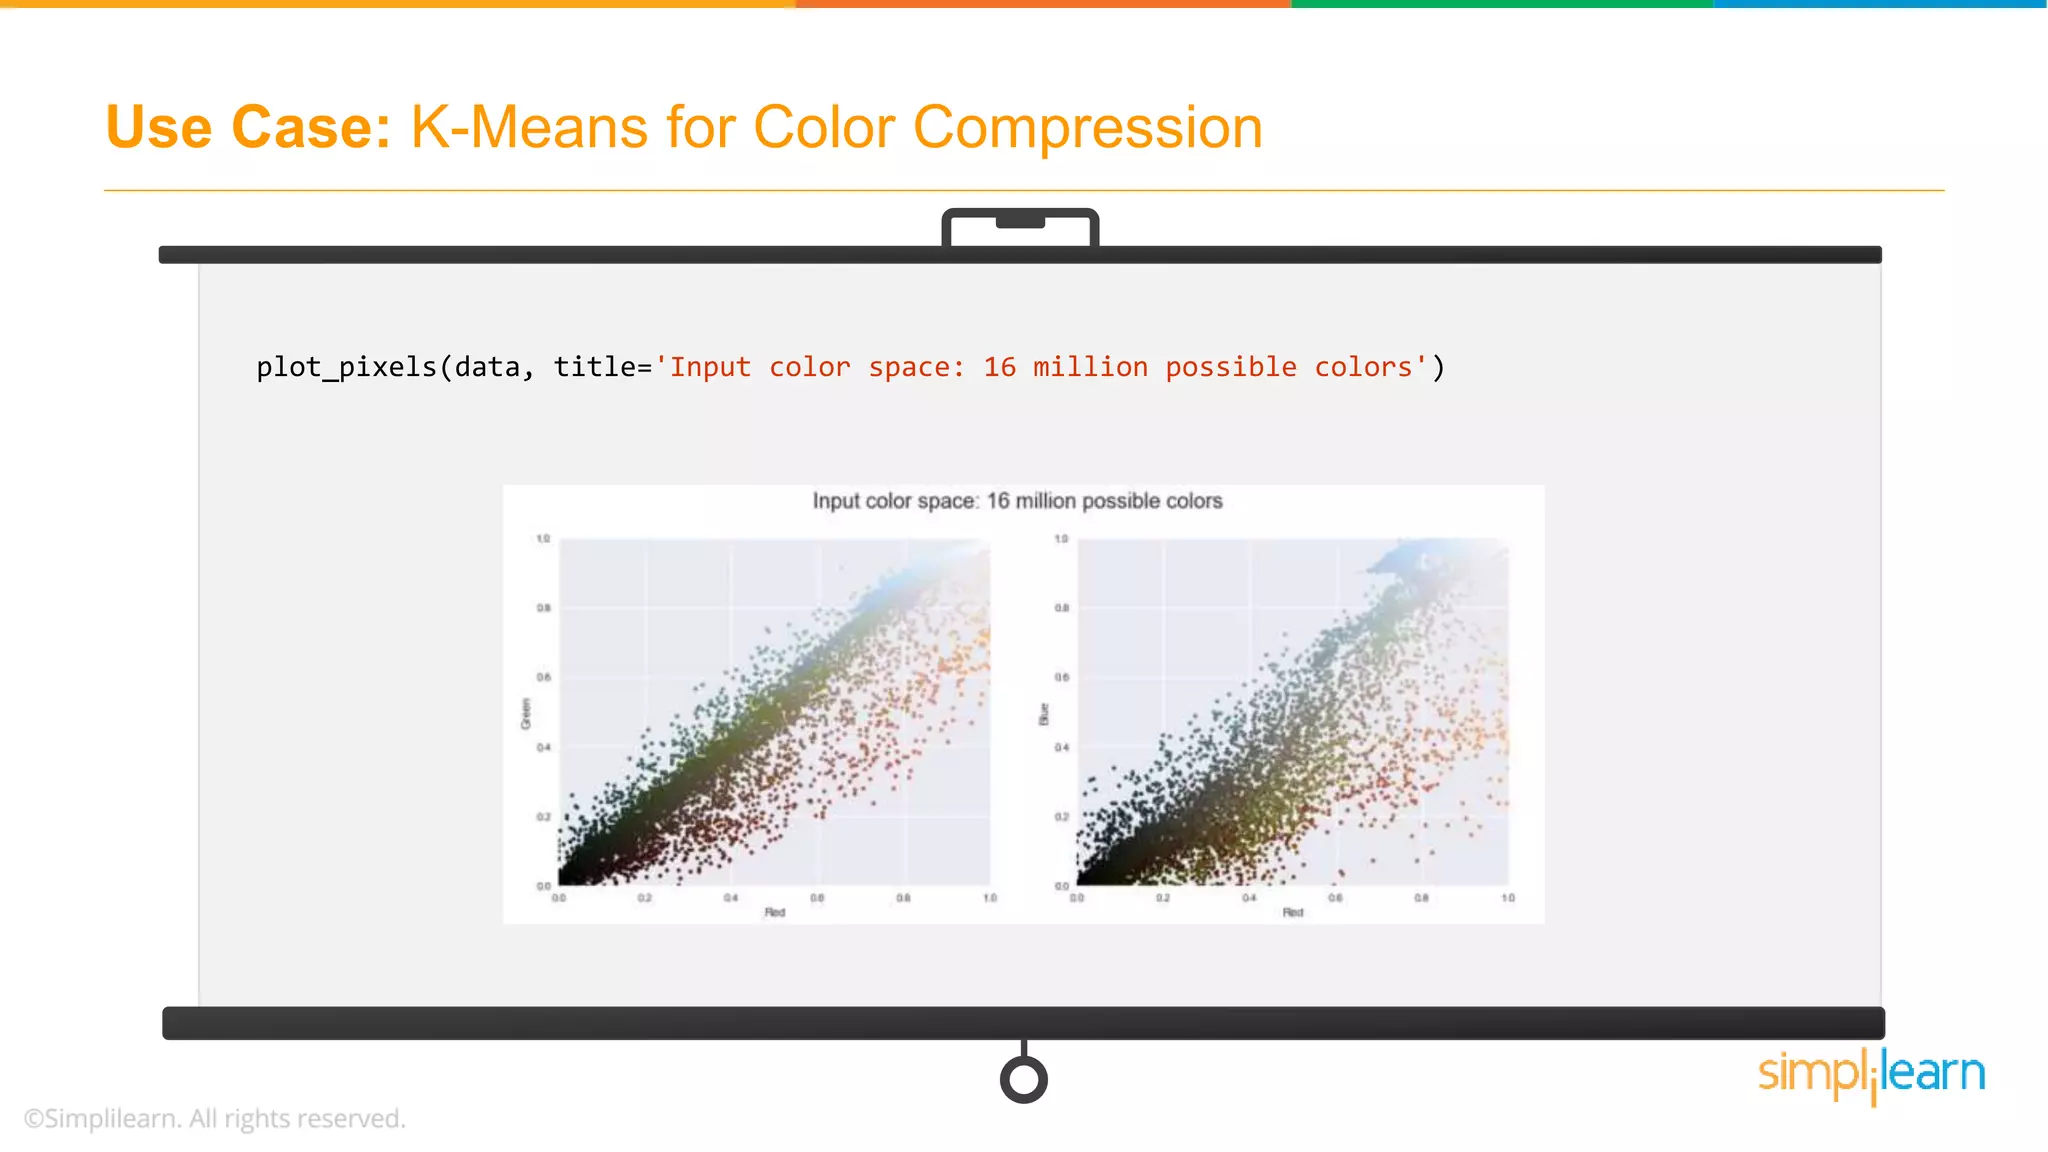
![Use Case: K-Means for Color Compression # returns the dimensions of the array china.shape # reshape the data to [n_samples x n_features], and rescale the colors so that they lie between 0 and 1 data = china / 255.0 # use 0...1 scale data = data.reshape(427 * 640, 3) data.shape # visualize these pixels in this color space, using a subset of 10,000 pixels for efficiency def plot_pixels(data, title, colors=None, N=10000): if colors is None: colors = data](https://image.slidesharecdn.com/kmeansclusteringalgorithmkmeansclusteringexamplemachinelearningalgorithmssimplilearn-180323072616/75/K-Means-Clustering-Algorithm-K-Means-Clustering-Example-Machine-Learning-Algorithms-Simplilearn-57-2048.jpg)
![Use Case: K-Means for Color Compression # choose a random subset rng = np.random.RandomState(0) i = rng.permutation(data.shape[0])[:N] colors = colors[i] R, G, B = data[i].T fig, ax = plt.subplots(1, 2, figsize=(16, 6)) ax[0].scatter(R, G, color=colors, marker='.') ax[0].set(xlabel='Red', ylabel='Green', xlim=(0, 1), ylim=(0, 1)) ax[1].scatter(R, B, color=colors, marker='.') ax[1].set(xlabel='Red', ylabel='Blue', xlim=(0, 1), ylim=(0, 1)) fig.suptitle(title, size=20);](https://image.slidesharecdn.com/kmeansclusteringalgorithmkmeansclusteringexamplemachinelearningalgorithmssimplilearn-180323072616/75/K-Means-Clustering-Algorithm-K-Means-Clustering-Example-Machine-Learning-Algorithms-Simplilearn-58-2048.jpg)
![Use Case: K-Means for Color Compression # fix numPy issues import warnings; warnings.simplefilter('ignore’) # reducing these 16 million colors to just 16 colors from sklearn.cluster import MiniBatchKMeans kmeans = MiniBatchKMeans(16) kmeans.fit(data) new_colors = kmeans.cluster_centers_[kmeans.predict(data)] plot_pixels(data, colors=new_colors, title="Reduced color space: 16 colors")](https://image.slidesharecdn.com/kmeansclusteringalgorithmkmeansclusteringexamplemachinelearningalgorithmssimplilearn-180323072616/75/K-Means-Clustering-Algorithm-K-Means-Clustering-Example-Machine-Learning-Algorithms-Simplilearn-60-2048.jpg)
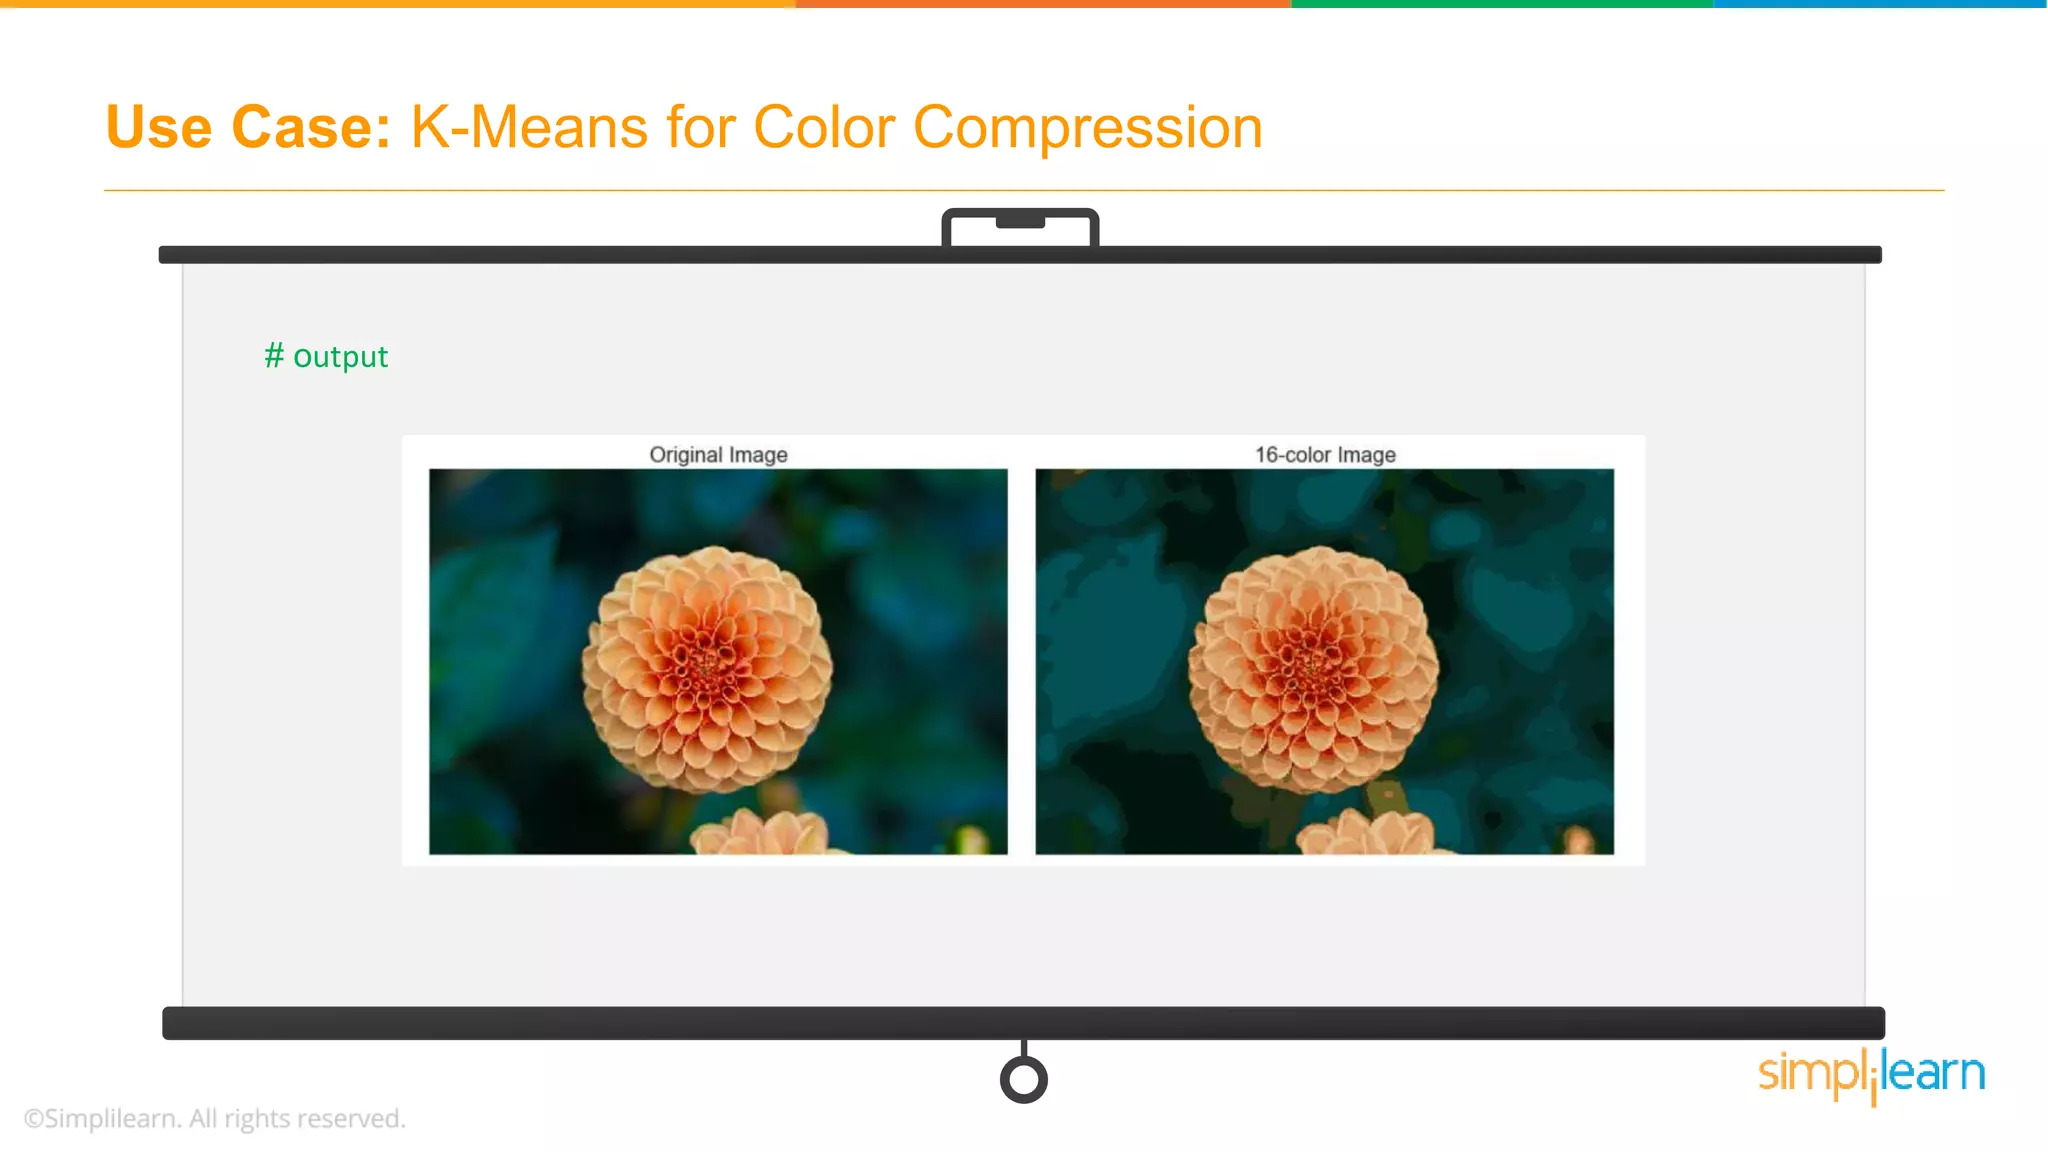
![Use Case: K-Means for Color Compression china_recolored = new_colors.reshape(china.shape) fig, ax = plt.subplots(1, 2, figsize=(16, 6), subplot_kw=dict(xticks=[], yticks=[])) fig.subplots_adjust(wspace=0.05) ax[0].imshow(china) ax[0].set_title('Original Image', size=16) ax[1].imshow(china_recolored) ax[1].set_title('16-color Image', size=16); # the result is re-coloring of the original pixels, where each pixel is assigned the color of its closest cluster center # output:](https://image.slidesharecdn.com/kmeansclusteringalgorithmkmeansclusteringexamplemachinelearningalgorithmssimplilearn-180323072616/75/K-Means-Clustering-Algorithm-K-Means-Clustering-Example-Machine-Learning-Algorithms-Simplilearn-61-2048.jpg)
![Use Case: K-Means for Color Compression # example 2: from sklearn.datasets import load_sample_image china = load_sample_image(“china.jpg") ax = plt.axes(xticks=[], yticks=[]) ax.imshow(china);](https://image.slidesharecdn.com/kmeansclusteringalgorithmkmeansclusteringexamplemachinelearningalgorithmssimplilearn-180323072616/75/K-Means-Clustering-Algorithm-K-Means-Clustering-Example-Machine-Learning-Algorithms-Simplilearn-63-2048.jpg)
![Use Case: K-Means for Color Compression # returns the dimensions of the array china.shape # reshape the data to [n_samples x n_features], and rescale the colors so that they lie between 0 and 1 data = china / 255.0 # use 0...1 scale data = data.reshape(427 * 640, 3) data.shape # visualize these pixels in this color space, using a subset of 10,000 pixels for efficiency def plot_pixels(data, title, colors=None, N=10000): if colors is None: colors = data](https://image.slidesharecdn.com/kmeansclusteringalgorithmkmeansclusteringexamplemachinelearningalgorithmssimplilearn-180323072616/75/K-Means-Clustering-Algorithm-K-Means-Clustering-Example-Machine-Learning-Algorithms-Simplilearn-64-2048.jpg)
![Use Case: K-Means for Color Compression # choose a random subset rng = np.random.RandomState(0) i = rng.permutation(data.shape[0])[:N] colors = colors[i] R, G, B = data[i].T fig, ax = plt.subplots(1, 2, figsize=(16, 6)) ax[0].scatter(R, G, color=colors, marker='.') ax[0].set(xlabel='Red', ylabel='Green', xlim=(0, 1), ylim=(0, 1)) ax[1].scatter(R, B, color=colors, marker='.') ax[1].set(xlabel='Red', ylabel='Blue', xlim=(0, 1), ylim=(0, 1)) fig.suptitle(title, size=20);](https://image.slidesharecdn.com/kmeansclusteringalgorithmkmeansclusteringexamplemachinelearningalgorithmssimplilearn-180323072616/75/K-Means-Clustering-Algorithm-K-Means-Clustering-Example-Machine-Learning-Algorithms-Simplilearn-65-2048.jpg)
![Use Case: K-Means for Color Compression # fix NumPy issues import warnings; warnings.simplefilter('ignore’) # reducing these 16 million colors to just 16 colors from sklearn.cluster import MiniBatchKMeans kmeans = MiniBatchKMeans(16) kmeans.fit(data) new_colors = kmeans.cluster_centers_[kmeans.predict(data)] plot_pixels(data, colors=new_colors, title="Reduced color space: 16 colors")](https://image.slidesharecdn.com/kmeansclusteringalgorithmkmeansclusteringexamplemachinelearningalgorithmssimplilearn-180323072616/75/K-Means-Clustering-Algorithm-K-Means-Clustering-Example-Machine-Learning-Algorithms-Simplilearn-67-2048.jpg)
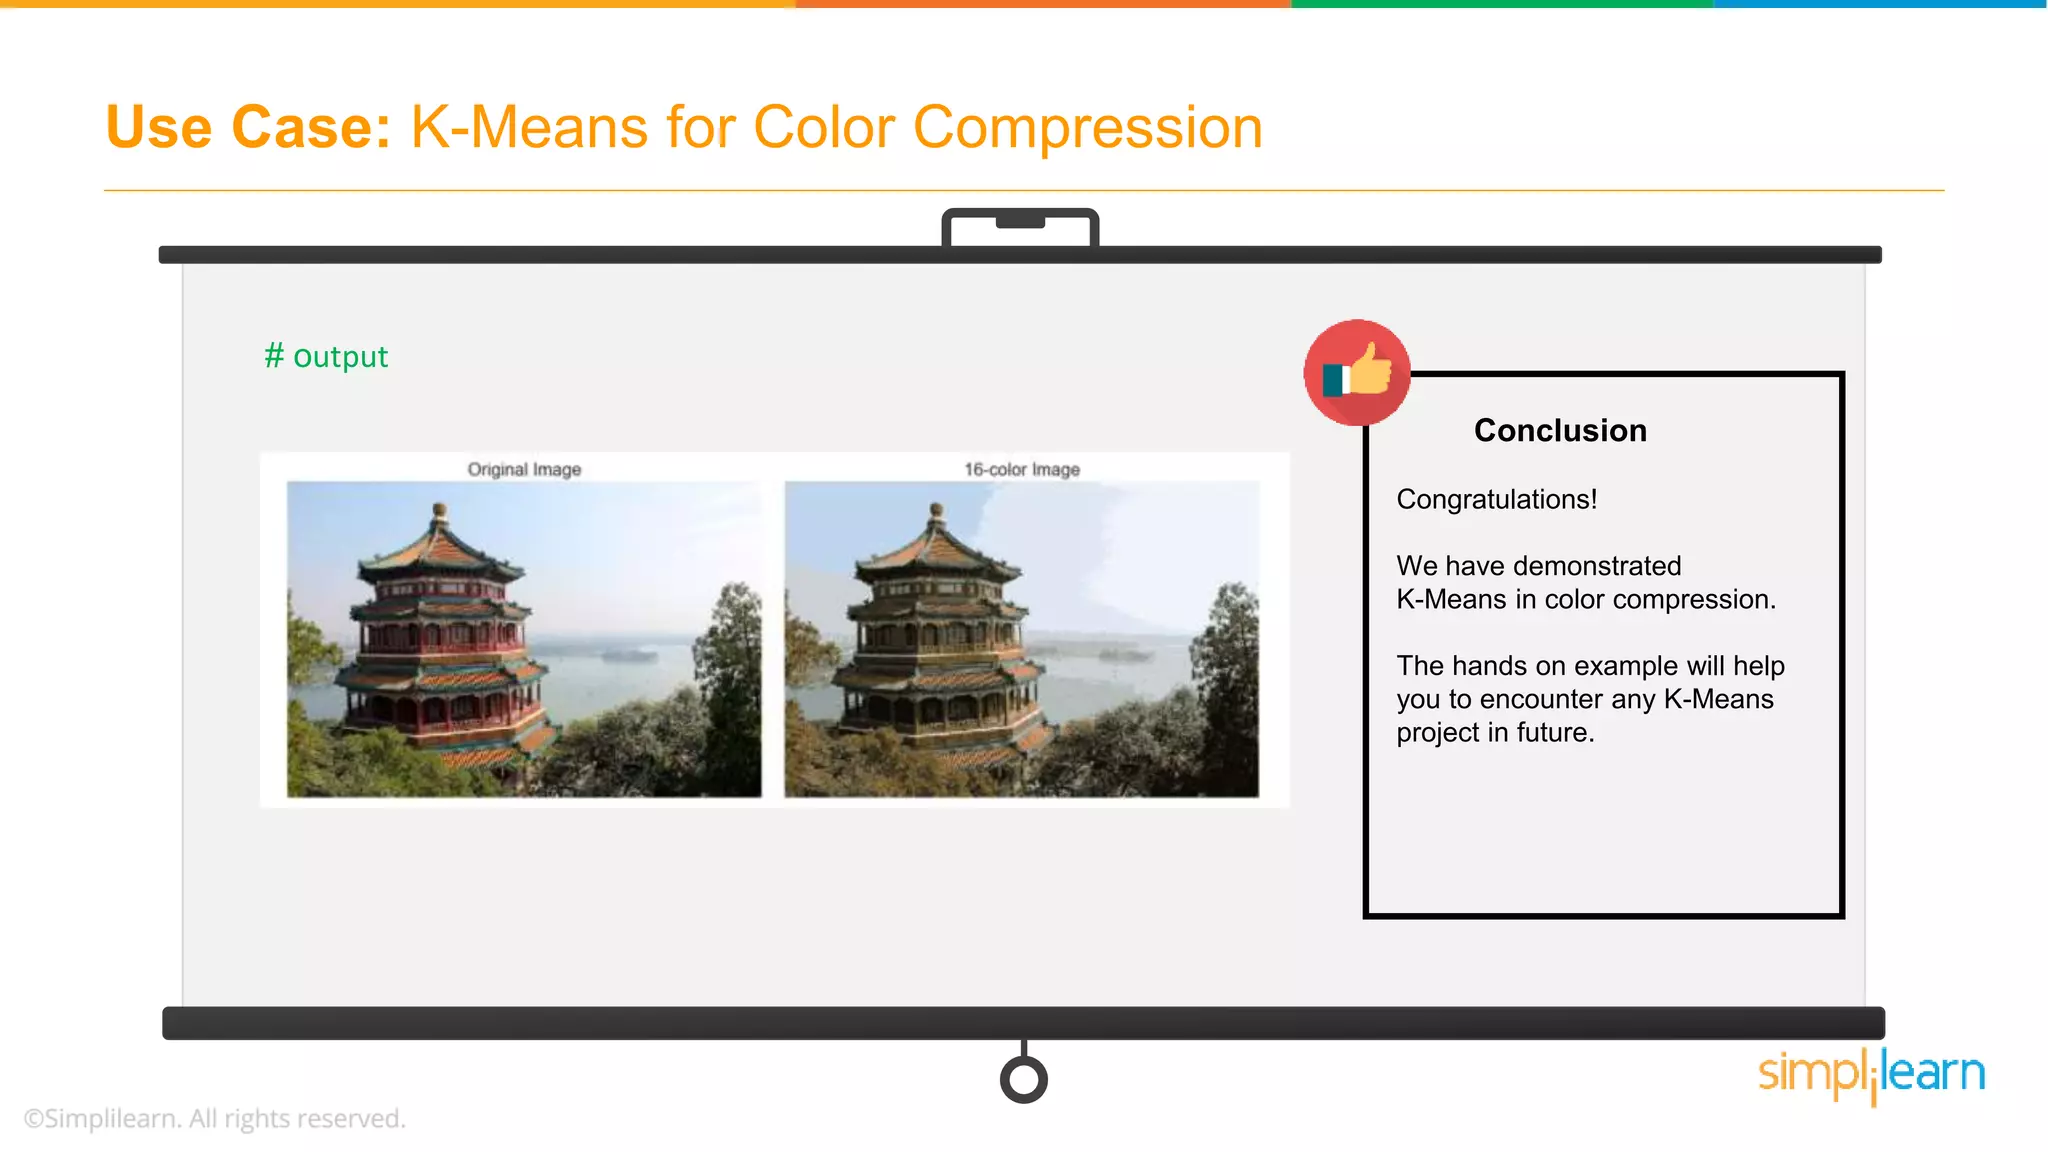
![Use Case: K-Means for Color Compression china_recolored = new_colors.reshape(china.shape) fig, ax = plt.subplots(1, 2, figsize=(16, 6), subplot_kw=dict(xticks=[], yticks=[])) fig.subplots_adjust(wspace=0.05) ax[0].imshow(china) ax[0].set_title('Original Image', size=16) ax[1].imshow(china_recolored) ax[1].set_title('16-color Image', size=16); # the result is a re-coloring of the original pixels, where each pixel is assigned the color of its closest cluster center # output](https://image.slidesharecdn.com/kmeansclusteringalgorithmkmeansclusteringexamplemachinelearningalgorithmssimplilearn-180323072616/75/K-Means-Clustering-Algorithm-K-Means-Clustering-Example-Machine-Learning-Algorithms-Simplilearn-68-2048.jpg)
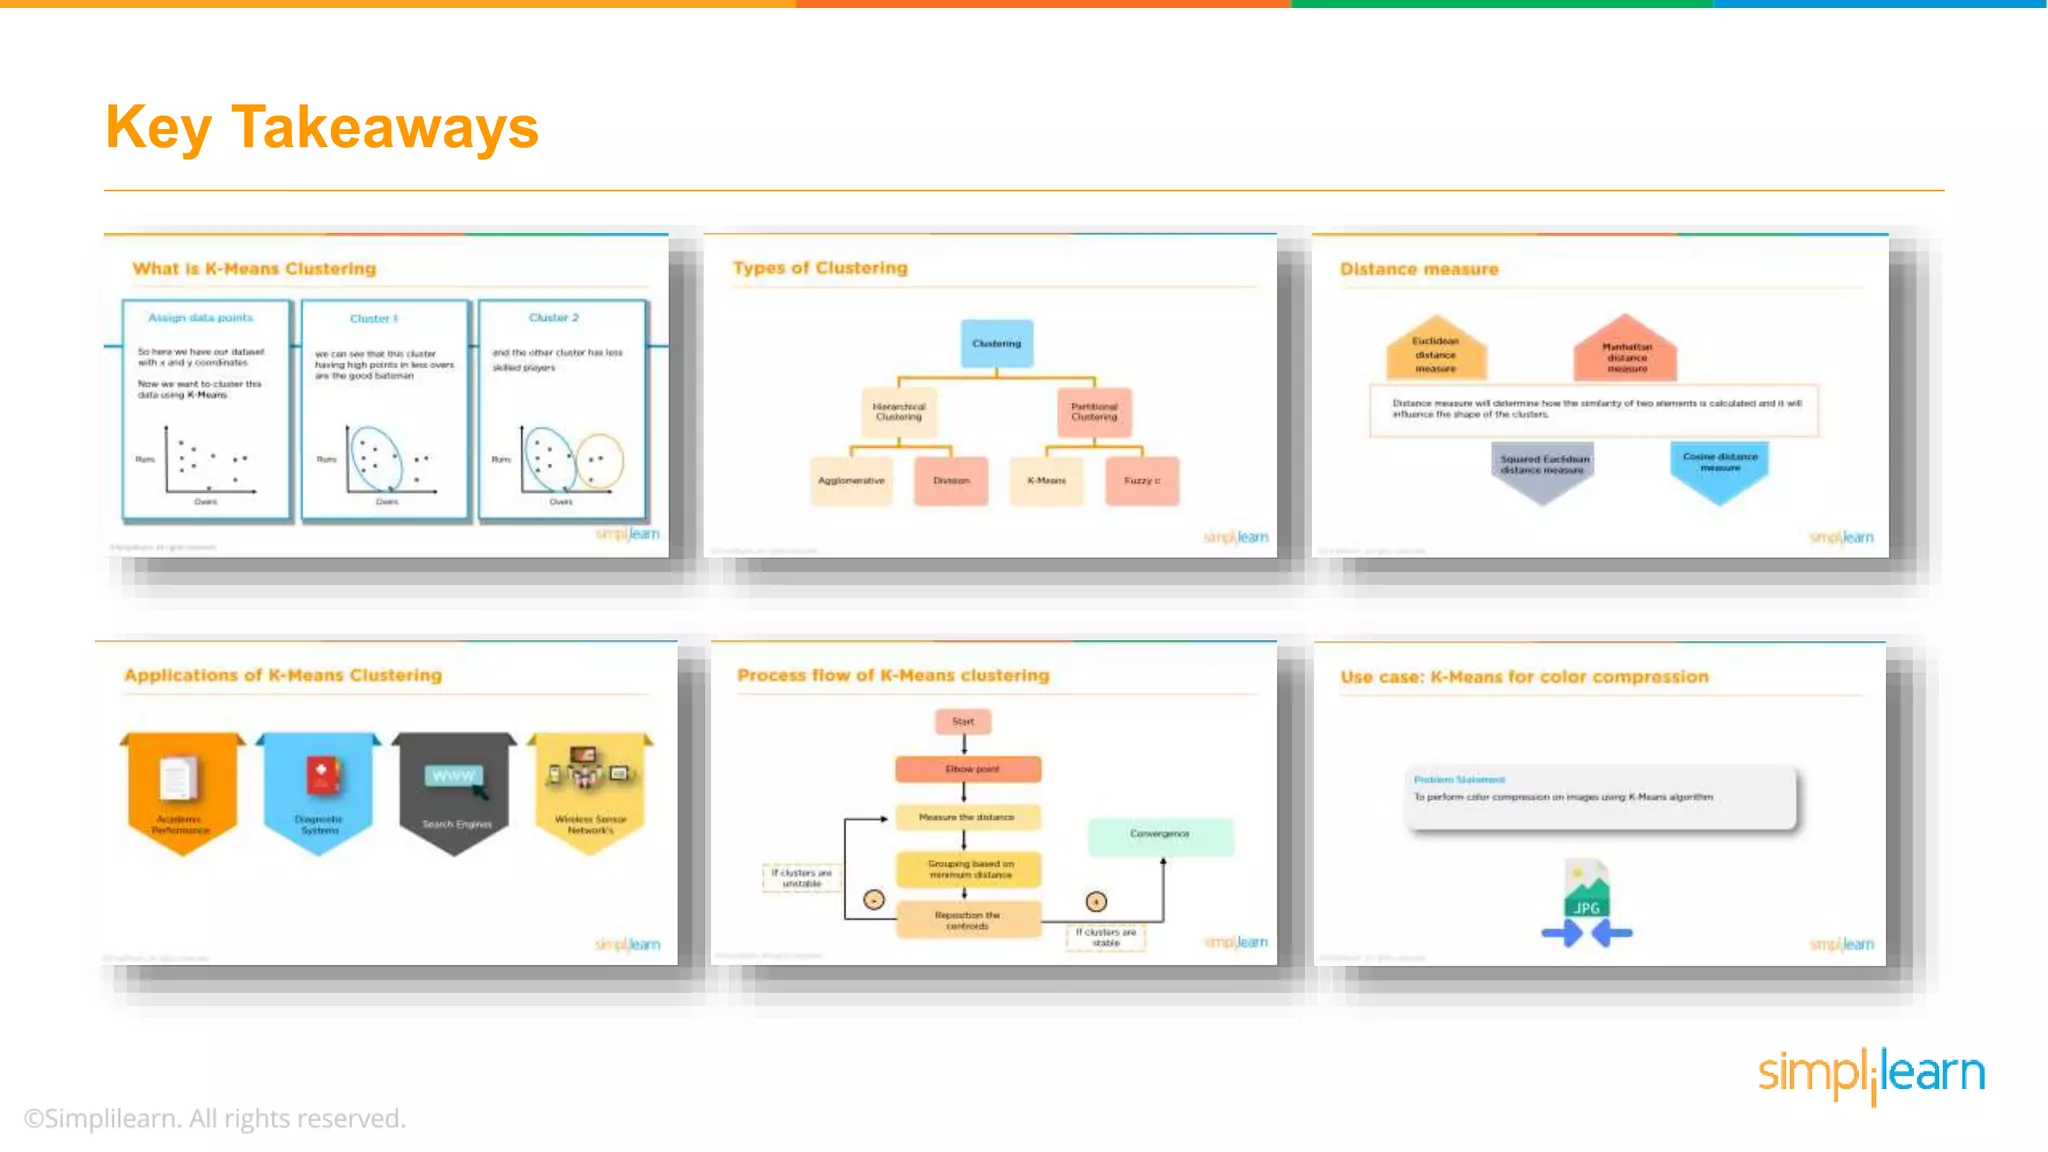


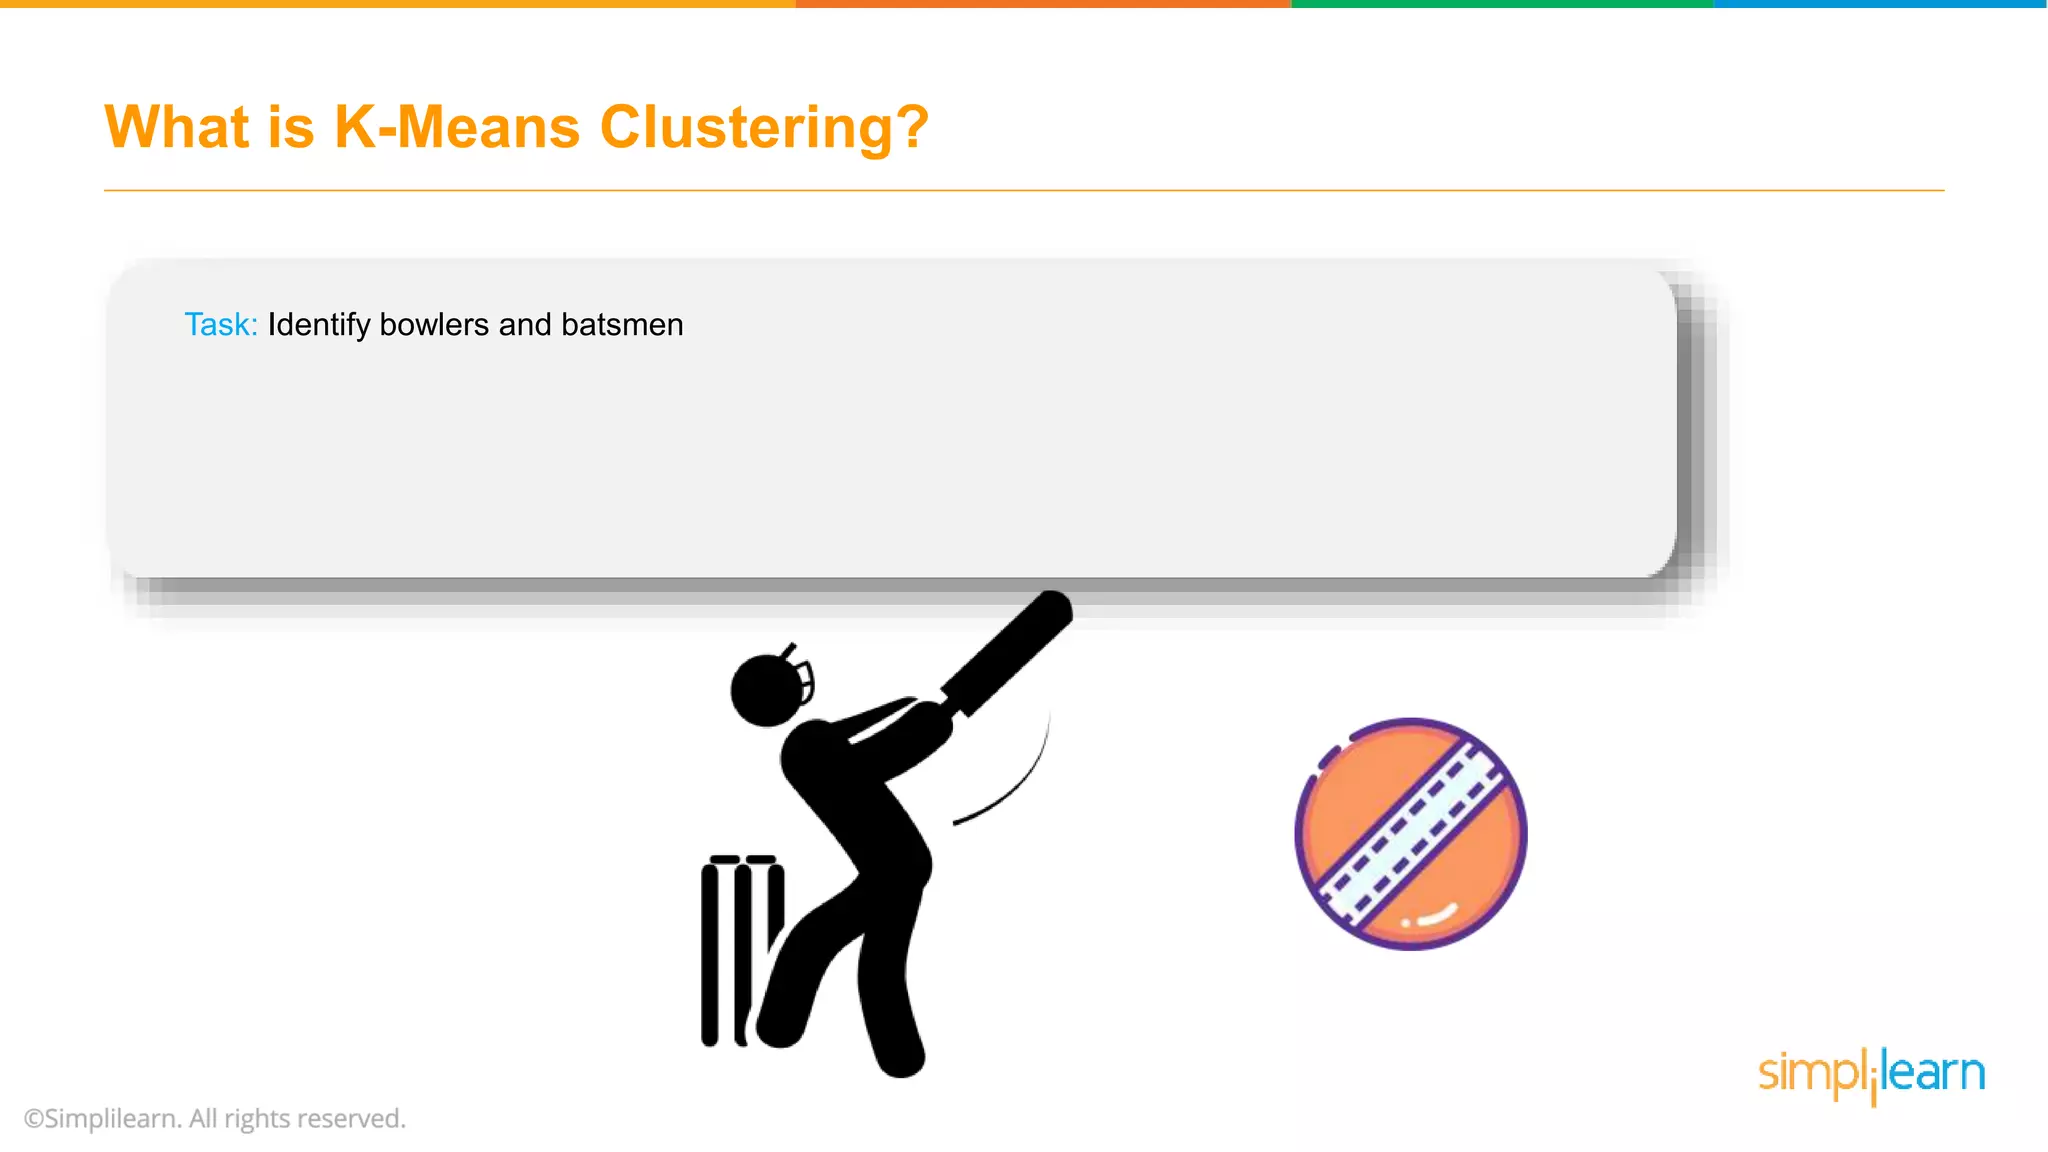
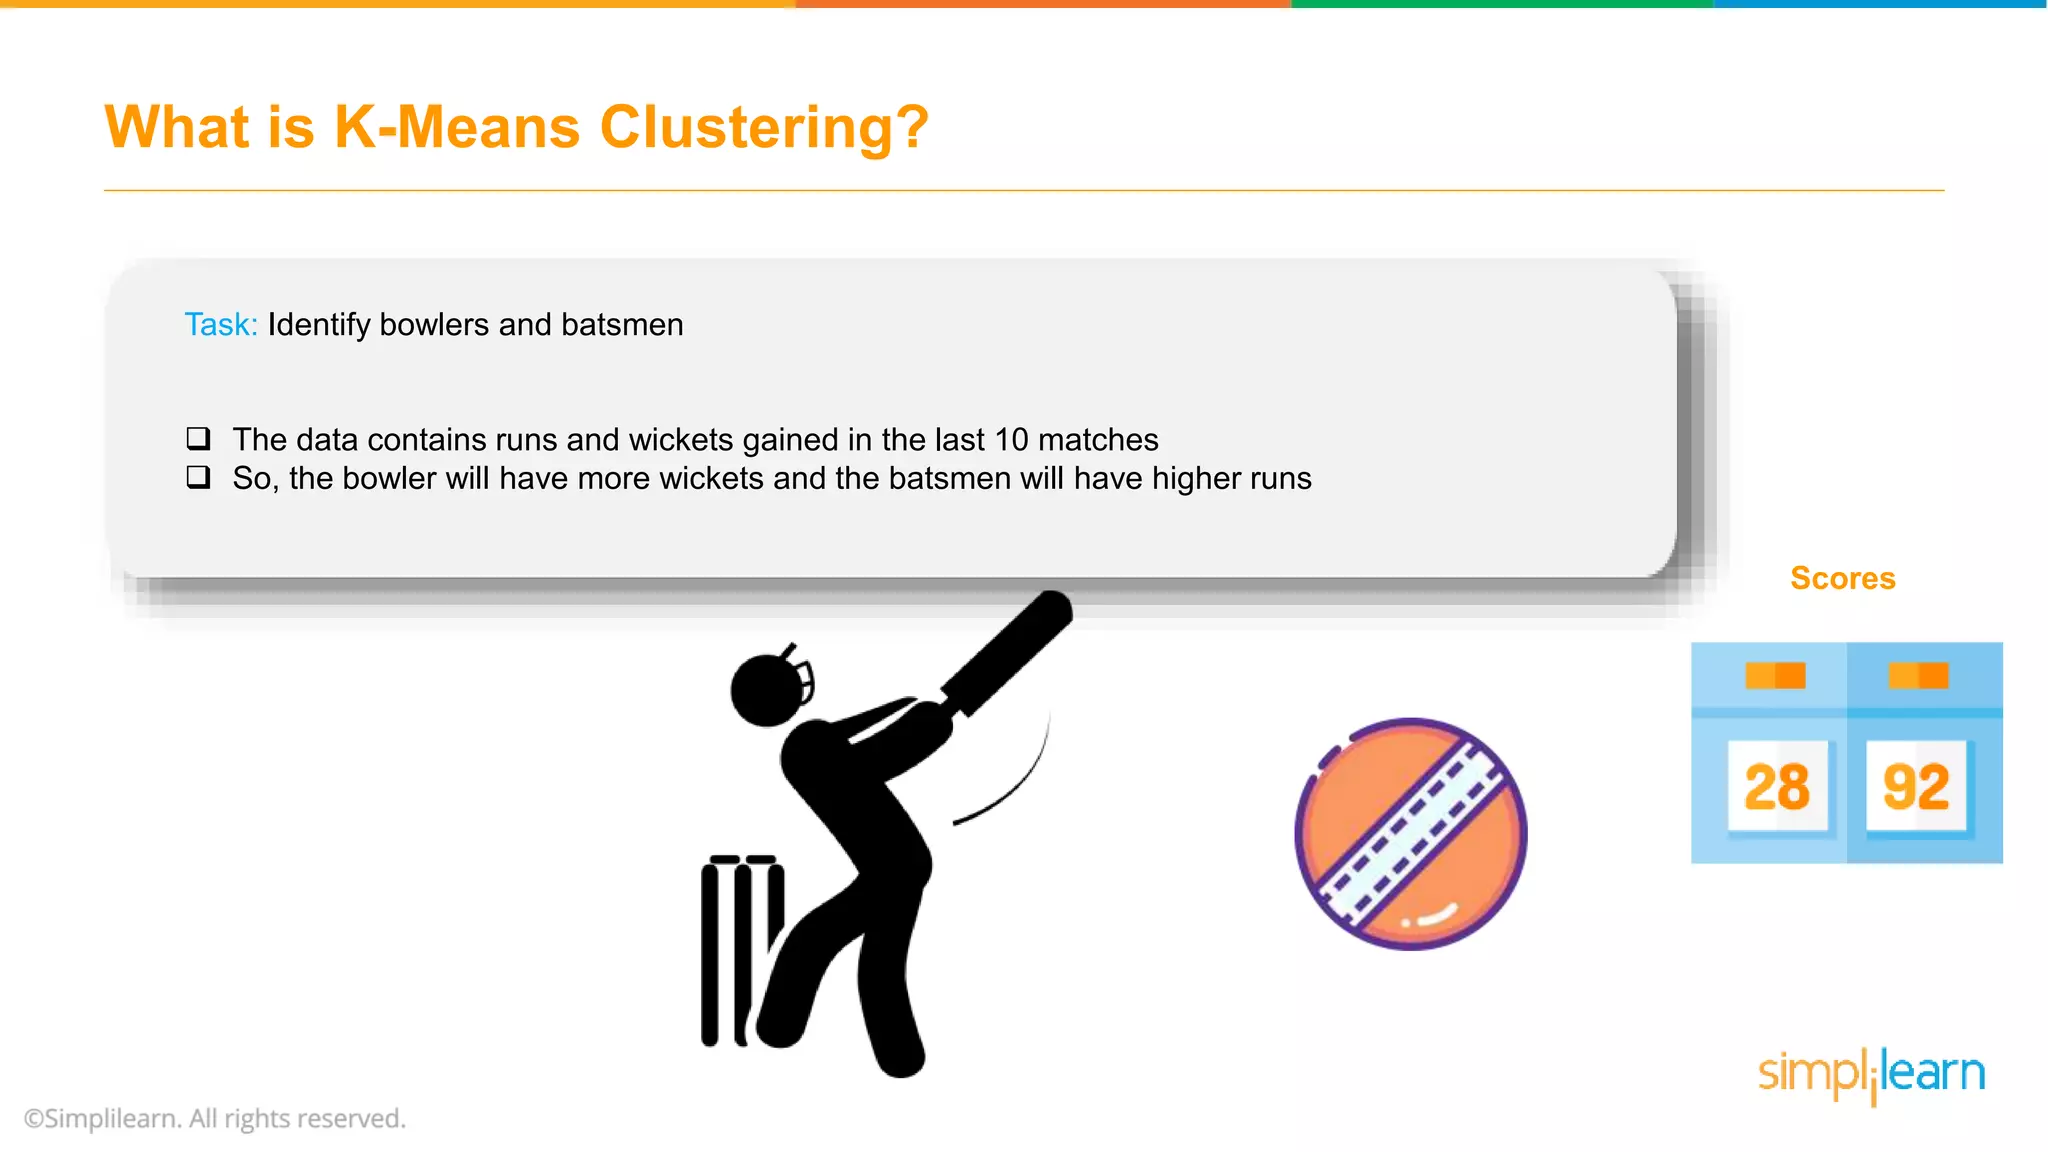
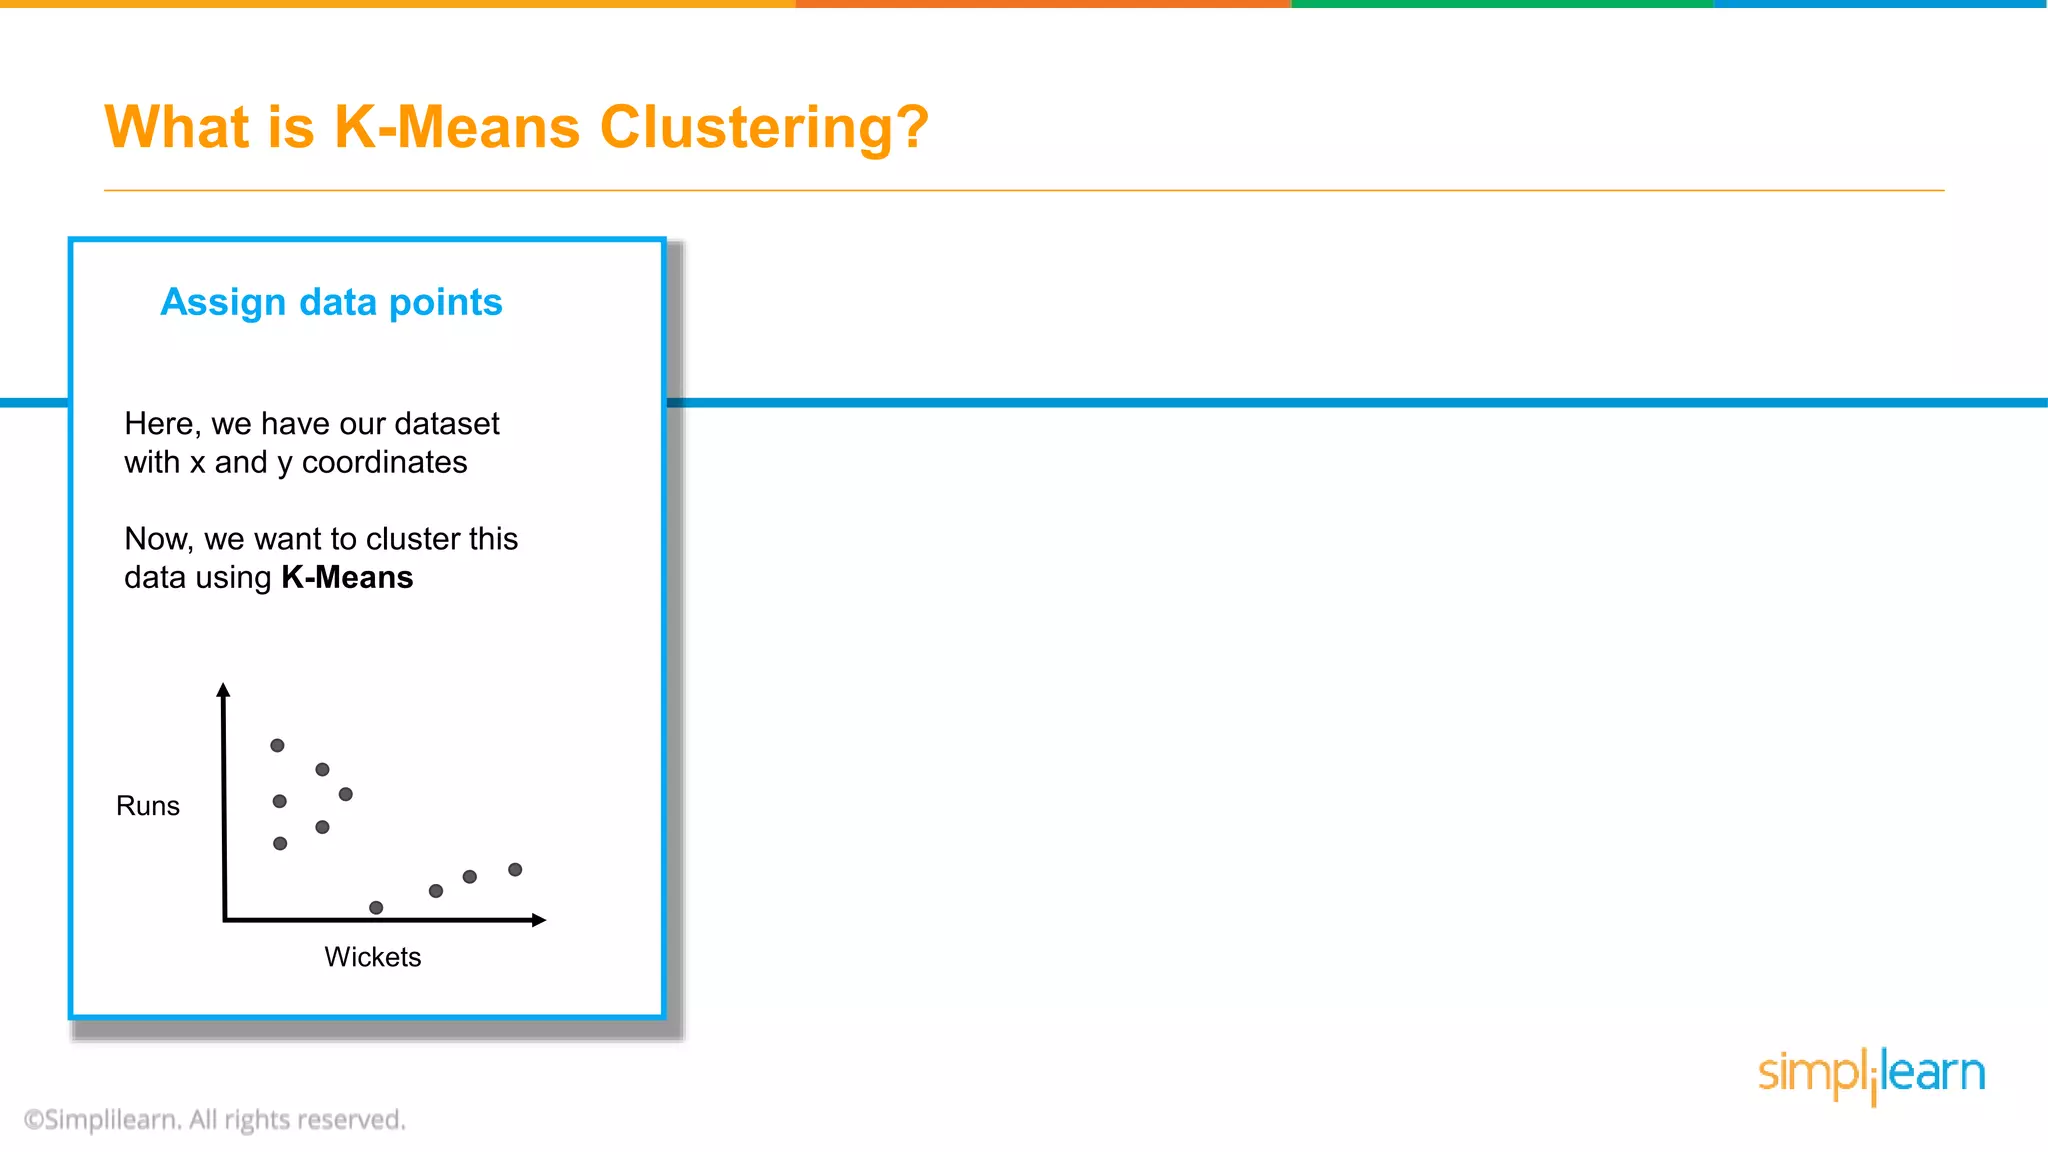
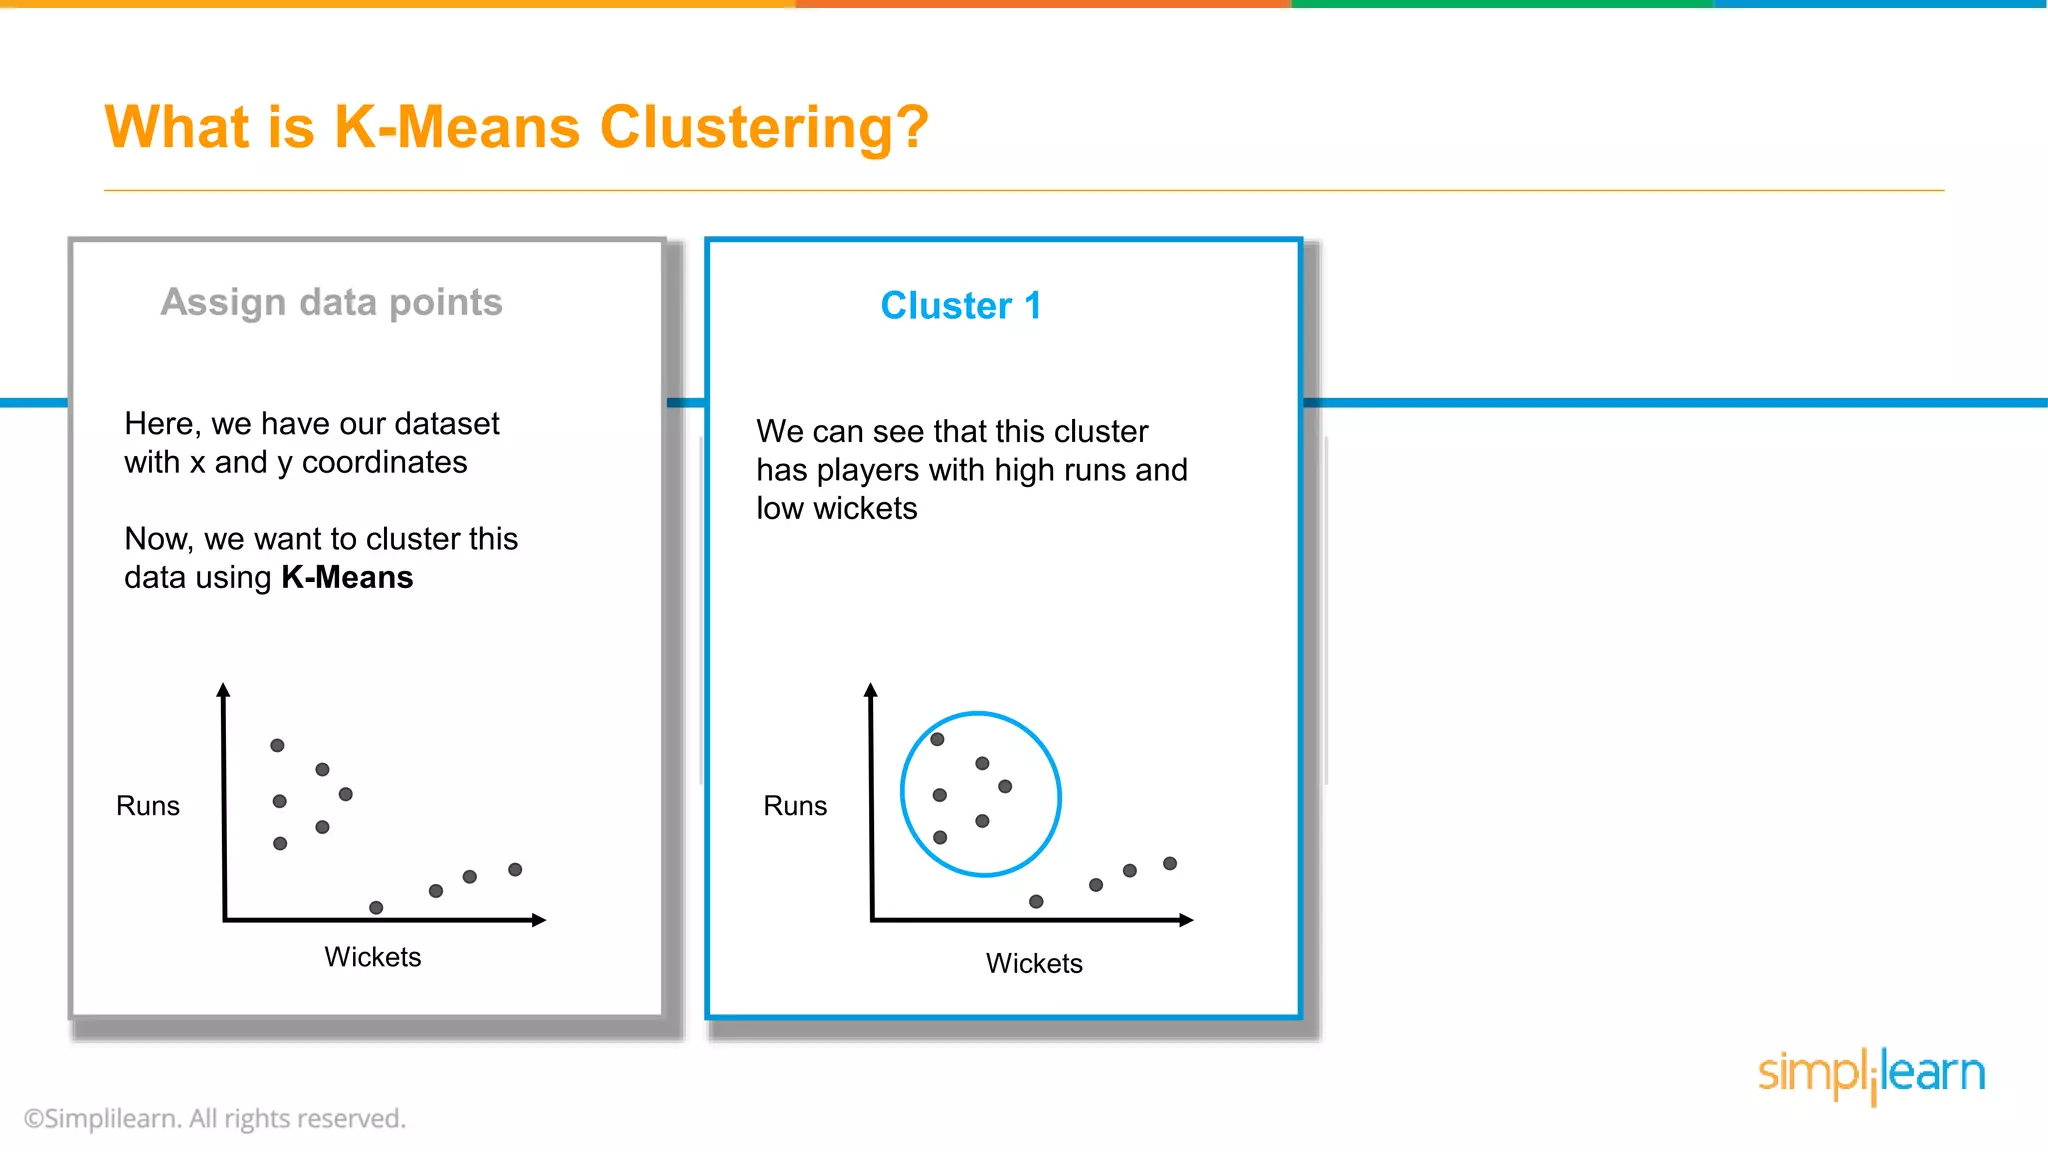
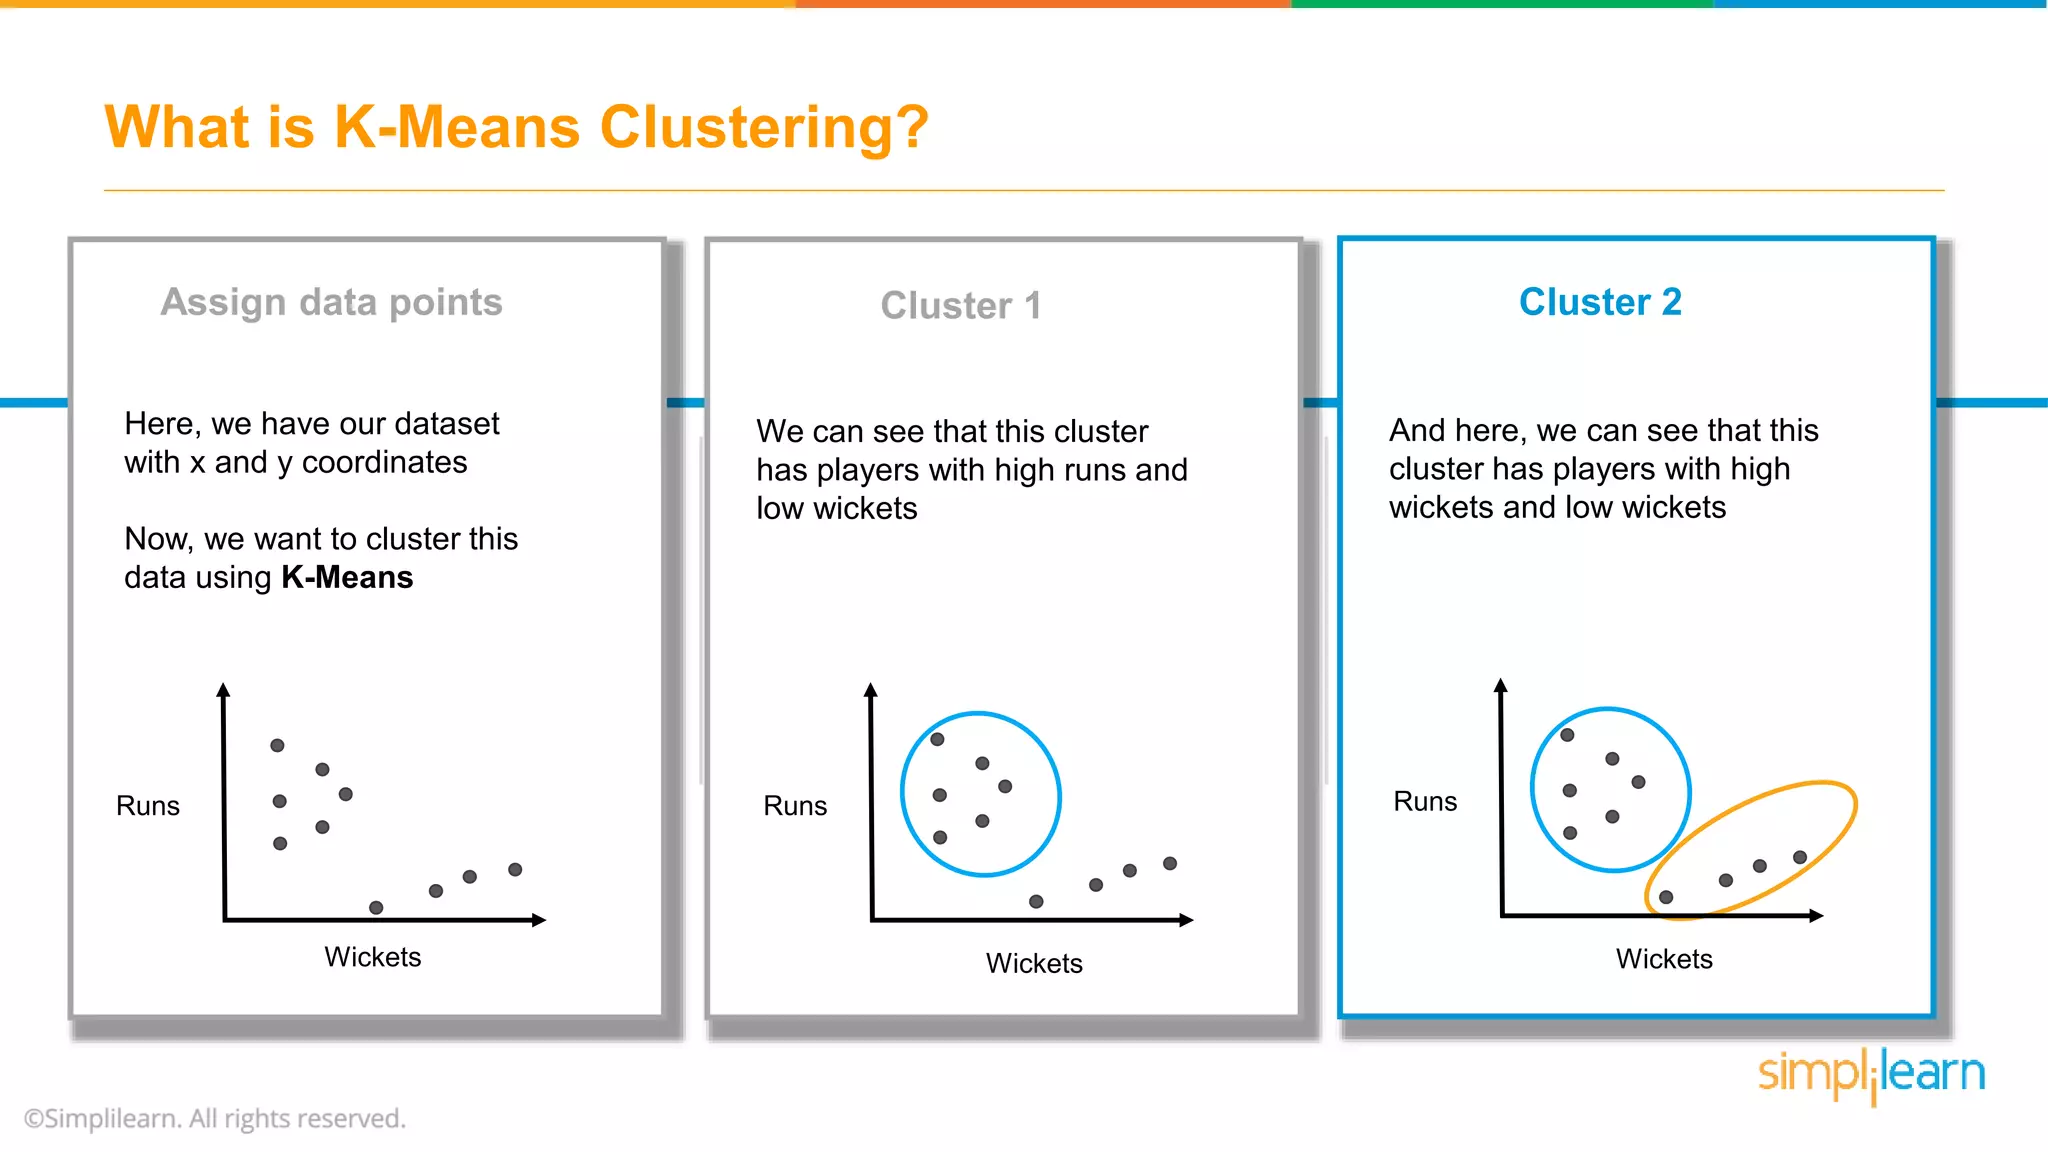
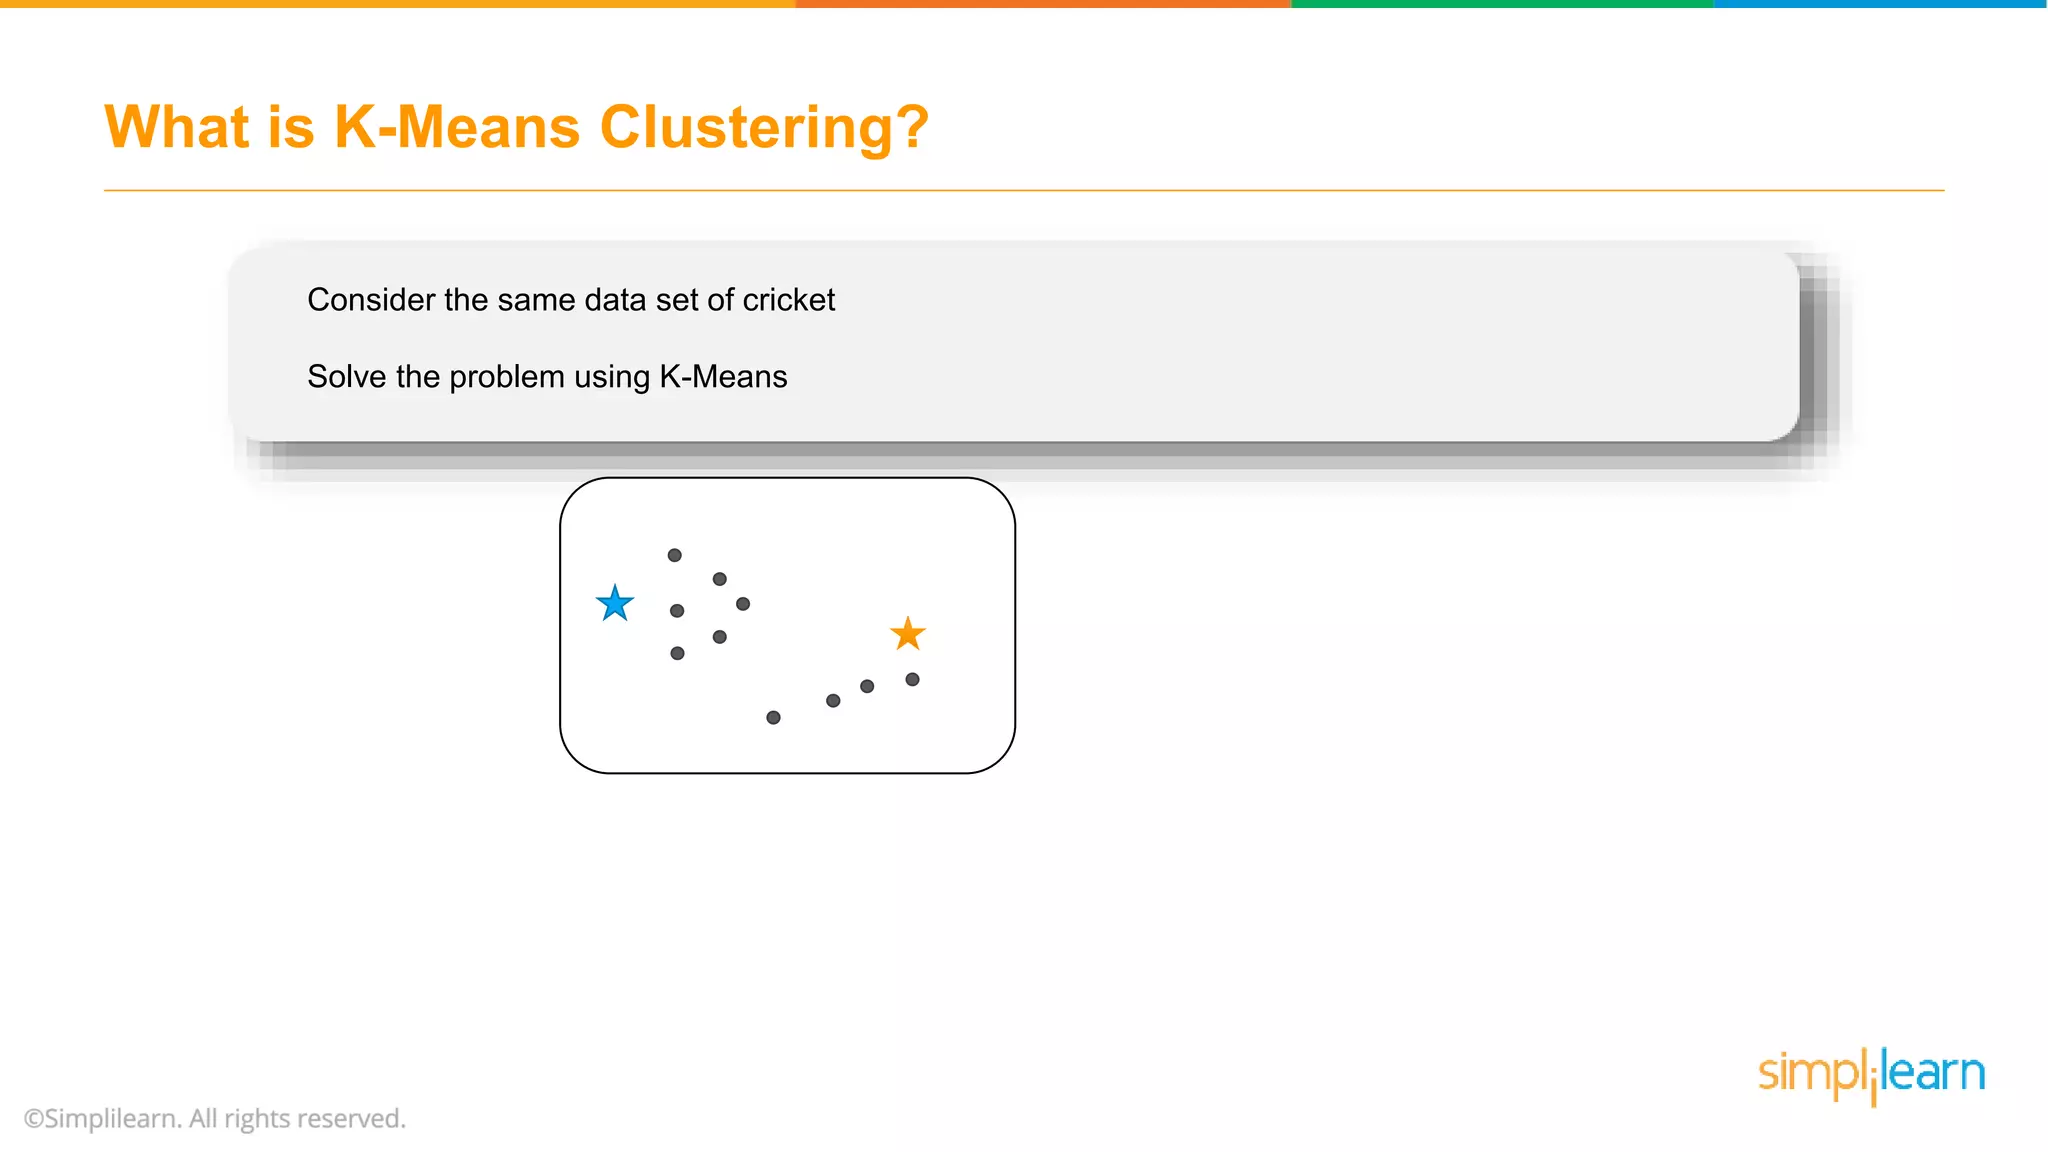
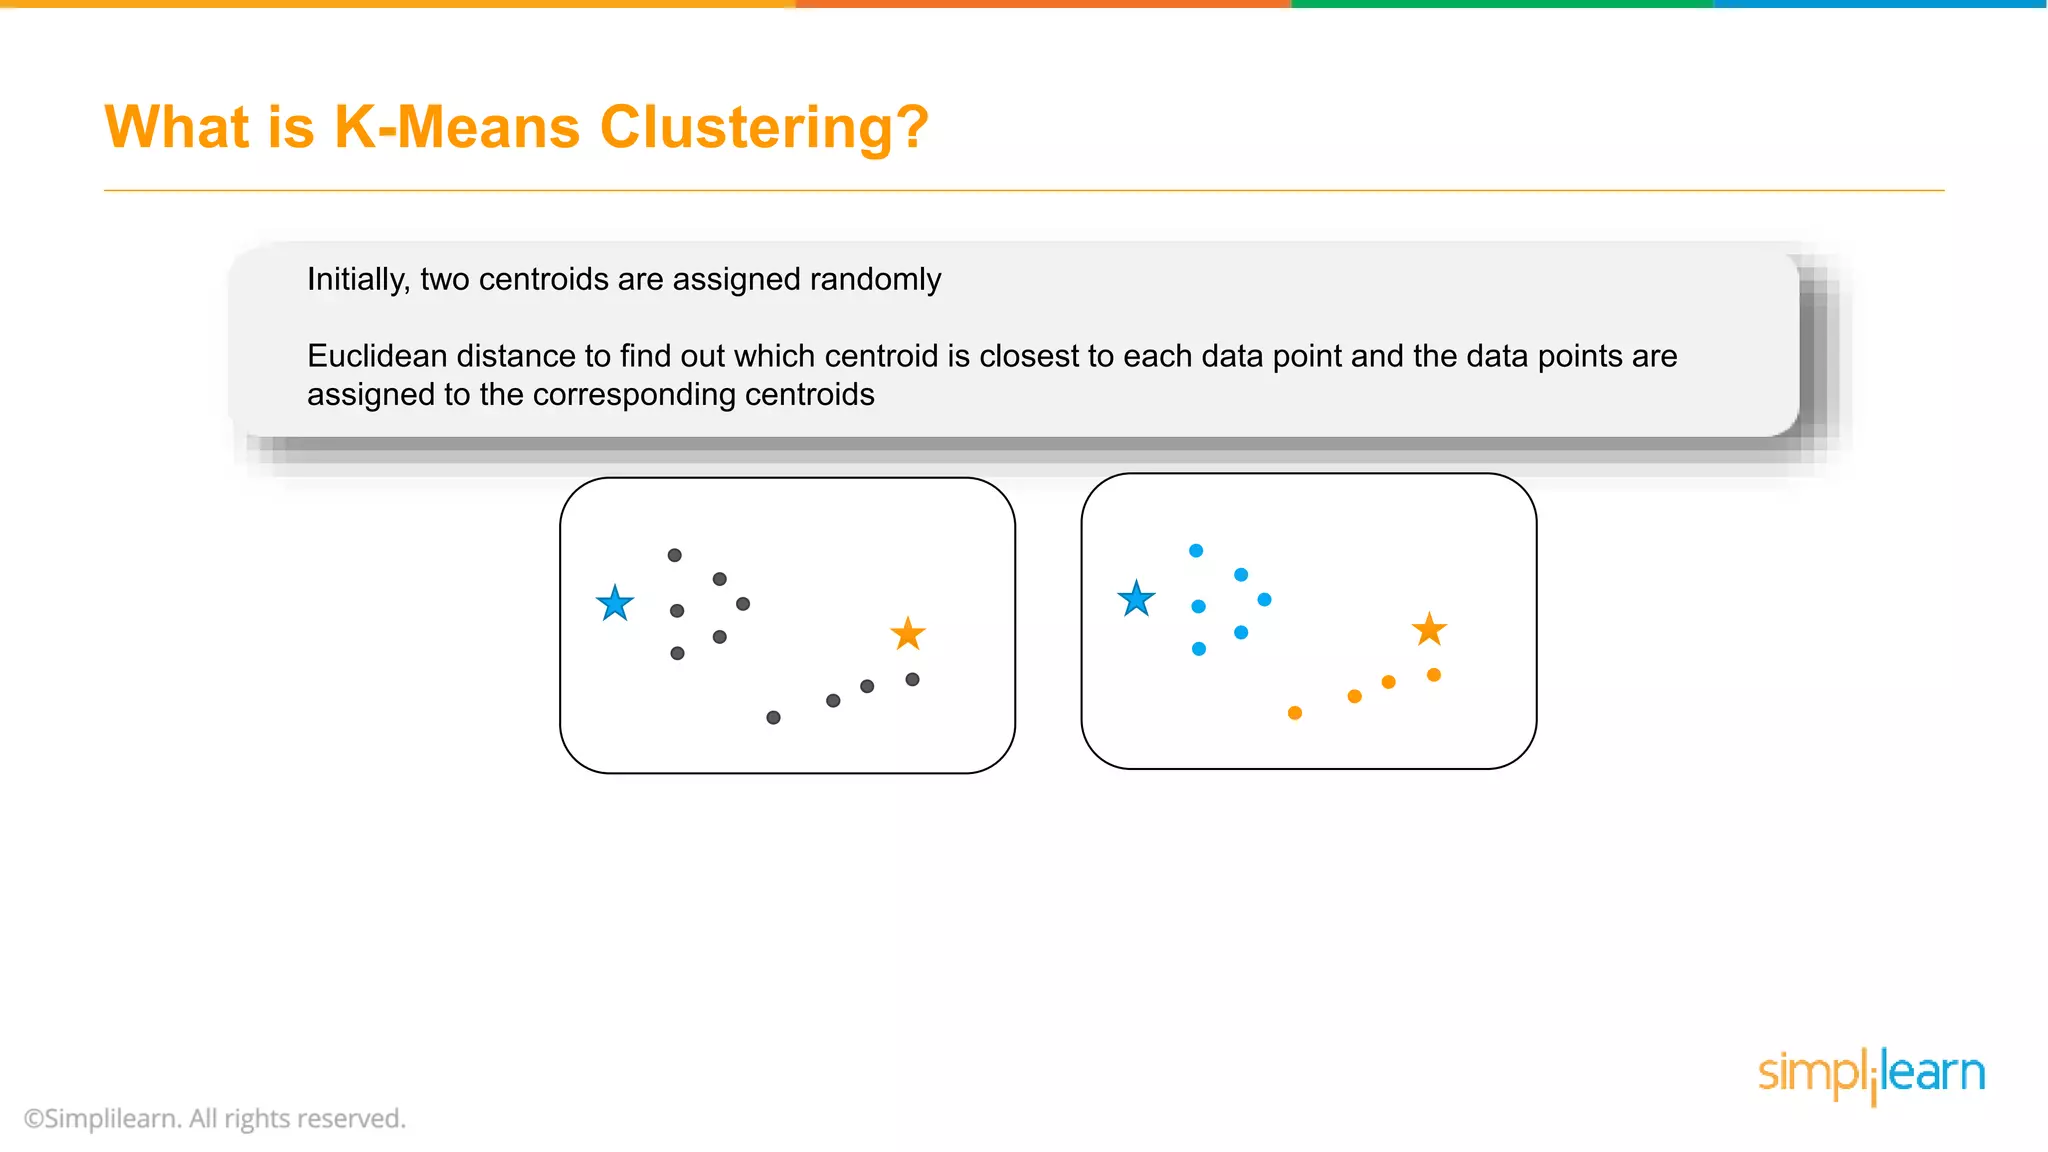
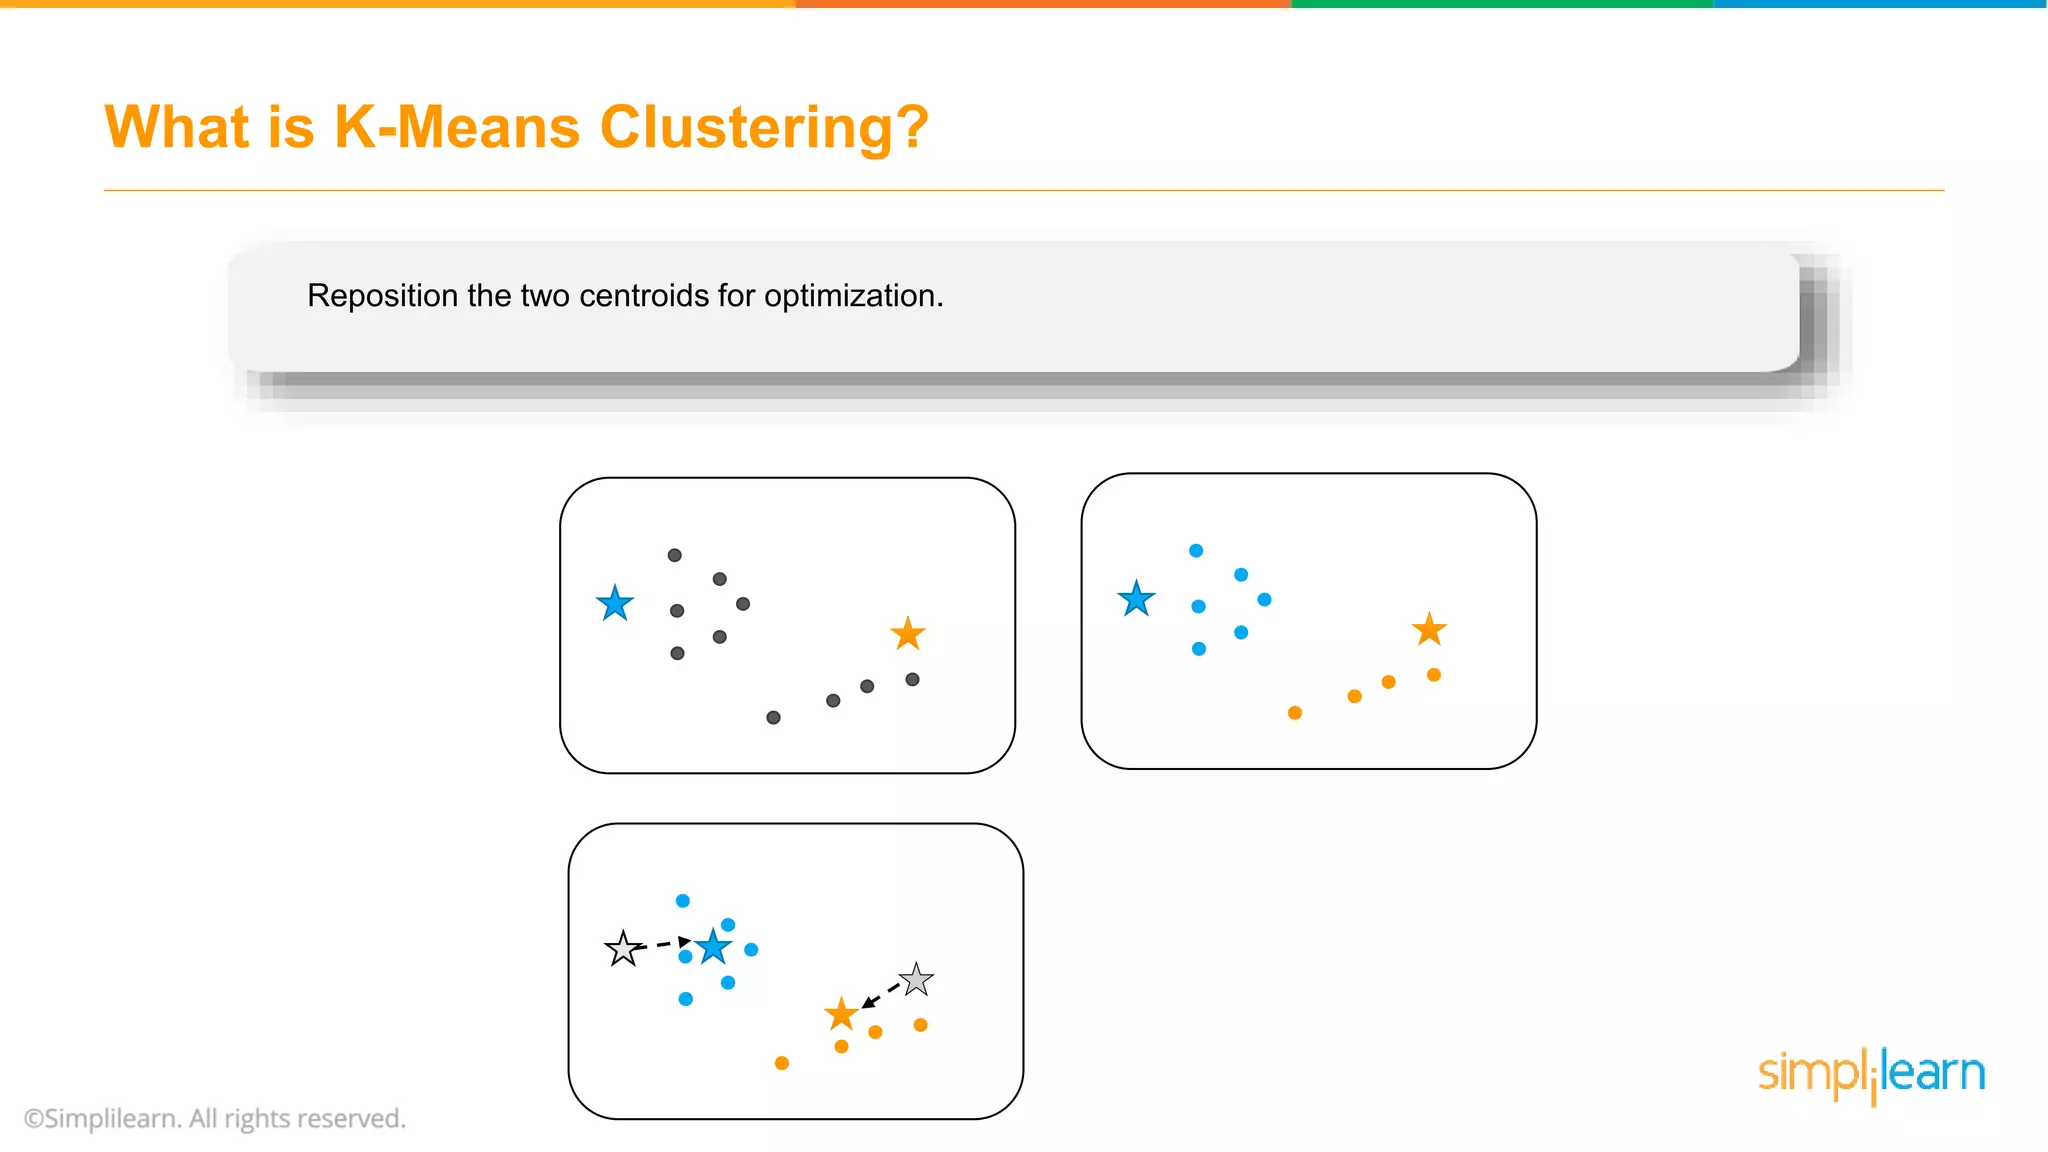
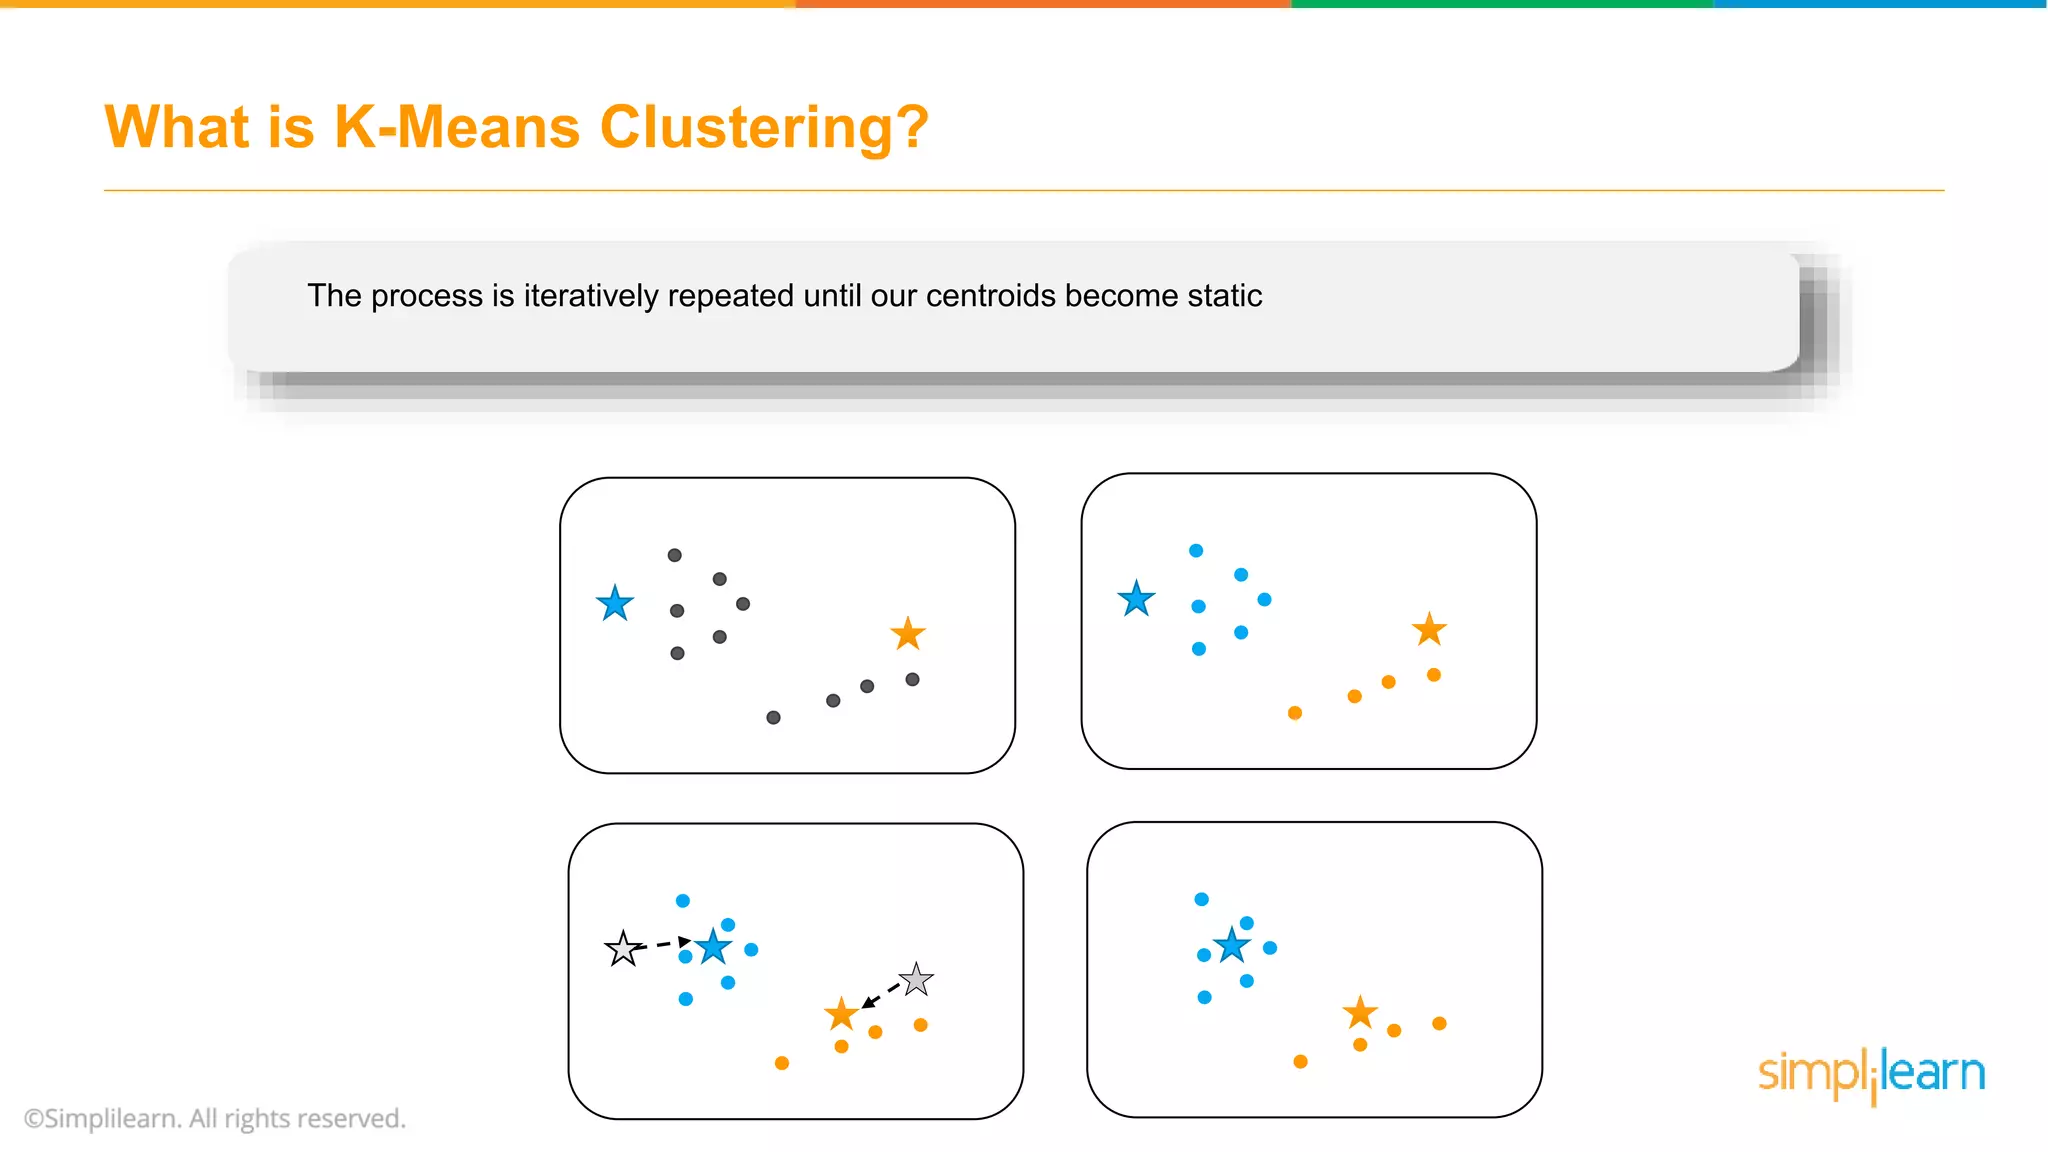
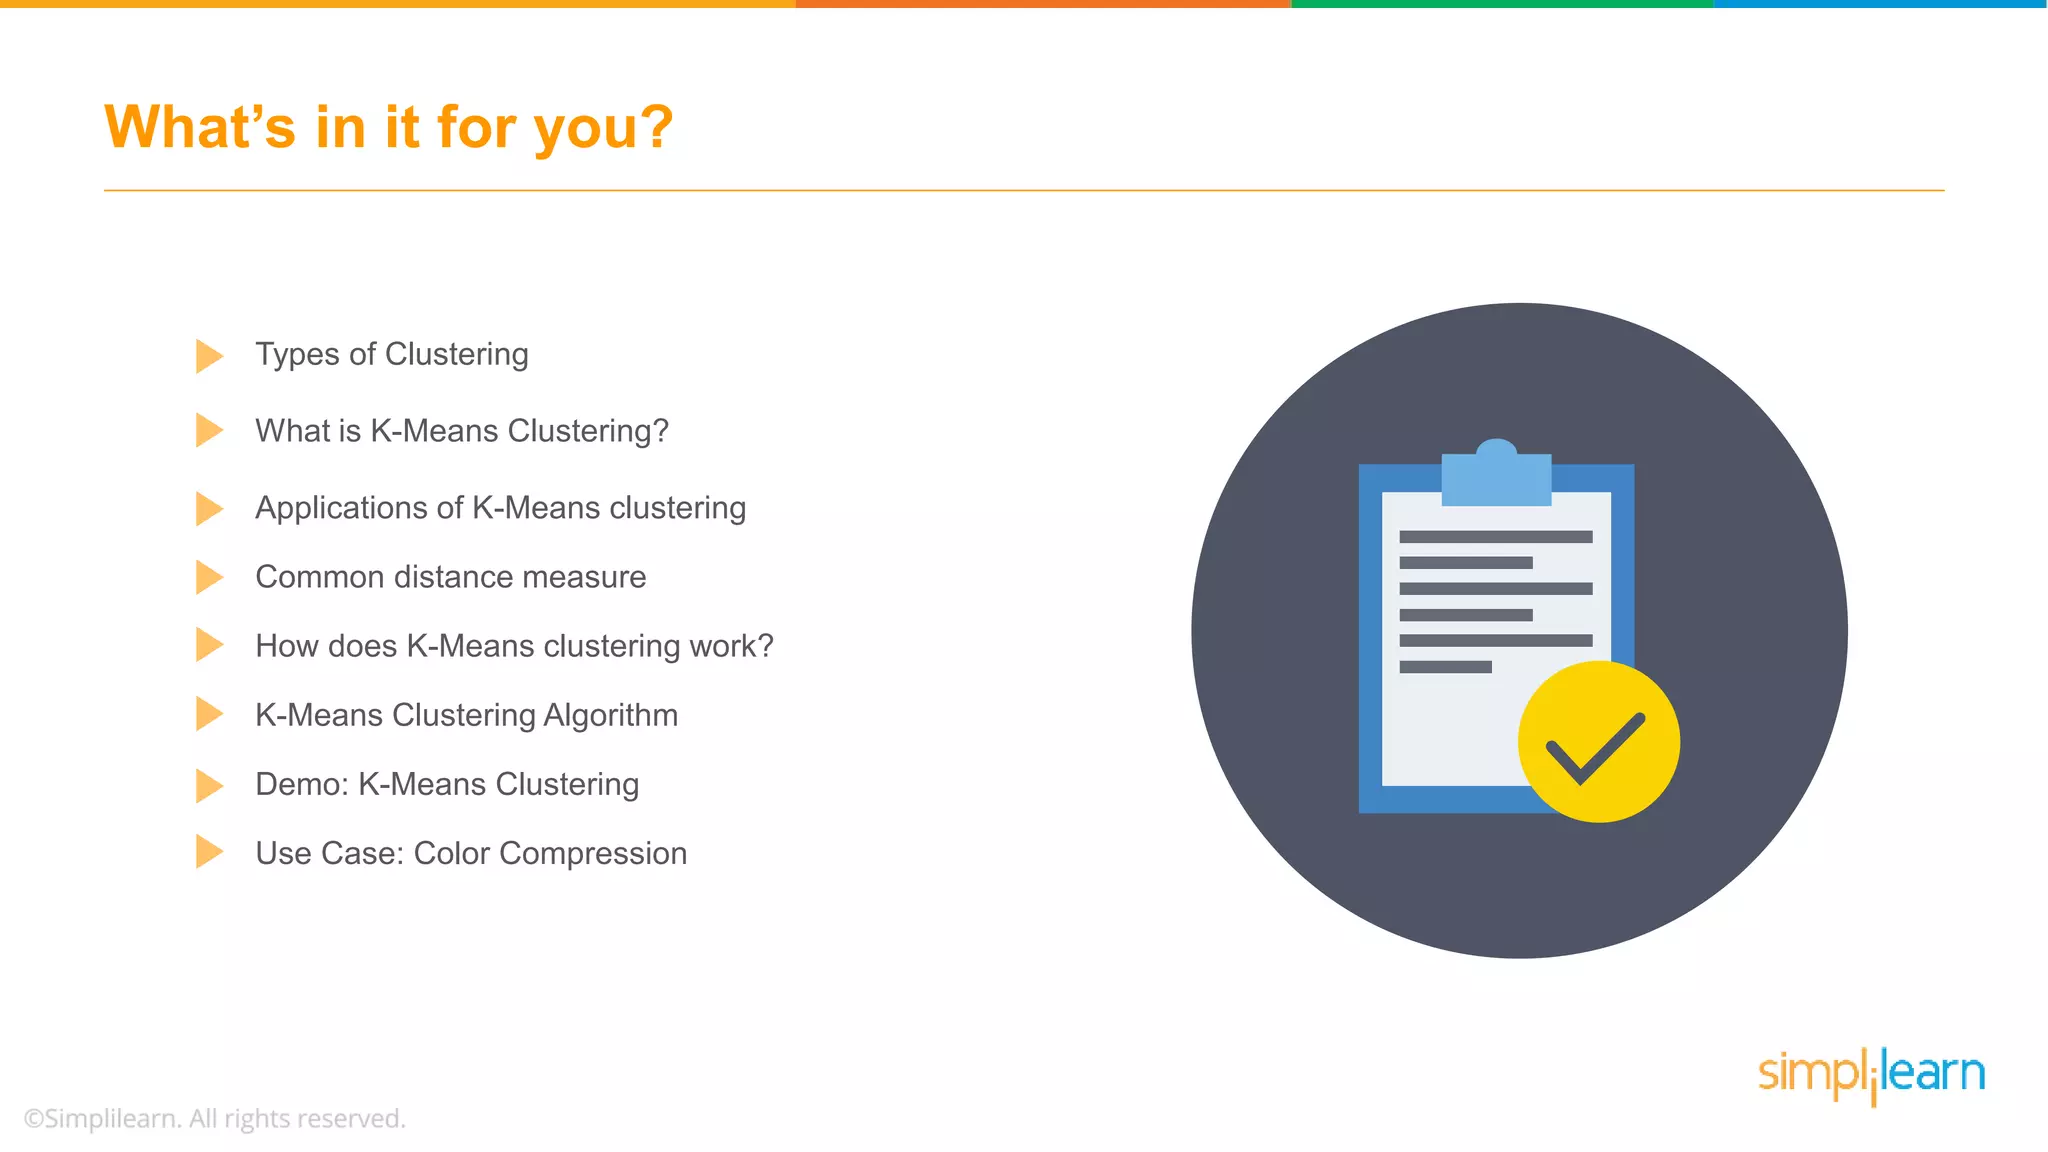
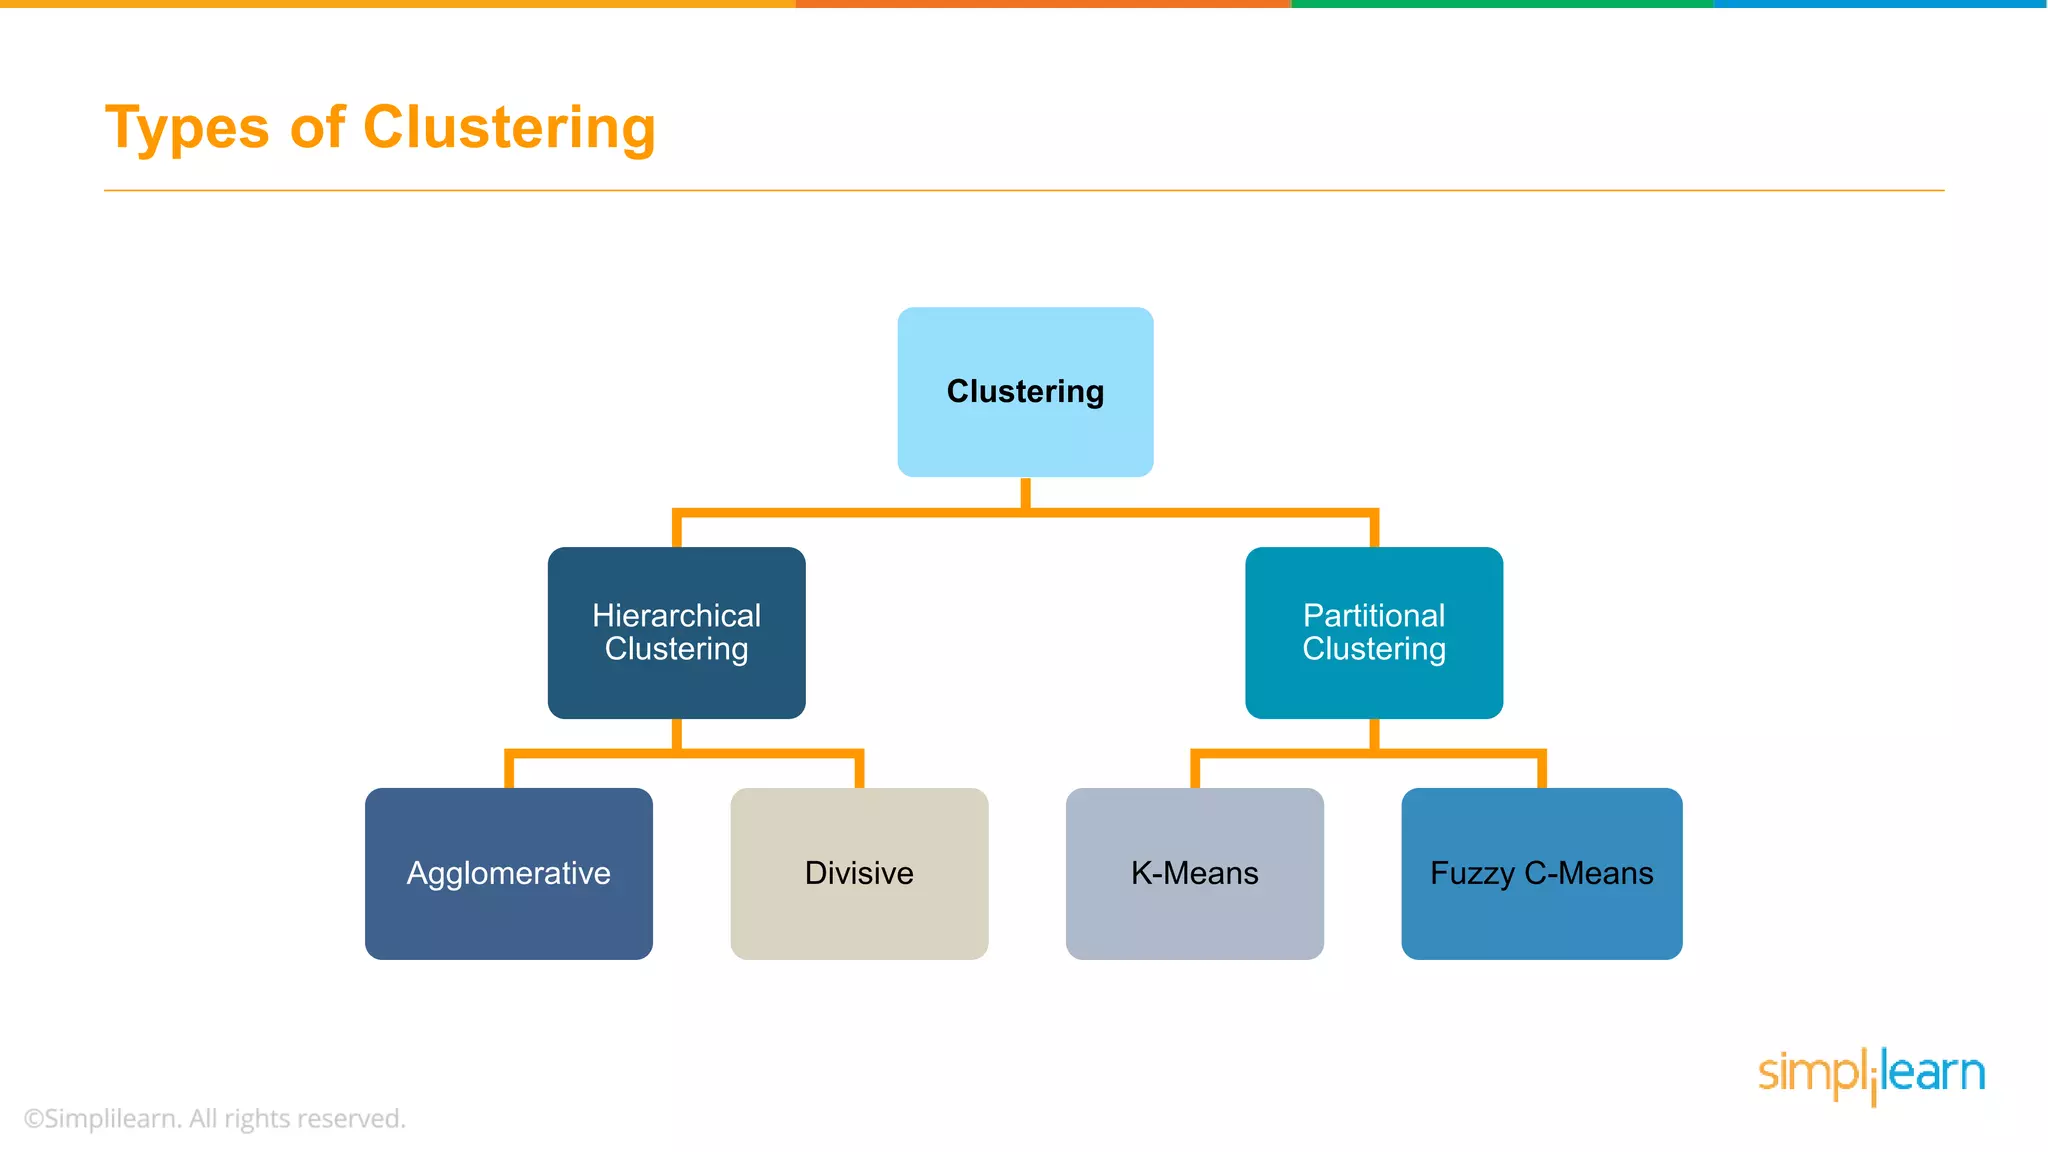
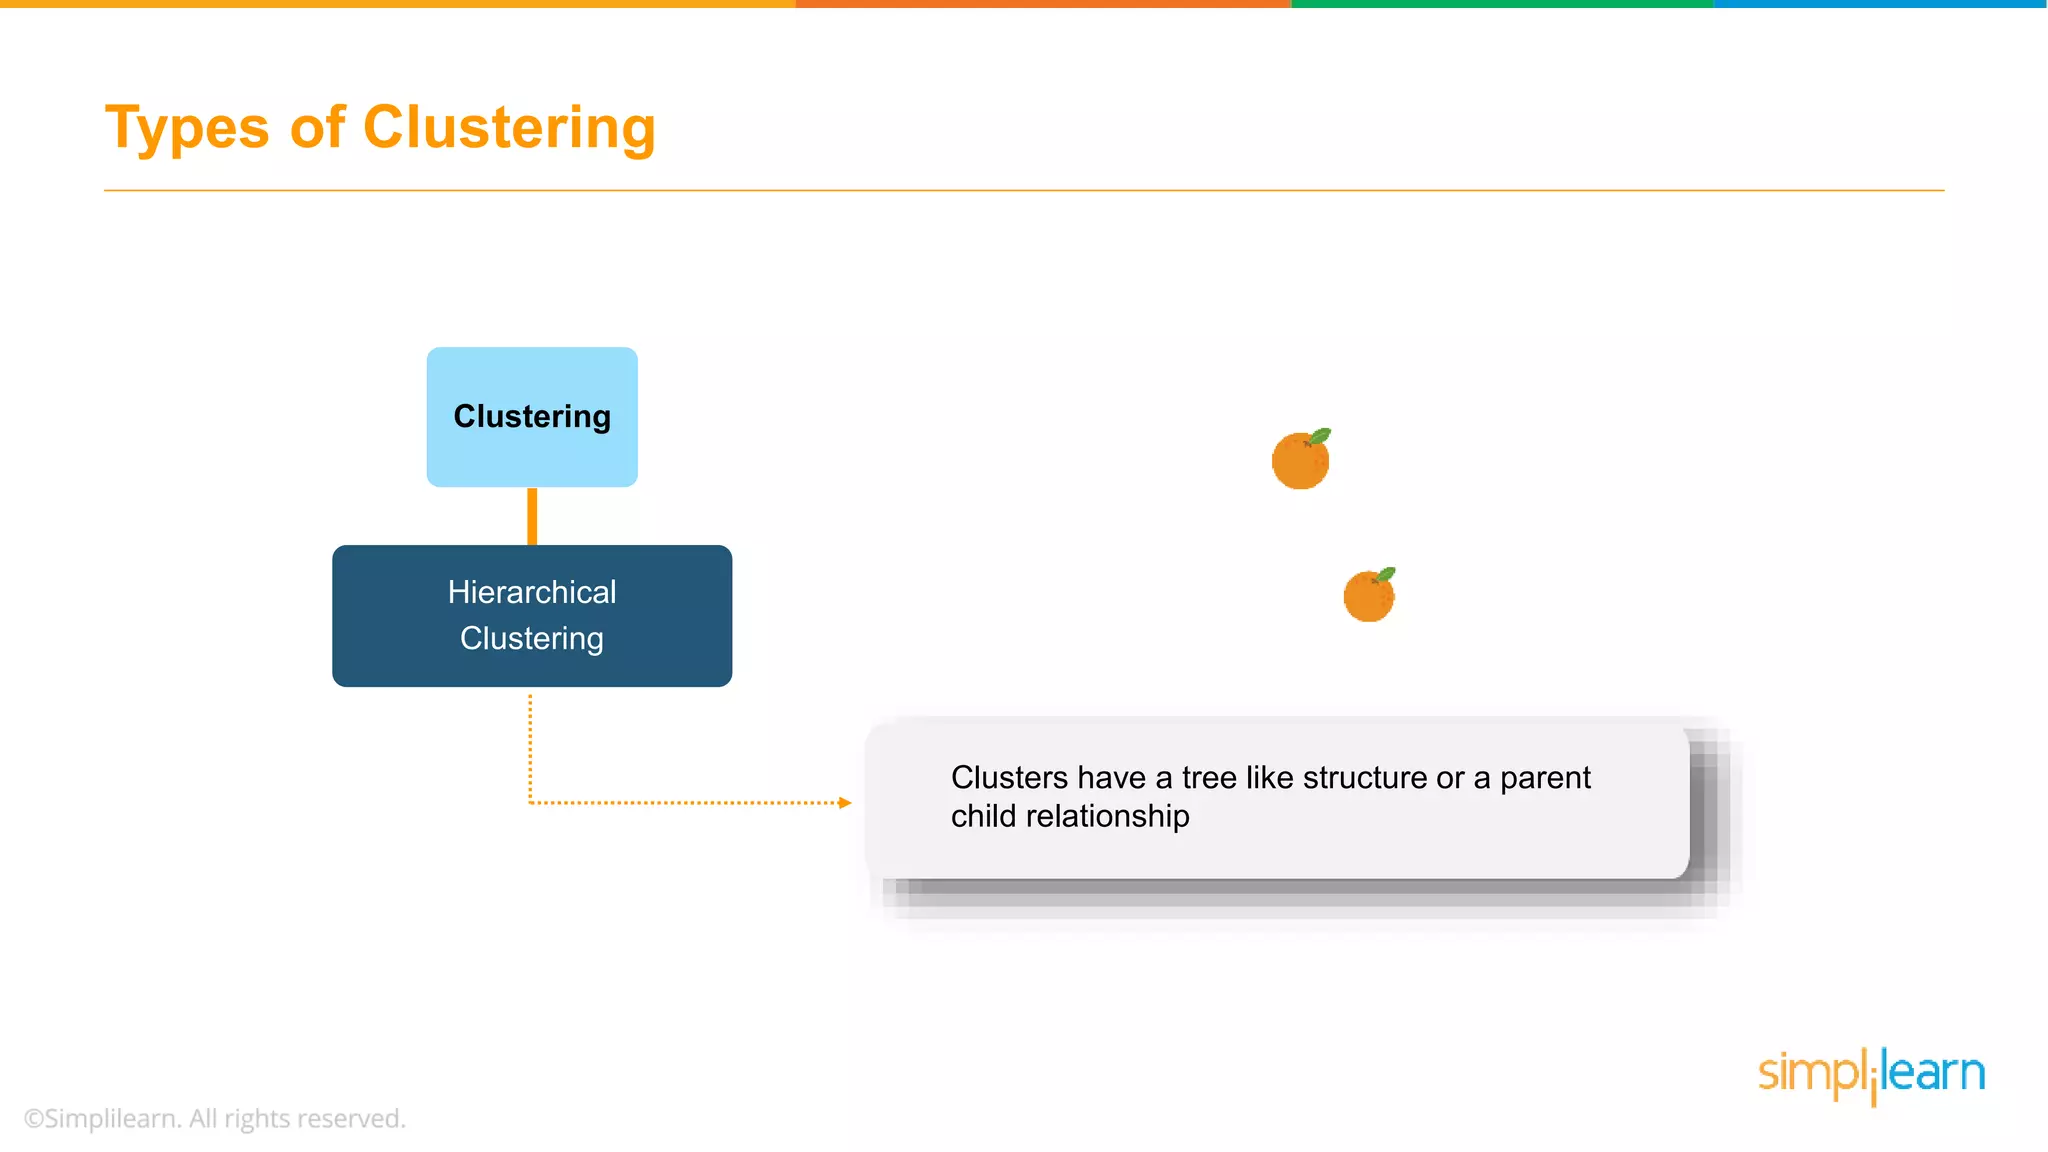
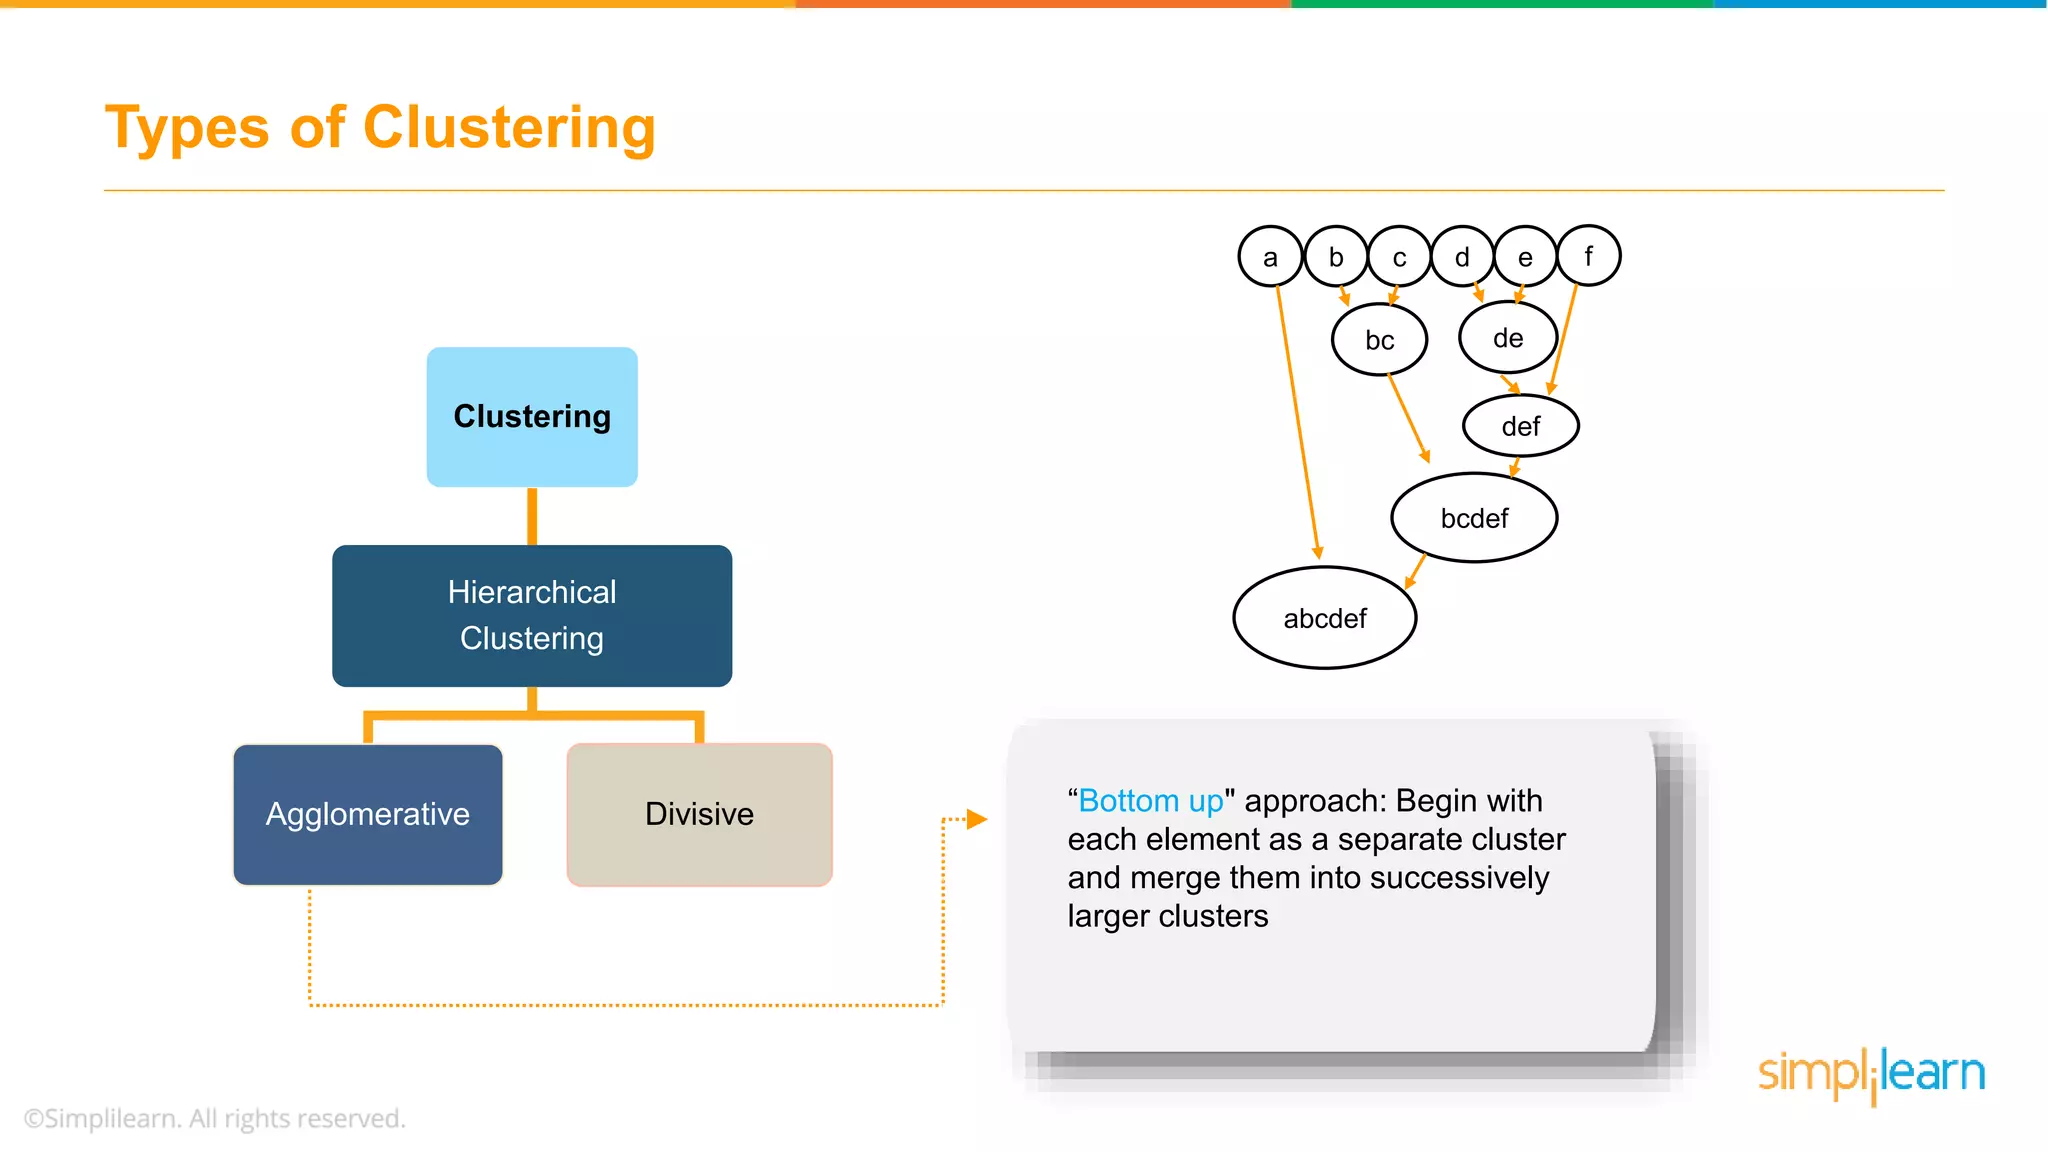
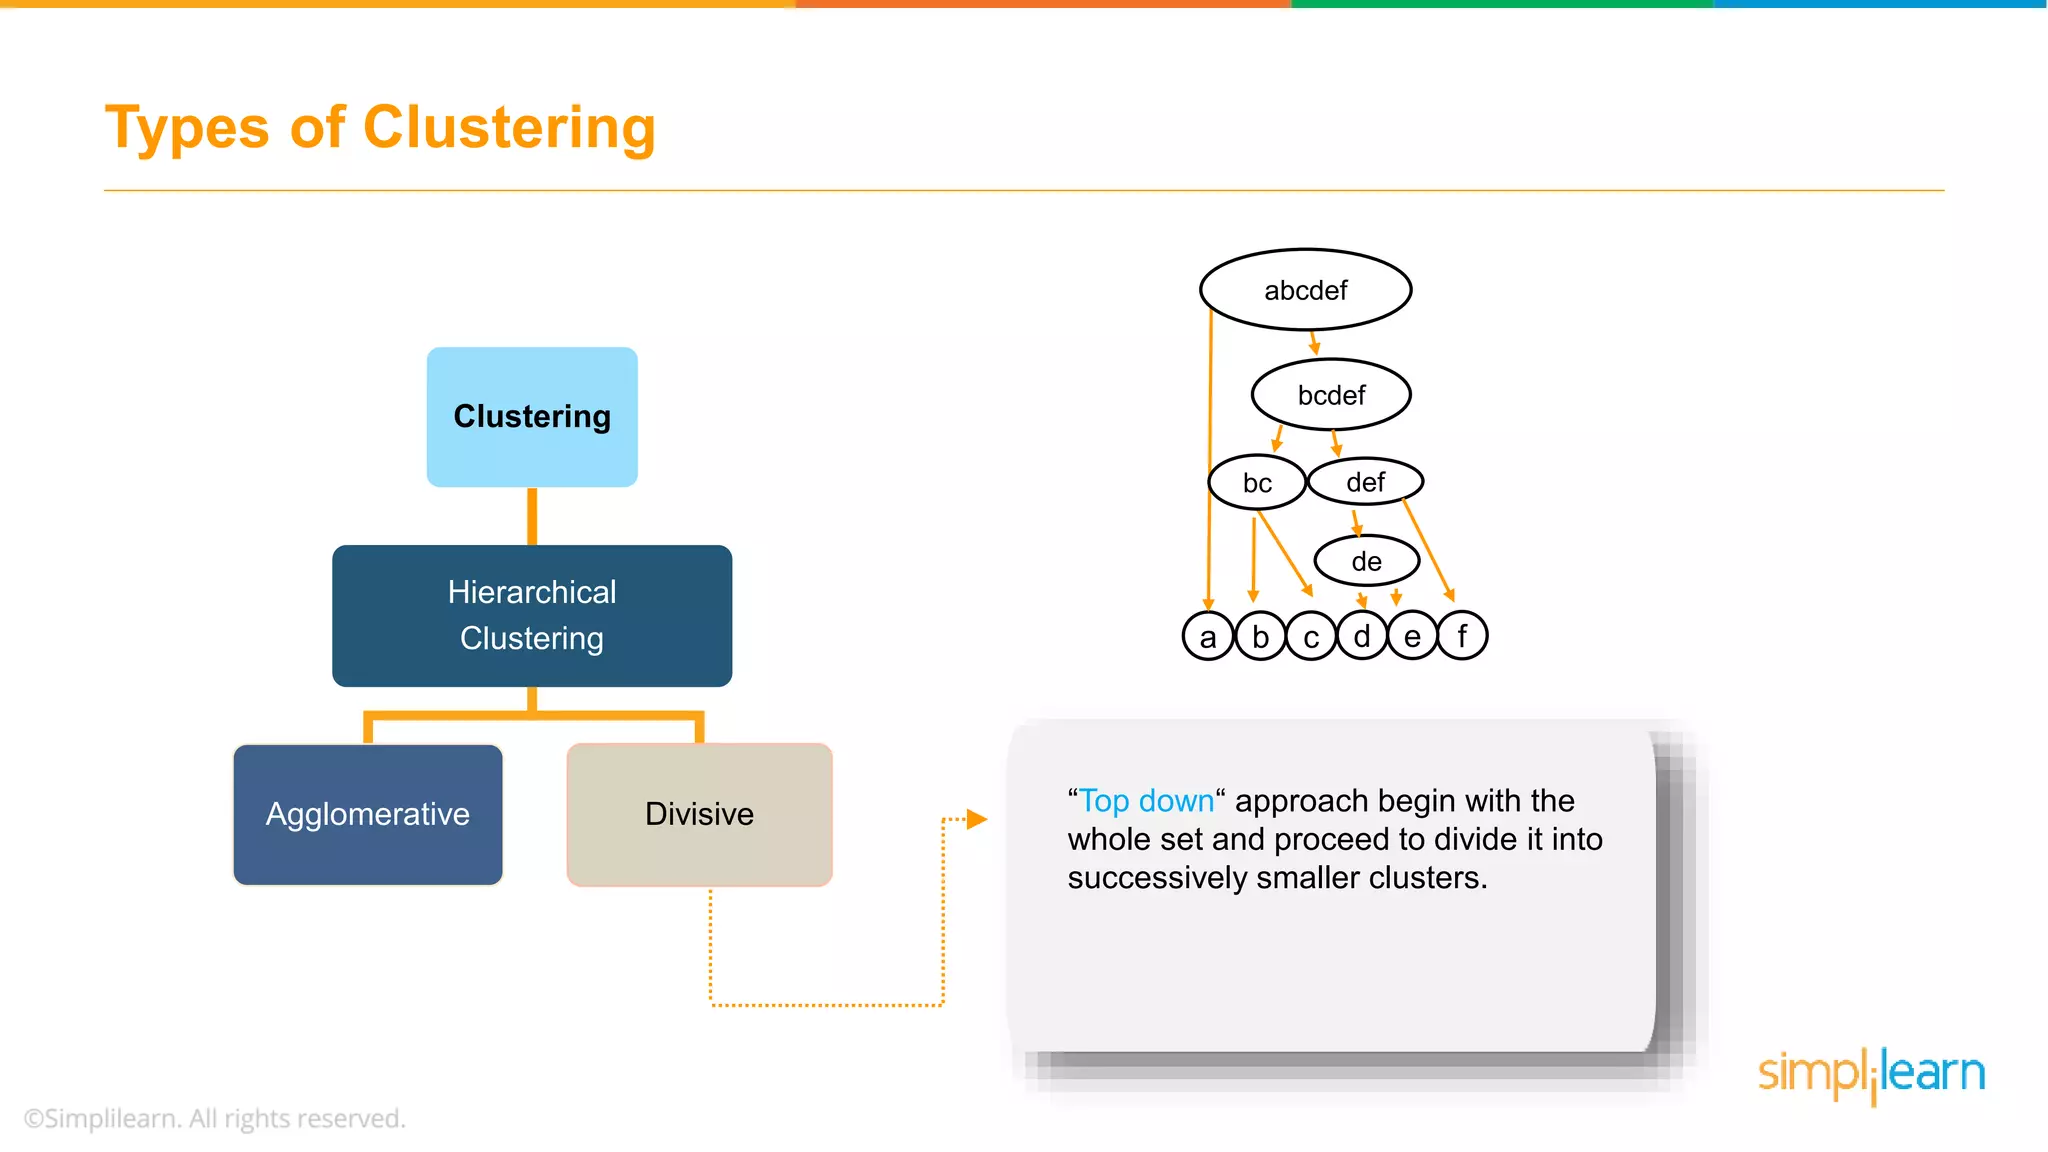
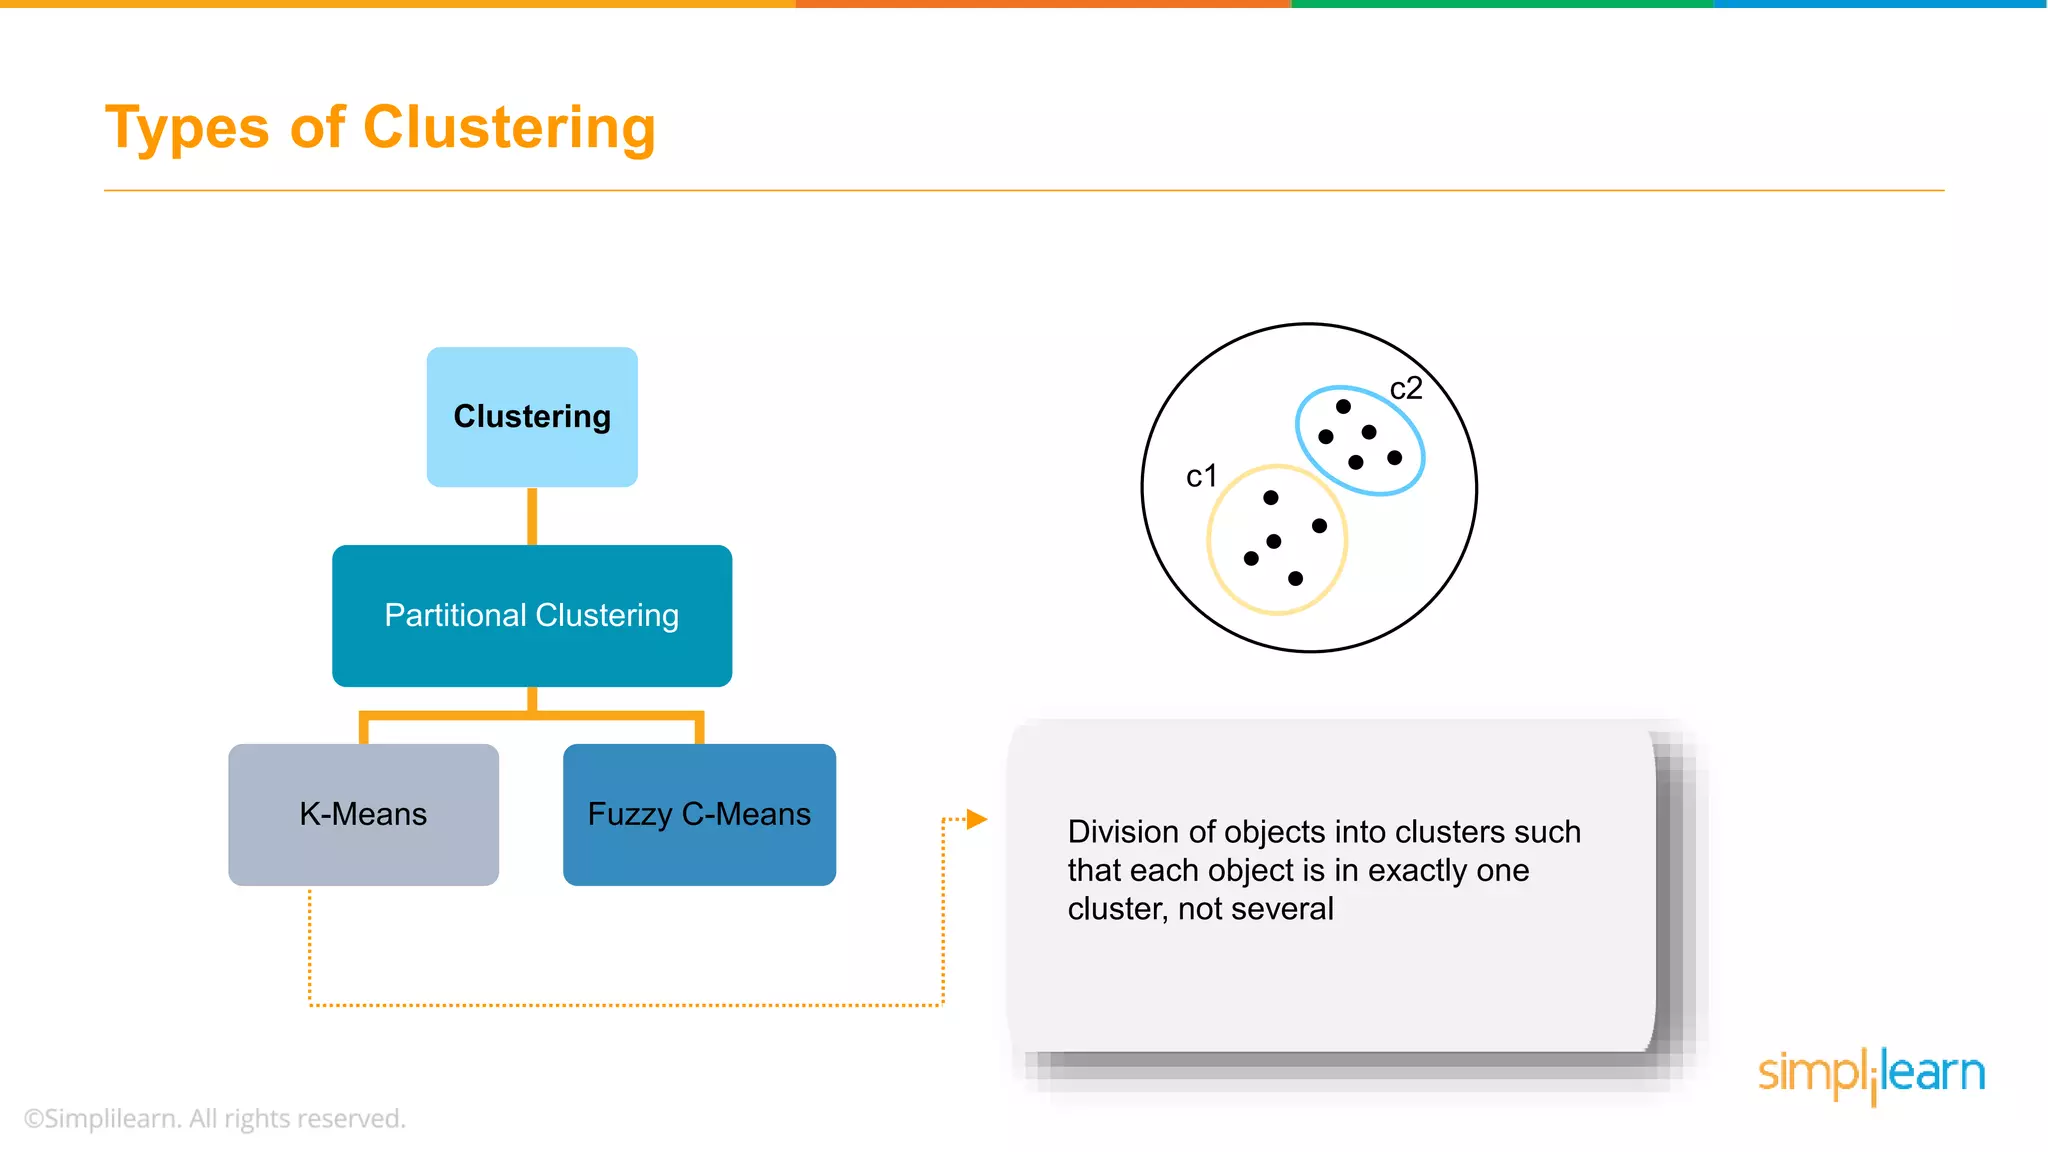
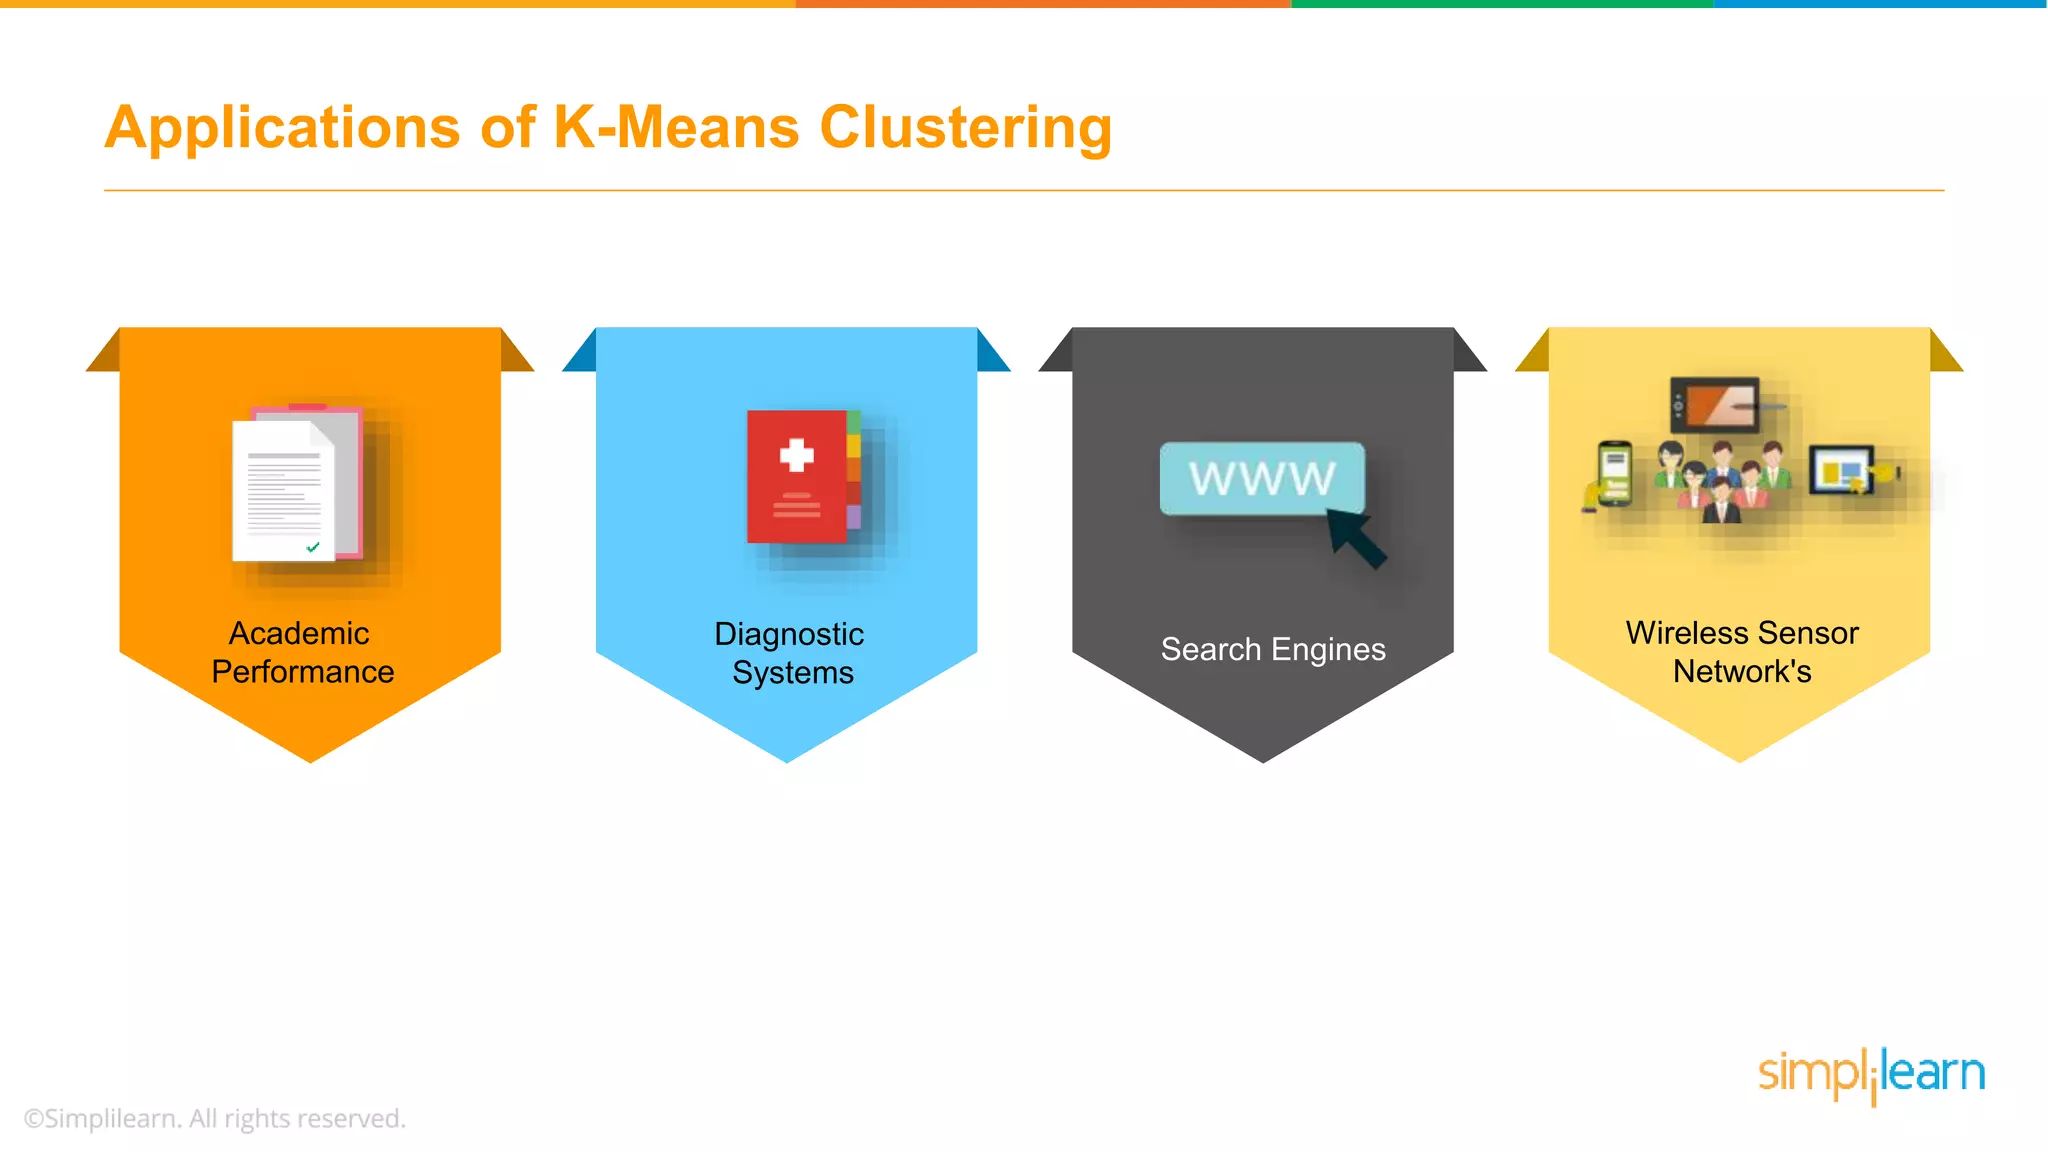
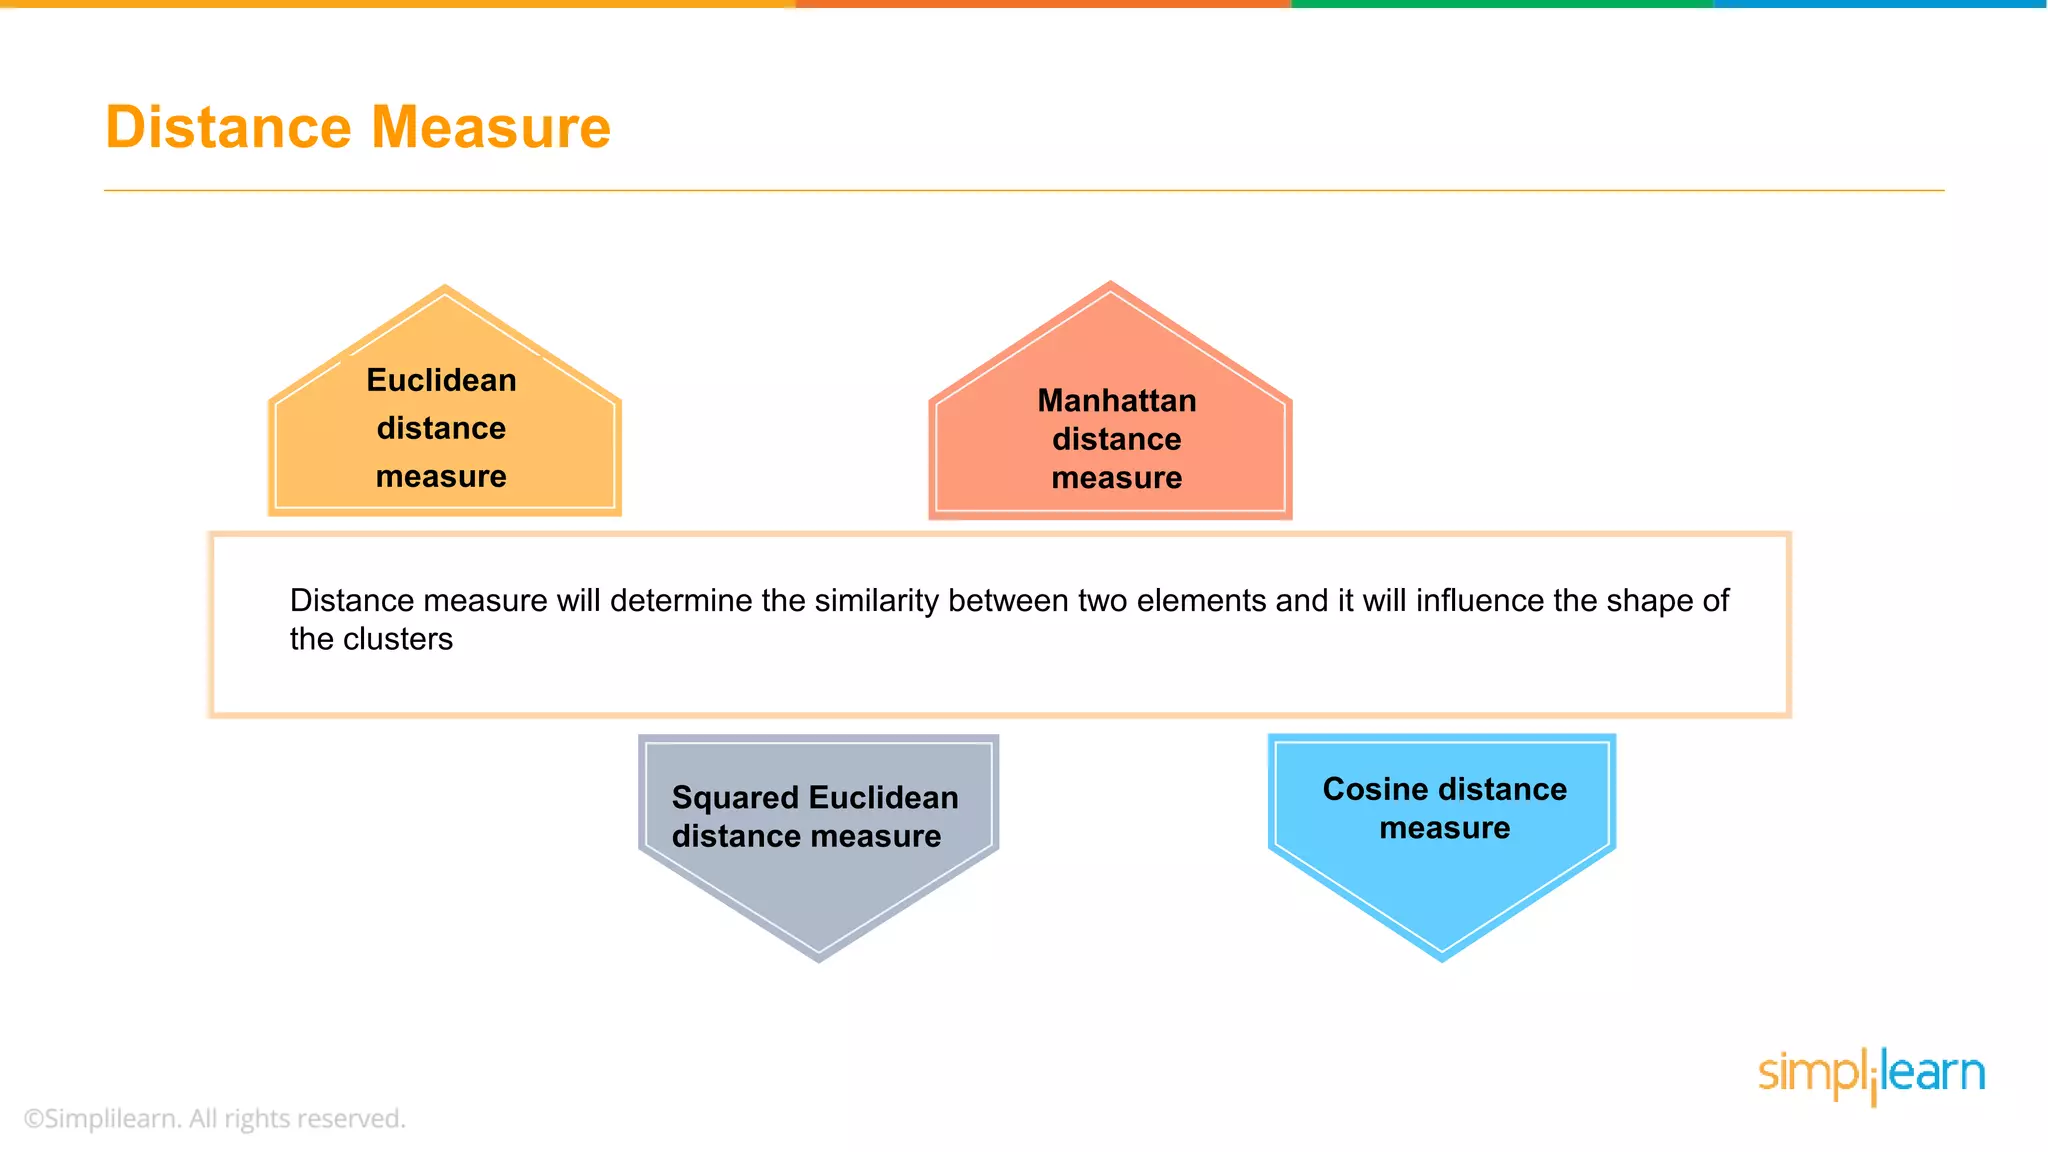
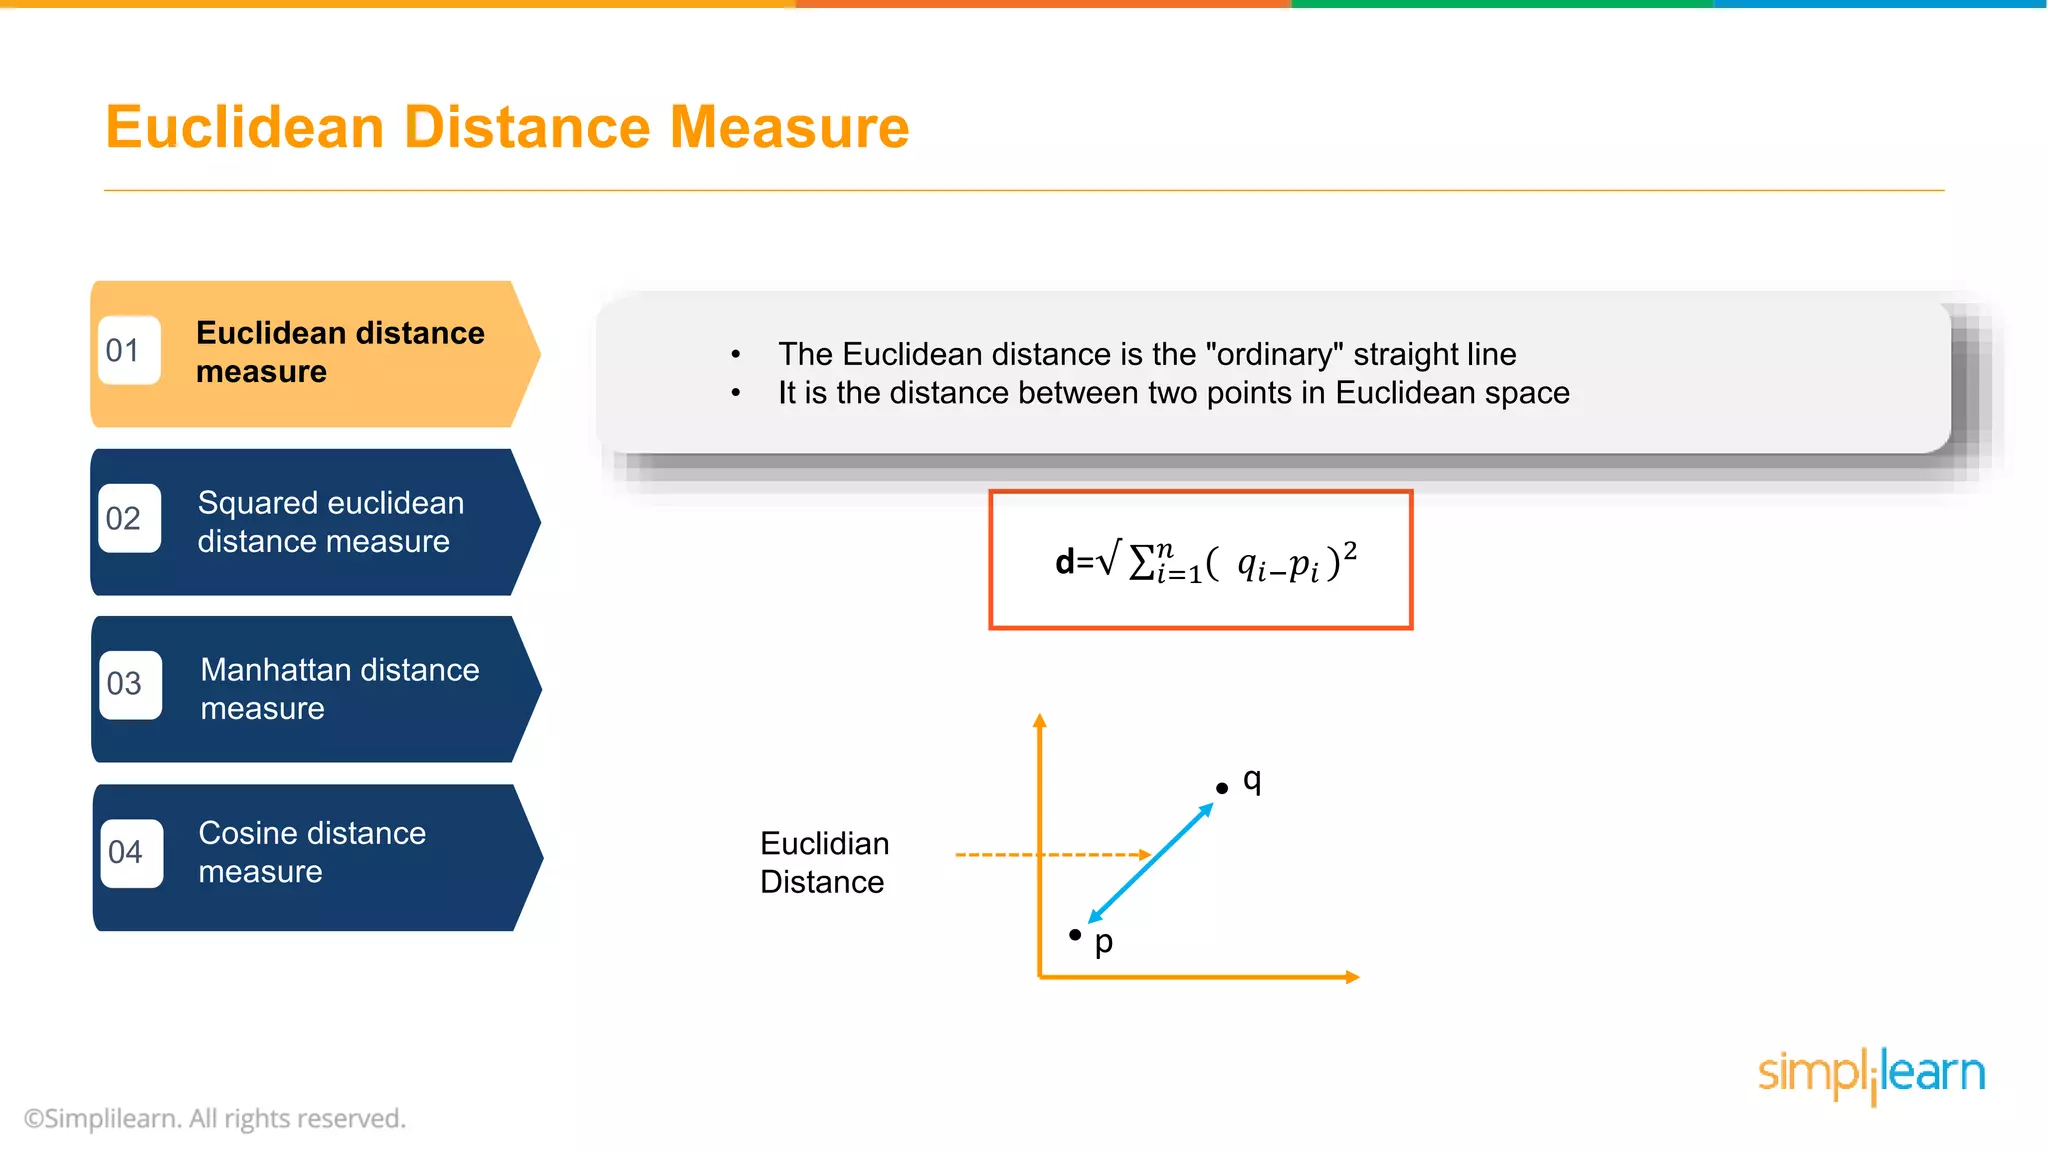
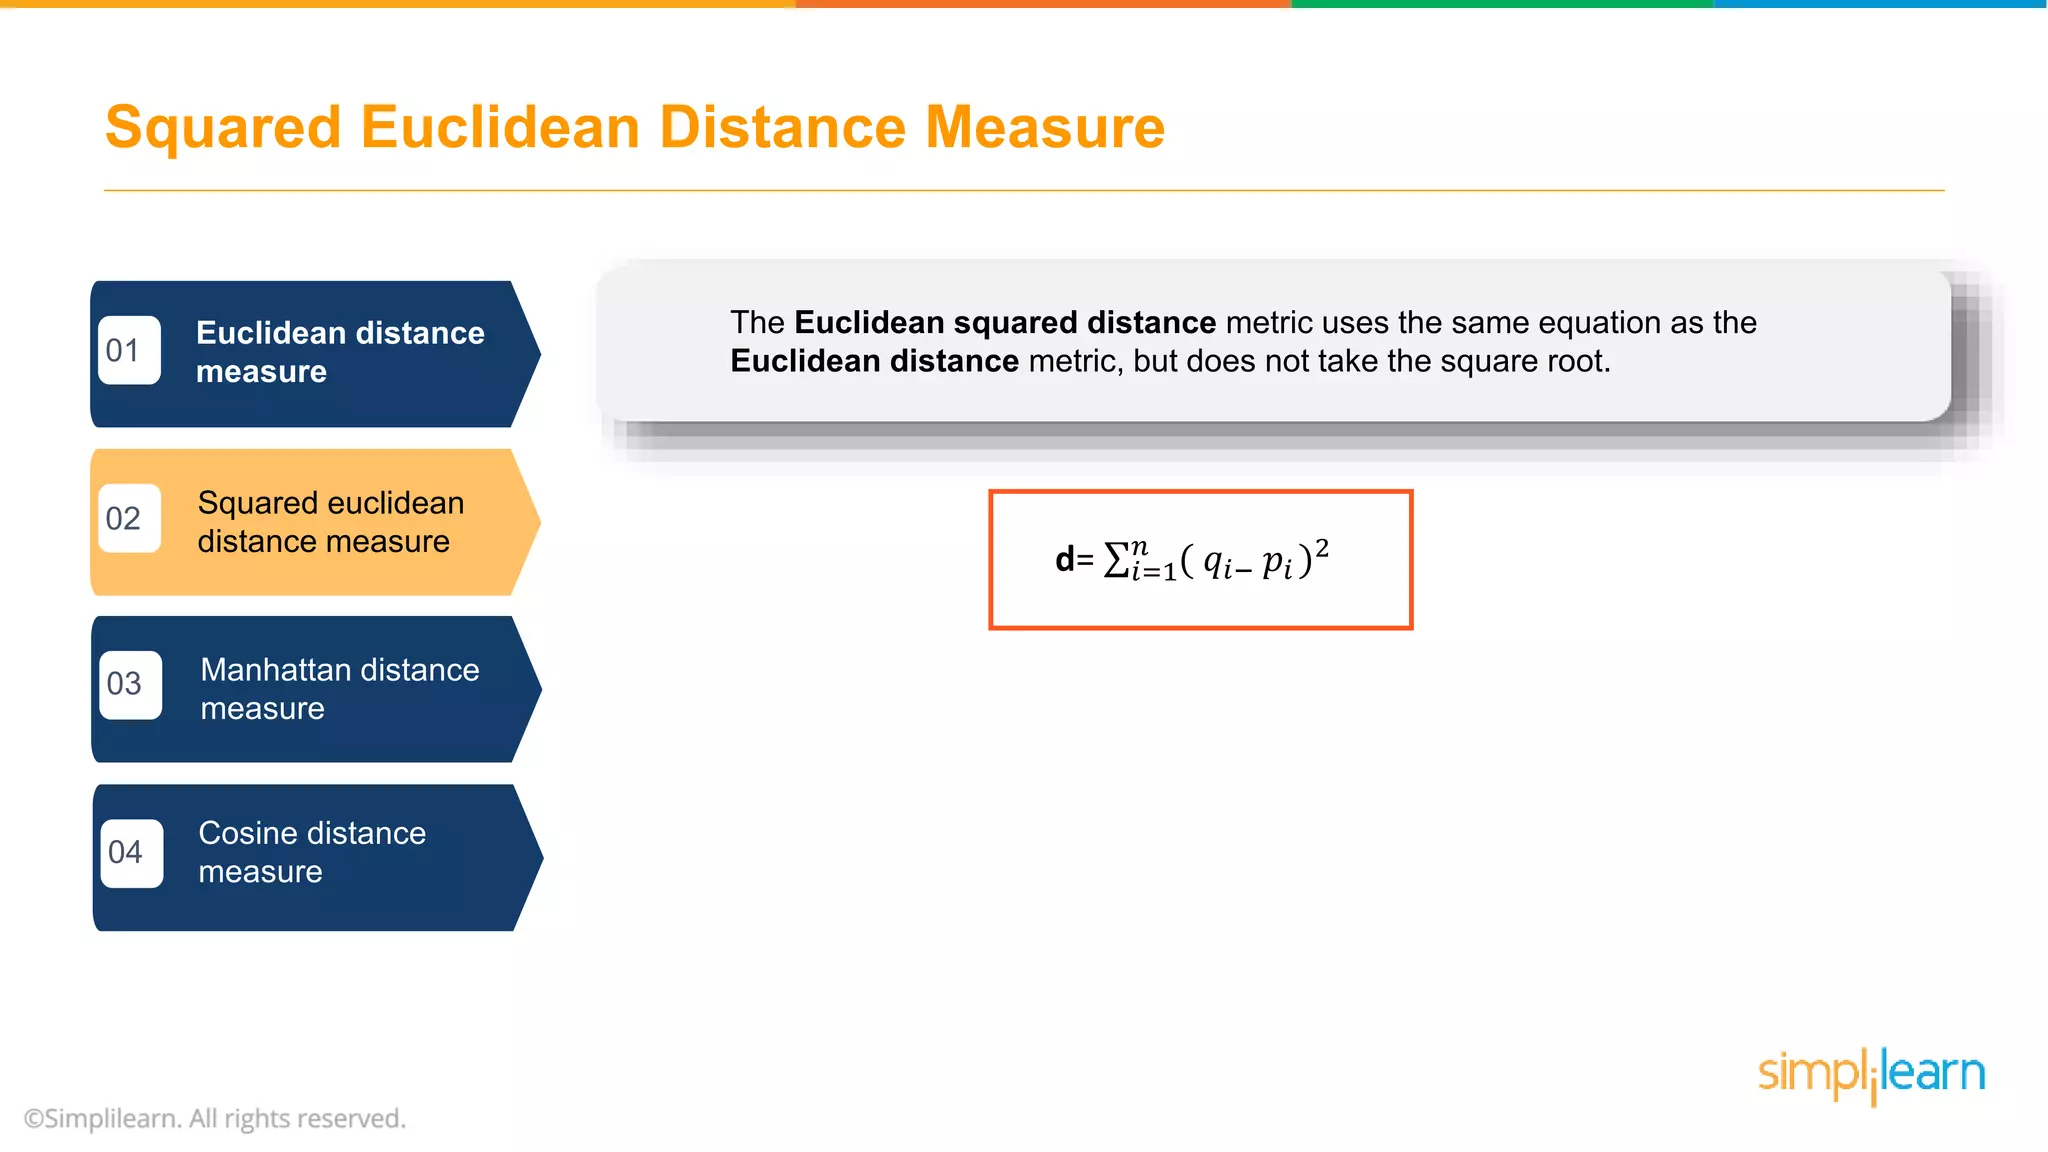
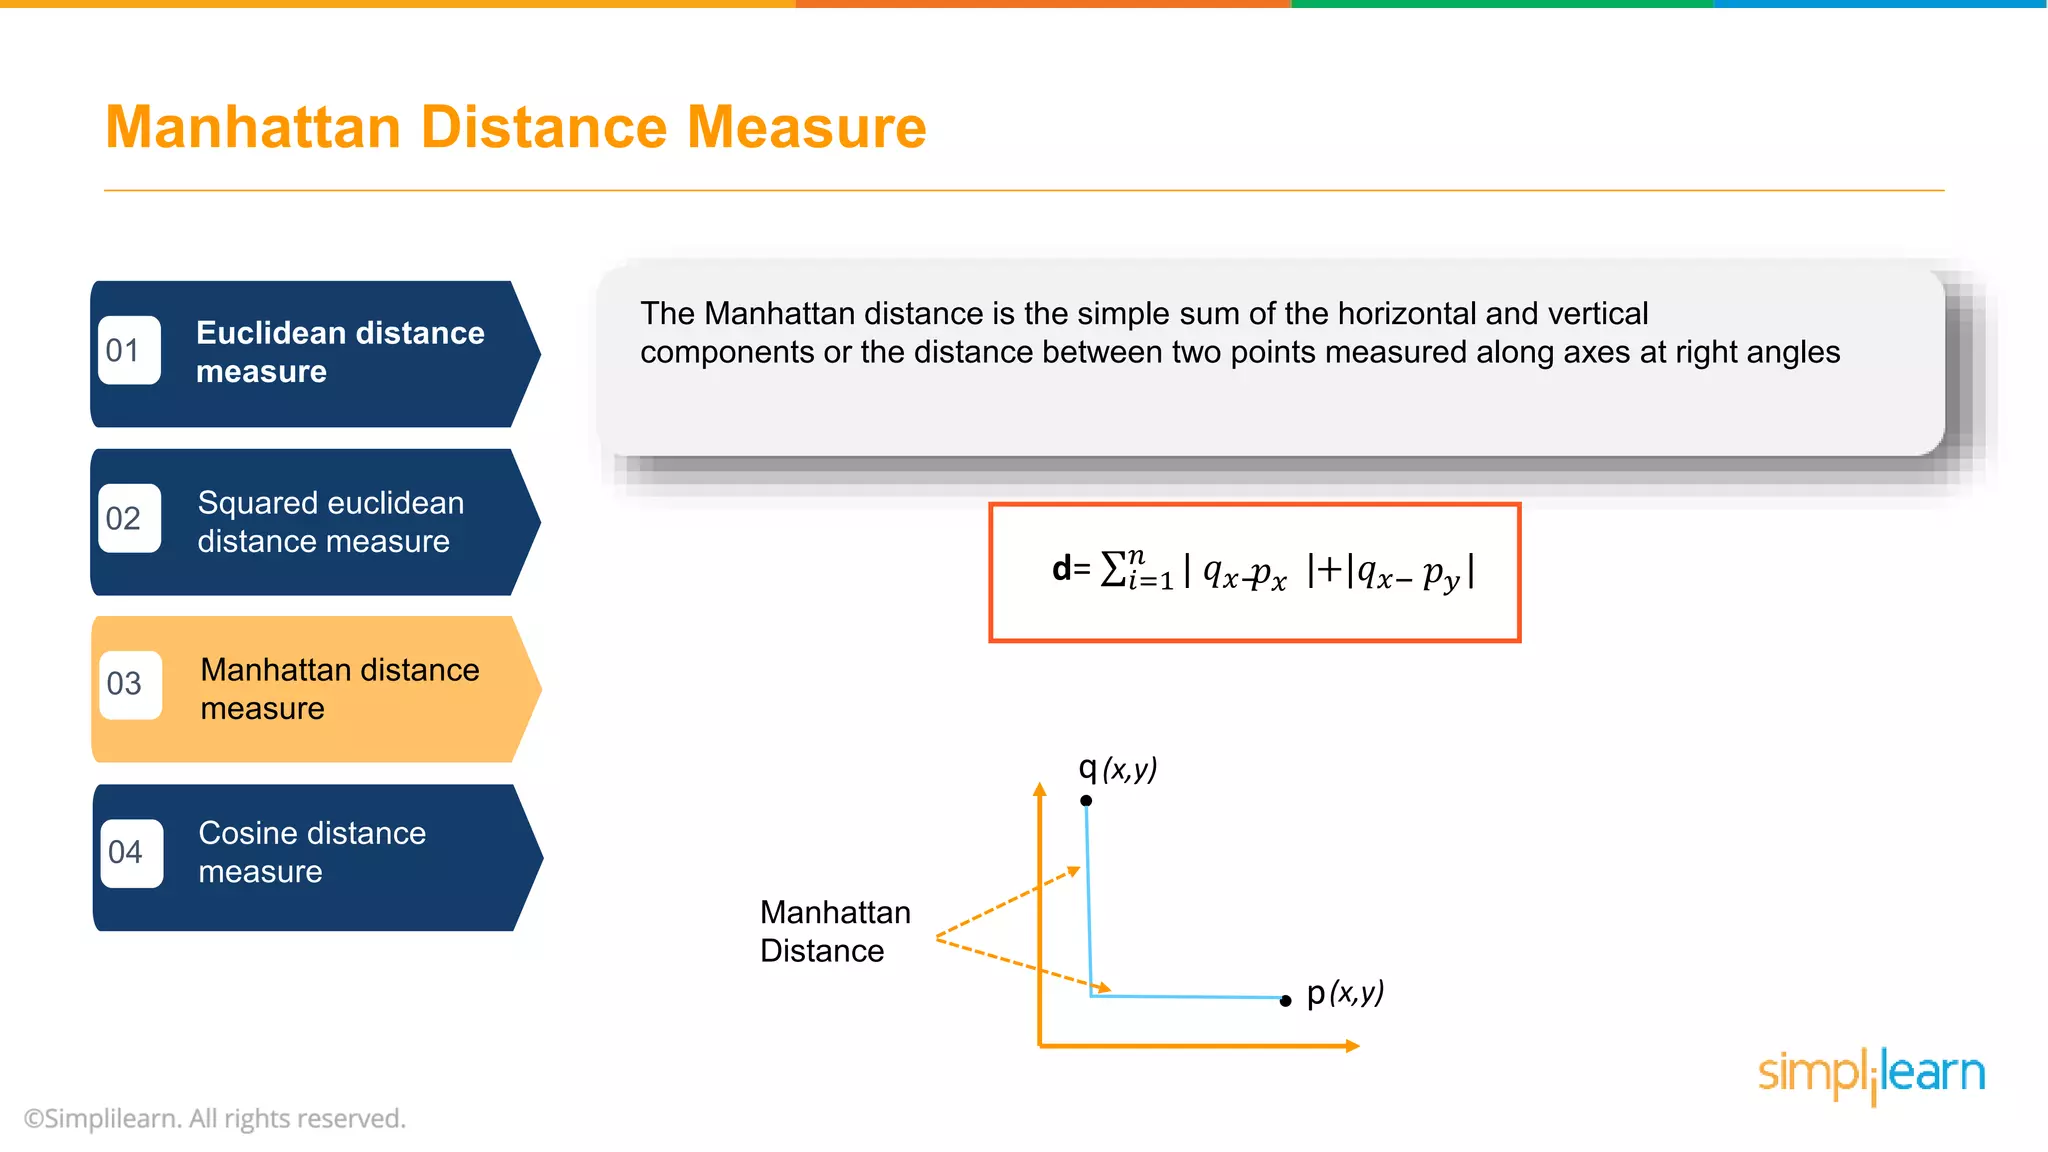
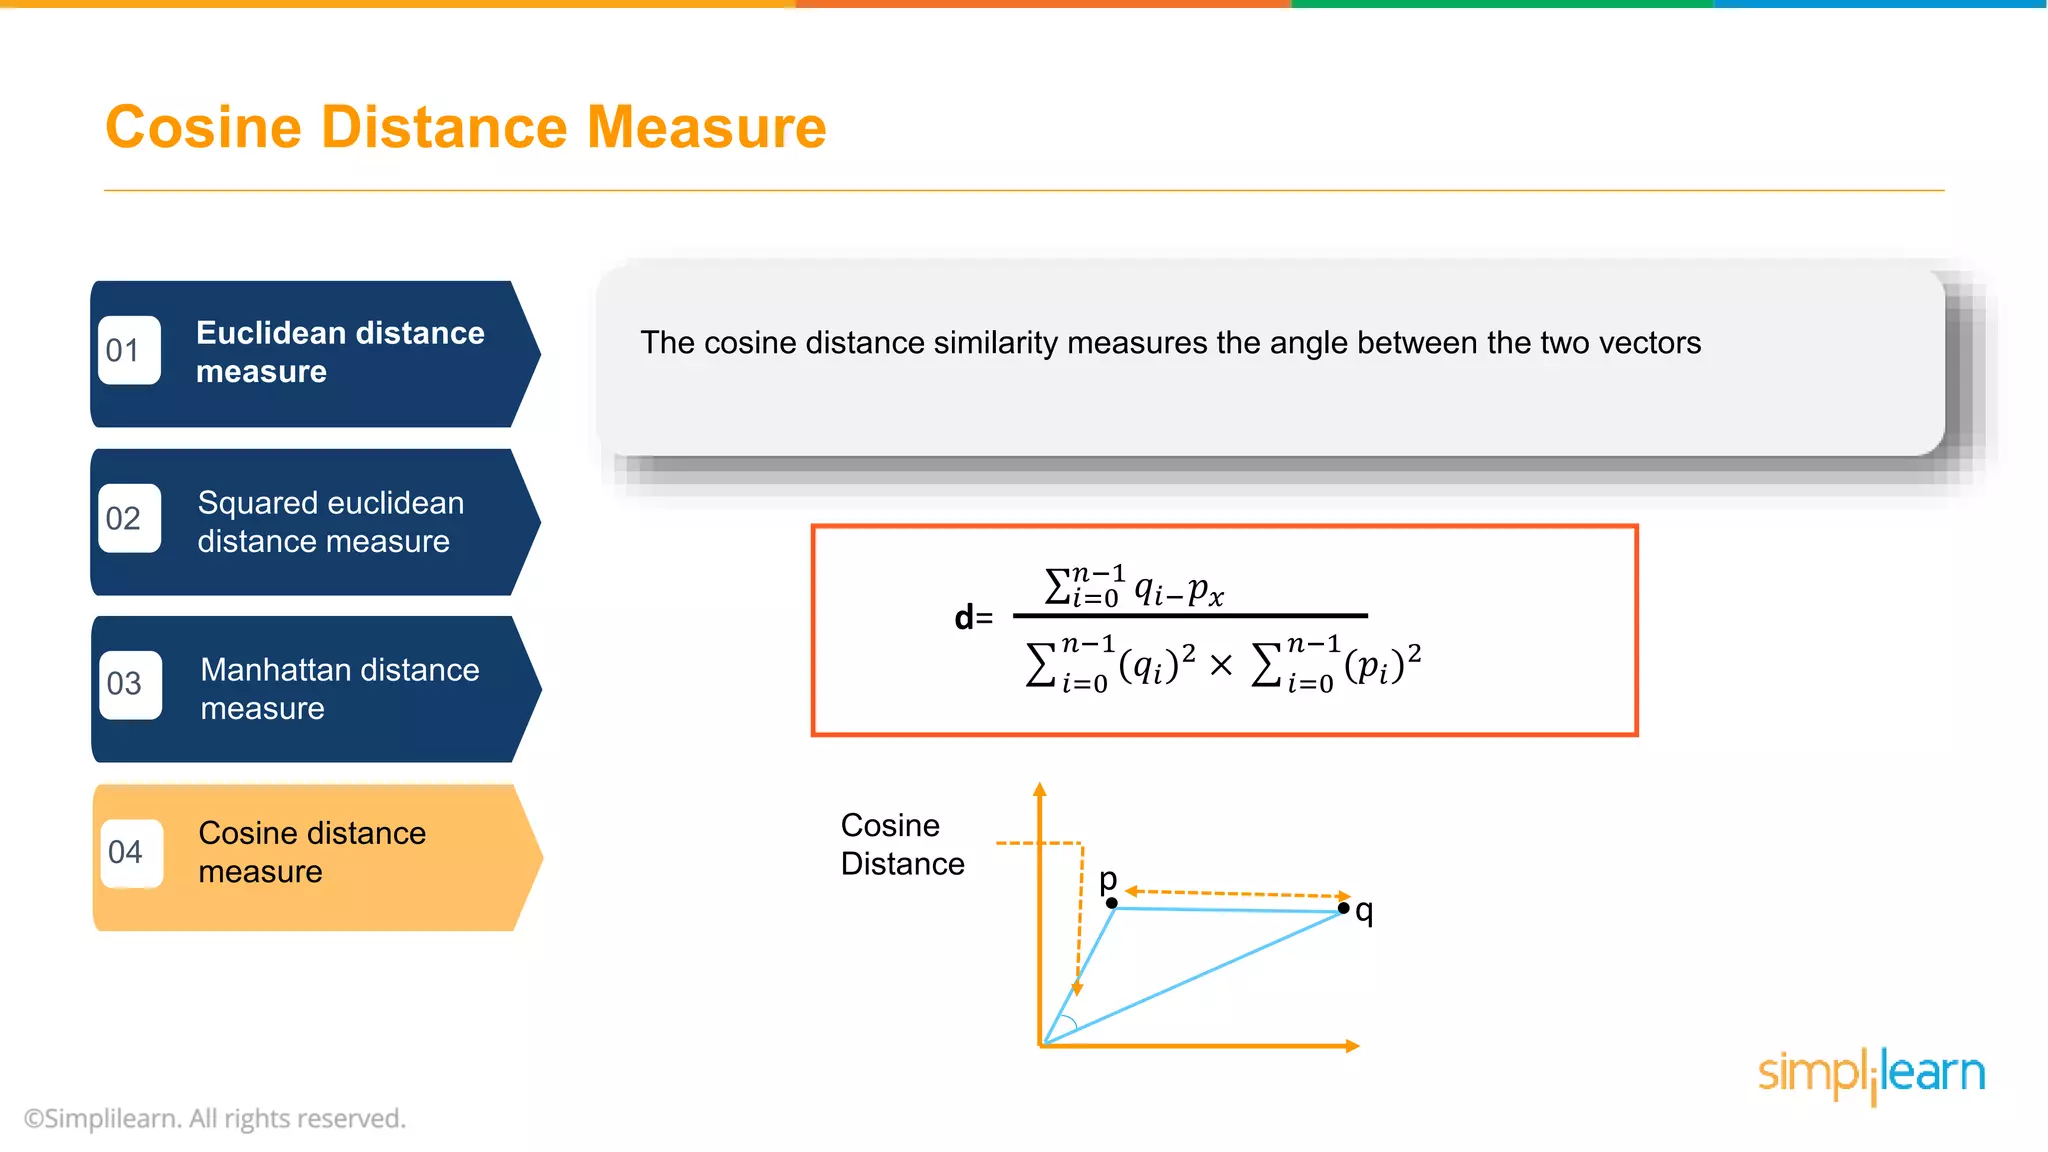
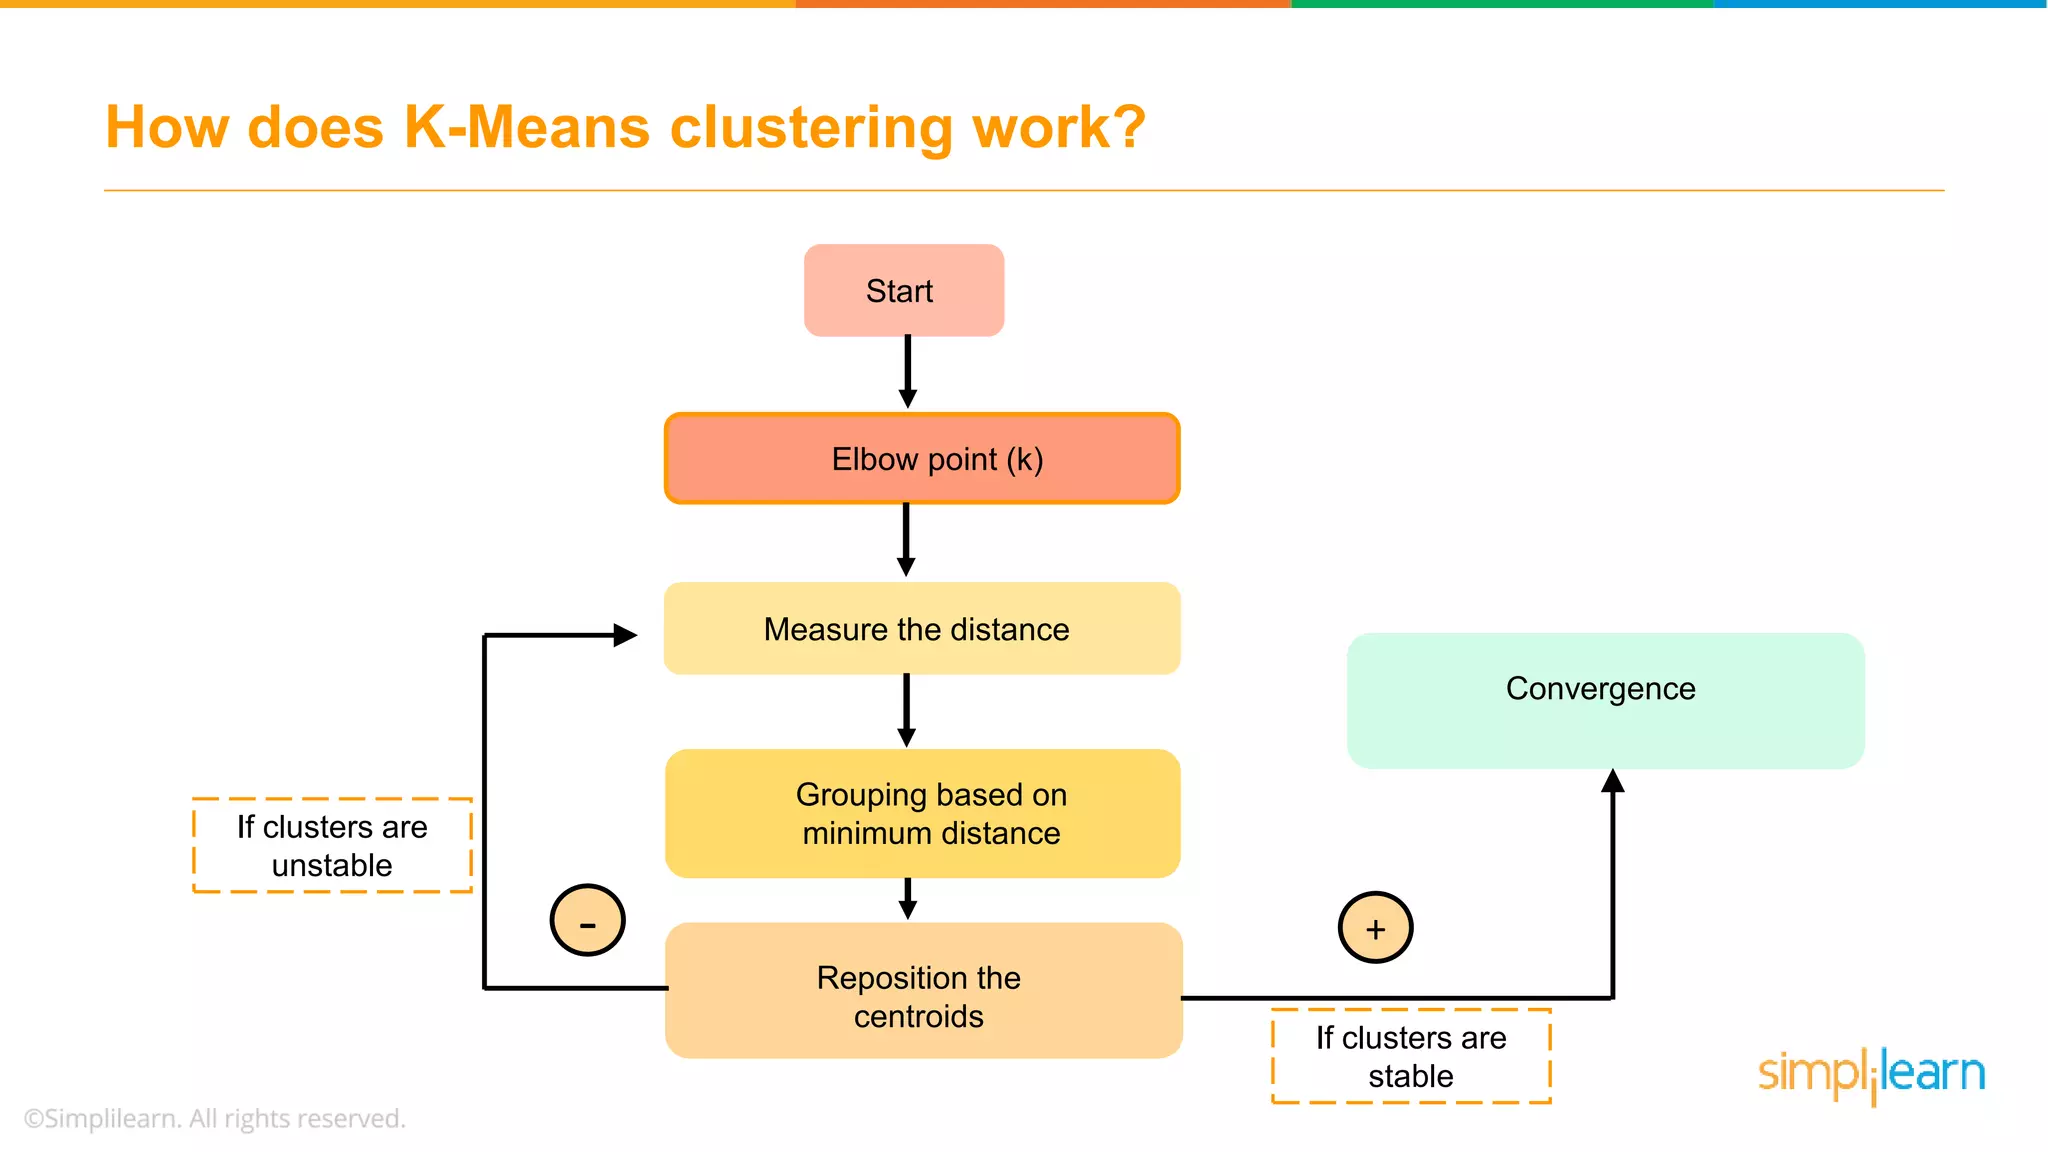
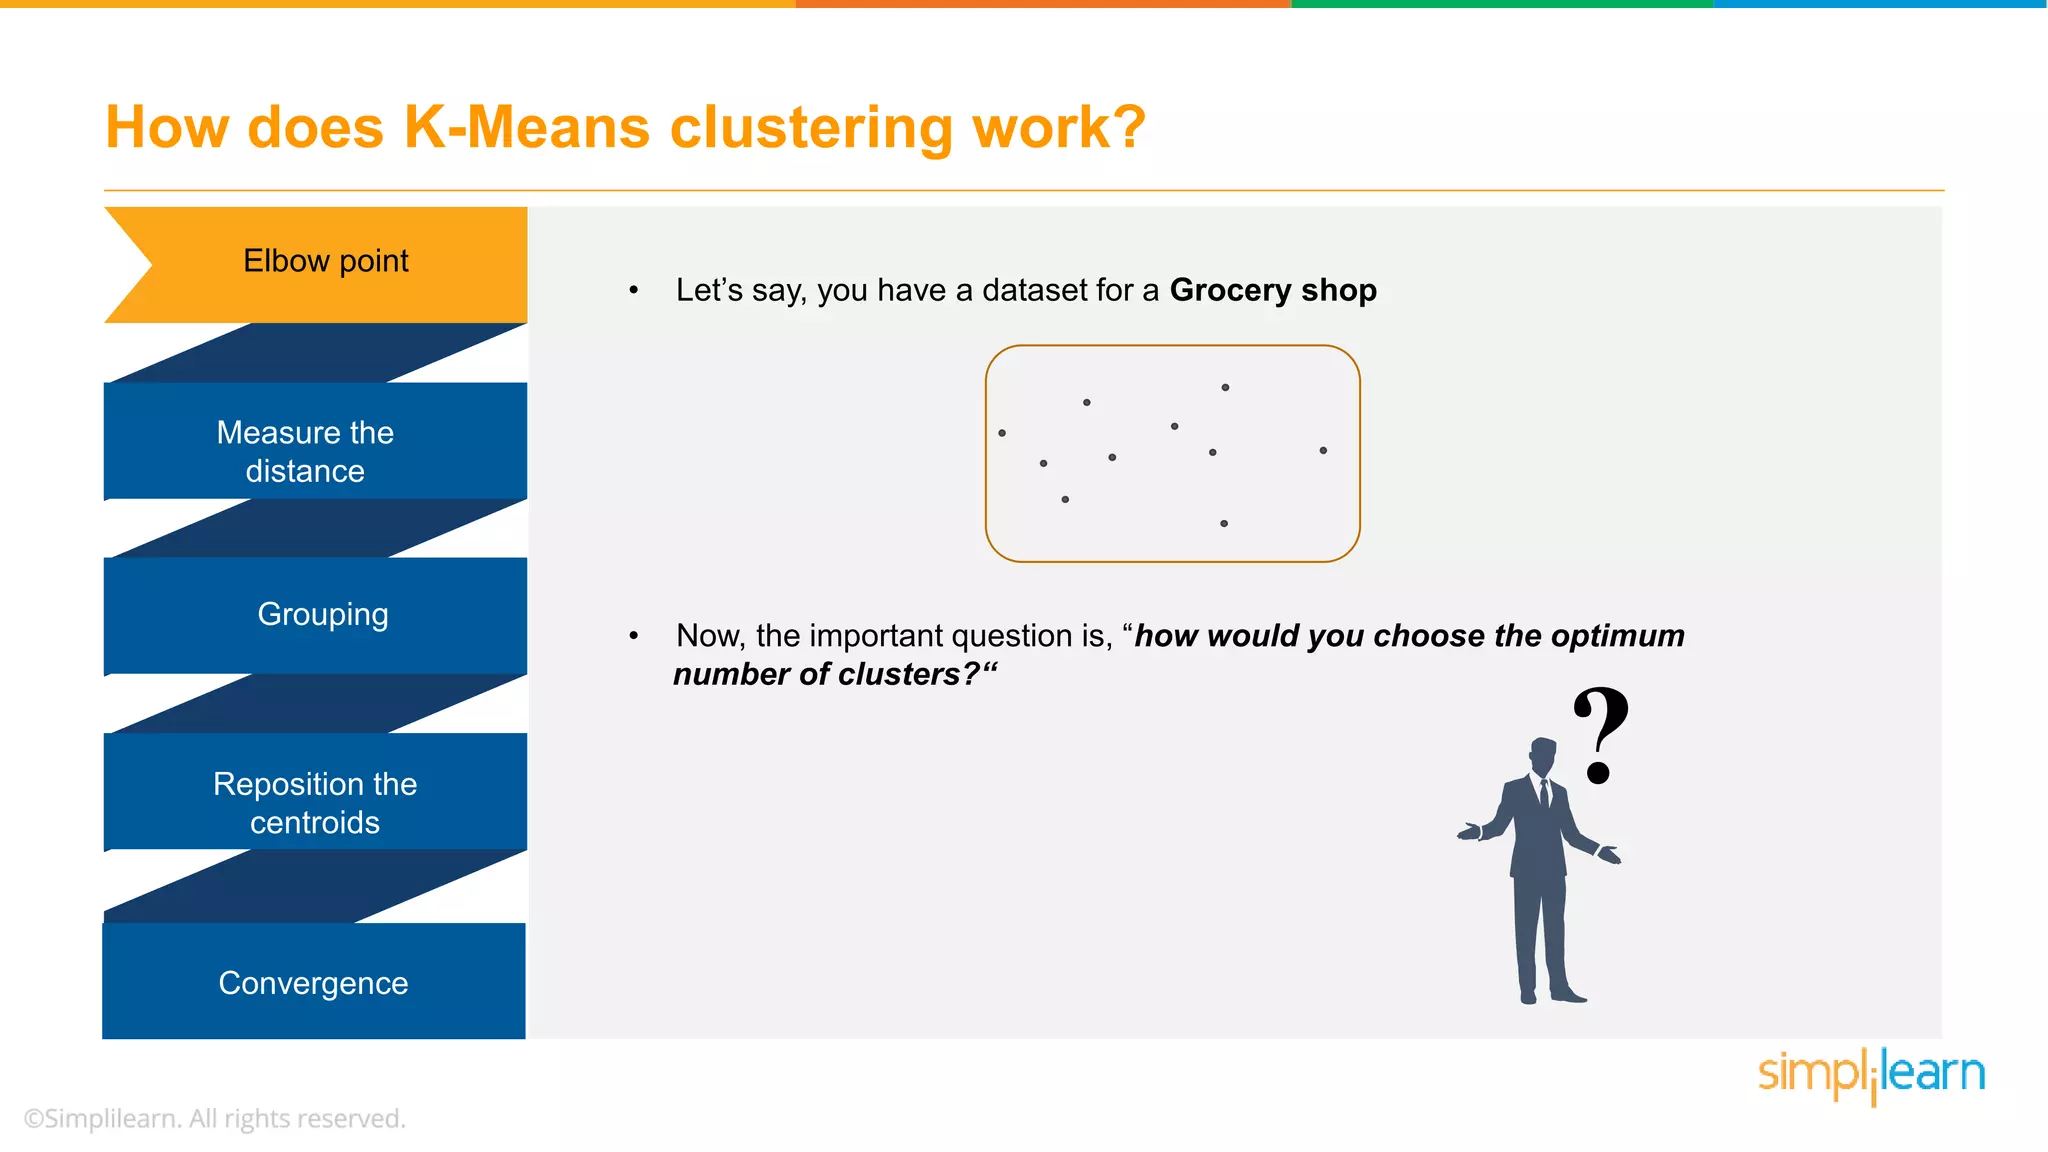
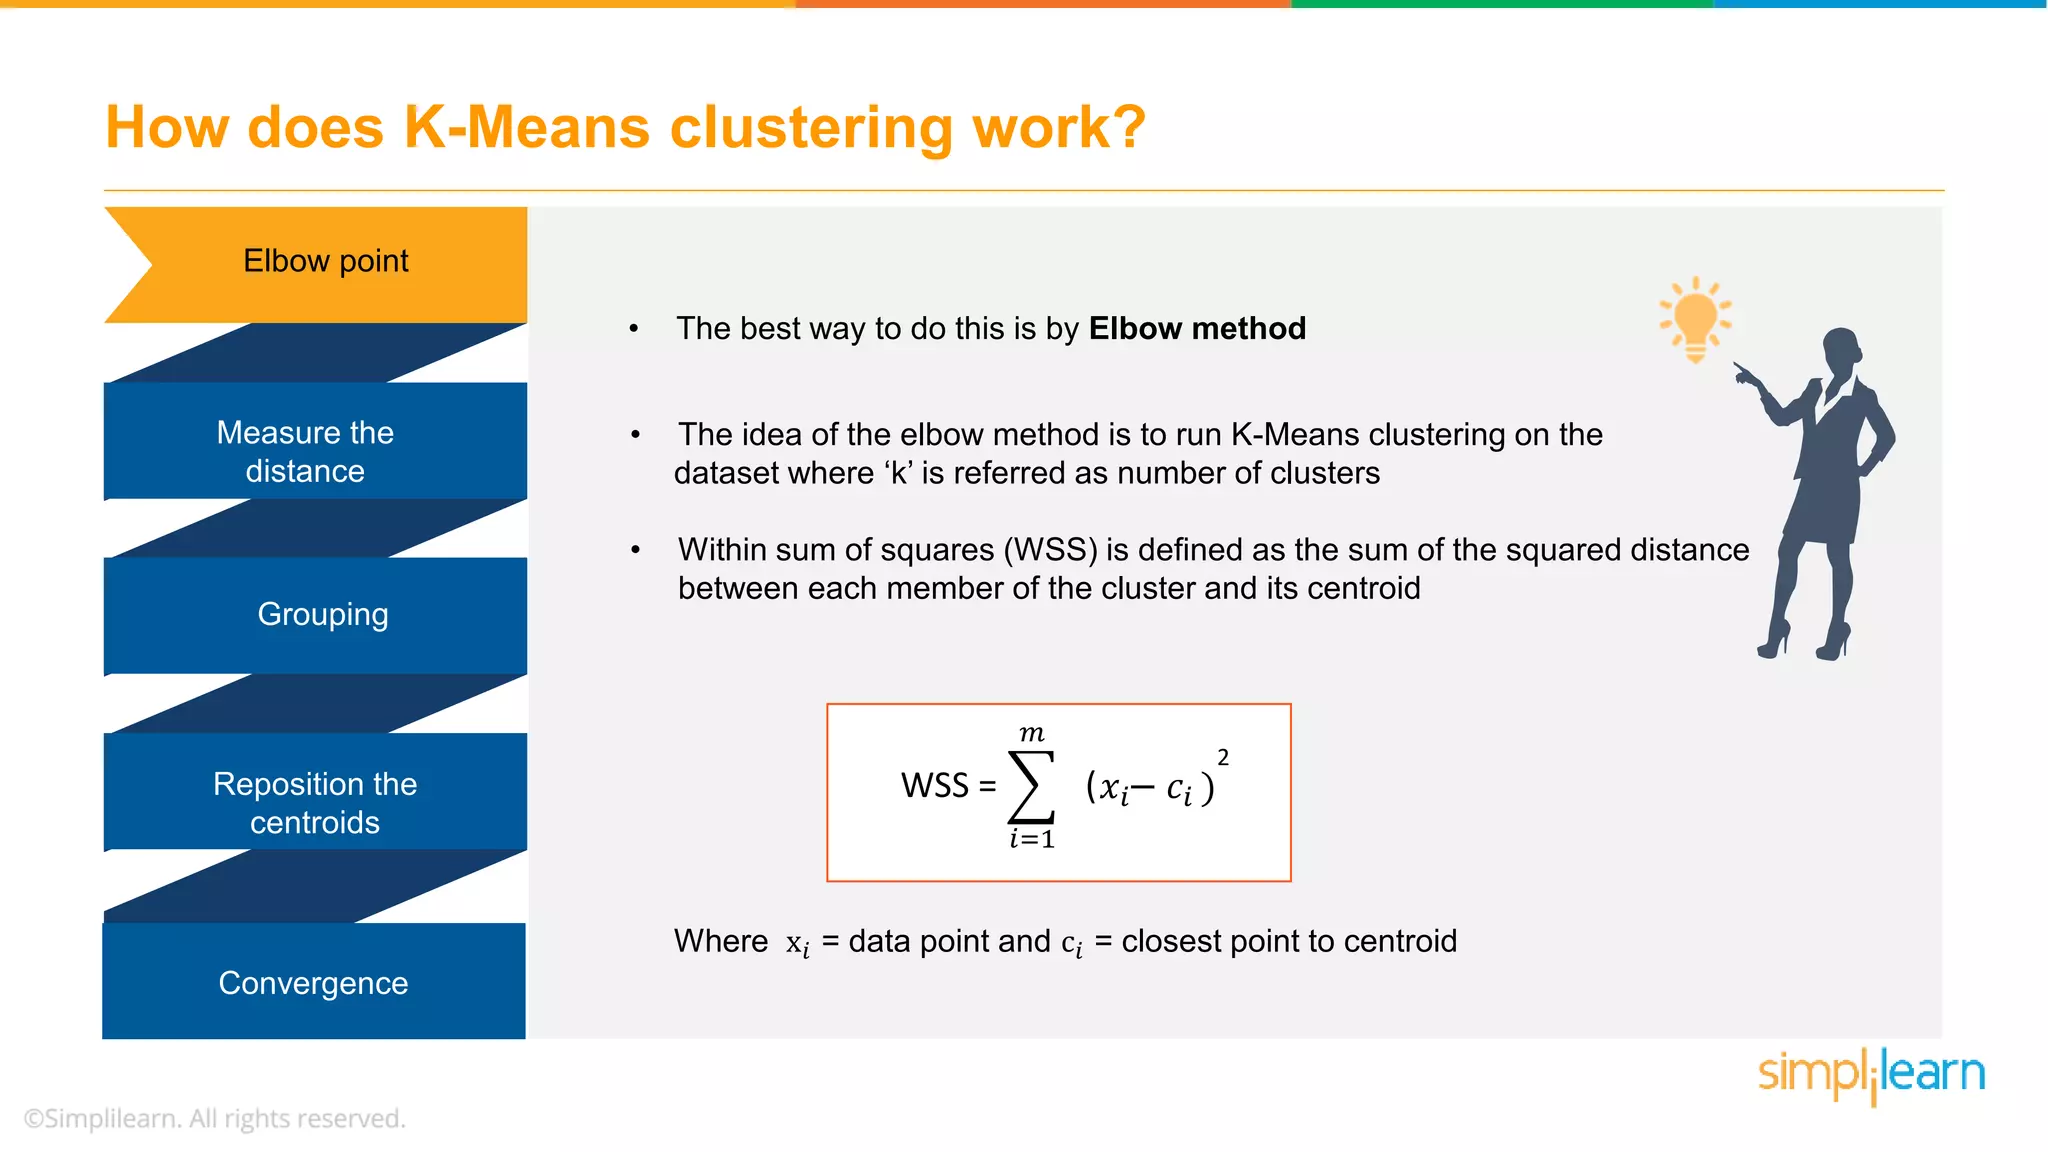
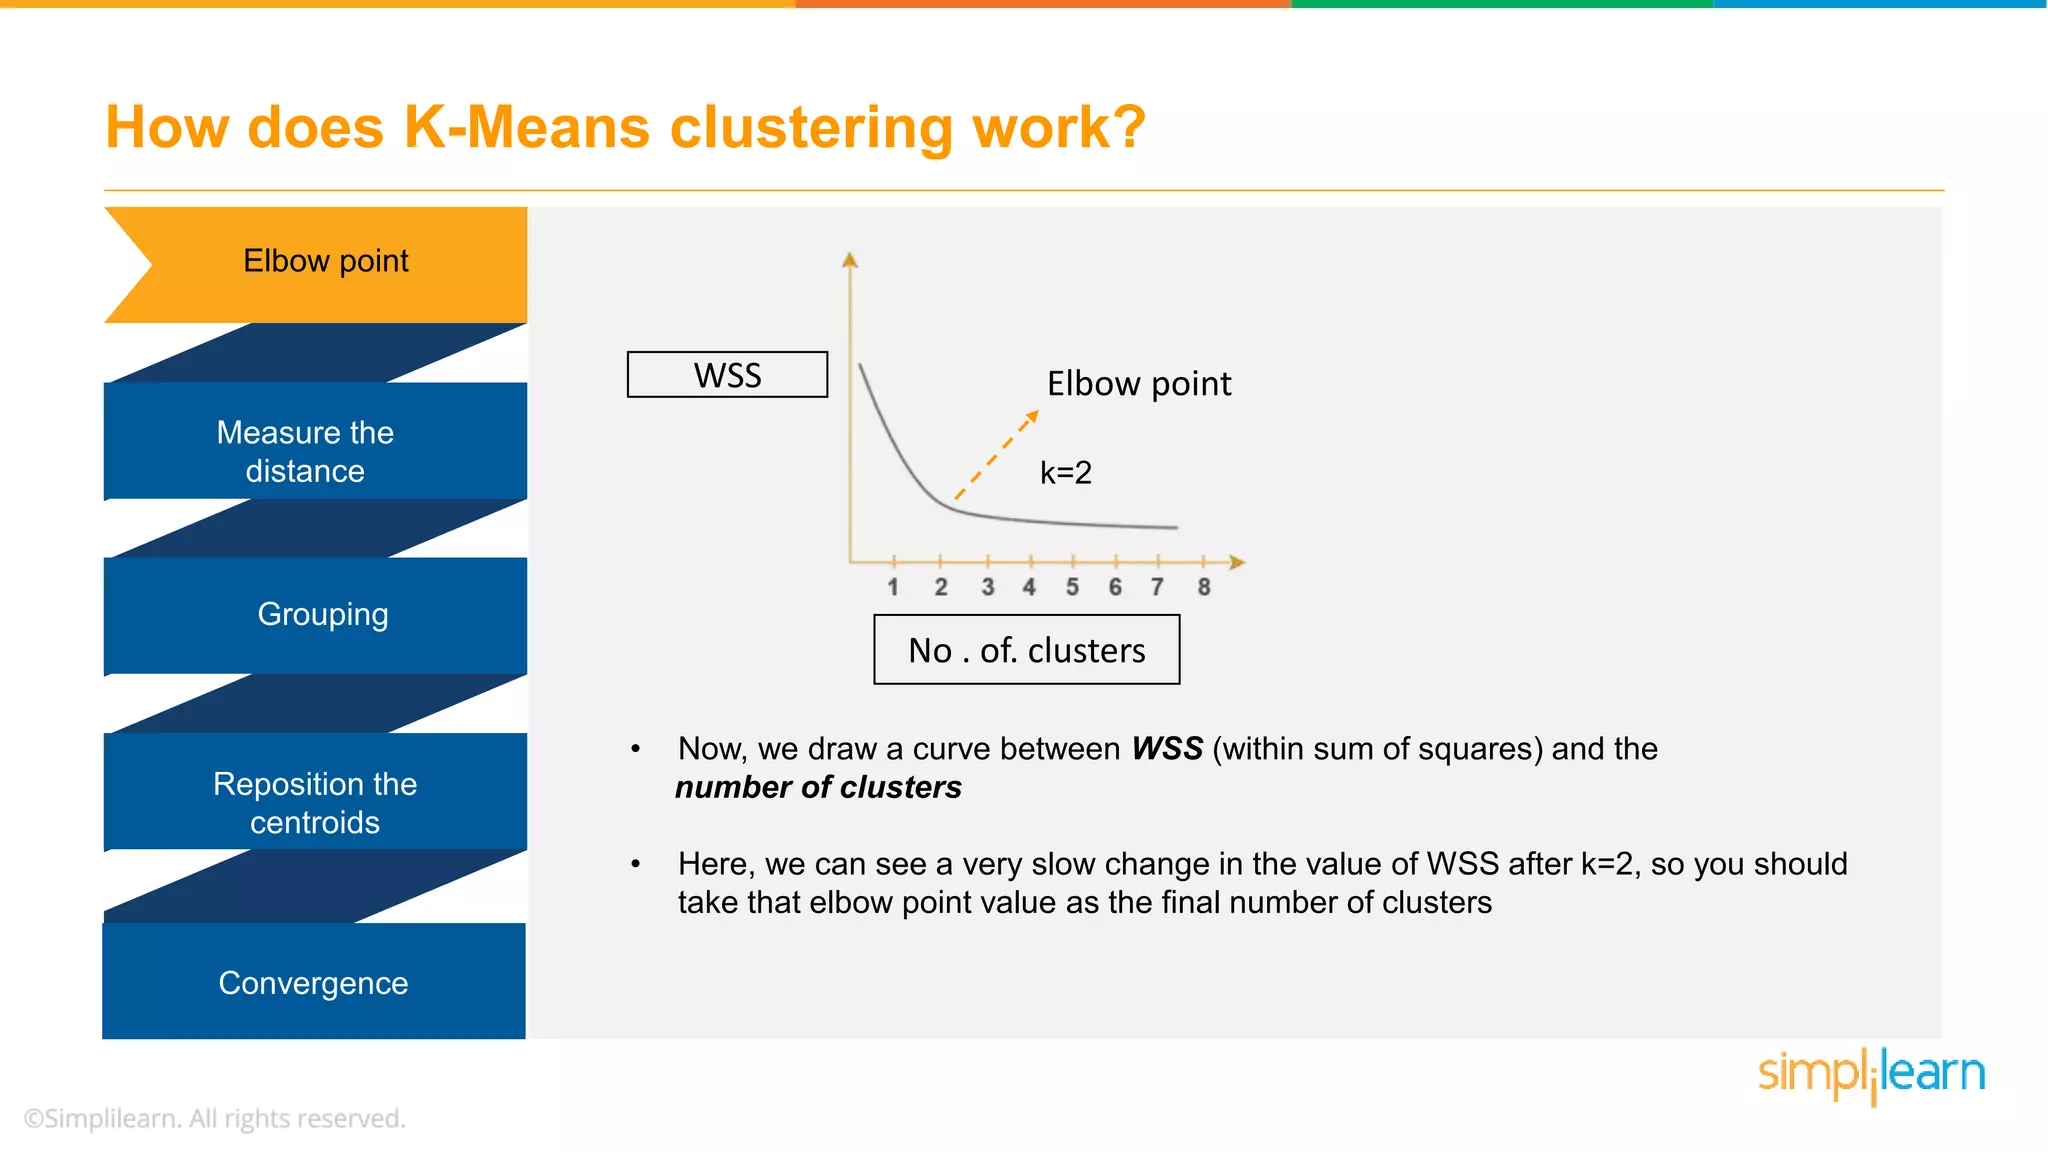
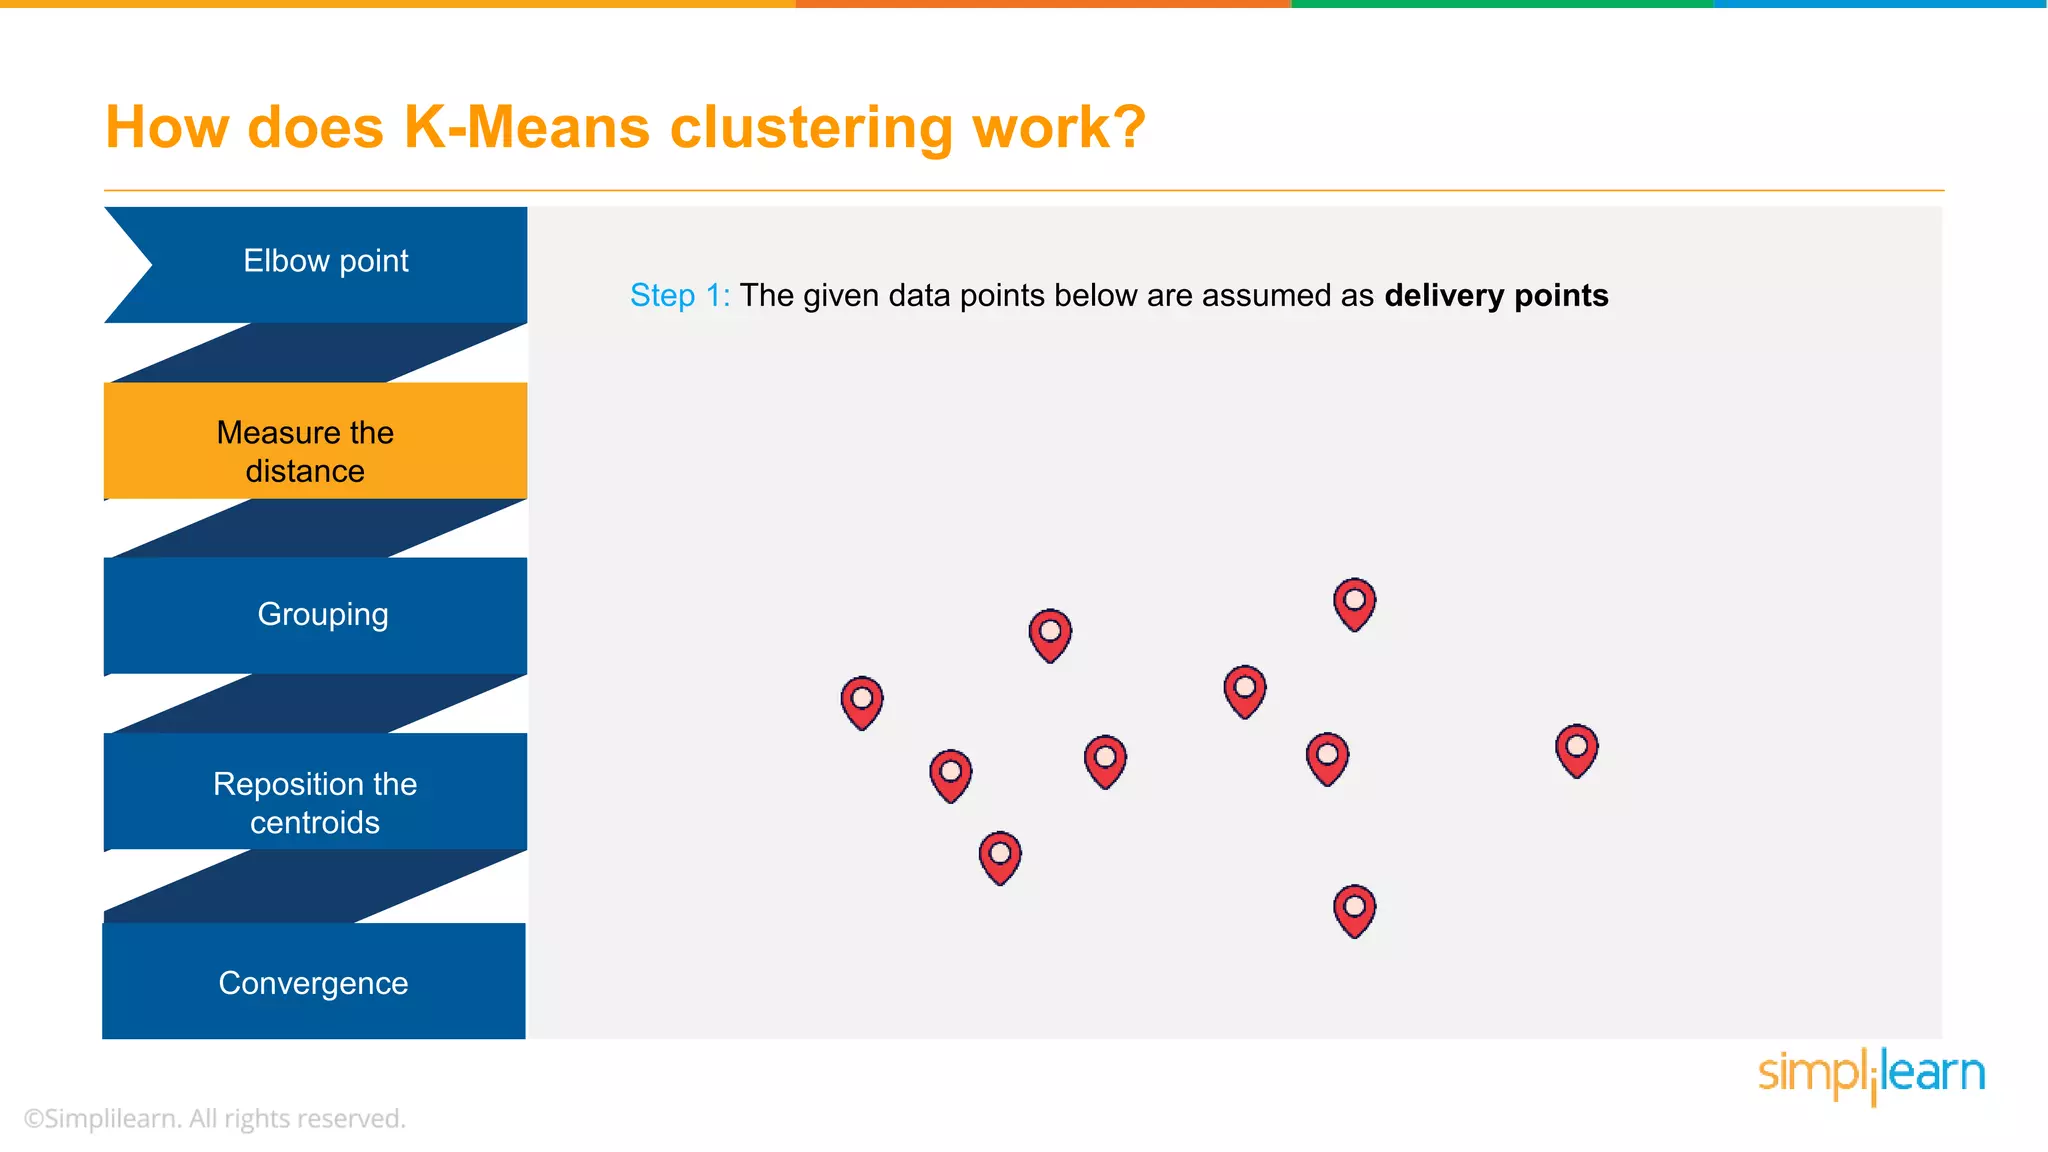
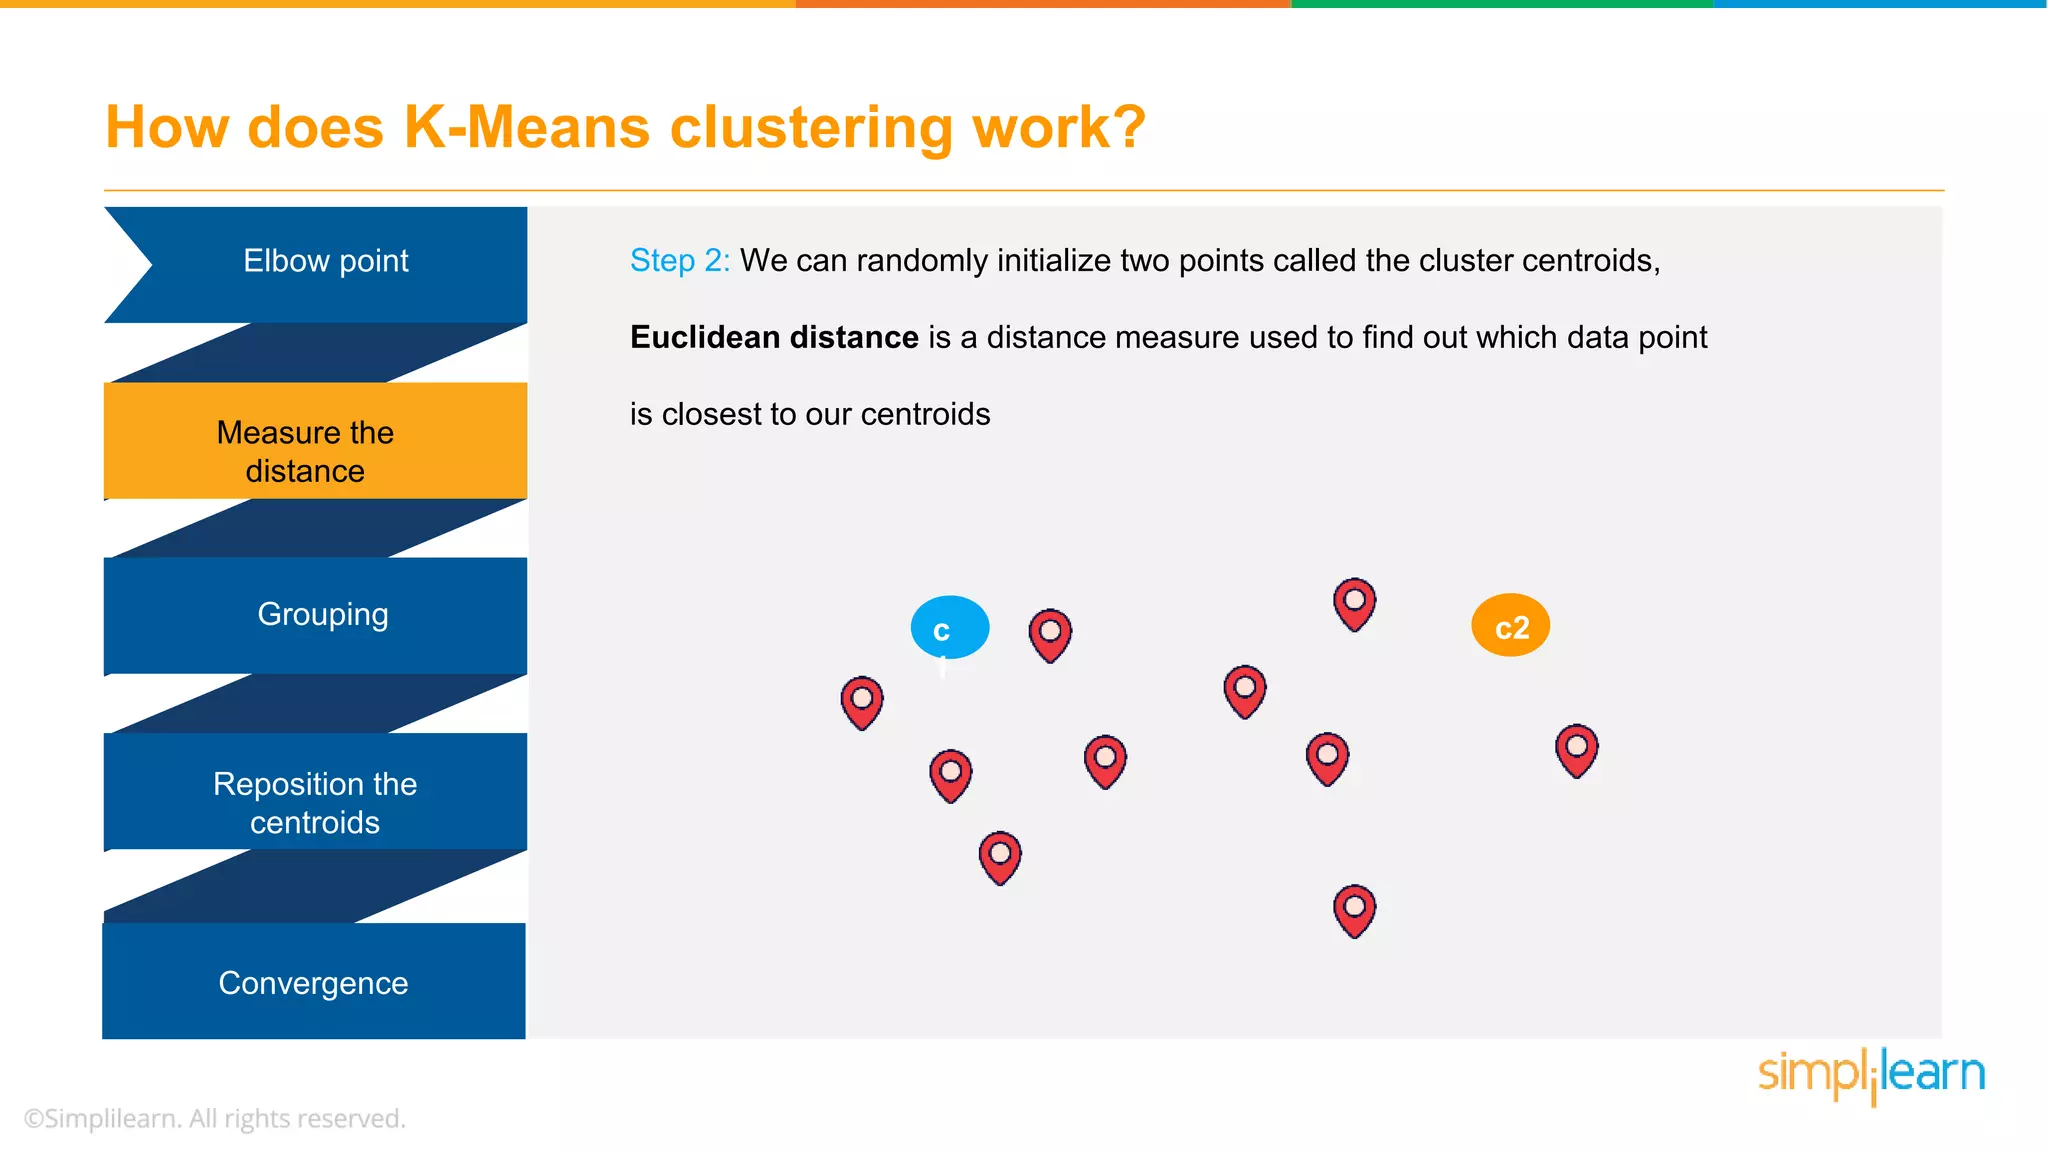
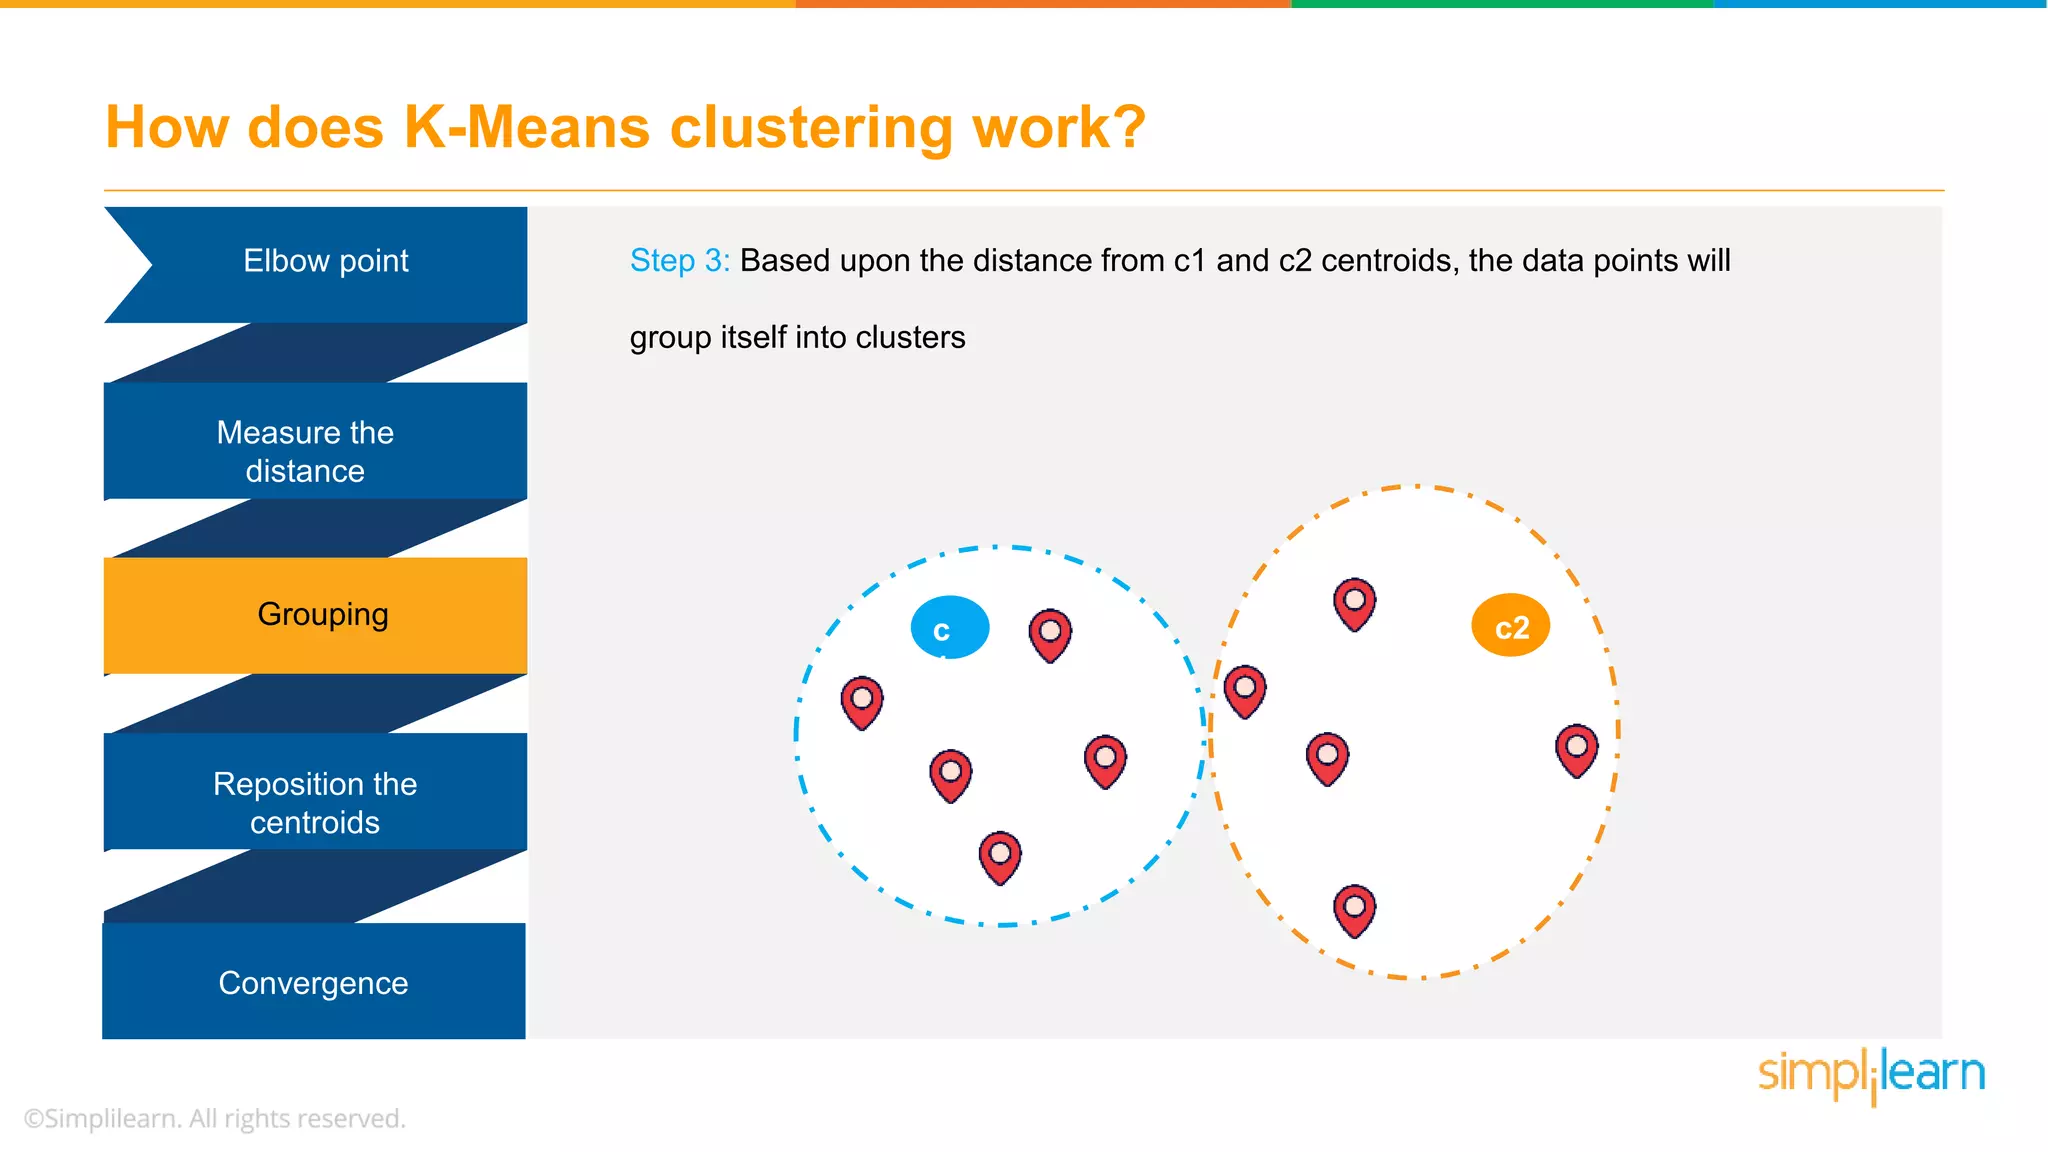
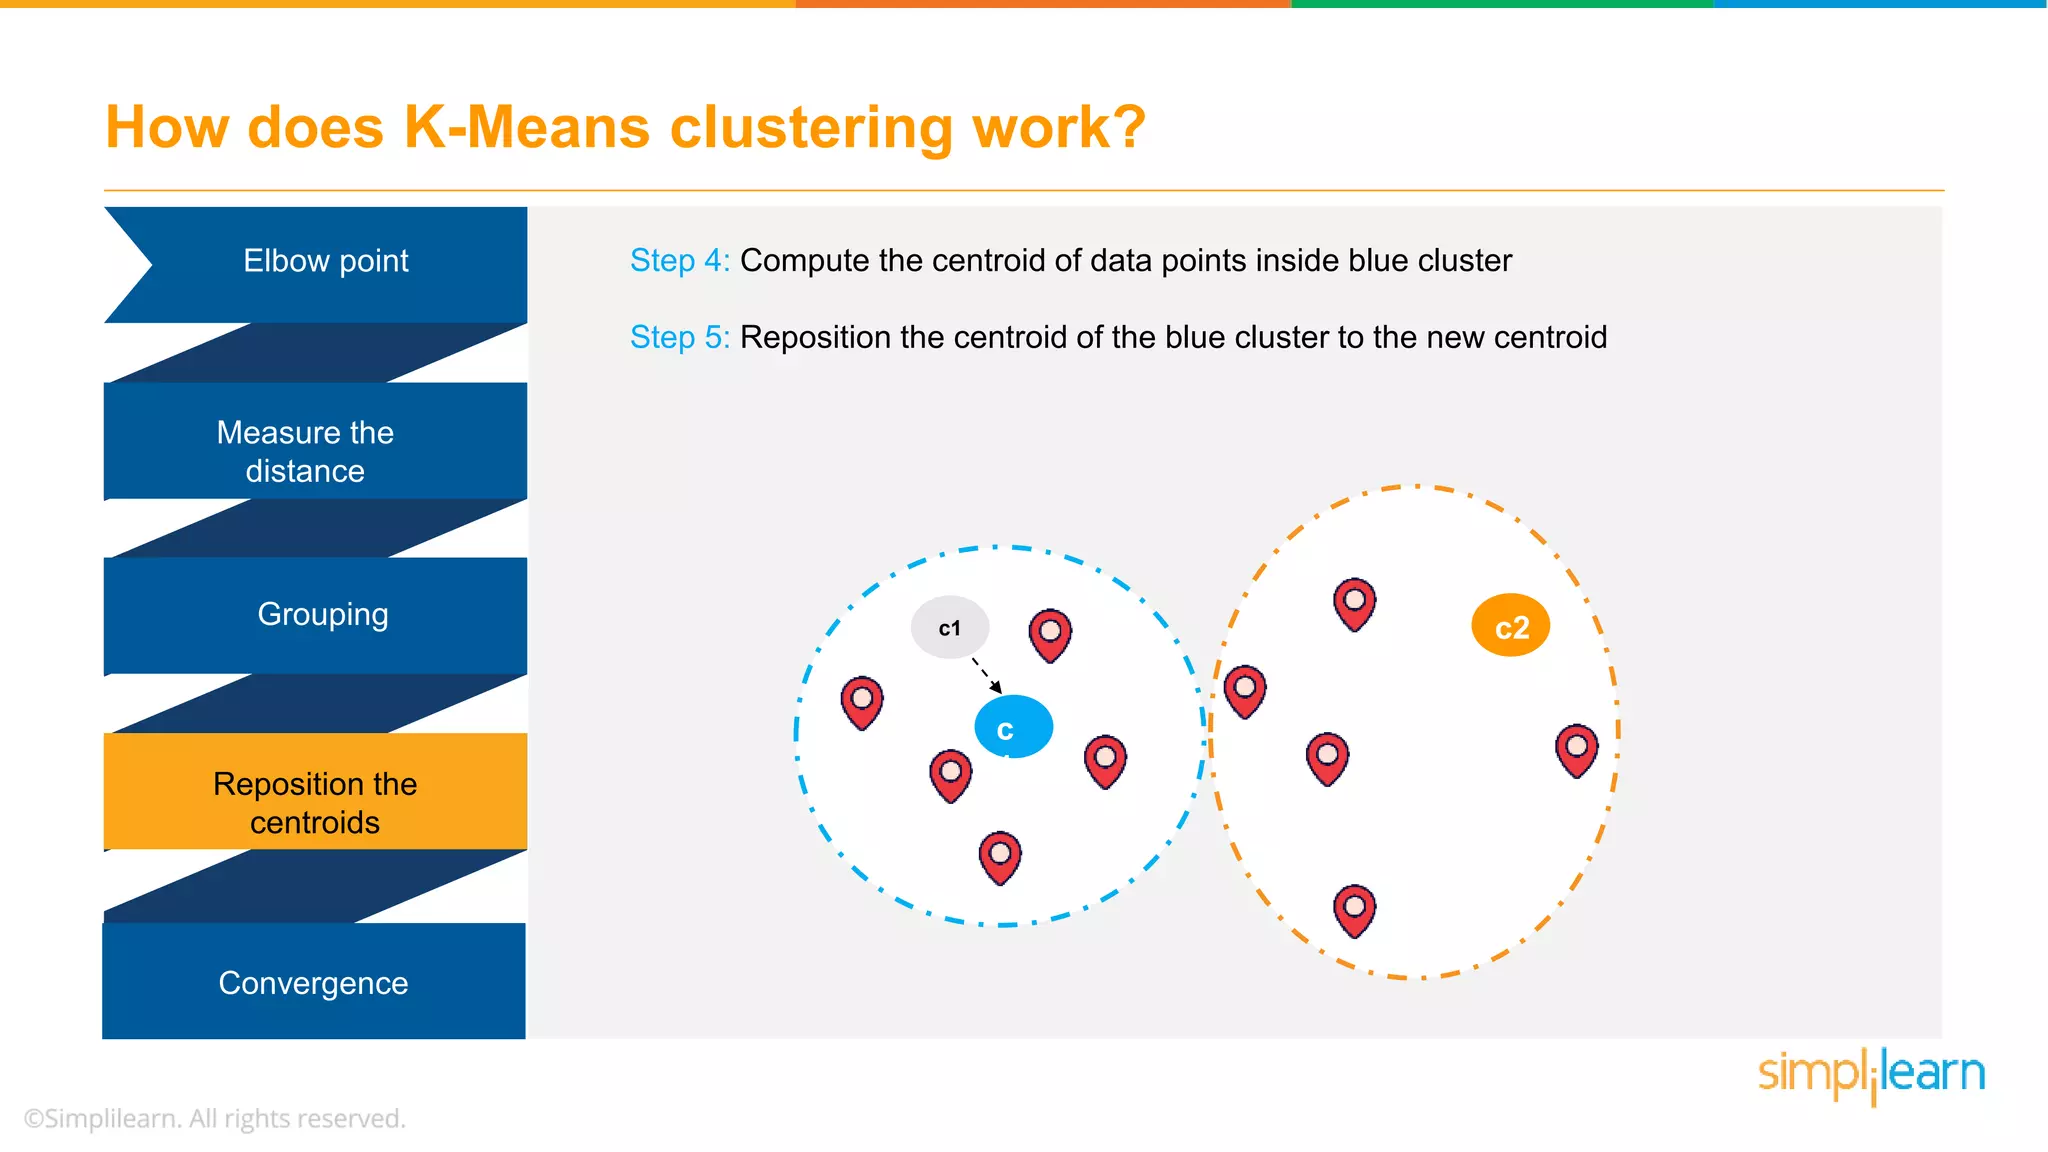
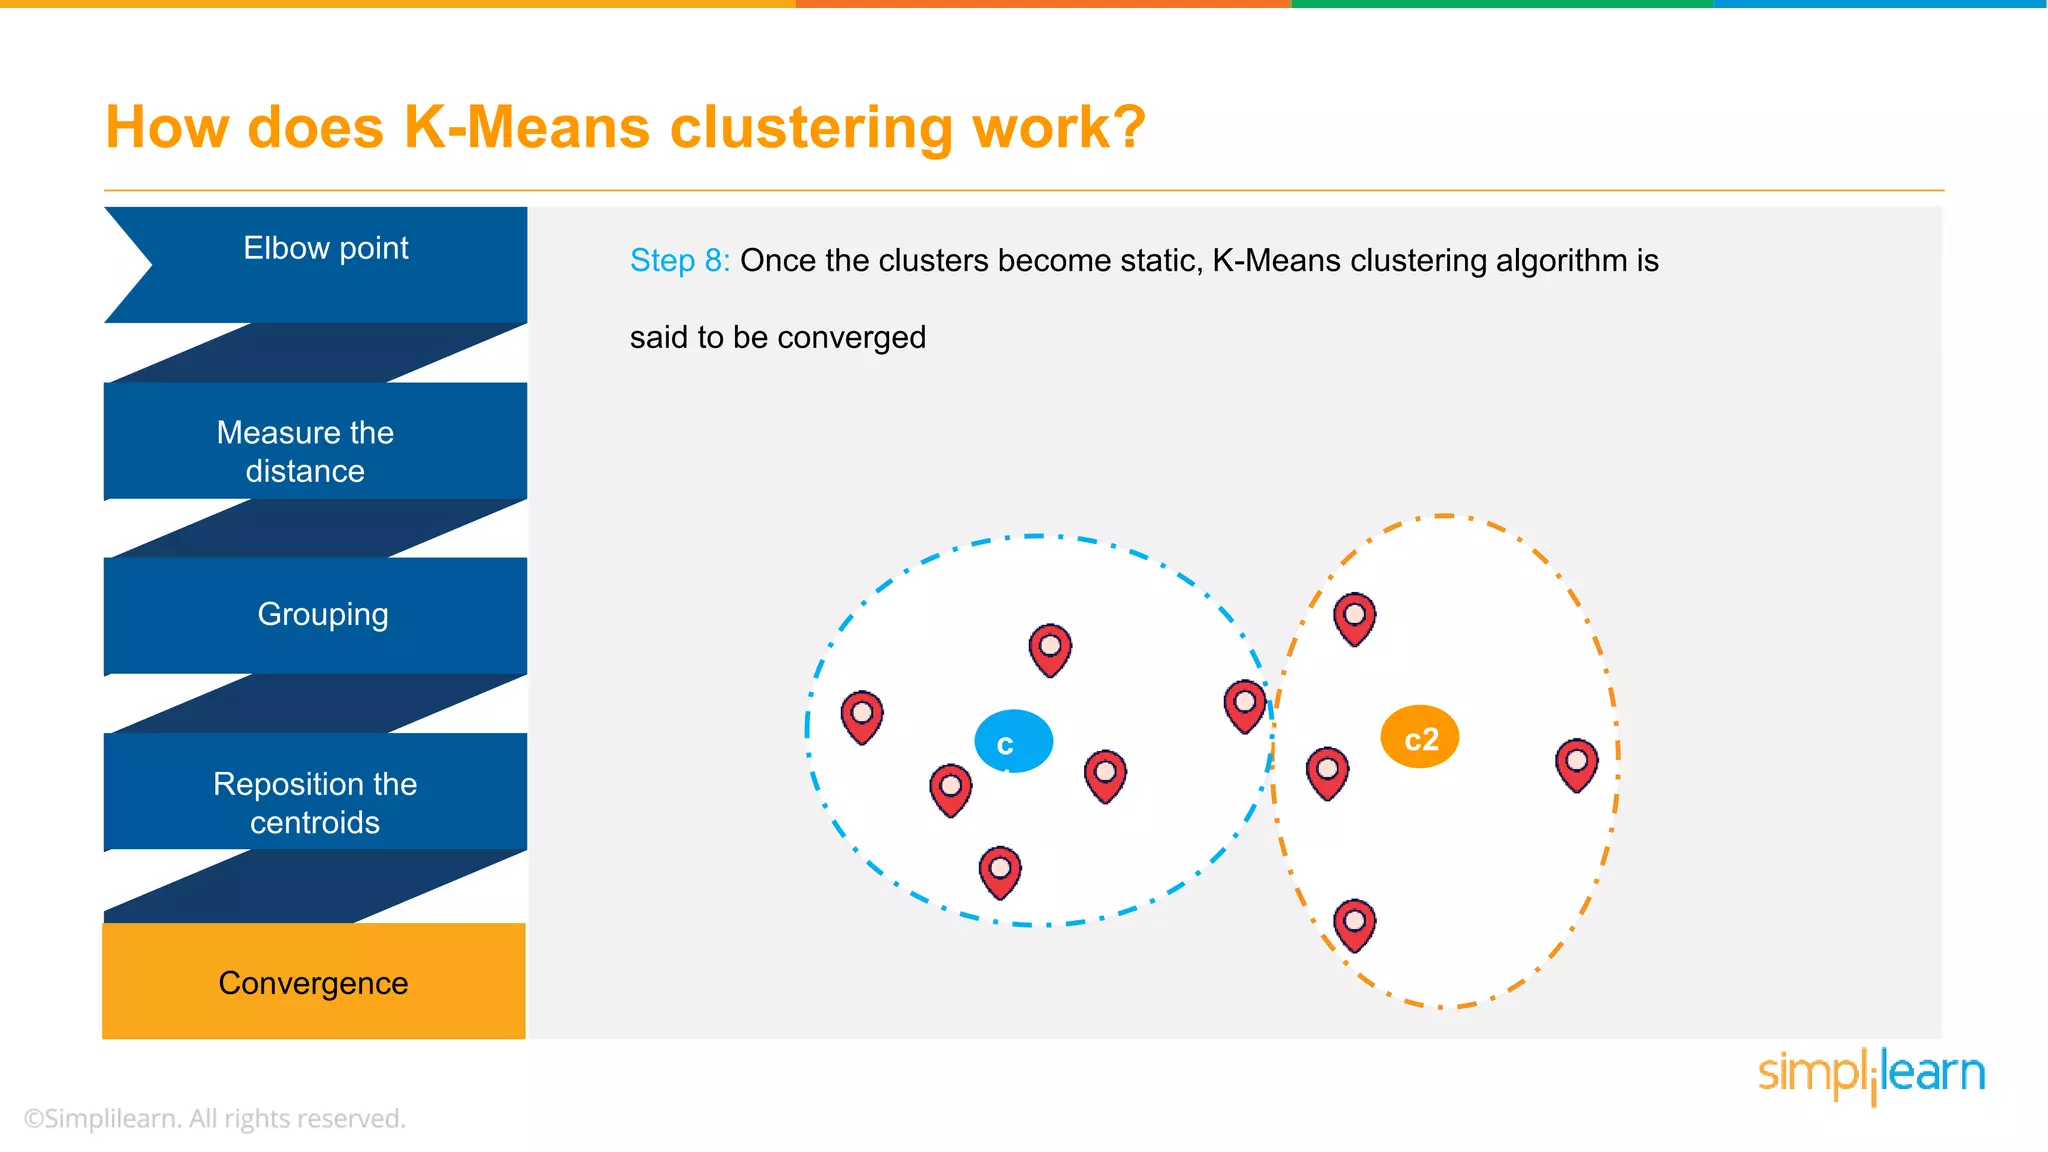
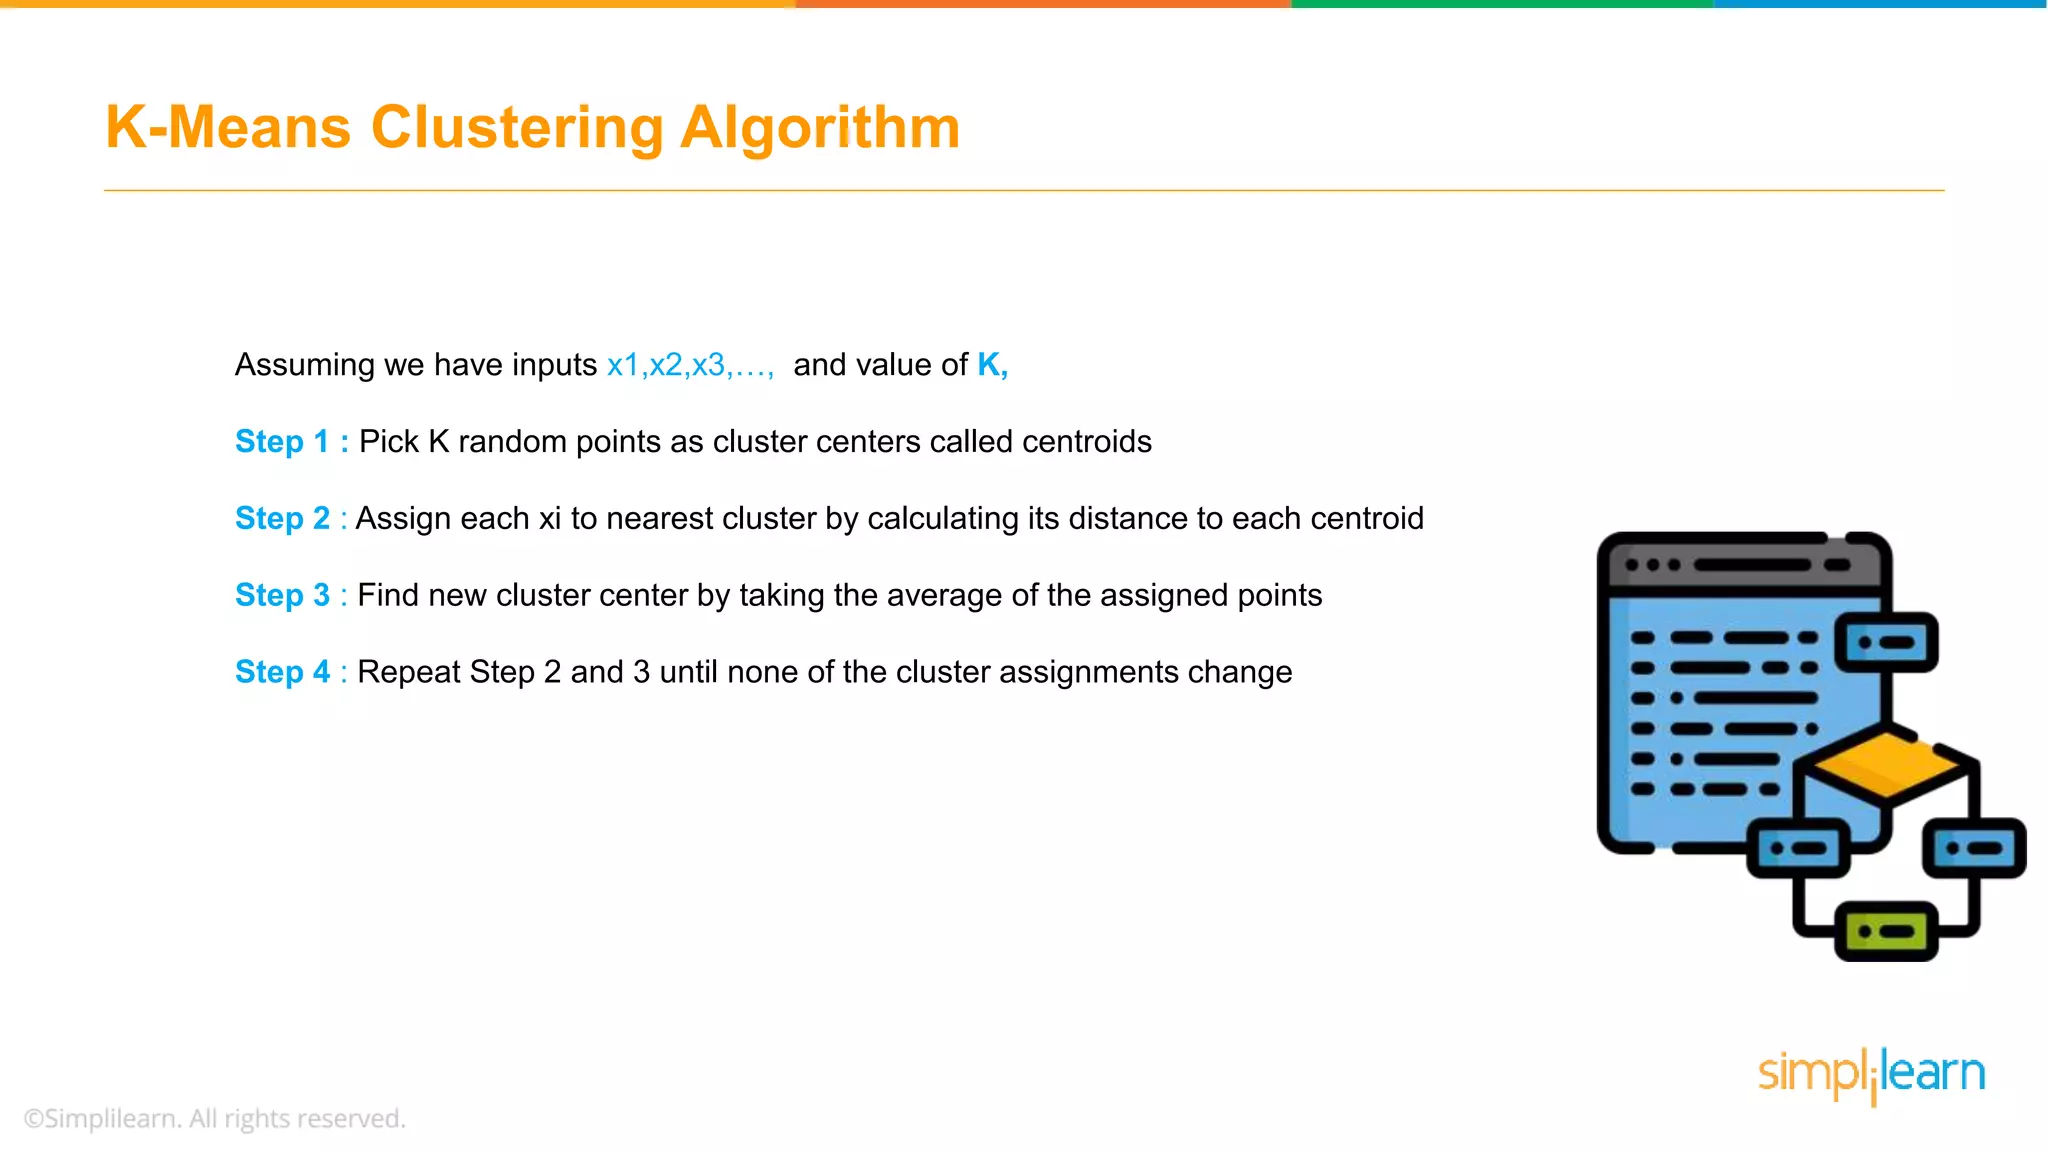
The document provides an overview of k-means clustering, explaining its purpose of dividing objects into similar clusters. It includes a detailed explanation of the algorithm, examples, types of clustering, distance measures, and applications like identifying cricket players and color compression. Additionally, it discusses the elbow method for determining the optimal number of clusters and demonstrates the process through practical examples.