Downloaded 50 times
![G1 Logging (i) • Three different log levels • Log level as fine – Use -verbosegc (equivalent to -XX:+PrintGC) • Sample Output [GC pause (G1 Humongous Allocation) (young) (initial-mark) 24M- >21M(64M), 0.2349730 secs] [GC pause (G1 Evacuation Pause) (mixed) 66M->21M(236M), 0.1625268 secs] • Log level as finer – Use -XX:+PrintGCDetails • Average, Min, and Max time displayed for each phase • Root Scan, RSet Updating (with processed buffers information), RSet Scan, Object Copy, Termination (with number of attempts) • Also shows “other” time such as time spent choosing CSet, reference processing, reference enqueuing and freeing CSet • Shows the Eden, Survivors and Total Heap occupancies. • Sample Output [Ext Root Scanning (ms): Avg: 1.7 Min: 0.0 Max: 3.7 Diff: 3.7] [Eden: 818M(818M)->0B(714M) Survivors: 0B- >104M Heap: 836M(4096M)->409M(4096M)]](https://image.slidesharecdn.com/javagarbagecollectorsmovingtojava7garbage-firstg1collector-150211073639-conversion-gate02/75/Java-Garbage-Collectors-Moving-to-Java7-Garbage-First-G1-Collector-31-2048.jpg)
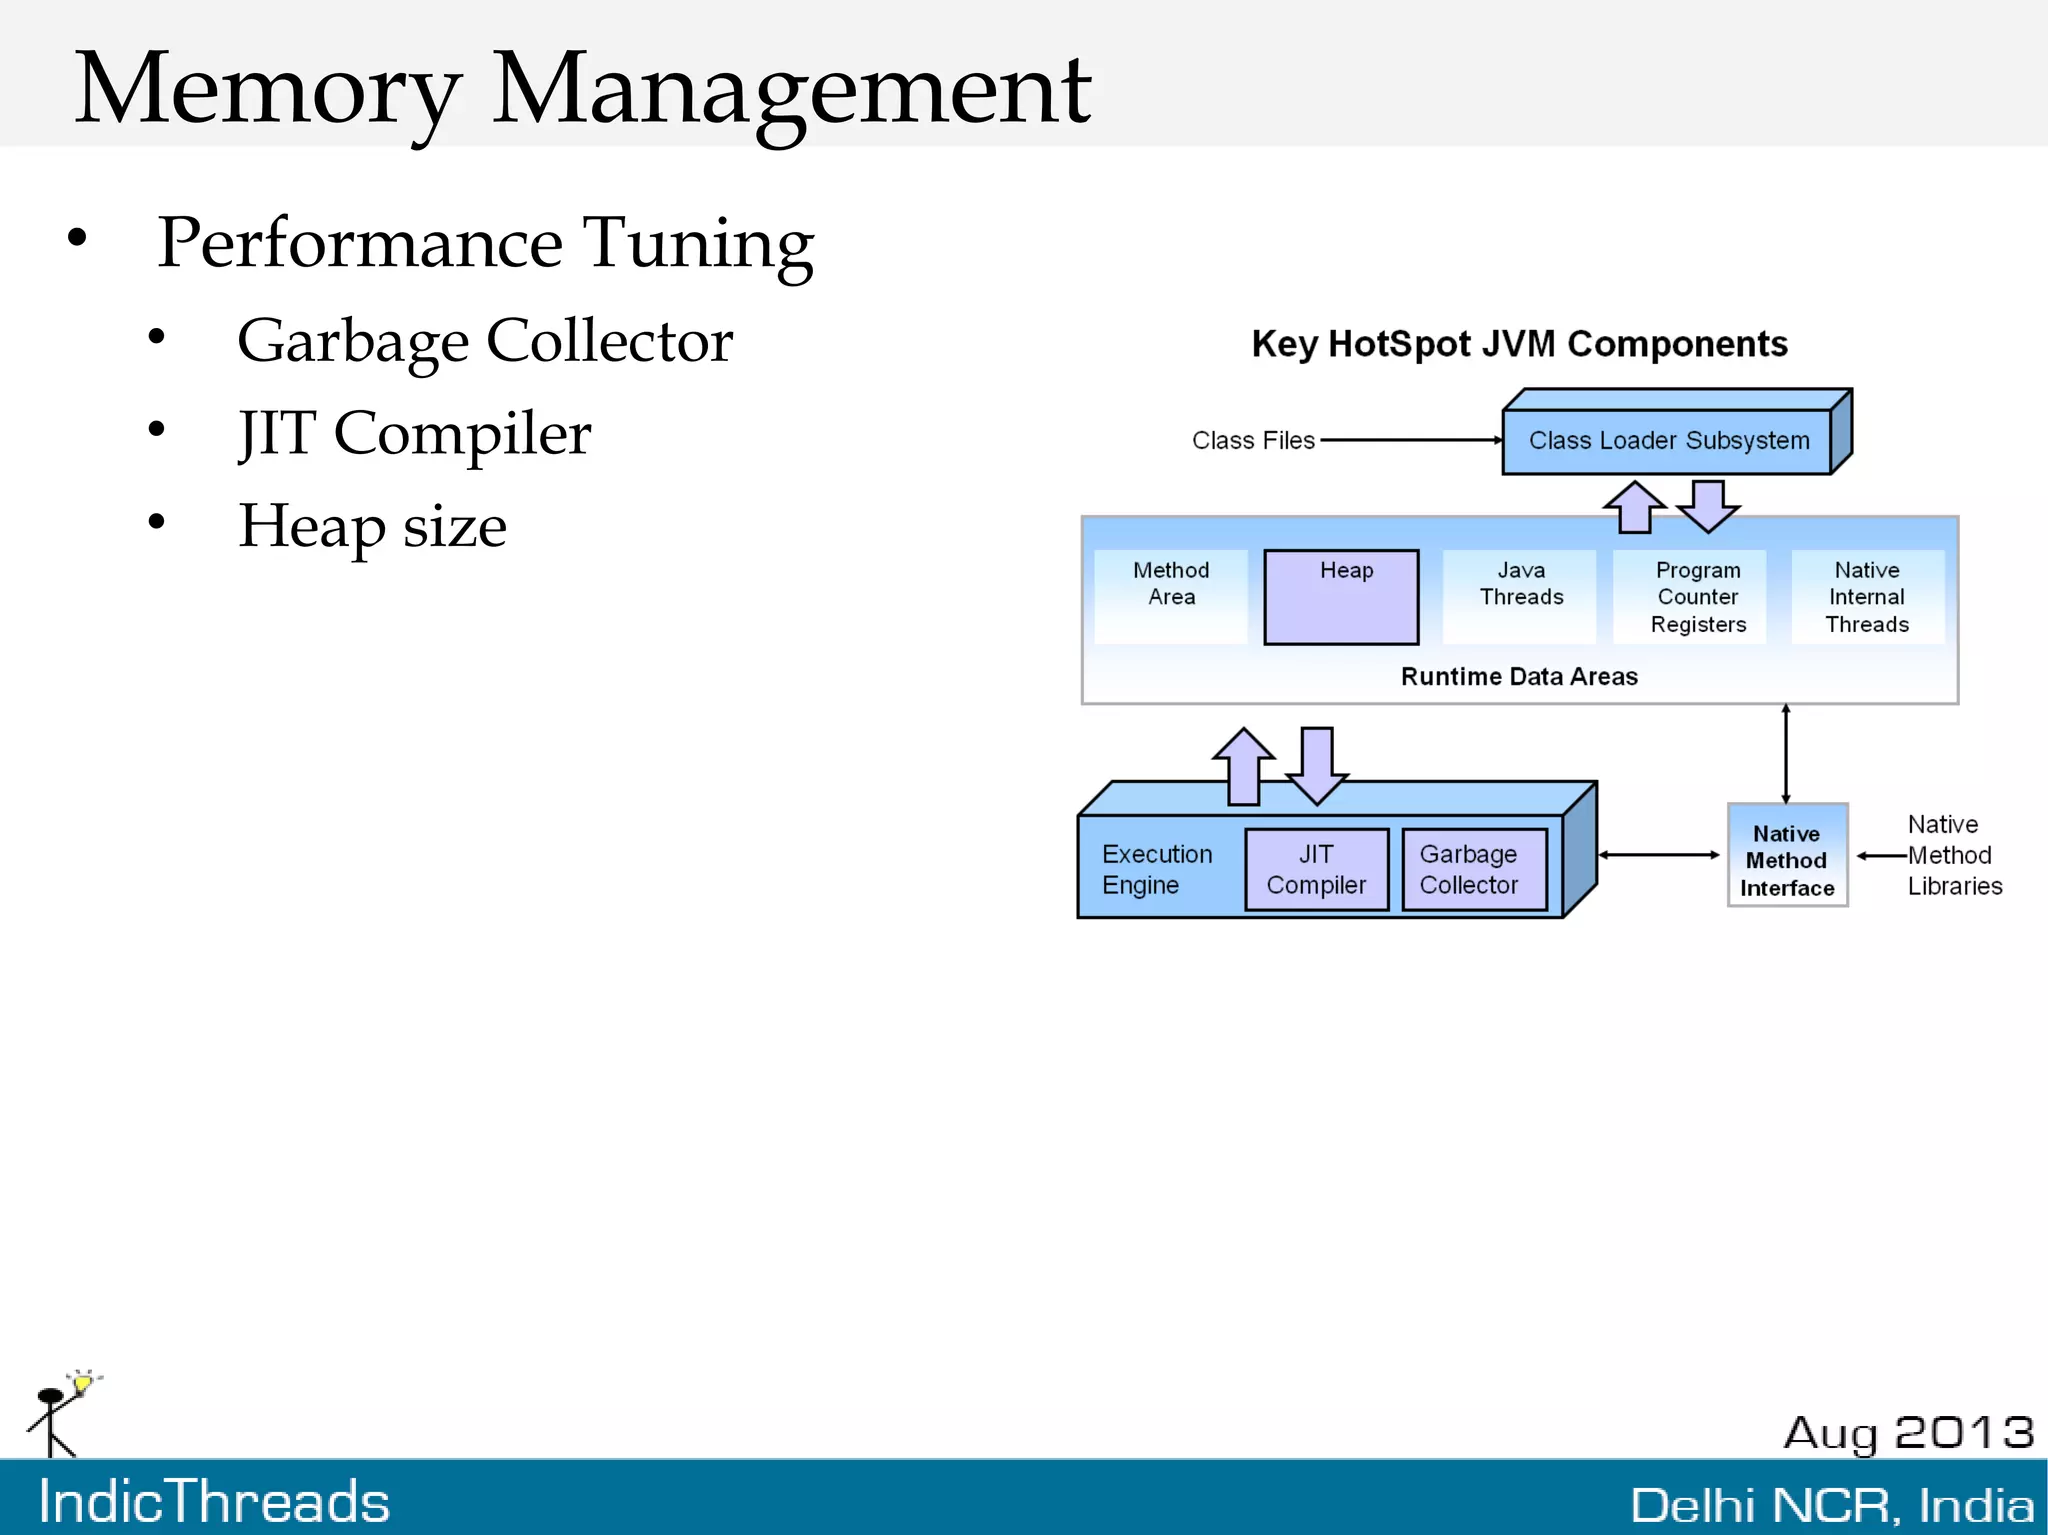
![G1 Logging (ii) • Log level as finest – Use -XX:+UnlockExperimentalVMOptions -XX:G1LogLevel=finest • Like finer but includes individual worker thread information. • Sample Output [Ext Root Scanning (ms): 2.1 2.4 2.0 0.0 Avg: 1.6 Min: 0.0 Max: 2.4 Diff: 2.3] [Update RS (ms): 0.4 0.2 0.4 0.0 Avg: 0.2 Min: 0.0 Max: 0.4 Diff: 0.4] [Processed Buffers : 5 1 10 0 Sum: 16, Avg: 4, Min: 0, Max: 10, Diff: 10] • Determine Time – How time is displayed in GC logs XX:+PrintGCTimeStamps - Shows the elapsed time since the JVM started 1.729: [GC pause (young) 46M->35M(1332M), 0.0310029 secs] -XX:+PrintGCDateStamps - Adds a time of day prefix to each entry 2012-05-02T11:16:32.057+0200: [GC pause (young) 46M- >35M(1332M), 0.0317225 secs]](https://image.slidesharecdn.com/javagarbagecollectorsmovingtojava7garbage-firstg1collector-150211073639-conversion-gate02/75/Java-Garbage-Collectors-Moving-to-Java7-Garbage-First-G1-Collector-32-2048.jpg)
![G1 Logging Keywords (i) • Parallel Time - Overall elapsed time of the main parallel part of the pause • Worker Start – Timestamp at which the workers start • Note: The logs are ordered on thread id and are consistent on each entry 414.557: [GC pause (young), 0.03039600 secs] [Parallel Time: 22.9 ms] [GC Worker Start (ms): 7096.0 7096.0 7096.1 7096.1 706.1 7096.1 7096.1 7096.1 7096.2 7096.2 7096.2 7096.2 Avg: 7096.1, Min: 7096.0, Max: 7096.2, Diff: 0.2] • External Root Scanning - The time taken to scan the external root (e.g., things like system dictionary that point into the heap.) [Ext Root Scanning (ms): 3.1 3.4 3.4 3.0 4.2 2.0 3.6 3.2 3.4 7.7 3.7 4.4 Avg: 3.8, Min: 2.0, Max: 7.7, Diff: 5.7] • Update Remembered Set - Buffers that are completed but have not yet been processed by the concurrent refinement thread before the start of the pause have to be updated. • Time depends on density of the cards. The more cards, the longer it will take. [Update RS (ms): 0.1 0.0 0.0 0.0 0.0 0.0 0.0 0.0 0.0 0.0 0.0 0.0 Avg: 0.0, Min: 0.0, Max: 0.1, Diff: 0.1] [Processed Buffers : 26 0 0 0 0 0 0 0 0 0 0 0 Sum: 26, Avg: 2, Min: 0, Max: 26, Diff: 26]](https://image.slidesharecdn.com/javagarbagecollectorsmovingtojava7garbage-firstg1collector-150211073639-conversion-gate02/75/Java-Garbage-Collectors-Moving-to-Java7-Garbage-First-G1-Collector-33-2048.jpg)
![G1 Logging Keywords (ii) • Scanning Remembered Sets - Look for pointers that point into the Collection Set [Scan RS (ms): 0.4 0.2 0.1 0.3 0.0 0.0 0.1 0.2 0.0 0.1 0.0 0.0 Avg: 0.1, Min: 0.0, Max: 0.4, Diff: 0.3]F • Object Copy - The time that each individual thread spent copying and evacuating objects [Object Copy (ms): 16.7 16.7 16.7 16.9 16.0 18.1 16.5 16.8 16.7 12.3 16.4 15.7 Avg: 16.3, Min: 12.3, Max: 18.1, Diff: 5.8] • Termination Time - When a worker thread is finished with its particular set of objects to copy and scan, it enters the termination protocol. It looks for work to steal and once it's done with that work it again enters the termination protocol. Termination attempt counts all the attempts to steal work. [Termination (ms): 0.0 0.0 0.0 0.0 0.0 0.0 0.0 0.0 0.0 0.0 0.0 0.0 Avg: 0.0, Min: 0.0, Max: 0.0, Diff: 0.0] [Termination Attempts : 1 1 1 1 1 1 1 1 1 1 1 1 Sum: 12, Avg: 1, Min: 1, Max: 1, Diff: 0] • GC Worker End [GC Worker End (ms): 7116.4 7116.3 7116.4 7116.3 7116.4 7116.3 7116.4 7116.4 7116.4 7116.4 7116.3 7116.3 Avg: 7116.4, Min: 7116.3, Max: 7116.4, Diff: 0.1] • GC worker end time – Timestamp when the individual GC worker stops. • GC worker time – Time taken by individual GC worker thread.](https://image.slidesharecdn.com/javagarbagecollectorsmovingtojava7garbage-firstg1collector-150211073639-conversion-gate02/75/Java-Garbage-Collectors-Moving-to-Java7-Garbage-First-G1-Collector-34-2048.jpg)
![G1 Logging Keywords (iii) • GC Worker Other - The time (for each GC thread) that can't be attributed to the worker phases listed previously. Should be quite low. [GC Worker Other (ms): 2.6 2.6 2.7 2.7 2.7 2.7 2.7 2.8 2.8 2.8 2.8 2.8 Avg: 2.7, Min: 2.6, Max: 2.8, Diff: 0.2] • Clear CT - Time taken to clear the card table of RSet scanning meta-data [Clear CT: 0.6 ms] • Other - Time taken for various other sequential phases of the GC pause. [Other: 6.8 ms] • CSet - Time taken finalizing the set of regions to collect. Usually very small; slightly longer when having to select old [Choose CSet: 0.1 ms] • Ref Proc - Time spent processing soft, weak, etc. references deferred from the prior phases of the GC. [Ref Proc: 4.4 ms] • Ref Enq - Time spent placing soft, weak, etc. references on to the pending list. [Ref Enq: 0.1 ms] • Free CSet - Time spent freeing the set of regions that have just been collected, including their remembered sets [Free CSet: 2.0 ms]](https://image.slidesharecdn.com/javagarbagecollectorsmovingtojava7garbage-firstg1collector-150211073639-conversion-gate02/75/Java-Garbage-Collectors-Moving-to-Java7-Garbage-First-G1-Collector-35-2048.jpg)

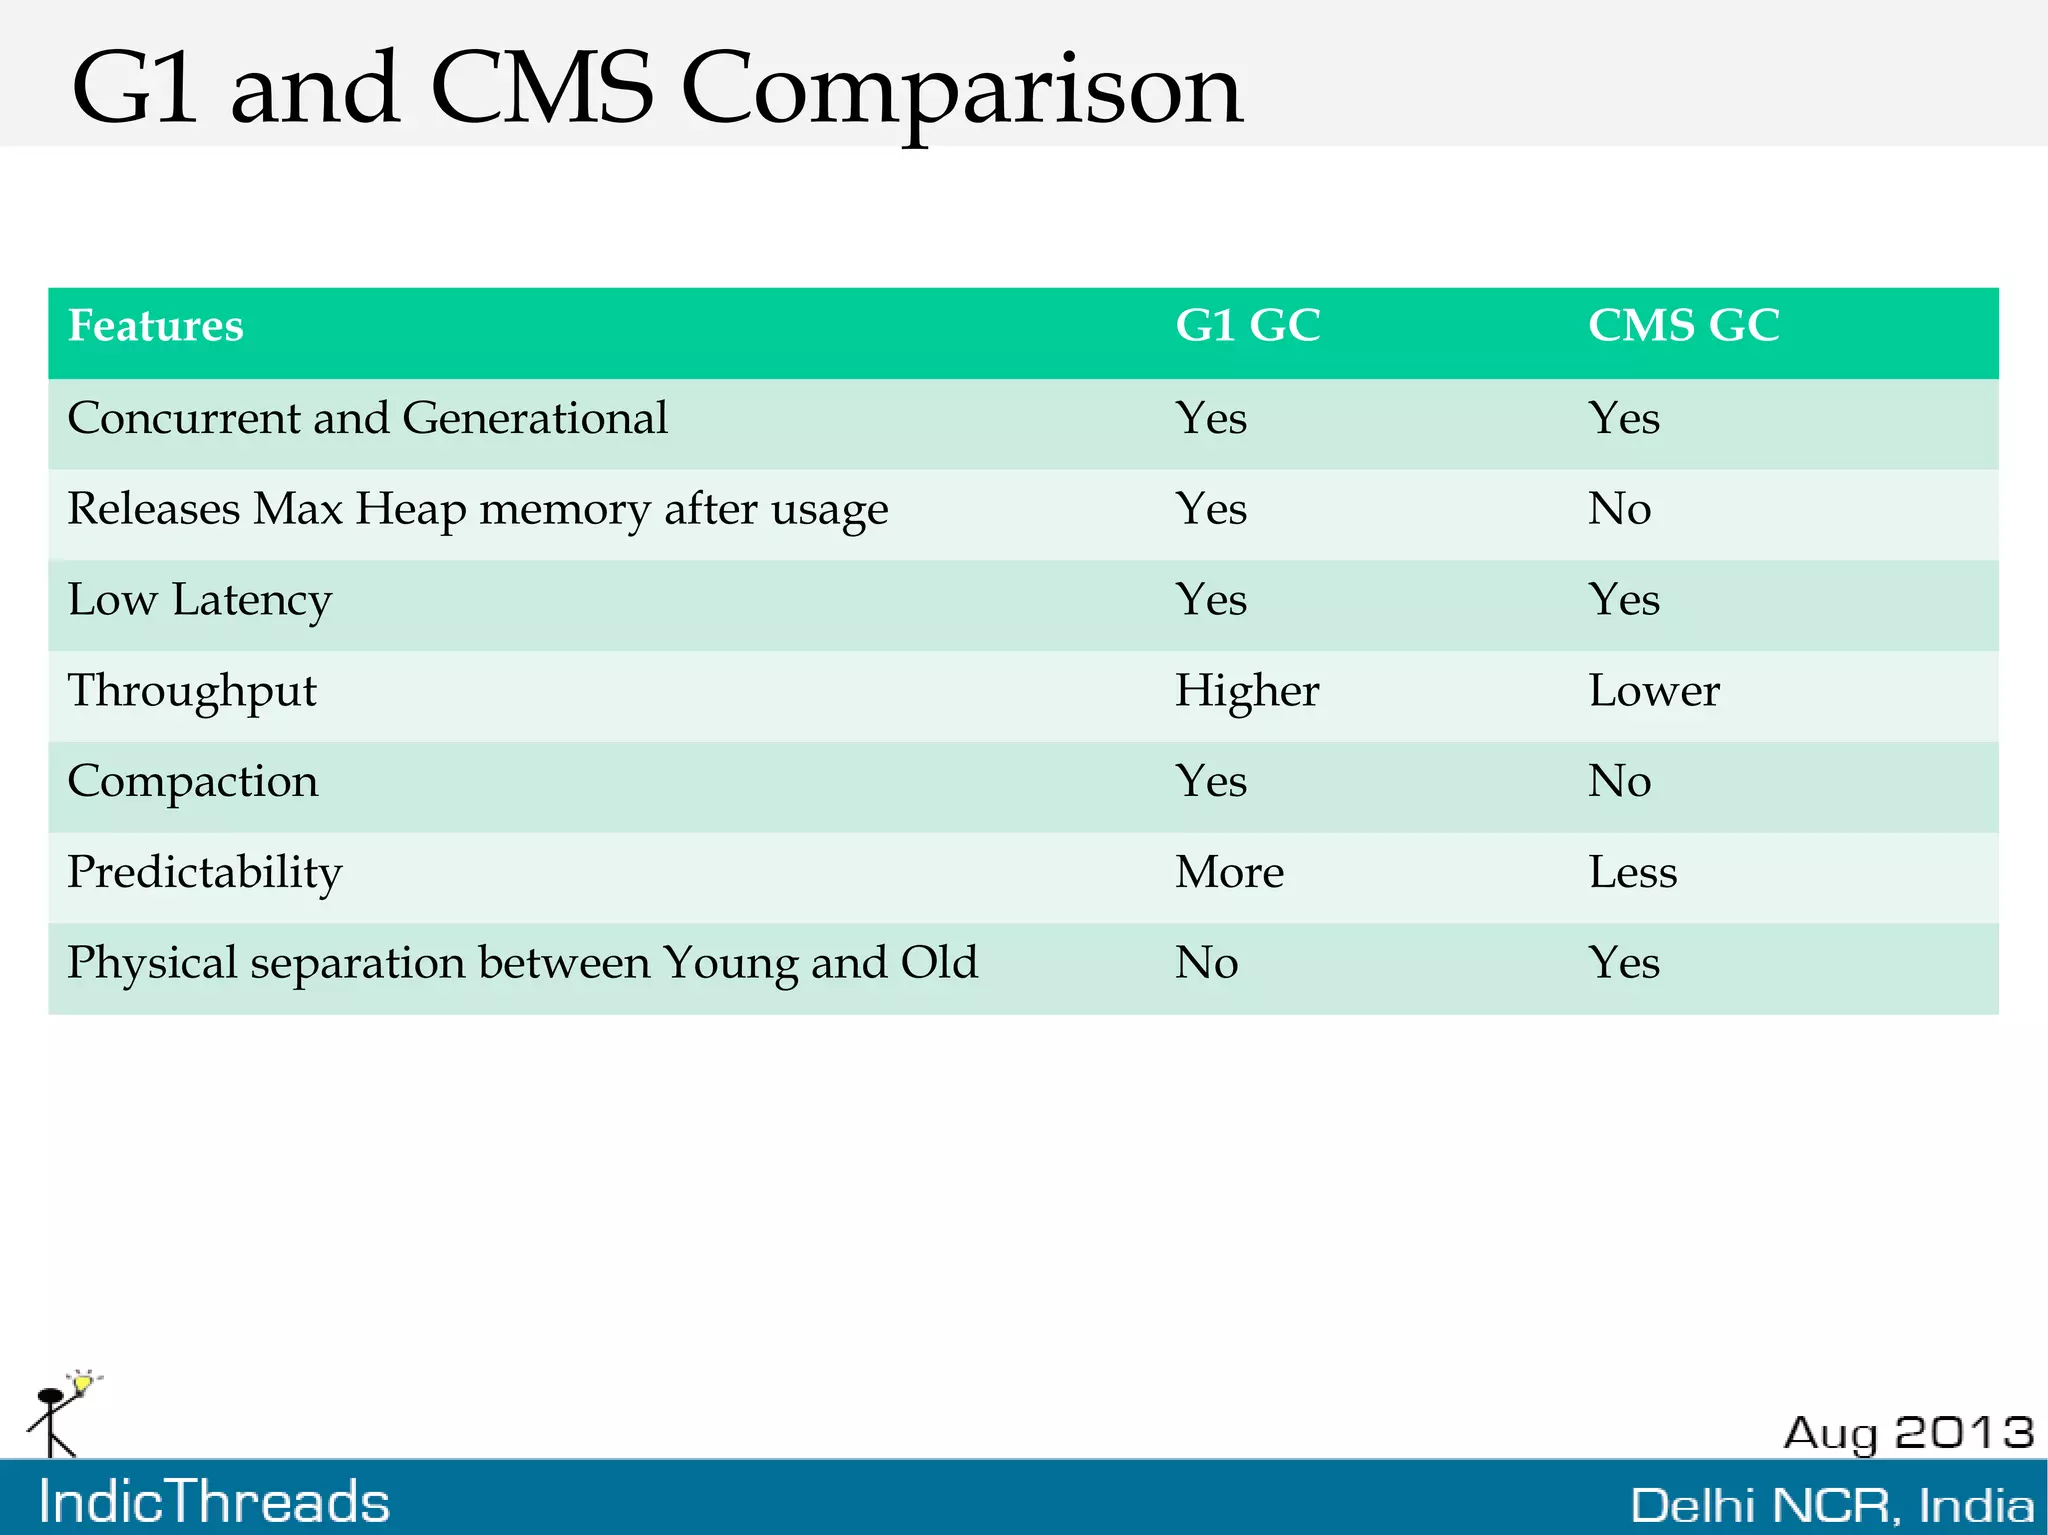
The document discusses the transition to the Garbage-First (G1) garbage collector in Java 7, highlighting its advantages over the Concurrent Mark-Sweep (CMS) collector, including improved low latency, better predictability, and simplified tuning. It outlines the G1's operations, structure, and command-line options for configuration, as well as performance observations compared to CMS. Finally, it provides guidance on when to use G1 and references for further information.