Downloaded 212 times


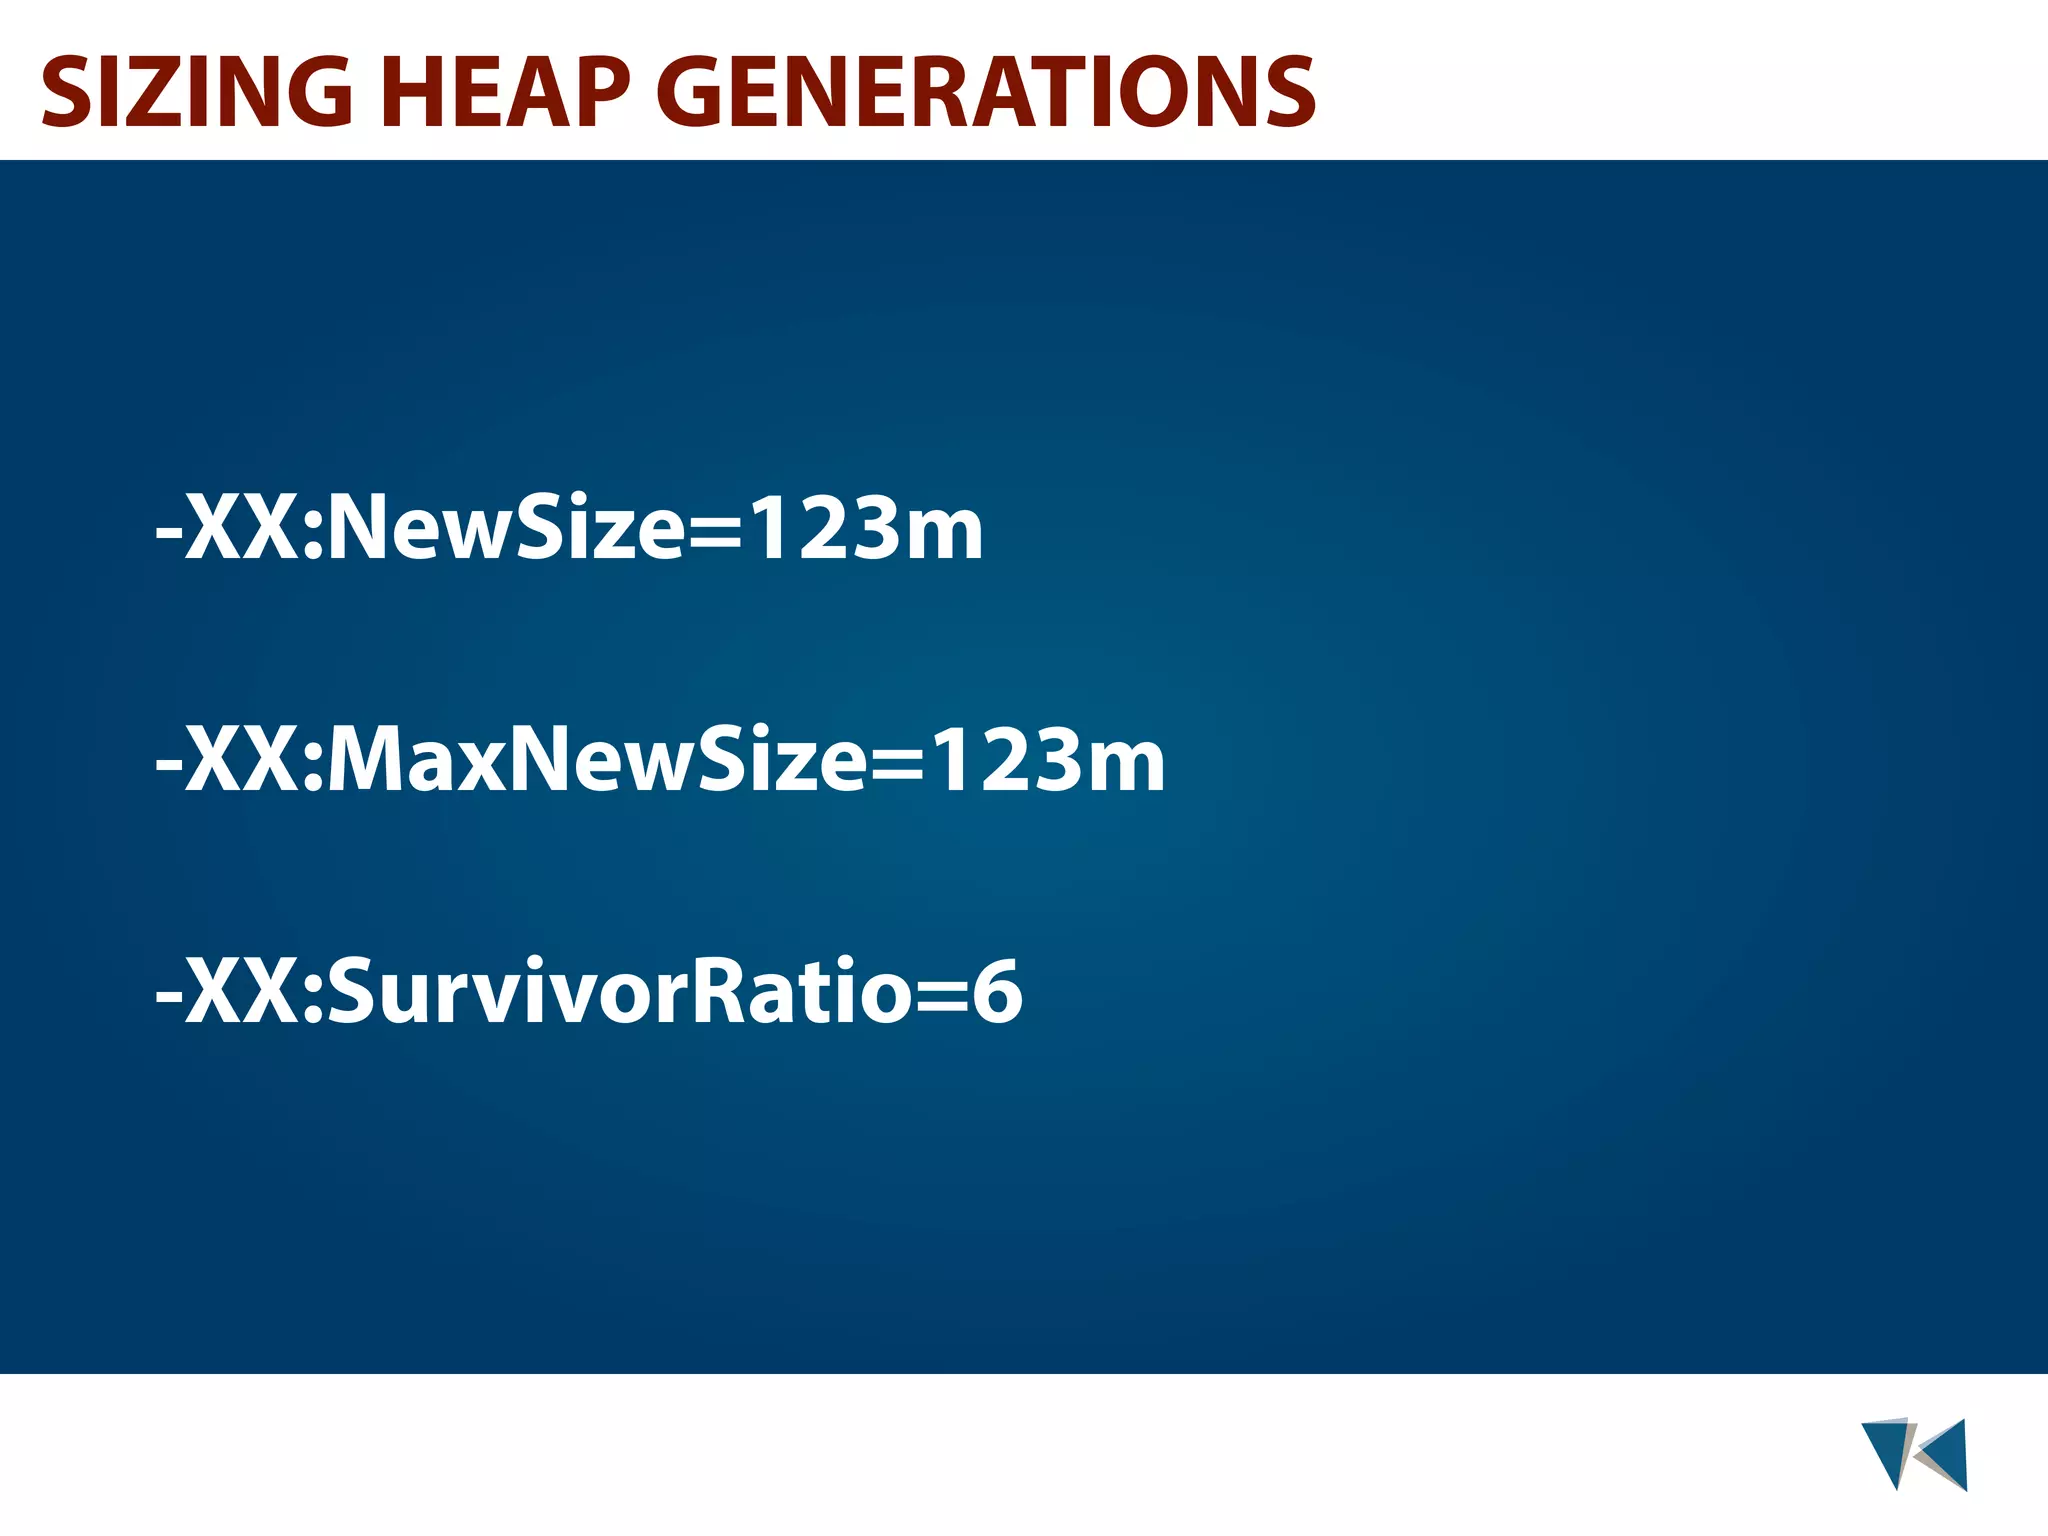


![WHAT ABOUT THAT SURVIVORRATIO FLAG? • defaults to 1/34 of young generation • high risk of short-lived objects to migrate to tenured generation very fast • best if kept between [1/6; 1/12] of new space • -XX:SurvivorRatio=6 => 1/8](https://image.slidesharecdn.com/presentation-tk-130109081951-phpapp01/75/Basics-of-JVM-Tuning-38-2048.jpg)


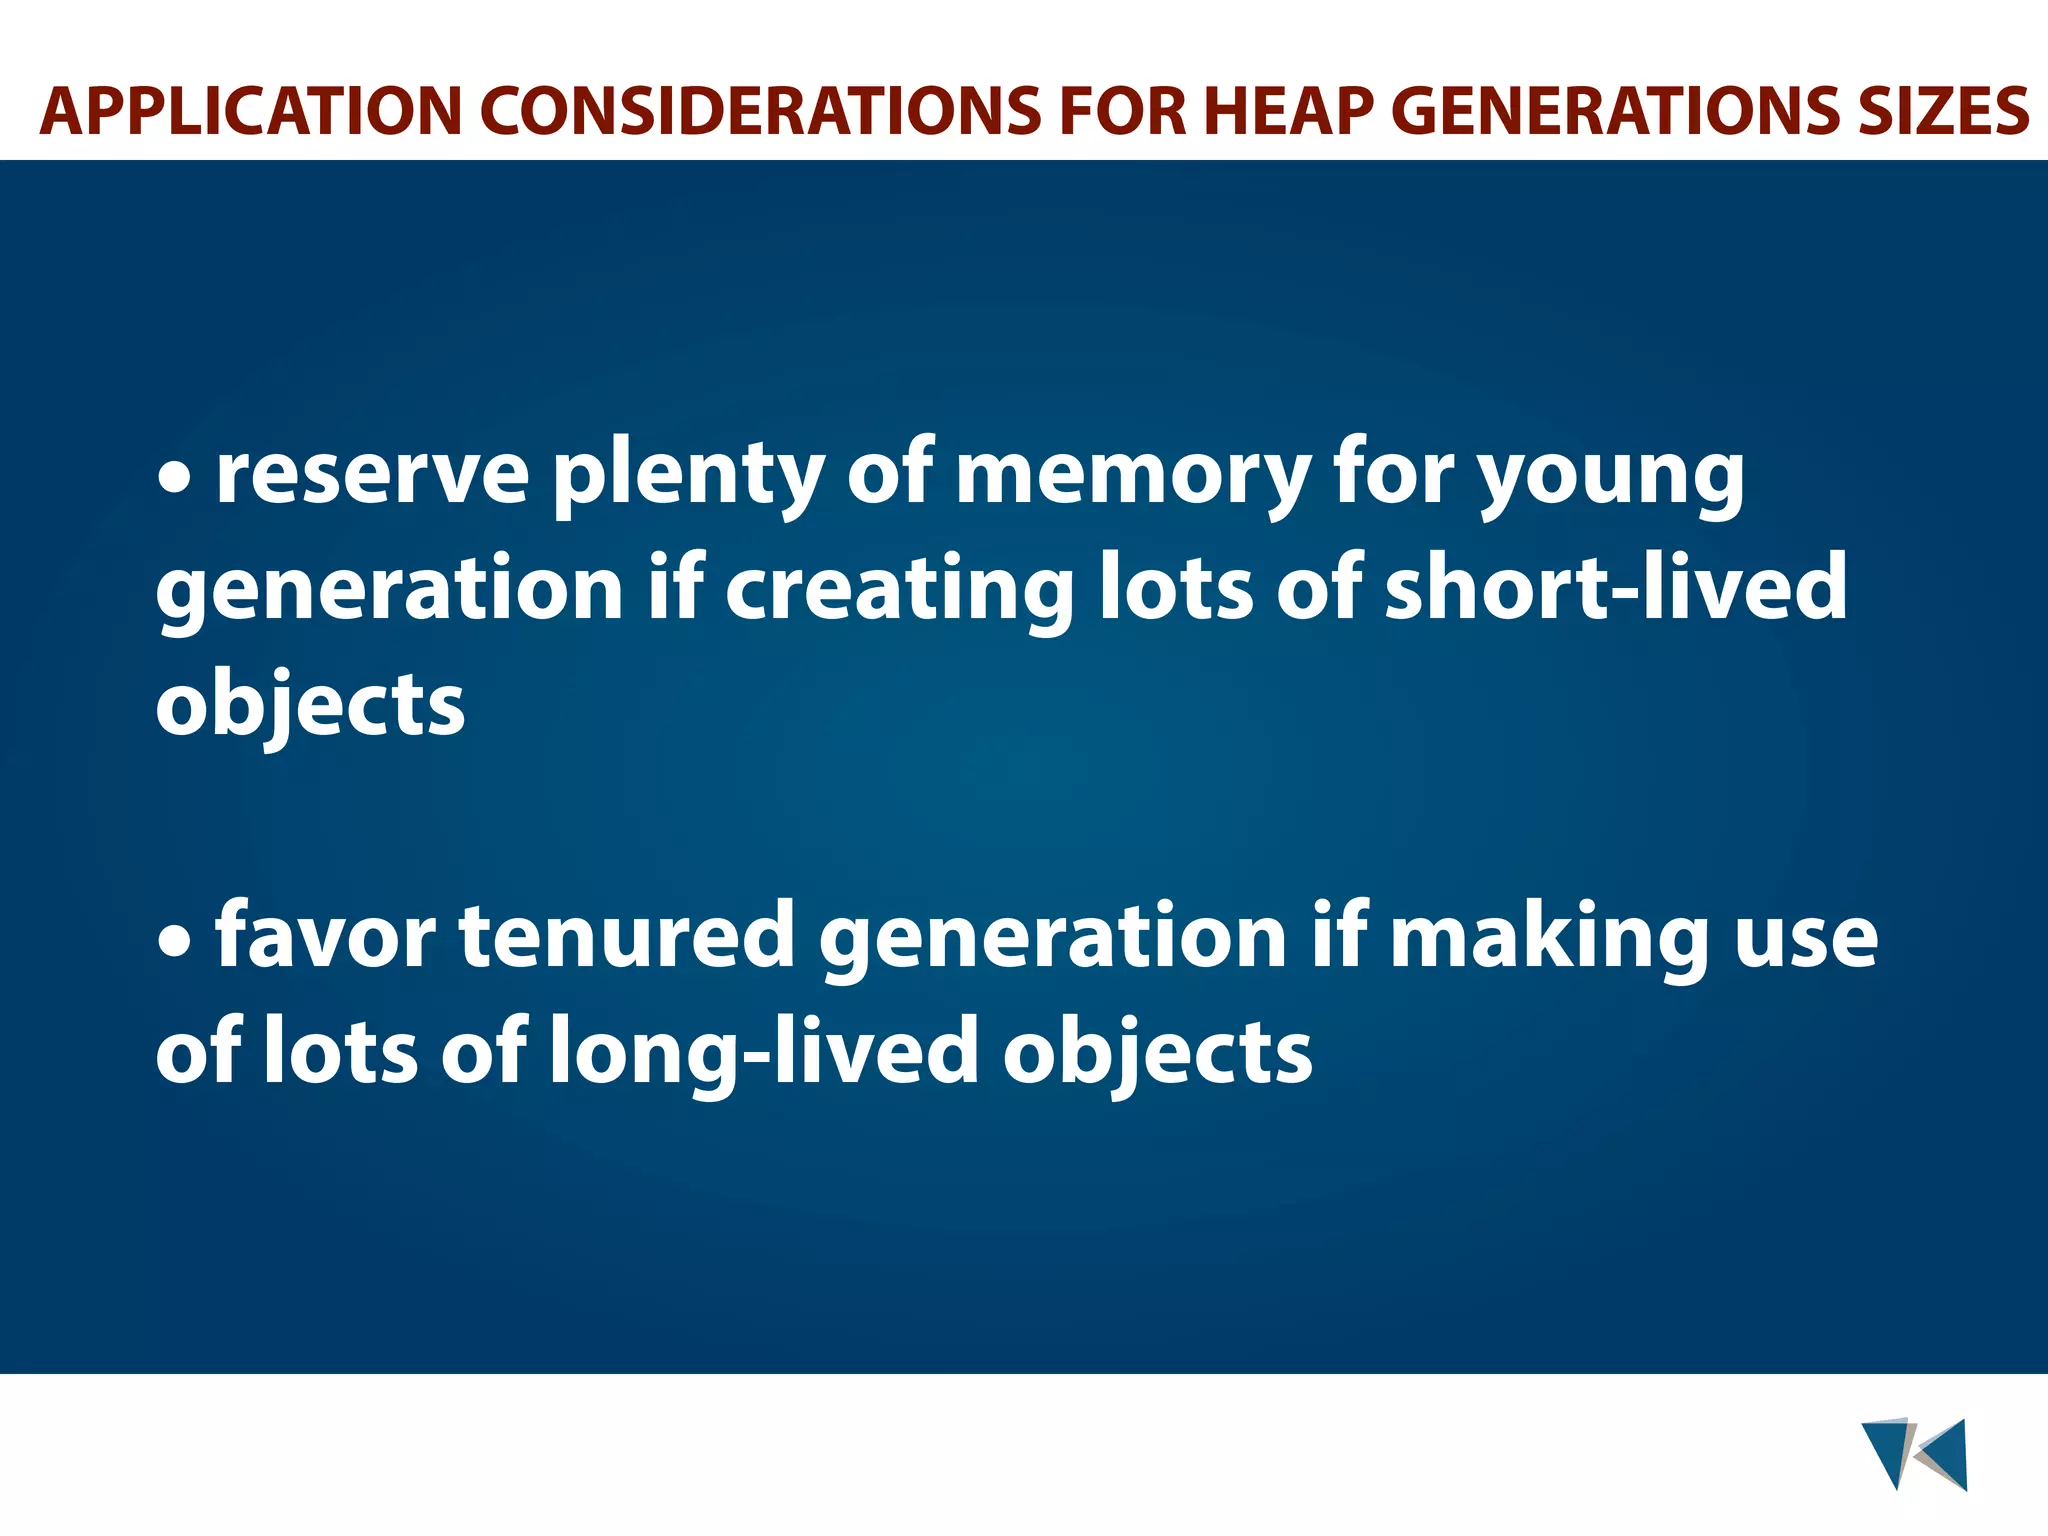
![EXAMPLE java -verbose:gc MyApp 33.357: [GC 25394K->18238K(130176K), 0.0148471 secs] 33.811: [Full GC 22646K->18501K(130176K), 0.1954419 secs]](https://image.slidesharecdn.com/presentation-tk-130109081951-phpapp01/75/Basics-of-JVM-Tuning-49-2048.jpg)
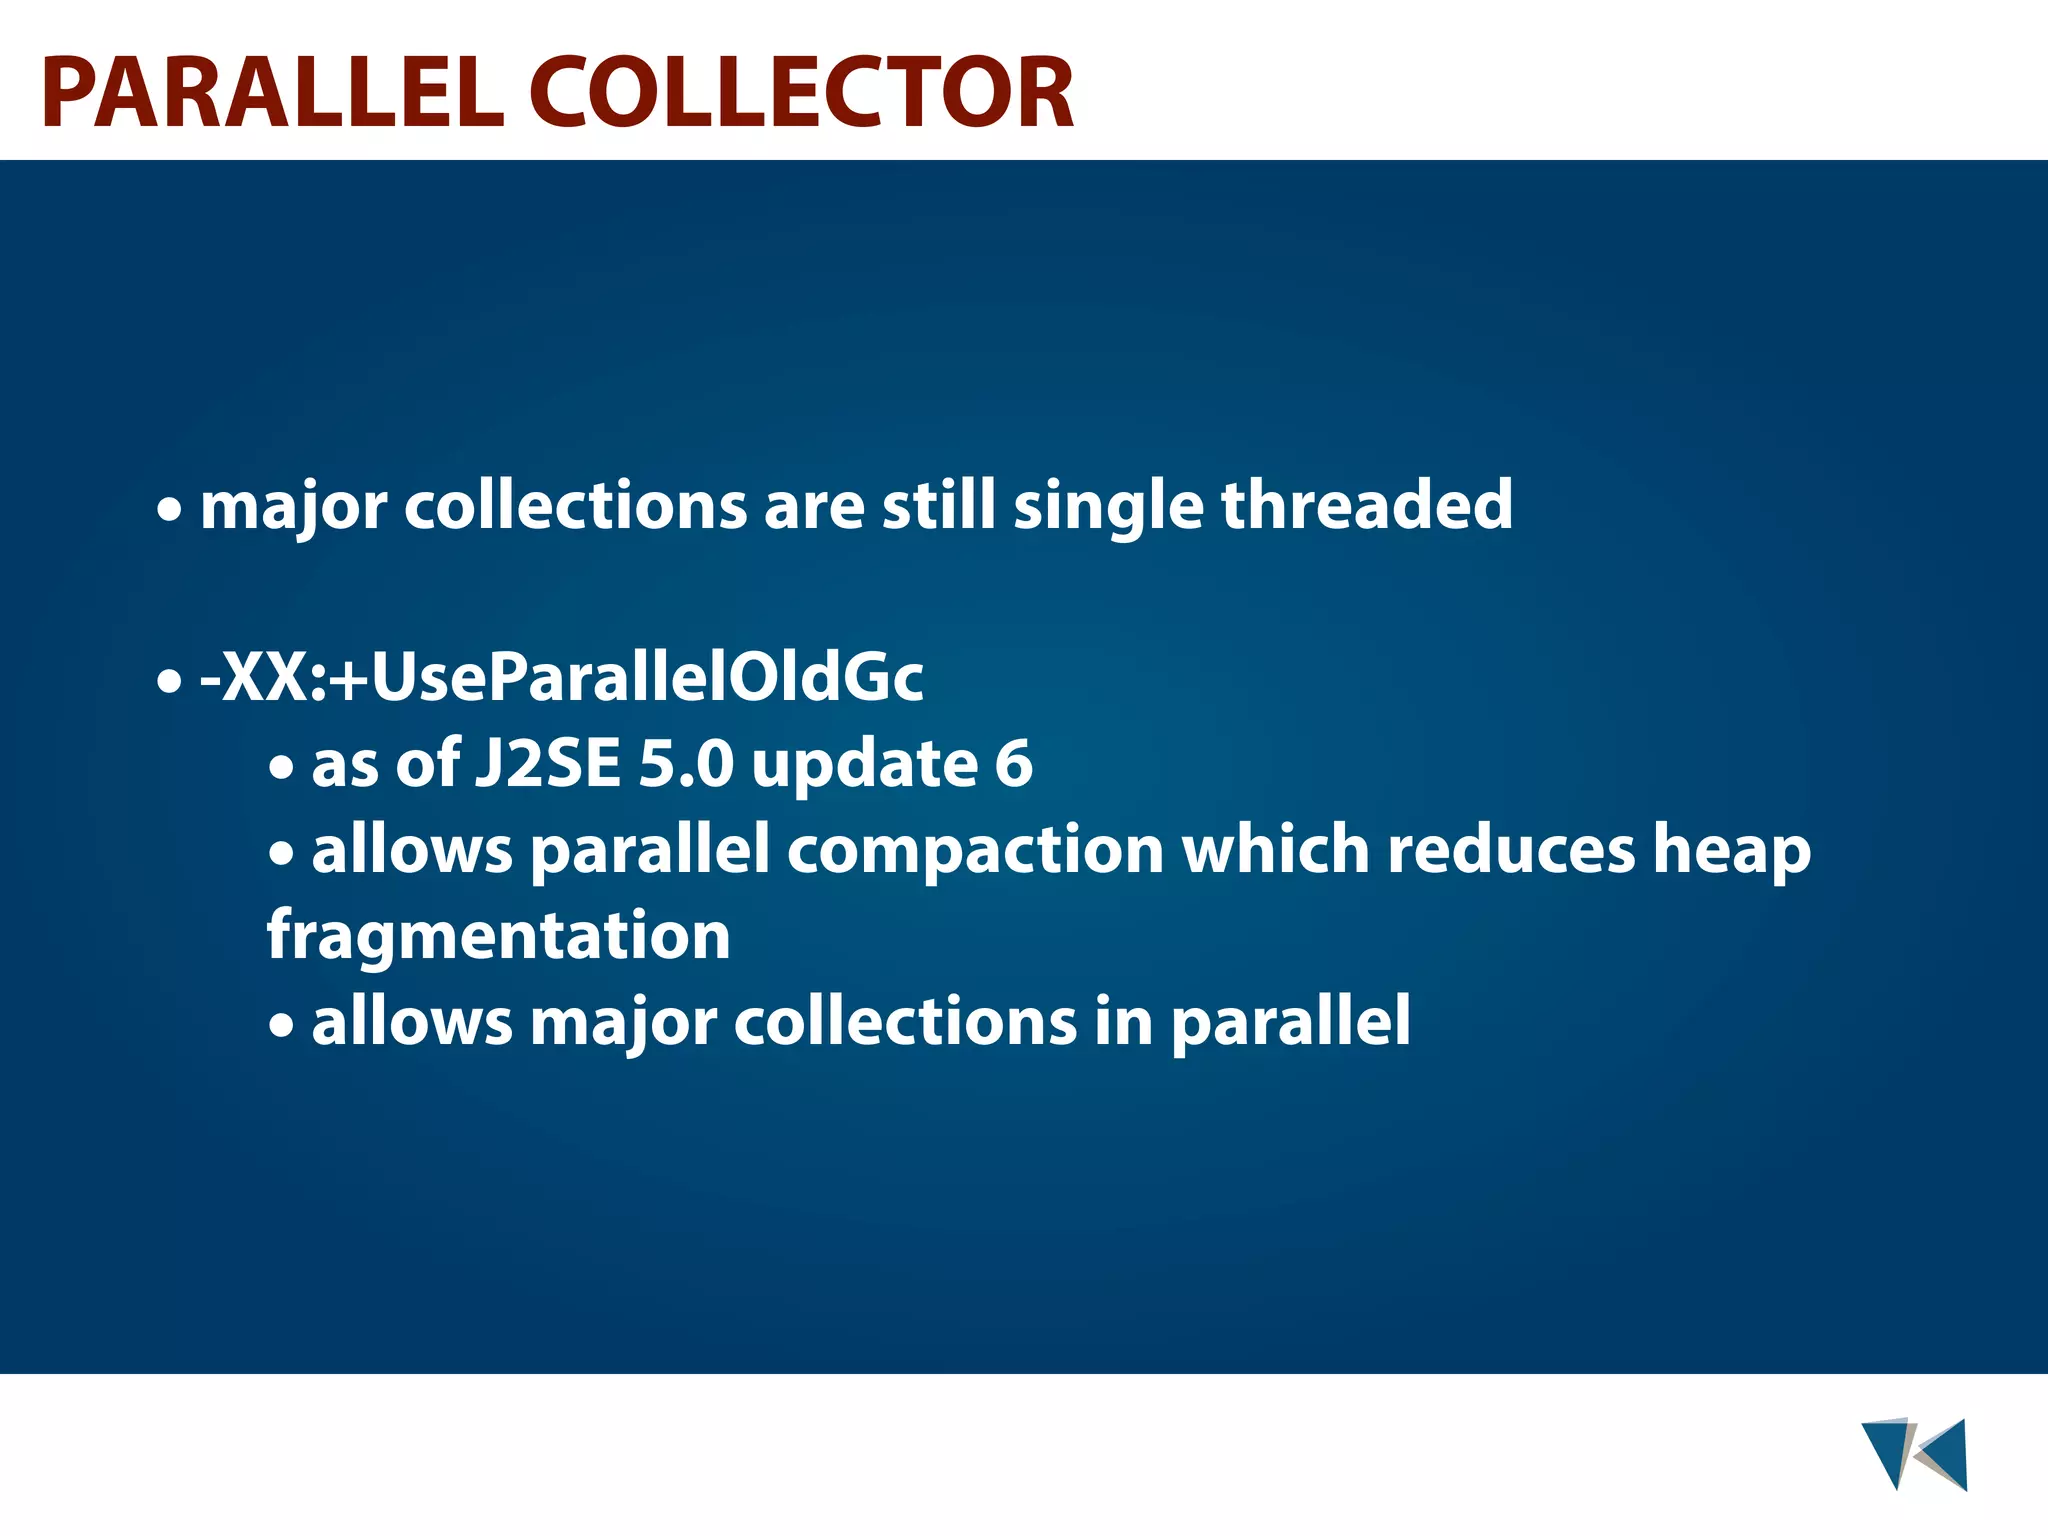
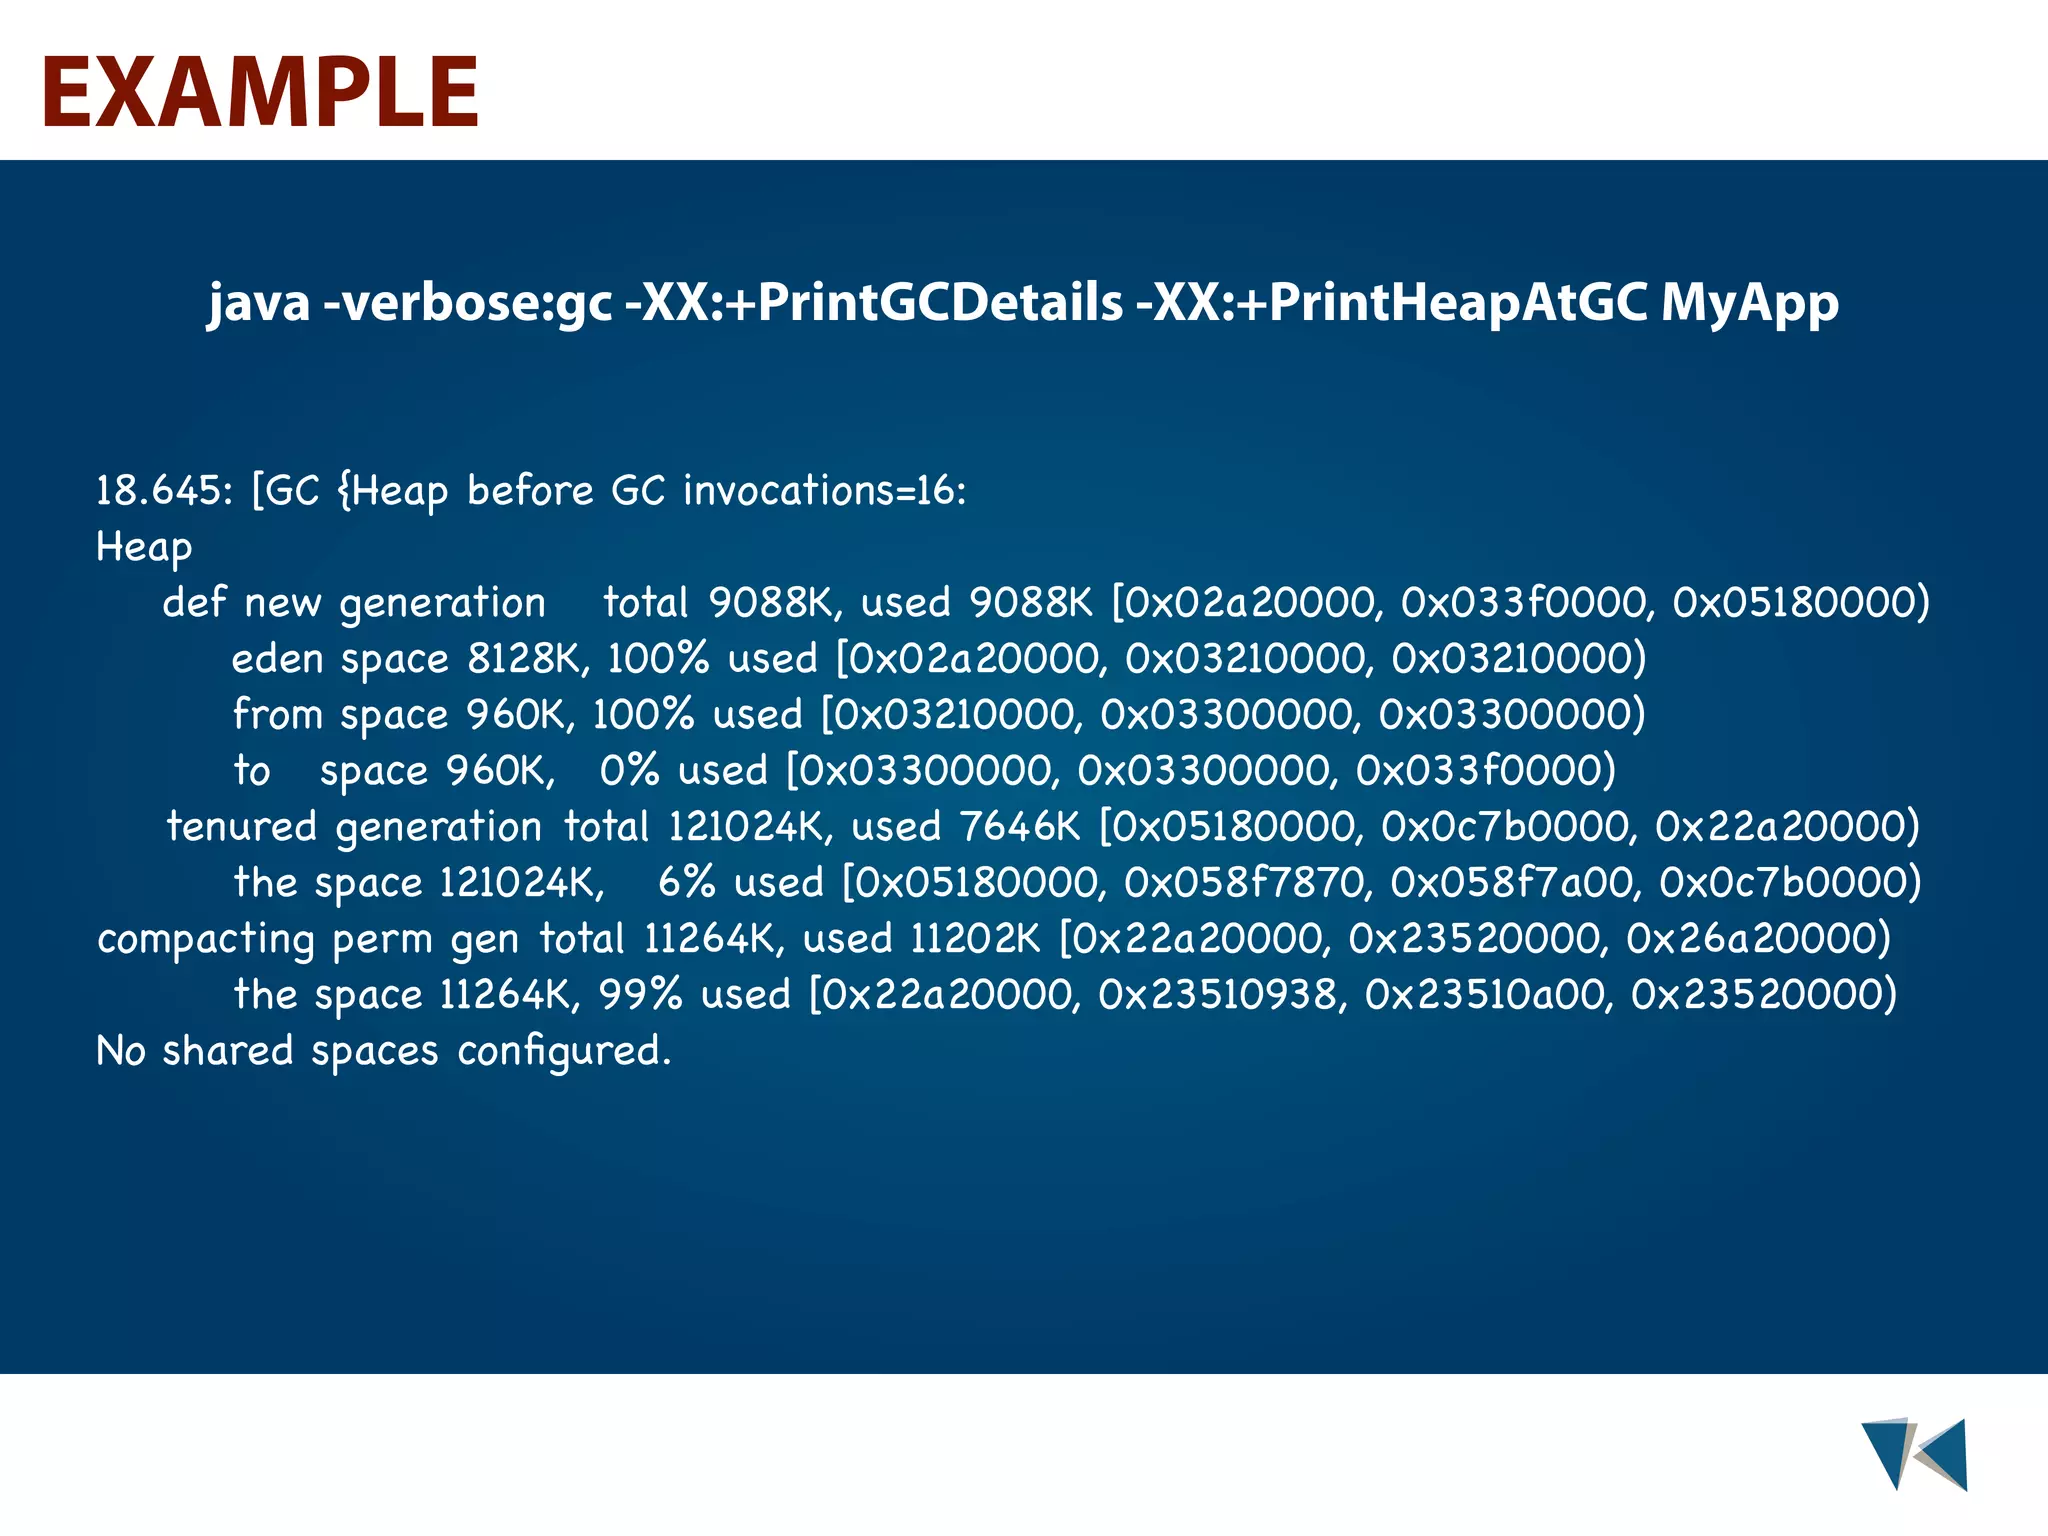
![EXAMPLE java -verbose:gc -XX:+PrintGCDetails MyApp 19.834: [GC 19.834: [DefNew: 9088K->960K(9088K), 0.0126103 secs] 16709K->9495K(130112K), 0.0126960 secs] 20.424: [Full GC 20.424: [Tenured: 8535K->10032K(121024K), 0.1342573 secs] 13847K->10032K(130112K), [Perm : 12287K->12287K(12288K)], 0.1343551 secs]](https://image.slidesharecdn.com/presentation-tk-130109081951-phpapp01/75/Basics-of-JVM-Tuning-50-2048.jpg)


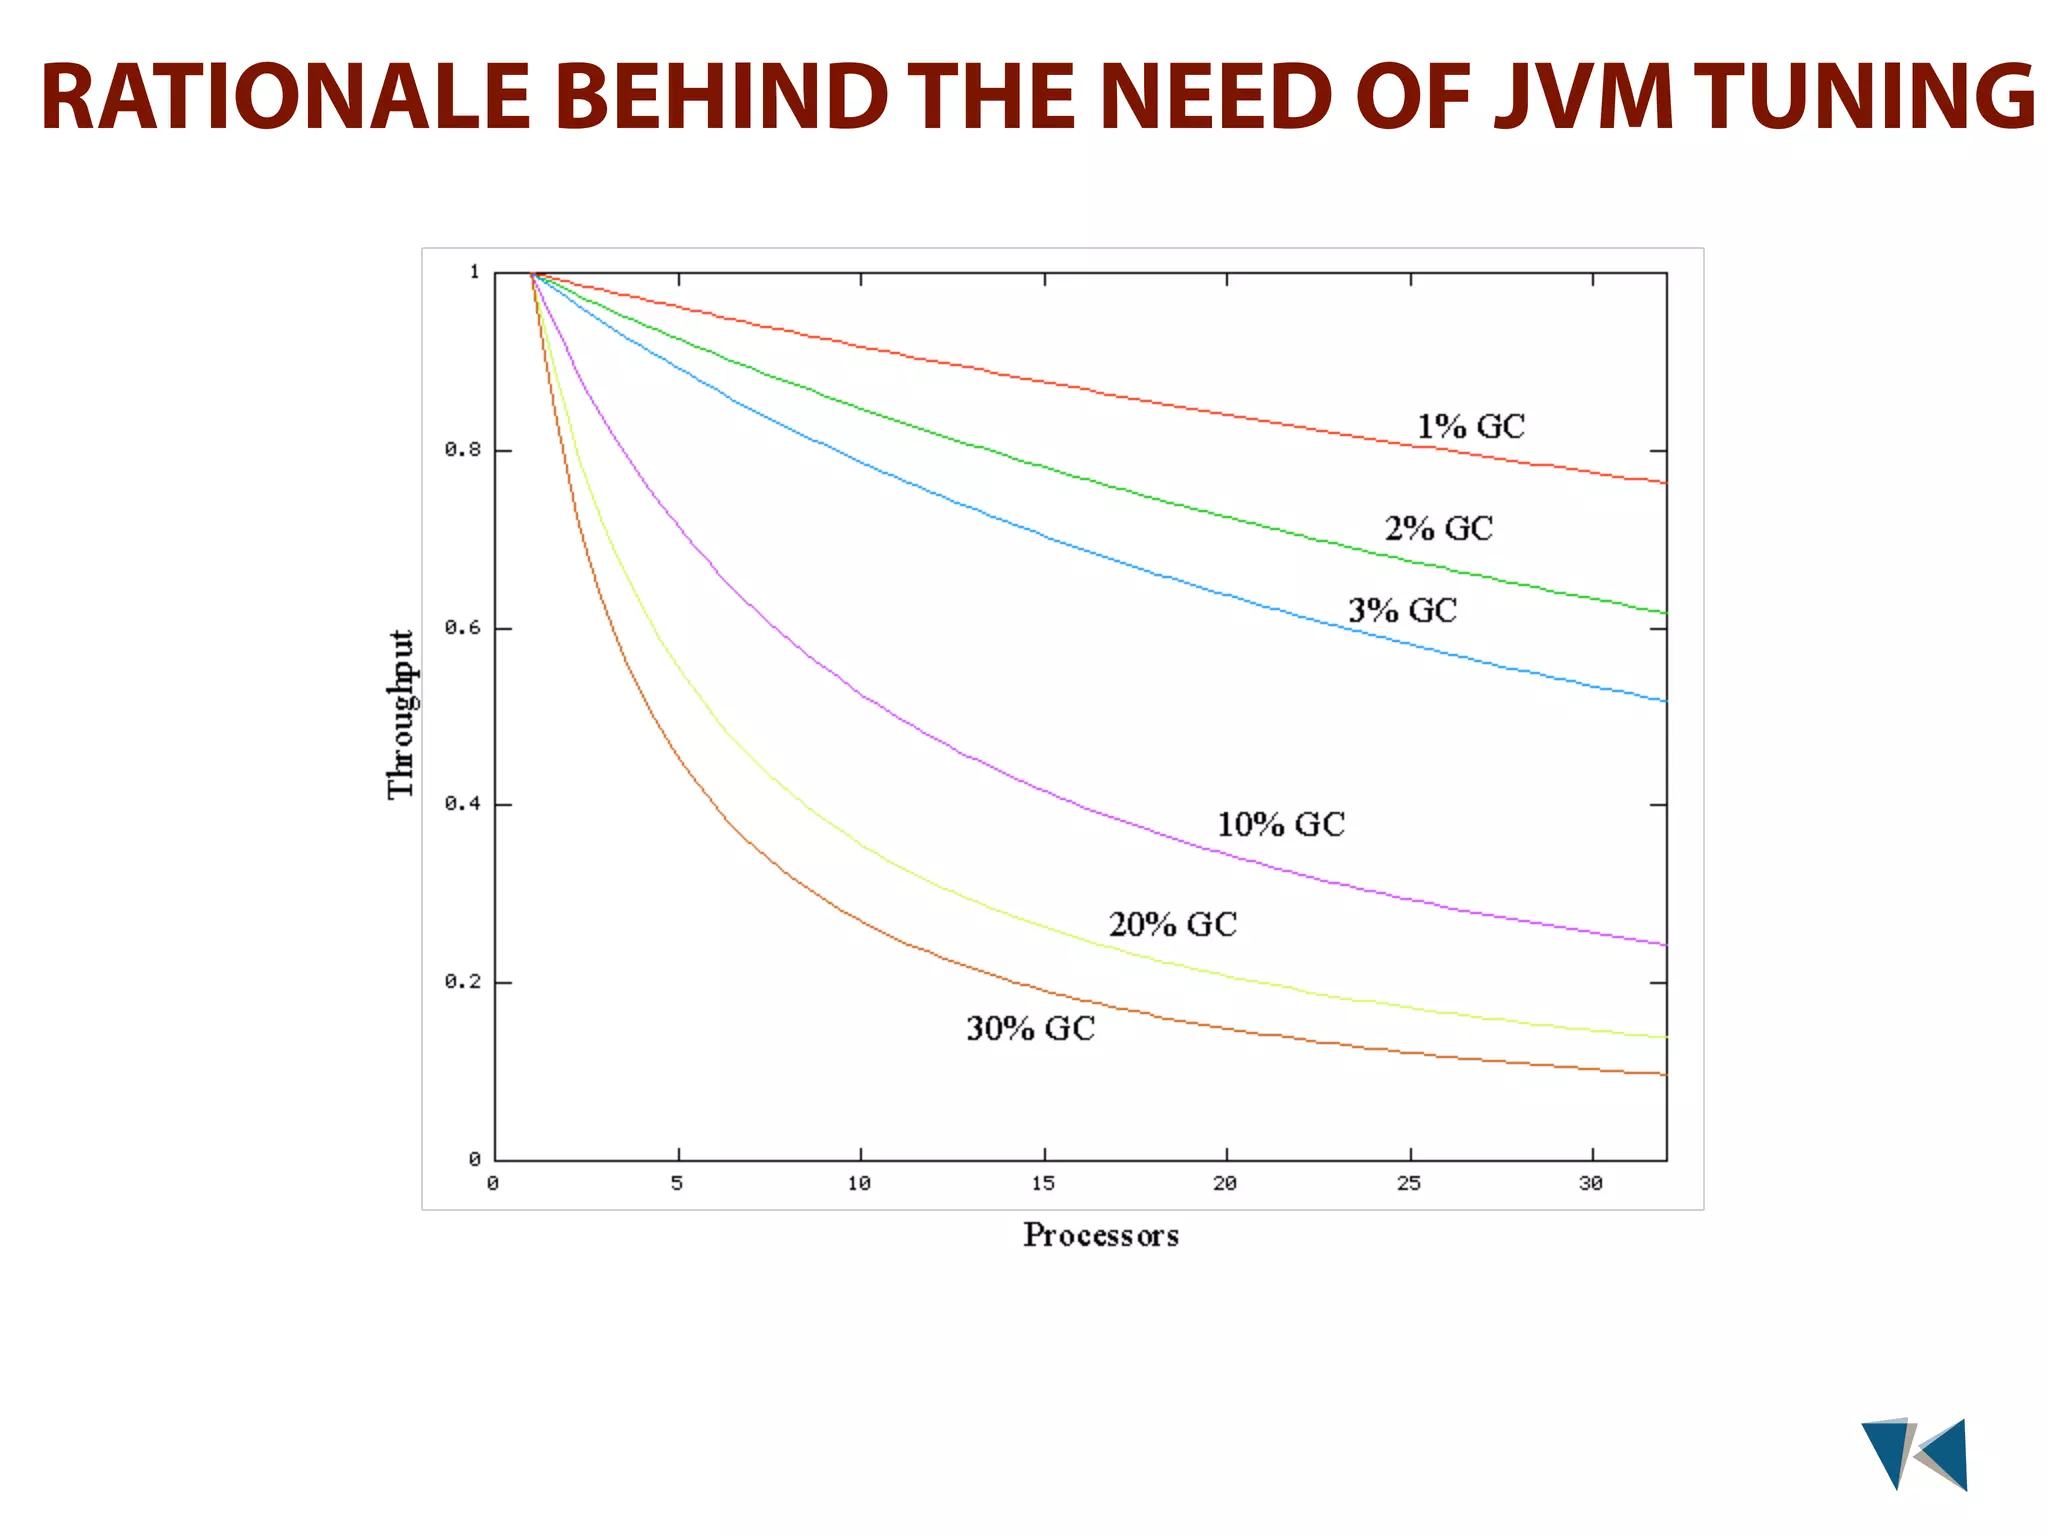
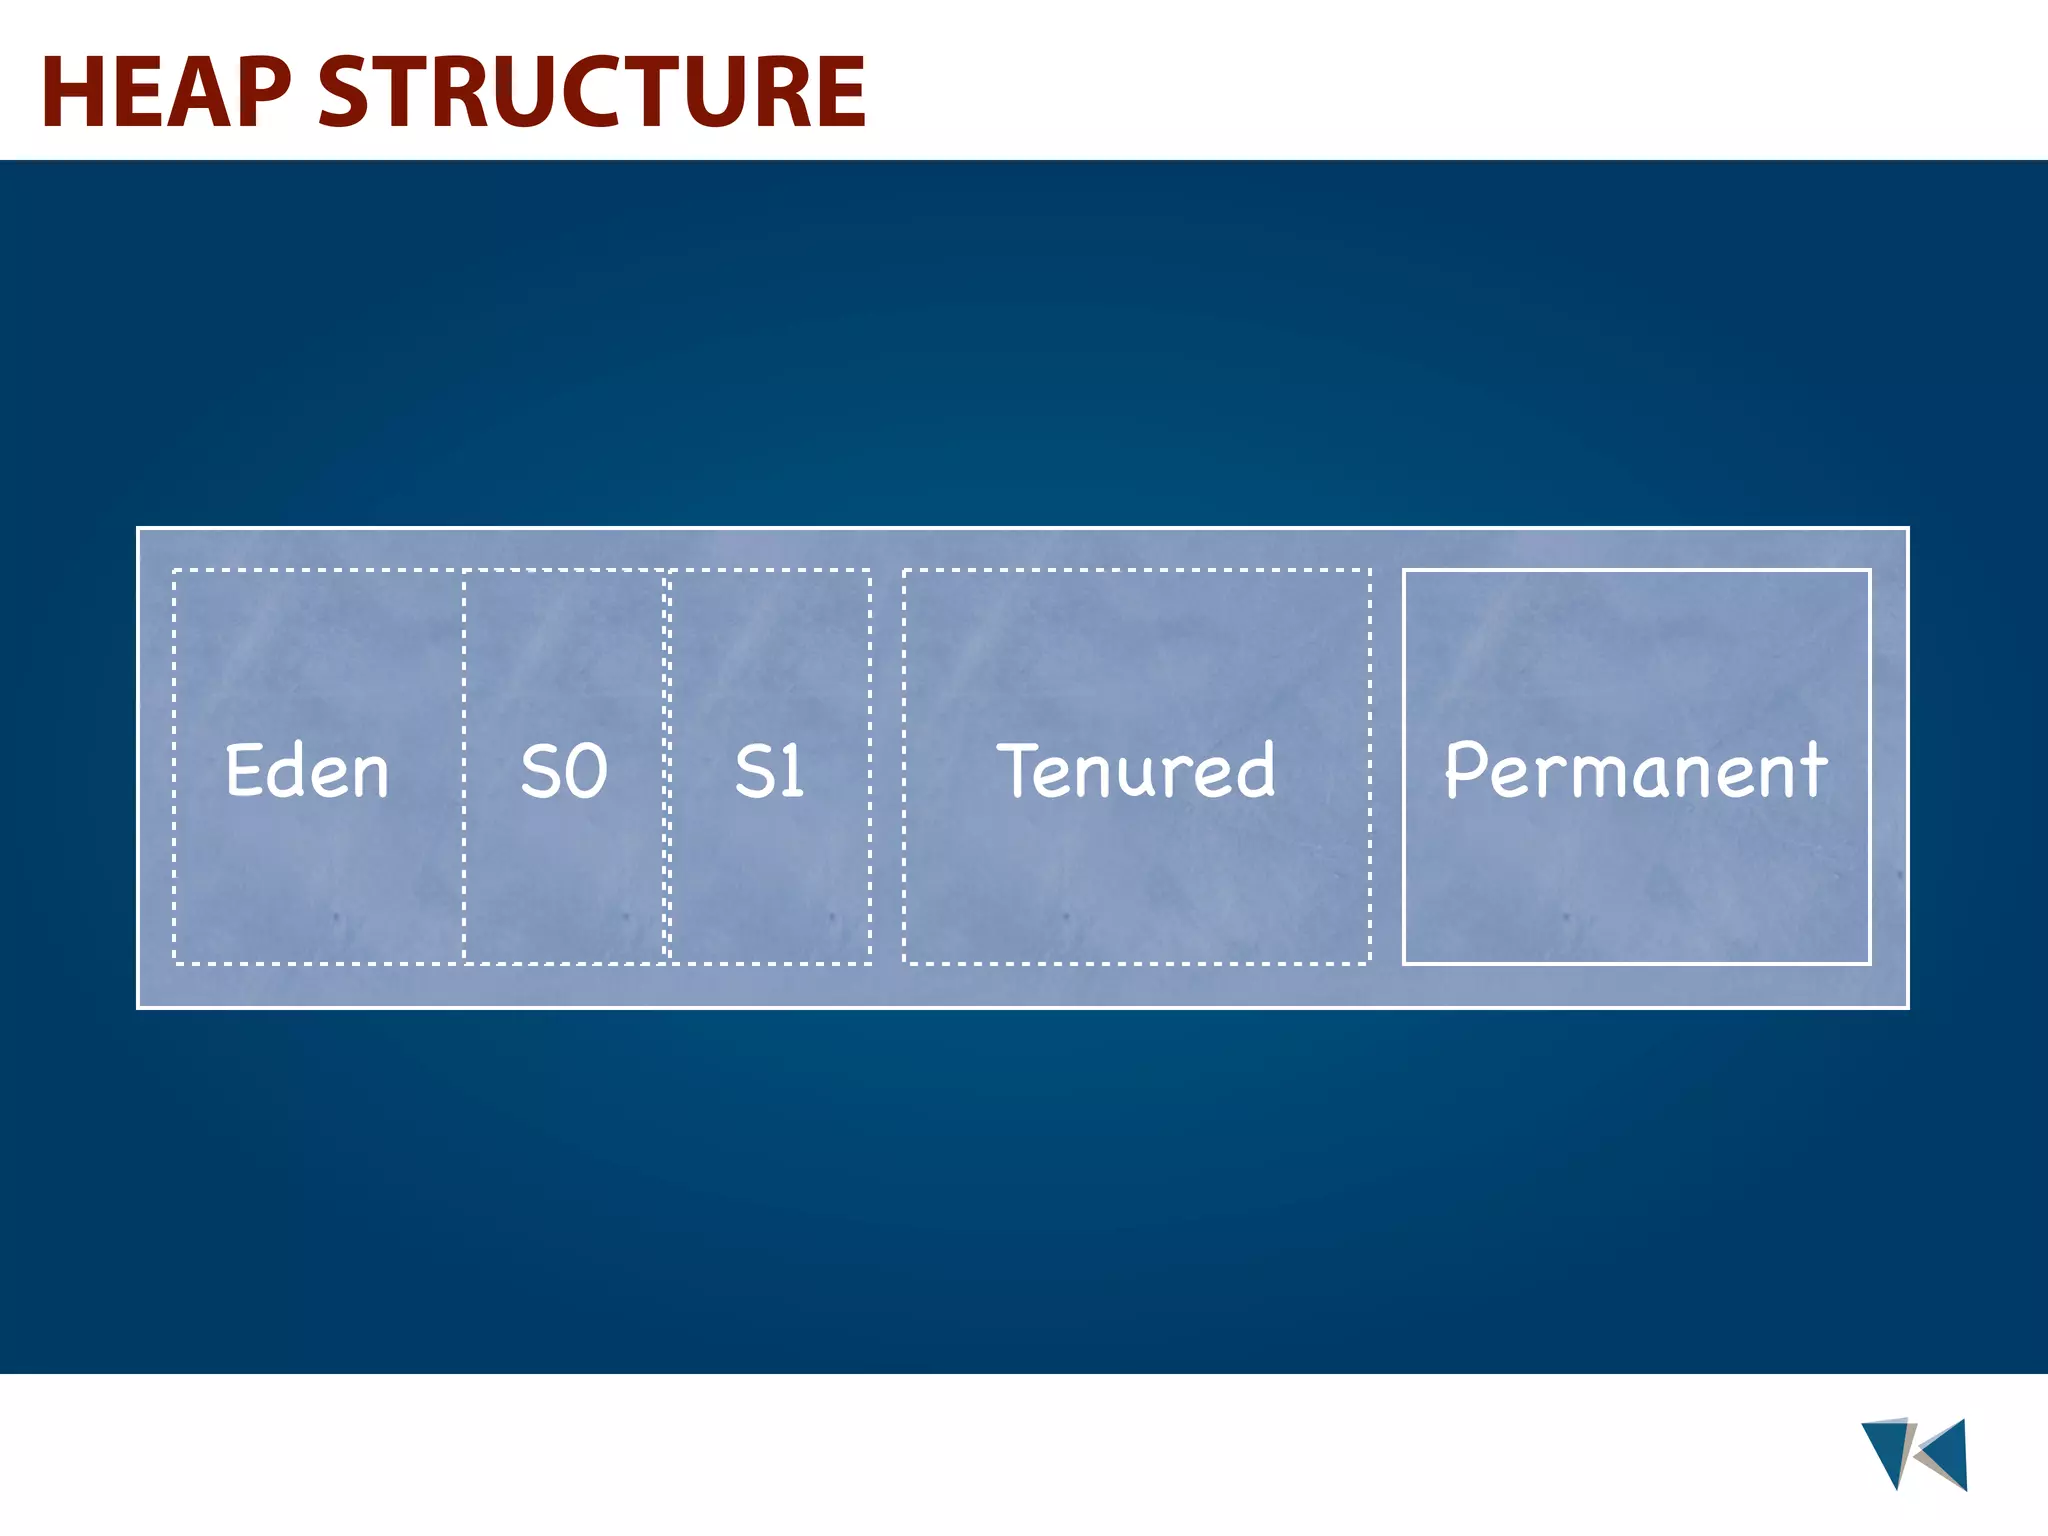
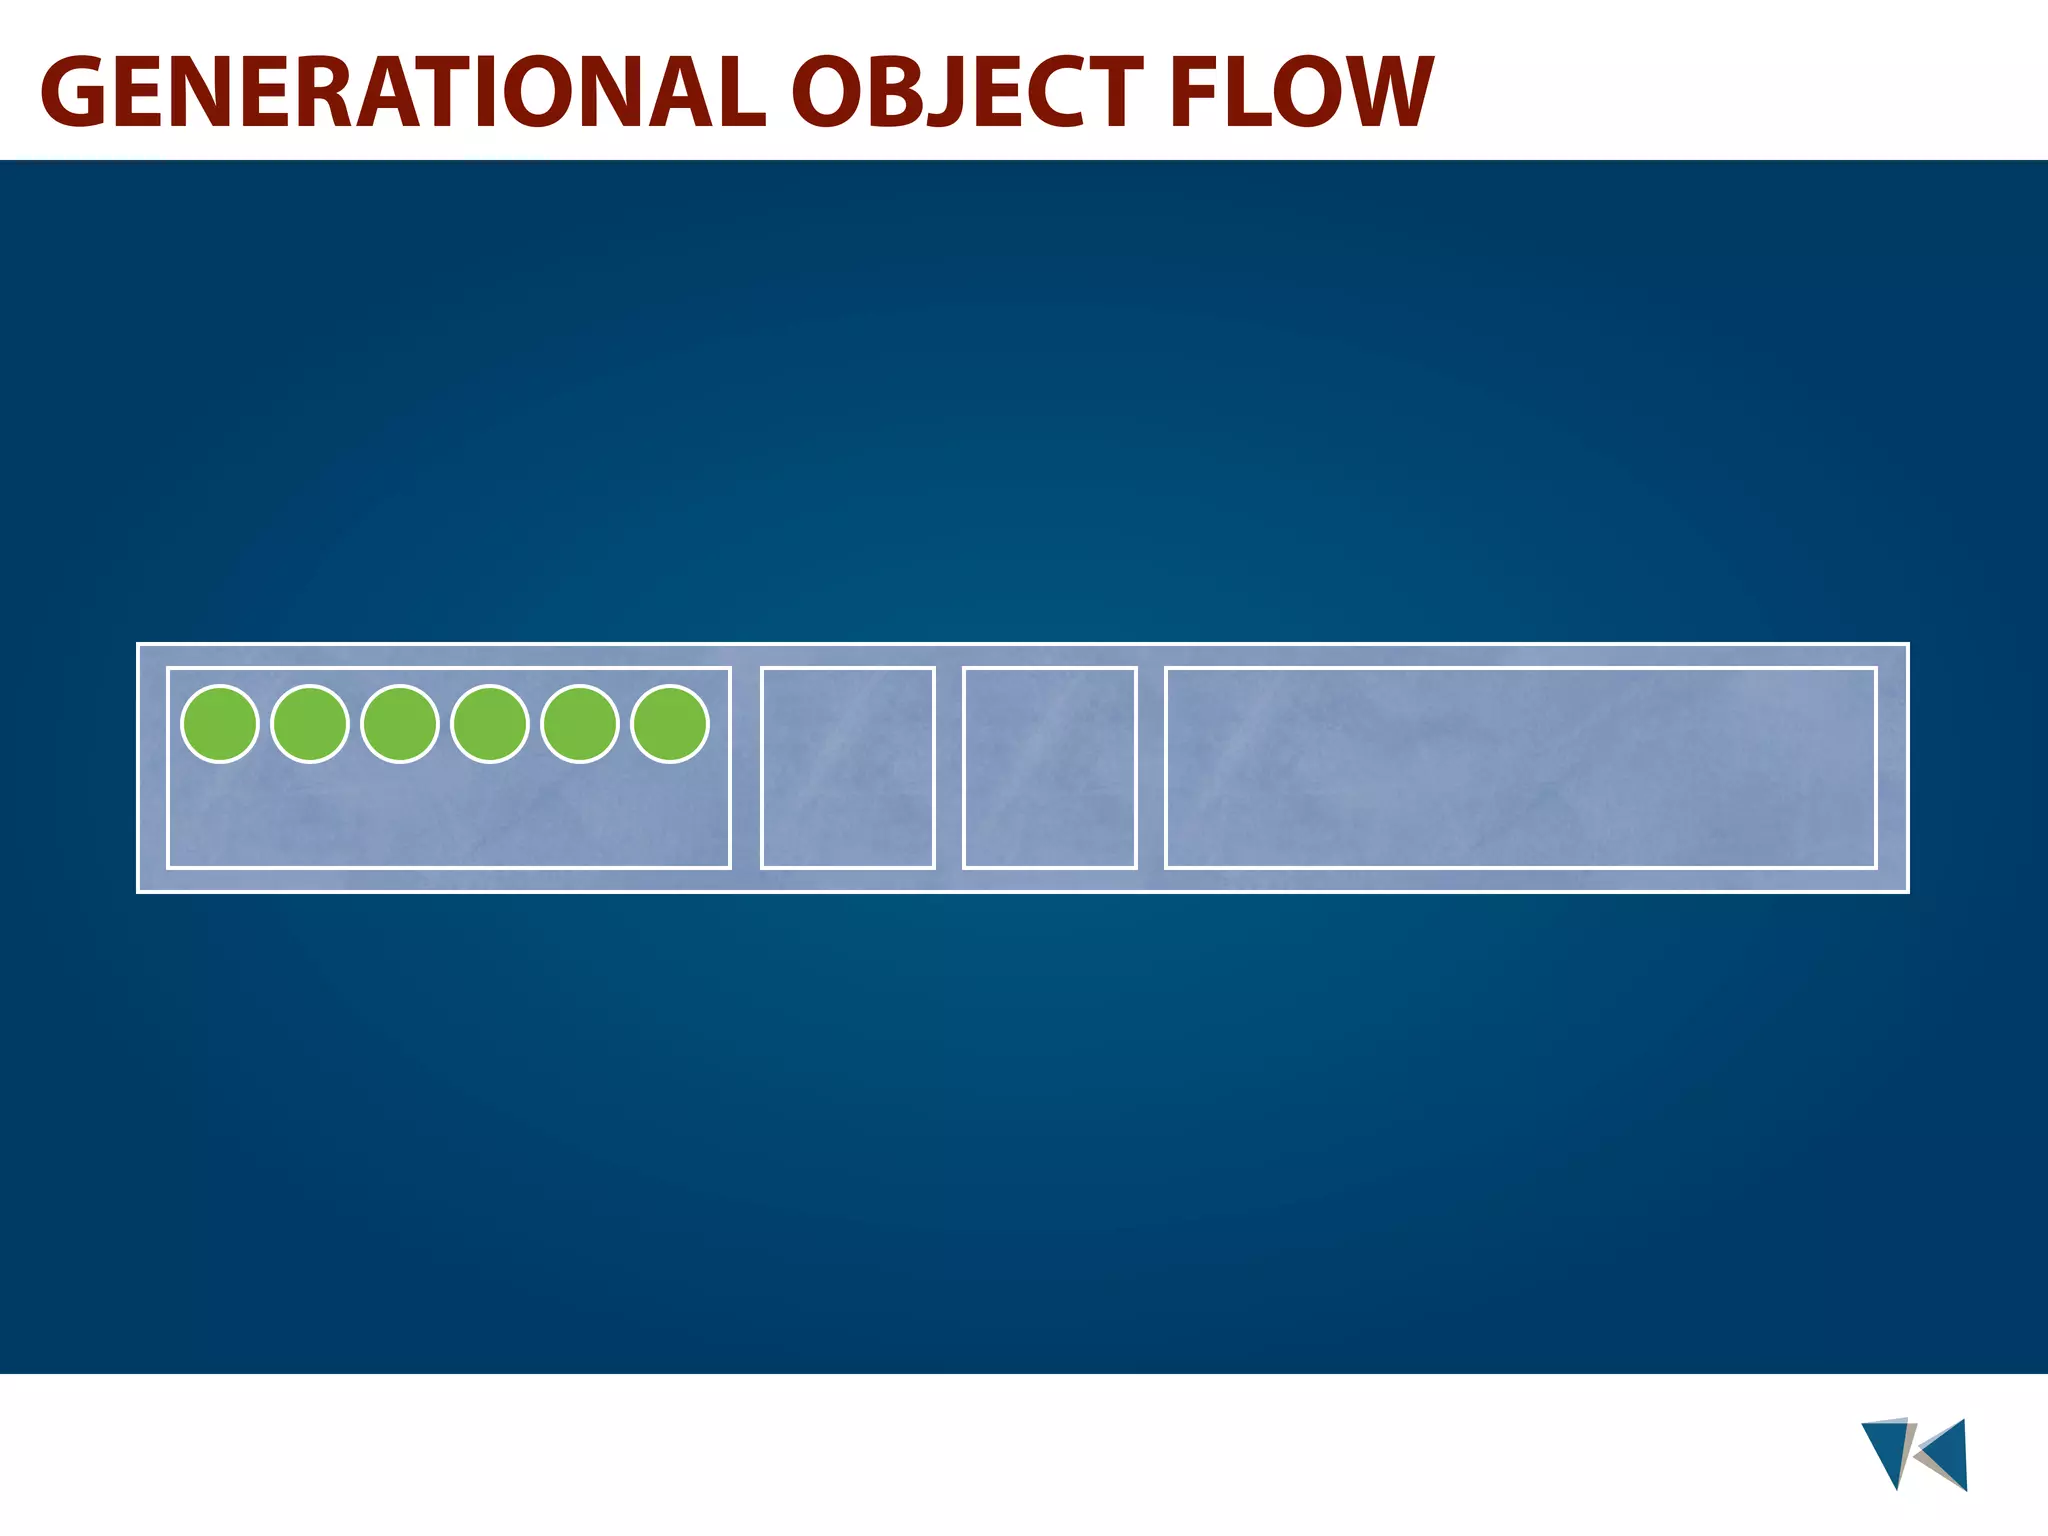
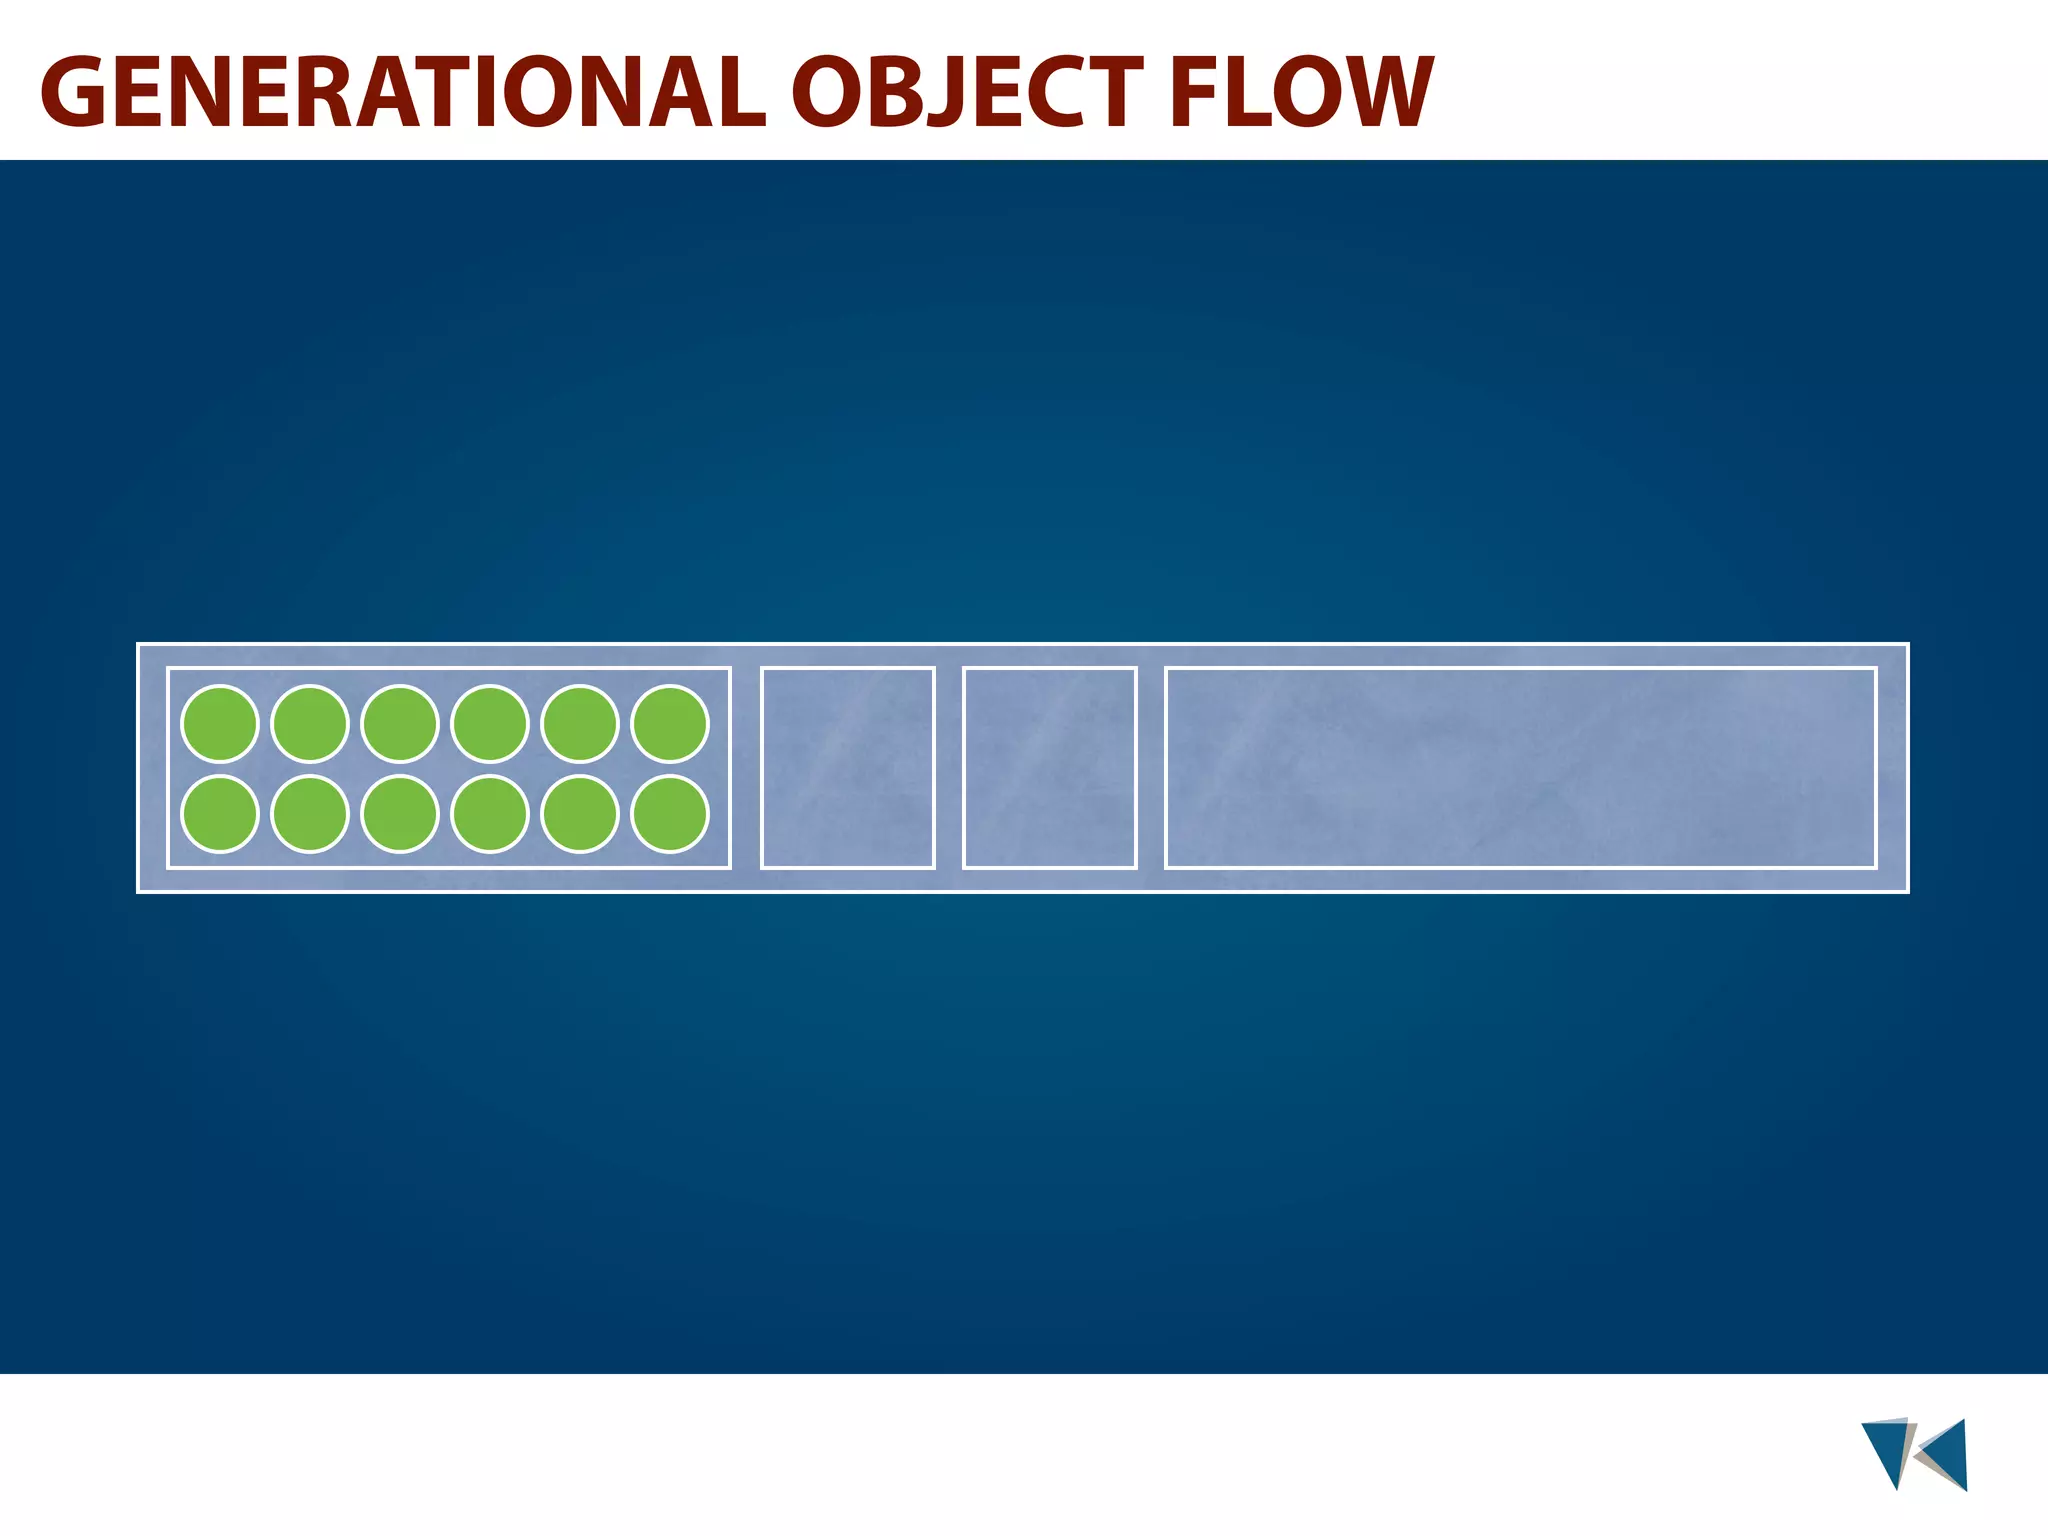
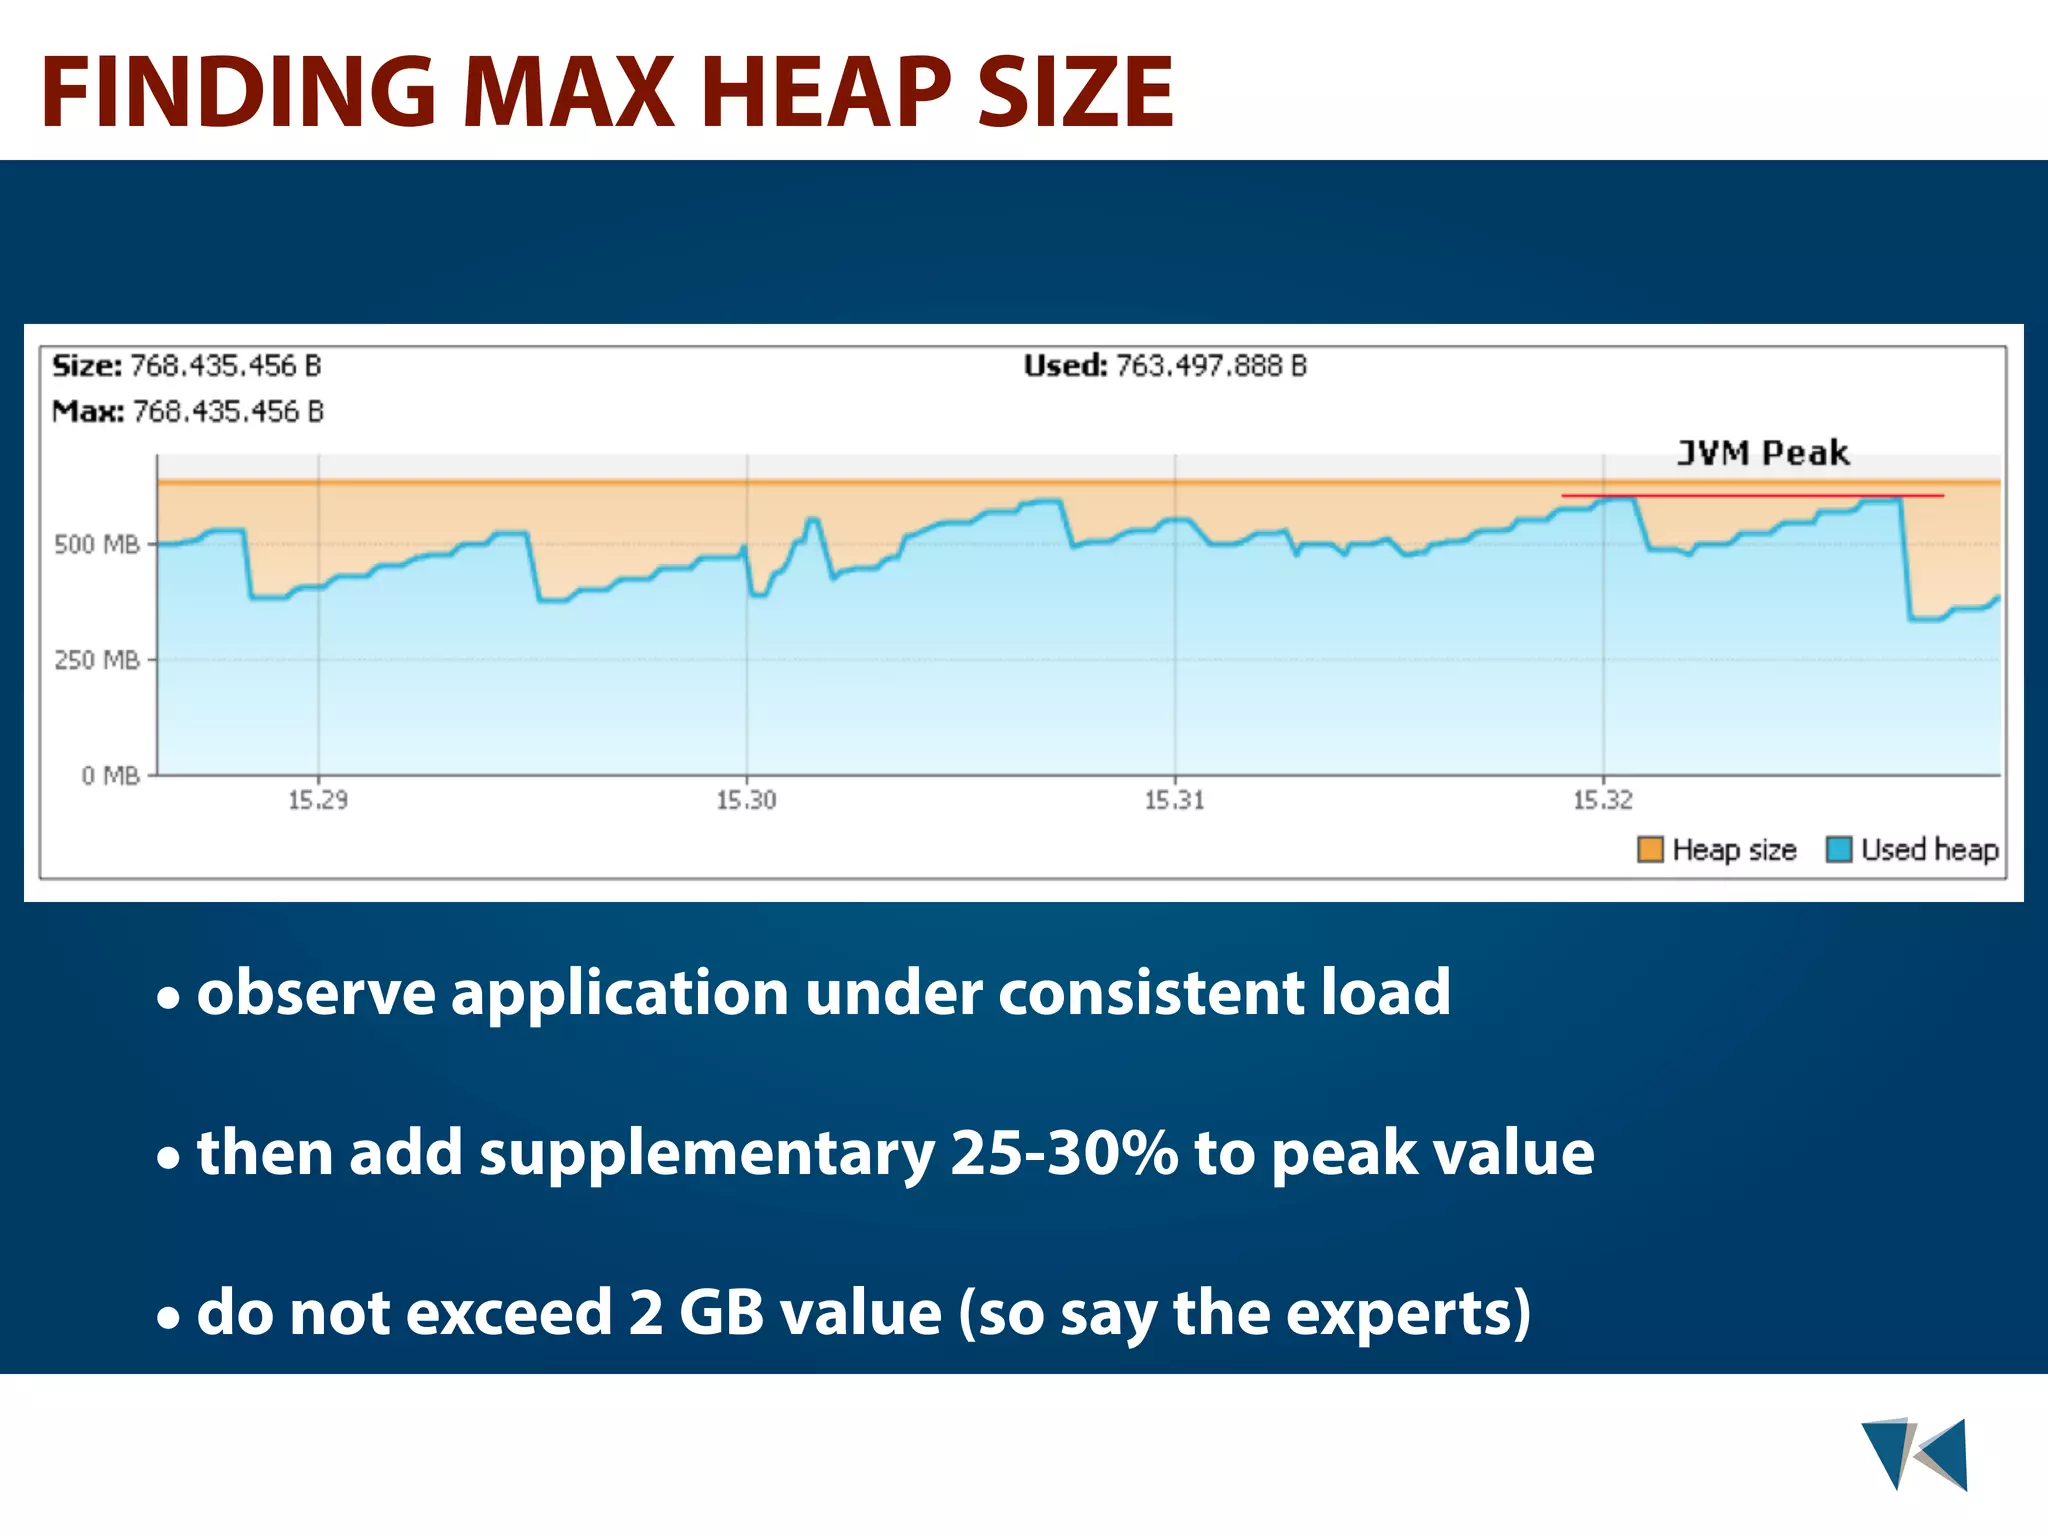
The document discusses JVM tuning, focusing on memory management, garbage collection algorithms, and optimal settings for performance. Key topics include the differences between stack and heap memory, ways to configure heap sizes, and various garbage collection methods suited for different machine types and workloads. It also offers practical advice for analyzing heap behavior, including the use of tools and command options for monitoring and fine-tuning JVM performance.