The paper introduces a two-phase classification method for network anomaly detection using tree-based machine learning algorithms, focusing on addressing challenges like imbalance and feature selection. It utilizes information gain for feature selection and evaluates the CICIDS-2018 dataset, achieving a peak accuracy of 98.36% with its ensemble classifier. The study highlights the significant impact of selected features on performance metrics such as F1-score and detection accuracy, emphasizing the importance of effective preprocessing and classification techniques in intrusion detection systems.
![International Journal of Computer Networks & Communications (IJCNC) Vol.15, No.4, July 2023 DOI:10.5121/ijcnc.2023.15406 93 INTRUSION DETECTION SYSTEM (IDS) DEVELOPMENT USING TREE- BASED MACHINE LEARNING ALGORITHMS Witcha Chimphlee and Siriporn Chimphlee Department of Data Science and Analytics, Suan Dusit University, Bangkok, Thailand ABSTRACT The paper proposes a two-phase classification method for detecting anomalies in network traffic, aiming to tackle the challenges of imbalance and feature selection. The study uses Information Gain to select relevant features and evaluates its performance on the CICIDS-2018 dataset with various classifiers. Results indicate that the ensemble classifier achieved the highest accuracy, precision, and recall. The proposed method addresses challenges in intrusion detection and highlights the effectiveness of ensemble classifiers in improving anomaly detection accuracy. Also, the quantity of pertinent characteristics chosen by Information Gain has a considerable impact on the F1-score and detection accuracy. Specifically, the Ensemble Learning achieved the highest accuracy of 98.36% and F1-score of 97.98% using the relevant selected features. KEYWORDS Intrusion Detection System, Anomaly Detection, Imbalance Data, Feature Selection, CICIDS-2018 dataset 1. INTRODUCTION Due to the growth of applications that produce data, the data volumes have increased dramatically in recent years and must now be gathered, stored, and analyzed[1]. Therefore, the number of attacks has increased including malware, botnets, spam, phishing, and DoS attacks have turned out to be consistent dangers for systems and hosts. The network traffic activity is made up of numerous features that have been compiled into a dataset to identify various attack types [2]. Technology is currently facing a significant difficulty because of the daily growth in the enormous volume of data generated online[3].In order to identify these threats, effective intrusion detection systems (IDS) have been created. Systems for detecting intrusions have been crucial to the safety of networks and computers. IDS network traffic monitoring and analysis is used to categorize various sorts of attacks [4][5]. The primary problems with the IDS are the systems' susceptibility to errors and the inconsistent and unfair ways that the systems' evaluation processes were frequently carried out[6][7]. One of the most important challenges with the greatest performance for big intrusion detection data sets is the component of dimensional reduction known as feature selection, which is the process of choosing the ideal feature subset to represent the full dataset [8]. Problems with categorization might be seen in pattern recognition or anomaly detection. When a variable needs to be predicted yet is categorical, the challenge is referred to as a classification problem. Several classification techniques are used to detect distinct sorts of assaults to improve IDS performance [9]. Anomaly intrusion detection is an important research area in computer](https://image.slidesharecdn.com/15423cnc06-230906085940-3ffa041b/75/Intrusion-Detection-System-IDS-Development-Using-Tree-Based-Machine-Learning-Algorithms-1-2048.jpg)
![International Journal of Computer Networks & Communications (IJCNC) Vol.15, No.4, July 2023 94 network security, aimed at identifying abnormal behavior in network traffic that may indicate an attack or a security breach. IDS that rely on detection come in two flavors: signature-based and anomaly-based. Attacks are discovered using specified signature samples in signature-based IDS, making it a type of abuse detection[10]. This method works well with large samples of signature data and has a low false alarm rate. Only known attacks, however, can be identified, leading to a high proportion of missed alarms. Nevertheless, anomaly-based IDS recognizes assaults by seeing out-of-the- ordinary behaviors that depart from the typical profile. This method may have a reduced risk of false alarms, but it can detect unidentified attacks. The categorization model separates the dataset into training and testing phases[11]. Unfortunately, the training process is difficult and time-consuming due to the abundance of high- dimensional features. To improve the model's performance during testing, pertinent and valuable features must be chosen from the whole feature collection[ 1 2 ] . Improvements to intrusion detection systems (IDS) are being made using machine learning (ML) techniques, which are becoming more and more prominent in computer security datasets. There are many machine learning algorithms available to users that can be implemented on datasets [13]. ML algorithms assist in managing enormous amounts of data and extracting important features for different feature selection procedures[14]. Popular machine learning classifier IDS divides different assaults into several categories. Machine learning techniques including decision trees (DT), extra trees (ET), random forests (RF), and XGBoost (eXtreme Gradient Boosting) are frequently used in anomaly intrusion detection. These algorithms understand the system's typical behavior and recognize variations from it that might indicate an attack by training on huge amounts of network traffic data. Intrusion detection is still a crucial field of research for two reasons. The first is the regular updating and modifying of network breaches, which results in patterns that are constantly changing. Second, it gets simpler to explore and assess new concepts as more intrusion detection datasets become accessible over time [15].Therefore, it is crucial to discover an optimal method that reduces both false positives and false negatives. The goal of this study is to analyze how the number of feature dimensions affects classification accuracy when using attack datasets. Additionally, the study considers the impact of data sample imbalance on classifier evaluation. To assess the quality of preprocessed data for multiple attacks in the CSE-CICIDS-2018 dataset, various metrics were computed. Furthermore, the study computed and discussed the performance measures of intrusion detection models that were trained. The main contributions of this paper are: The feature reduction method based on the first classification outcomes and feature importance metrics produced by Information Gain. A comparison of the machine learning methods DT, RF, ET, and XGBoost for IDS. To demonstrate the effect of preprocessing, the imbalance issue in an intrusion detection dataset is handled using SMOTE. The rest of the paper is organized as follows: Section 2 gives an overview of intrusion detection and classification model. It also provides more information about imbalance data and feature selection. Section 3 provides our methodology. Section 4 presents the results from each of the algorithms and Section 5 concludes with the findings and discussion of the project results.](https://image.slidesharecdn.com/15423cnc06-230906085940-3ffa041b/75/Intrusion-Detection-System-IDS-Development-Using-Tree-Based-Machine-Learning-Algorithms-2-2048.jpg)
![International Journal of Computer Networks & Communications (IJCNC) Vol.15, No.4, July 2023 95 2. RELATED WORKS An essential component that monitors and analyzes networks to find intrusions and alert managers to ongoing attack operations is an intrusion detection system. Intrusion detection is a prominent study subject. First, network invasions constantly update and evolve, leading to patterns that are constantly shifting. Second, more intrusion detection datasets are becoming available over time, allowing for the examination and evaluation of novel strategies [16]. Low false positives and false negatives are desirable in an intrusion detection system. The representative training dataset's quality, however, can have a big impact on these metrics. Real- world situations could involve a variety of difficulties, including issues with class imbalance, mixed data types (continuous, discrete, ordinal, and categorical), as well as non-Gaussian and multimodal distributions in intrusion detection traces that call for handling. The field of intrusion detection systems has been examined and investigated by numerous researchers. Colas and Brazdil [17] conducted a comparative analysis of KNN, Naive Bayes, and SVM methods in intrusion detection systems. Their feature-based comparison showed that SVM is more efficient and has shorter processing time, but KNN has a better classification accuracy. One of the strengths of their study is the systematic comparison of these three popular algorithms, which provides useful insights into their strengths and weaknesses. However, their evaluation was limited to a specific dataset and may not generalize to other datasets. Jiang et al. [18] developed a text categorization model that combines a one-pass clustering approach and an improved KNN text classification algorithm. Their combination strategy showed a significant improvement over conventional KNN, Naive Bayes, and SVM algorithms, in terms of reducing text redundancy and enhancing text categorization. One of the strengths of their research is the novel combination of clustering and classification methods, which can be applied to various text mining tasks. However, their study focused only on text data and may not generalize to other types of data. Elejla and colleagues [19] examined a number of classification methods, including KNN, SVM, Decision tree, Naive Bayes, and Neural network, to forecast DDoS attacks using network monitoring. They found that SVM and Decision tree methods outperformed other algorithms in terms of detection accuracy. One of the strengths of their study is the evaluation of multiple classification algorithms in the context of DDoS attack detection. However, their evaluation was limited to a specific dataset and may not generalize to other datasets. Bahrololum et al. [20]used supervised and unsupervised Neural Network (NN) and Self Organizing Map (SOM) methodologies in their analysis of network traffic patterns for intrusion detection. Their study showed that NN and SOM can effectively capture the complex patterns in network traffic data and outperform traditional statistical methods. One of the strengths of their research is the use of advanced machine learning methods to analyze network traffic data. However, their study focused only on a specific type of data and may not generalize to other types of data. Awad and Alabdallah [6] presented a weighted extreme learning machine technique to address the problem of imbalanced classes in intrusion detection systems. Their study showed that the weighted ELM approach can effectively handle imbalanced data and improve classification performance. One of the strengths of their research is the development of a novel approach to handle imbalanced data, which is a common problem in intrusion detection. However, their evaluation was limited to a specific dataset and may not generalize to other datasets.](https://image.slidesharecdn.com/15423cnc06-230906085940-3ffa041b/75/Intrusion-Detection-System-IDS-Development-Using-Tree-Based-Machine-Learning-Algorithms-3-2048.jpg)
![International Journal of Computer Networks & Communications (IJCNC) Vol.15, No.4, July 2023 96 Siriporn and Witcha [21] compared the performance of a number of classification methods, including LR, KNN, CART, Naive Bayes, RF, MLP, and XGBoost. They also included a feature selection technique employing radio frequency (RF) to enhance classification performance. Their study showed that RF-based feature selection can improve classification accuracy for all tested algorithms. One of the strengths of their research is the comprehensive evaluation of multiple algorithms and feature selection techniques. However, their evaluation was limited to a specific dataset and may not generalize to other datasets. 3. THE PROPOSED FRAMEWORK In this paper, we suggest a machine learning (ML)-based traffic classification method for IDS and discuss some of the drawbacks of current approaches. To address the imbalance of traffic samples and identify important characteristics from input flows, we specifically recommend a data pre-processing strategy that incorporates embedded feature selection and under-sampling. In Figure 1, we present the structure for the suggested methodology, and in the sections that follow, we elaborate on each stage. 3.1. CSE-CICIDS-2018 DATASET This section provides an overview of the CSE-CIC-IDS-2018 dataset [22], It was suggested by the Canadian Institute for Cybersecurity and the Communications Security Establishment (CSE) (CIC). The dataset contains both the real-time network activity of various infiltration states and all of the inner network traces required to calculate data packet payloads. The characteristics of the dataset are relevant to our inquiry. The dataset contains 14 different forms of invasions, including SQL injections, Brute Force-XSS, DoS GoldenEye assaults, DoS Hulk an attack, Botnet, SSH brute force, DDoS-low orbit ion cannon (LOIC)-UDP attacks, DDoS-LOIC-HTTP attacks, and Brute Force-UDP attacks[23]. Figure 1. Designing the proposed method 3.2. Data Preprocessing An IDS must include data processing as it is the initial step in simplifying machine learning model training. Effective data preparation has a direct impact on the classification model's performance, and by using the appropriate procedures, technical issues with data pretreatment can be resolved and performance levels can be increased. This section covers the precise steps](https://image.slidesharecdn.com/15423cnc06-230906085940-3ffa041b/75/Intrusion-Detection-System-IDS-Development-Using-Tree-Based-Machine-Learning-Algorithms-4-2048.jpg)
![International Journal of Computer Networks & Communications (IJCNC) Vol.15, No.4, July 2023 97 involved in data preparation, such as data integration, cleaning, encoding, and normalization, as well as how feature selection is used. The success of model training depends on the data preparation processes, which have received little attention despite the vast number of samples that have been collected. 3.2.1. Data Integration This section covers the CSE-CIC-IDS-2018 dataset, which has 16,233,002 instances spread over 10 files with 80 features per row. The dataset comprises 14 different attack types across six different scenarios, with attack traffic accounting for about 17% of these incidents [24]. There are many different types of attacks in the dataset, which is enormous. We pre-processed the data and then combined it into a single database to get the dataset ready for analysis. For simple access and analysis, we compiled all the data from the raw-data files and placed it in a database. 3.2.2. Data cleaning High-quality data is necessary to deliver trustworthy analytics that lead to effective and sensible decision-making. Data cleaning is a necessary component of data pre-processing, which improves the utility of a dataset. It ensures that the data is free of noise and errors that could cause model technical issues. In this study, missing values and pointless attributes were removed from the dataset using data cleaning. Timestamped samples, "Infinity," and "NaN" values were excluded. The missing data was filled in with the mean value, and the feature values were scaled to a standard format using StandardScaler. 3.2.3. Data encoding Data encoding is required to transform category variables into numerical values that machine learning algorithms may use. In our study, the labels are either "0" or "1," where "0" stands for "Benign" and "1" for "Attack," because we are working with a binary classification problem. To help the model comprehend the labels more accurately, we encoded them. The model would perform poorly if the labels were not encoded since it would have trouble understanding them. As a result, data encoding gives the model the ability to understand the labels as numerical values, which improves how well it processes and learns from the data. 3.2.4.Normalization For intrusion detection systems that rely on statistical features extracted from the data, normalization is a crucial step in the preprocessing of the data. Input data must commonly be normalized for machine learning-based techniques in order to remove bias that could result from variations in the magnitudes of the variables' values. When there is a substantial difference between the highest and lowest values of the data, normalization is necessary. By normalizing the data, the range of values is normalized, which enhances the performance of the model. The most common normalizing technique, StandardScaler, adjusts the data to have a mean of 0 and a standard deviation of 1. The transformation of continuous and quasi-continuous features uses standardization. By reducing the mean and scaling the data to a single variance, it normalizes the data. This can be denoted as 𝒳scaler = 𝒳−μ σ , where 𝒳𝑠𝑐𝑎𝑙𝑒𝑟 generates a new value, 𝜇 is the mean, and 𝜎 is the standard deviation, σ = √ 1 𝑁 ∑ (𝑥𝑖 − 𝜇)2 𝑁 𝑖=1 .](https://image.slidesharecdn.com/15423cnc06-230906085940-3ffa041b/75/Intrusion-Detection-System-IDS-Development-Using-Tree-Based-Machine-Learning-Algorithms-5-2048.jpg)
![International Journal of Computer Networks & Communications (IJCNC) Vol.15, No.4, July 2023 98 3.3. Feature selection : Information Gain Feature engineering is a critical step in machine learning where raw data is transformed into useful features to enhance the predictive power of models[25]. Techniques for dimensionality reduction and methods for feature selection are used in this procedure to help choose the most pertinent features for training and detection. For models to perform better, proper dataset preparation and feature selection are essential[26]. The process of feature selection entails deleting noisy or unimportant features while selecting beneficial features from a dataset that faithfully reflect the original data pattern. It is essential to the development of anomaly-based intrusion detection systems because it increases computing efficiency and accuracy. Finding a subcategory of characteristics that accurately represents the data and is necessary for prediction is the aim of feature selection [27].It is essential to carefully select the ideal set of features in order to increase the accuracy of the IDS model by reducing false positives and false negatives. In addition, by simplifying the model, less characteristics in the CICIDS-2018 dataset can enhance the model's interpretability and lessen overfitting. The CICIDS-2018 dataset has a lot of classes, therefore choosing the best features is not an easy task. The techniques used to choose the ideal feature set, the tests that were run, and the features that were adjusted or removed before feature analysis are covered in this section. The most popular feature selection technique is Information Gain, a filter-based feature selection technique [28]. Information Gain ranks characteristics and reduces noise caused by unimportant features by identifying the characteristic that best communicates the most knowledge about a certain class. When determining which feature will provide the most information, entropy, a measure of uncertainty that describes the distribution of features, is calculated[29]. Information gain is a popular approach for feature selection, which involves identifying the most relevant features in a dataset that can help to make accurate predictions. Here are the steps to handle feature selection using information gain: 1. Compute the information gain for each feature: Information gain measures the reduction in entropy (i.e., uncertainty) that results from splitting the data based on a particular feature. Features with higher information gain are more useful for making predictions. You can use a formula like the one below to calculate the information gain for each feature: 𝐼𝑛𝑓𝑜𝑟𝑚𝑎𝑡𝑖𝑜𝑛 𝐺𝑎𝑖𝑛 = 𝐸𝑛𝑡𝑟𝑜𝑝𝑦(𝑆) − ∑ |𝑆𝑣| |𝑆| 𝐸𝑛𝑡𝑟𝑜𝑝𝑦(𝑆𝑣) 𝑉𝑎𝑙𝑢𝑒𝑠(𝐴) (1) where: S is the entire dataset Sv is the subset of S for which the feature value is v |S| is the total number of instances in S |Sv| is the number of instances in Sv 2. Rank the features based on their information gain: Once you have calculated the information gain for each feature, you can rank them in descending order based on their information gain values. The features with the highest information gain are the most relevant and should be selected for the model. 3. Select the top N features: Depending on the size and complexity of your dataset, you may want to select only the top N features with the highest information gain. This will help to reduce the dimensionality of your data and improve the efficiency of your model.](https://image.slidesharecdn.com/15423cnc06-230906085940-3ffa041b/75/Intrusion-Detection-System-IDS-Development-Using-Tree-Based-Machine-Learning-Algorithms-6-2048.jpg)
![International Journal of Computer Networks & Communications (IJCNC) Vol.15, No.4, July 2023 99 4. Train the model with the selected features: Once you have identified the top features using information gain, you can train your model using only those features. This will help to improve the accuracy and interpretability of your model. Overall, using information gain for feature selection can help to improve the performance and efficiency of your machine learning models by reducing the dimensionality of your data and identifying the most relevant features. 3.4. Class Imbalance Class imbalance is a crucial factor to take into account in cybersecurity and machine learning. The researchers' top aim is to increase detection precision. Thus, it is not a good idea to use accuracy as the only statistic if the dataset is uneven and dominated by a single category. The efficacy of the system implies that this unbalanced structure requires development. Random oversampling and the synthetic minority oversampling approach (SMOTE), which frequently results in a low rate of anomaly detection, are used to address the issue of class-imbalanced data[30], [31], and may be employed to produce more data in minority classes where there is a dearth of information. This can then be used to create the matrices that can be used to calculate the unbalanced ratio[32]. Where the data size for class I is shown by Xi. The ratio between the maximum and minimum instances of each class is, in other words, the imbalance ratio. Thus, system efficiency should be increased by lowering this imbalance rate. When one group of individuals is overrepresented in comparison to another, there is a class imbalance.The imbalanced classification problem is caused, numerically, by the ratio of benign traffic to all traffic. Table 1 demonstrates that Benign accounts for a sizeable portion of the data with 13,484,708 records, or 83% of the total, while each type of assault accounted for less than 5% of the records, or roughly three million records, or 17% of all records, while Benign accounts for 13,484,708 records, or 83% of the total Table 1. CICIDS-2018 data distribution [22] Class Type Number Volume (%) Benign 13,484,708 83.0700 DDOS attack-HOIC 686,012 4.2260 DDoS attacks-LOIC-HTTP 576,191 3.5495 DoS attacks-Hulk 461,912 2.8455 Bot 286,191 1.7630 FTP-BruteForce 193,360 1.1912 SSH-Bruteforce 187,589 1.1556 Infilteration 161,934 0.9976 DoS attacks-SlowHTTPTest 139,890 0.8618 DoS attacks-GoldenEye 41,508 0.2557 DoS attacks-Slowloris 10,990 0.0677 DDOS attack-LOIC-UDP 1,730 0.0107 Brute Force -Web 611 0.0038 Brute Force -XSS 230 0.0014 SQL Injection 87 0.0005 Total 16,232,943 100 From Table 1 generates a pie chart to display the proportion of bening and attack traffic in a dataset as Figure 2.](https://image.slidesharecdn.com/15423cnc06-230906085940-3ffa041b/75/Intrusion-Detection-System-IDS-Development-Using-Tree-Based-Machine-Learning-Algorithms-7-2048.jpg)
![International Journal of Computer Networks & Communications (IJCNC) Vol.15, No.4, July 2023 100 Figure 2. Proportion of Benign and Attacks 3.5. Classifiers To determine which classifier performs the best, the training model is constructed and fitted with various classifiers using the model.fit() method. The quality of the learning model and dataset has a significant impact on an IDS's effectiveness [33]. Predicting the class of a given dataset is a step in the classification process. Based on whether the traffic is malicious or benign, binary and multiclass assaults are categorized inside IDS. Binary classification makes use of two clusters, whereas multiclass classification expands the notion to include "n" clusters, allowing for prediction of numerous categories or classes. Given that there are more classifications, multiclass classification is frequently more difficult than binary classification. As a result, algorithms must exert more effort and take longer to complete jobs, which could result in less effective results[6]. Each dataset needs to be analyzed, categorized as normal or aberrant, and the present structures saved for future use. Although abuse detection and anomaly detection are both possible applications of classification, the latter is more frequently used. This study handled feature selection and class imbalance using five machine learning algorithms. This is a more detailed explanation of these. 3.5.1. Random Forest classifier (RF) Using the outputs of several decision trees, each of which was applied to a different subset of a dataset, a machine learning classifier called Random Forest (RF) improves prediction accuracy. It is comparable to the bootstrapping process used in the CART decision tree model. Using different samples and initial parameters, RF tries to construct many CART models. The final forecast, which consists of a substantial number of decision trees that each function independently to anticipate the class outcome, is based on the class that receives the majority of votes [9]. Random Forest include fewer control and model parameters than other models, a lower error rate, resistance to overfitting, and the ability to employ a broad variety of potential attributes without having to pick features. Also, when the number of trees in the forest increases, the variance of the model decreases but the bias remains constant. 3.5.2. XGBoost XGBoost is a machine learning software that uses gradient-boosted decision trees and is primarily concerned with performance and speed. It is an effective tool for maximizing the](https://image.slidesharecdn.com/15423cnc06-230906085940-3ffa041b/75/Intrusion-Detection-System-IDS-Development-Using-Tree-Based-Machine-Learning-Algorithms-8-2048.jpg)
![International Journal of Computer Networks & Communications (IJCNC) Vol.15, No.4, July 2023 101 hardware and memory resources available for tree boosting algorithms, allowing algorithm refinement, model modification, and deployment in computer systems. The three main gradient boosting methods—gradient boosting, regularized boosting, and stochastic boosting—are supported by XGBoost. Several applications prefer the technique since it considerably reduces computation time and increases memory consumption[34]. 3.5.3. Decision Tree (DT) A machine learning approach called a decision tree creates a model that resembles a tree and describes the link between attributes and a class label. It divides observations recursively based on the property with the highest gain ratio value that is the most informative. Although continuous data can also be handled by transforming it to categorical data, decision trees are best suited for data sets with categorical data. As DT models are provided as a set of rules, one benefit is that they are easy to interpret. Each non-leaf node represents a test on a feature attribute, and each branch shows the outcome of this feature attribute on a certain value domain. In order to classify an item using a DT, the associated feature attribute must first be tested. Next, the output branch must be chosen based on its value until it reaches the leaf node, where the category stored there is used as the decision outcome[35]. A category is stored in each leaf node. 3.5.4. Extremely Trees Classifier The Extra Trees Classifier (ETC) machine learning algorithm is a member of the ensemble method family. It is similar to the Random Forest algorithm but chooses split points in the decision trees in a different way. Using a variety of randomly selected feature and data subsets, ETC builds numerous decision trees, and each tree casts a vote for the final classification outcome. Unlike Random Forest, ETC chooses split points at random, disregarding the ideal split point. [35]. ETC is faster than other decision tree-based models thanks to this method, which also makes it less prone to overfitting. By giving the minority class samples more weight during the training process, ETC is also better able to manage imbalanced datasets than other methods. Overall, ETC is a strong and effective classification method that may be applied to a variety of tasks, such as intrusion and anomaly detection. 3.5.5. Ensemble Approach An ensemble learner is a machine learning technique that combines multiple individual models to improve the accuracy and robustness of the overall prediction. The individual models can be of different types, using different algorithms or feature sets, and are trained independently on the same or different datasets. The ensemble learner then combines the predictions of the individual models using a voting or weighted average method to make the final prediction. Ensemble learners are often used in classification problems and can be categorized into two main types: bagging and boosting. Bagging involves training each model on a random subset of the training data, while boosting focuses on training each model on the examples that were previously misclassified by the ensemble. Ensemble learning has been shown to be highly effective in improving the performance of machine learning models, especially when the individual models have different biases or error patterns. IDSs have been demonstrated to perform better when using ensemble techniques, especially when spotting uncommon and unknown assaults. Also, they can increase the effectiveness of the detection process and lower the likelihood of false alarms. However, compared to single classifiers, ensemble approaches might be more computationally expensive and resource- intensive. As a result, the characteristics of the dataset and the resources at hand should be taken into consideration while choosing an ensemble approach.](https://image.slidesharecdn.com/15423cnc06-230906085940-3ffa041b/75/Intrusion-Detection-System-IDS-Development-Using-Tree-Based-Machine-Learning-Algorithms-9-2048.jpg)


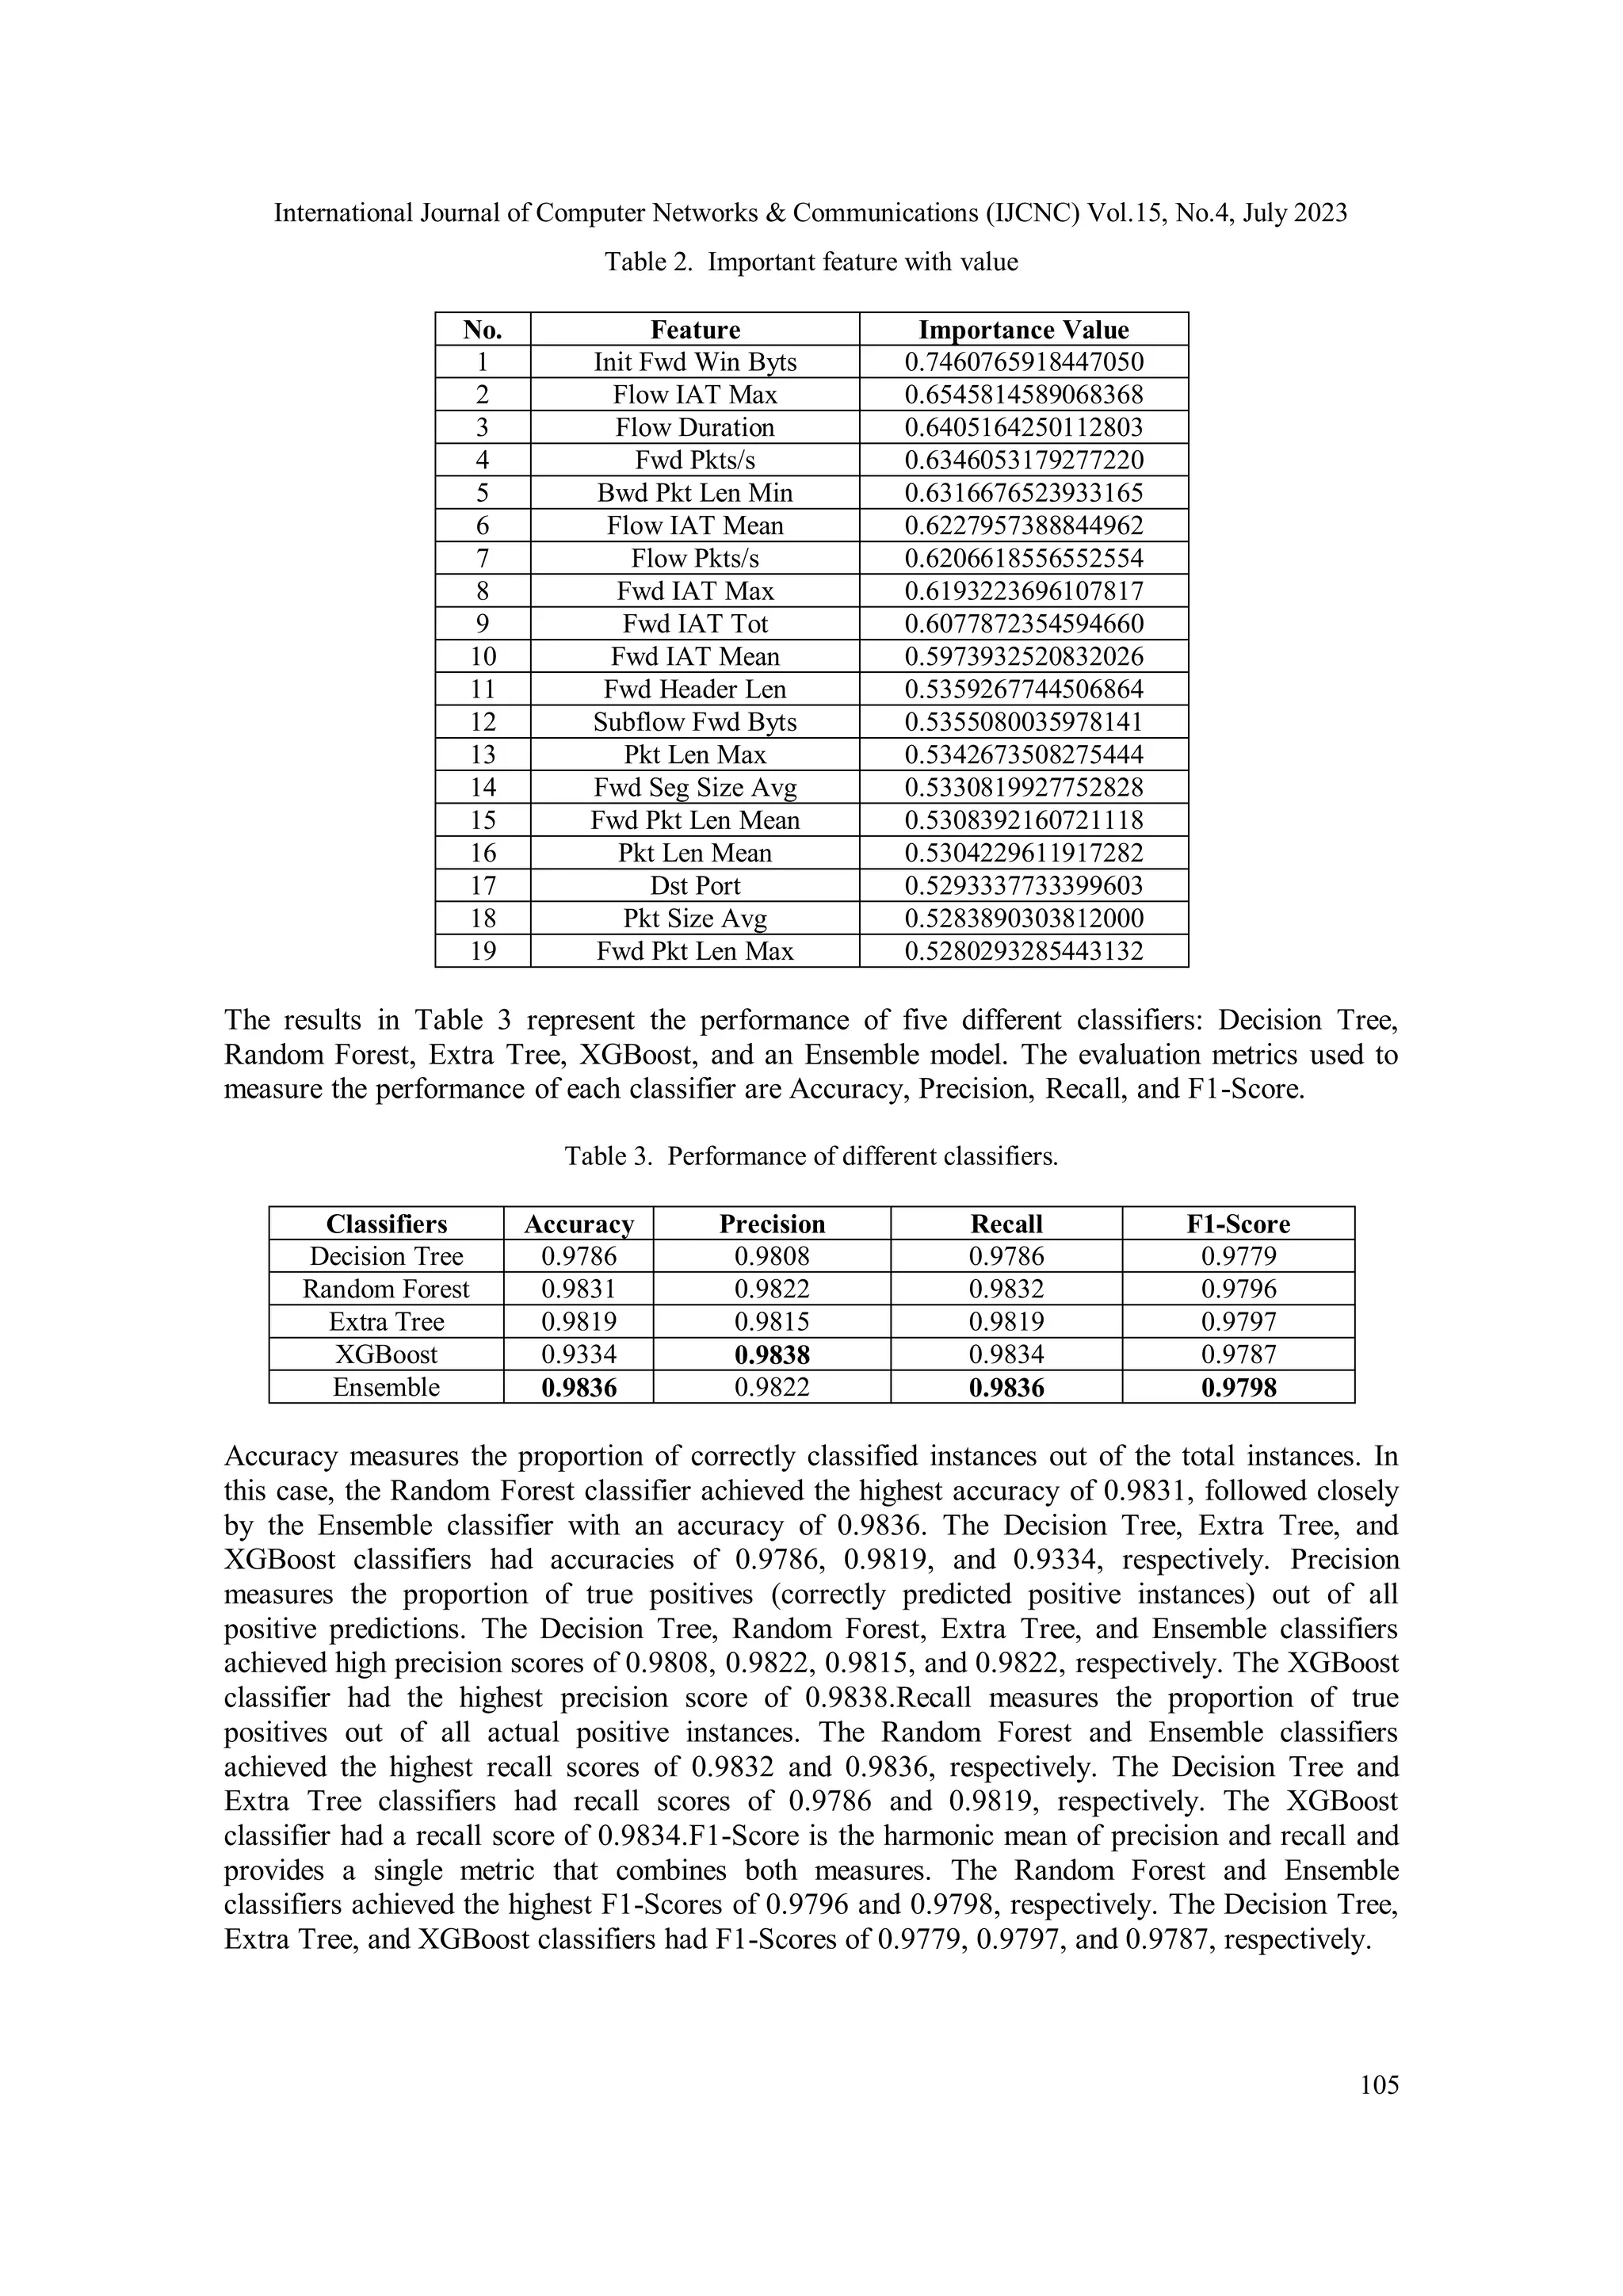

![International Journal of Computer Networks & Communications (IJCNC) Vol.15, No.4, July 2023 107 classification models. Despite this, the classifiers achieved high accuracy and F1-Scores, indicating their robustness to class imbalance. Furthermore, the study showed that feature selection played a crucial role in the performance of the classifiers. By selecting the most relevant features, the models achieved higher accuracy and F1-Scores while maintaining high precision and recall. This emphasizes the significance of feature engineering in machine learning and the possible benefits of selecting features properly to maximize model performance. In summary, this study demonstrated the performance of five classifiers on an imbalanced dataset with carefully selected features. The Random Forest and Ensemble classifiers performed the best in terms of accuracy and F1-Score, but the specific use case may require a classifier with higher precision or recall. Further analysis and experimentation may be needed to determine the best classifier for a particular application, but the results underscore the importance of feature selection and its potential to improve model performance. REFERENCES [1] D. Ravikumar, “Towards Enhancement of Machine Learning Techniques Using CSE-CIC-IDS2018 Cybersecurity Dataset.” [Online]. Available: https://scholarworks.rit.edu/theses [2] N. Hariyale, M. S. Rathore, R. Prasad, and P. Saurabh, A Hybrid Approach for Intrusion Detection System, vol. 1048. Springer US, 2020. doi: 10.1007/978-981-15-0035-0_31. [3] A. S. B. H. Ismail, A. H. Abdullah, K. B. A. Bak, M. A. Bin Ngadi, D. Dahlan, and W. Chimphlee, “A novel method for unsupervised anomaly detection using unlabelled data,” Proceedings - The International Conference on Computational Sciences and its Applications, ICCSA 2008, pp. 252–260, 2008, doi: 10.1109/ICCSA.2008.70. [4] P. Dokas, L. Ertoz, V. Kumar, A. Lazarevic, J. Srivastava, and P.-N. Tan, “Data mining for network intrusion detection,” National Science Foundation Workshop on Next Generation Data Mining, vol. 38, no. 7, pp. 21–30, 2002, [Online]. Available: http://scholar.google.com/scholar?hl=en&btnG=Search&q=intitle:Data+Mining+for+Network+Intrus ion+Detection%5Cnhttp://www.csee.umbc.edu/~kolari1/Mining/ngdm/dokas.pdf [5] T. N. Kim, T. N. Tri, L. T. Nguyen, and D. T. Truong, “A combination of the intrusion detection system and the open-source firewall using python language,” International Journal of Computer Networks and Communications, vol. 14, no. 1, pp. 59–69, Jan. 2022, doi: 10.5121/ijcnc.2022.14104. [6] M. Awad and A. Alabdallah, “Addressing imbalanced classes problem of intrusion detection system using weighted Extreme Learning Machine,” International Journal of Computer Networks and Communications, vol. 11, no. 5, pp. 39–58, 2019, doi: 10.5121/ijcnc.2019.11503. [7] T. T. Huynh and H. T. Nguyen, “on the performance of intrusion detection systems with hidden multilayer neural network using dsd training,” International Journal of Computer Networks and Communications, vol. 14, no. 1, pp. 117–137, Jan. 2022, doi: 10.5121/ijcnc.2022.14108. [8] S. H. Kang and K. J. Kim, “A feature selection approach to find optimal feature subsets for the network intrusion detection system,” Cluster Comput, vol. 19, no. 1, pp. 325–333, Mar. 2016, doi: 10.1007/s10586-015-0527-8. [9] A. A. Salih and A. M. Abdulazeez, “Evaluation of Classification Algorithms for Intrusion Detection System: A Review,” Journal of Soft Computing and Data Mining, vol. 02, no. 01, Apr. 2021, doi: 10.30880/jscdm.2021.02.01.004. [10] N. H. Son and H. T. Dung, “a lightweight method for detecting cyber attacks in high-traffic large networks based on clustering techniques,” International Journal of Computer Networks and Communications, vol. 15, no. 1, pp. 35–51, Jan. 2023, doi: 10.5121/ijcnc.2023.15103. [11] S. S. Dhaliwal, A. Al Nahid, and R. Abbas, “Effective intrusion detection system using XGBoost,” Information (Switzerland), vol. 9, no. 7, Jun. 2018, doi: 10.3390/info9070149.](https://image.slidesharecdn.com/15423cnc06-230906085940-3ffa041b/75/Intrusion-Detection-System-IDS-Development-Using-Tree-Based-Machine-Learning-Algorithms-15-2048.jpg)
![International Journal of Computer Networks & Communications (IJCNC) Vol.15, No.4, July 2023 108 [12] S. Singh Panwar, Y. P. Raiwani, and L. S. Panwar, “Evaluation of Network Intrusion Detection with Features Selection and Machine Learning Algorithms on CICIDS-2017 Dataset,” in SSRN Electronic Journal, 2019. doi: 10.2139/ssrn.3394103. [13] L. McClendon and N. Meghanathan, “Using Machine Learning Algorithms to Analyze Crime Data,” Machine Learning and Applications: An International Journal, vol. 2, no. 1, pp. 1–12, Mar. 2015, doi: 10.5121/mlaij.2015.2101. [14] A. Khan, “The State of the Art in Intrusion Prevention and Detection,” The State of the Art in Intrusion Prevention and Detection, 2014, doi: 10.1201/b16390. [15] A. Shafee, M. Baza, D. A. Talbert, M. M. Fouda, M. Nabil, and M. Mahmoud, “Mimic Learning to Generate a Shareable Network Intrusion Detection Model; Mimic Learning to Generate a Shareable Network Intrusion Detection Model,” 2020. [16] J. L. Leevy, J. Hancock, R. Zuech, and T. M. Khoshgoftaar, “Detecting cybersecurity attacks across different network features and learners,” J Big Data, vol. 8, no. 1, Dec. 2021, doi: 10.1186/s40537- 021-00426-w. [17] F. Colas and P. Brazdil, “Comparison of SVM and some older classification algorithms in text classification tasks,” IFIP International Federation for Information Processing, vol. 217, pp. 169–178, 2006, doi: 10.1007/978-0-387-34747-9_18. [18] H. Li, H. Jiang, D. Wang, and B. Han, “An improved KNN algorithm for text classification,” in Proceedings - 8th International Conference on Instrumentation and Measurement, Computer, Communication and Control, IMCCC 2018, Institute of Electrical and Electronics Engineers Inc., Jul. 2018, pp. 1081–1085. doi: 10.1109/IMCCC.2018.00225. [19] O. E. Elejla, B. Belaton, M. Anbar, B. Alabsi, and A. K. Al-Ani, “Comparison of classification algorithms on ICMPv6-based DDoS attacks detection,” in Lecture Notes in Electrical Engineering, Springer Verlag, 2019, pp. 347–357. doi: 10.1007/978-981-13-2622-6_34. [20] M. Bahrololum, E. Salahi, and M. Khaleghi, “Anomaly intrusion detection design using hybrid of unsupervised and supervised neural network,” 2009. [21] S. Chimphlee and W. Chimphlee, “Machine learning to improve the performance of anomaly-based network intrusion detection in big data,” Indonesian Journal of Electrical Engineering and Computer Science, vol. 30, no. 2, pp. 1106–1119, May 2023, doi: 10.11591/ijeecs.v30.i2.pp1106-1119. [22] “CSE-CIC-IDS2018 dataset,” 2018. https://www.unb.ca/cic/datasets/ids-2018.html [23] J. L. Leevy and T. M. Khoshgoftaar, “A survey and analysis of intrusion detection models based on CSE-CIC-IDS2018 Big Data,” J Big Data, vol. 7, no. 1, Dec. 2020, doi: 10.1186/s40537-020-00382- x. [24] Q. Zhou and D. Pezaros, “Evaluation of Machine Learning Classifiers for Zero-Day Intrusion Detection -- An Analysis on CIC-AWS-2018 dataset,” 2019, [Online]. Available: http://arxiv.org/abs/1905.03685 [25] D. V. Jeyanthi and B. Indrani, “An efficient intrusion detection system with custom features using fpa-gradient boost machine learning algorithm,” International Journal of Computer Networks and Communications, vol. 14, no. 1, pp. 99–115, Jan. 2022, doi: 10.5121/ijcnc.2022.14107. [26] H. Motoda and H. Liu, “Feature selection, extraction and construction,” Communication of IICM, vol. 5, pp. 67–72, 2002. [27] S. Khalid, T. Khalil, and S. Nasreen, “A survey of feature selection and feature extraction techniques in machine learning,” 2014. doi: 10.1109/SAI.2014.6918213. [28] A. Agarwal, P. Sharma, M. Alshehri, A. A. Mohamed, and O. Alfarraj, “Classification model for accuracy and intrusion detection using machine learning approach,” PeerJ Comput Sci, vol. 7, pp. 1– 22, 2021, doi: 10.7717/PEERJ-CS.437. [29] J. L. Leevy and T. M. Khoshgoftaar, “A survey and analysis of intrusion detection models based on CSE-CIC-IDS2018 Big Data,” J Big Data, vol. 7, no. 1, Dec. 2020, doi: 10.1186/s40537-020-00382- x. [30] N. V. Chawla, K. W. Bowyer, L. O. Hall, and W. P. Kegelmeyer, “SMOTE: Synthetic minority over- sampling technique,” Journal of Artificial Intelligence Research, vol. 16, no. 1, pp. 321–357, 2002, doi: 10.1613/jair.953.](https://image.slidesharecdn.com/15423cnc06-230906085940-3ffa041b/75/Intrusion-Detection-System-IDS-Development-Using-Tree-Based-Machine-Learning-Algorithms-16-2048.jpg)
![International Journal of Computer Networks & Communications (IJCNC) Vol.15, No.4, July 2023 109 [31] R. A. A. Viadinugroho, “Imbalanced Classification in Python: SMOTE-ENN Method,” Toward Data Science, Apr. 18, 2021. https://towardsdatascience.com/imbalanced-classification-in-python-smote- enn-method-db5db06b8d50 (accessed May 18, 2022). [32] N. Japkowicz, “Learning from imbalanced data sets: a comparison of various strategies,” 2000. [Online]. Available: www.aaai.org [33] L. Mohan, S. Jain, P. Suyal, and A. Kumar, “Data mining Classification Techniques for Intrusion Detection System,” Proceedings - 2020 12th International Conference on Computational Intelligence and Communication Networks, CICN 2020, pp. 351–355, 2020, doi: 10.1109/CICN49253.2020.9242642. [34] A. Gouveia and M. Correia, “Network Intrusion Detection with XGBoost.” [Online]. Available: https://www.kdd.org/kdd-cup/view/kdd-cup-1999 [35] A. Ammar, “A Decision Tree Classifier for Intrusion Detection Priority Tagging,” Journal of Computer and Communications, vol. 03, no. 04, pp. 52–58, 2015, doi: 10.4236/jcc.2015.34006. AUTHORS Witcha Chimphlee his PhD in Computer Science from the University Technology of Malaysia. Currently, he holds the position of Assistant Professor in the Data Science and Analytics department at Suan Dusit University in Thailand. His current research interests include Machine learning, computer networks and security, data science, and big data analytics. He has published several papers in peer-reviewed journals and has actively participated in various international conferences. He is a dedicated researcher with a passion for advancing the field of computer science through his work Siriporn Chimphlee, holds a PhD in Computer Science from the University Technology of Malaysia and is currently an Assistant Professor in the Data Science and Analytics department at Suan Dusit University in Thailand. Her research interests include data mining, intrusion detection, web mining, and information technology. She has published several papers in reputed journals and has actively participated in international conferences. She is passionate about exploring new avenues in computer science and constantly strives to contribute to the field through her research.](https://image.slidesharecdn.com/15423cnc06-230906085940-3ffa041b/75/Intrusion-Detection-System-IDS-Development-Using-Tree-Based-Machine-Learning-Algorithms-17-2048.jpg)