Downloaded 66 times


![Creating a vector Before creating an array or a matrix let us create what is simpler than a matrix which is a vector. The vector is the building block of arrays and matrices. A vector is just a single row or column from a matrix. A vector is created by using two square brackets []. Elements within the square brackets will be separated by spaces, commas, or semicolons. Spaces and commas just separate the elements but they still within the same row. Semicolons make elements before and after it in subsequent rows. So to create a row vector, just separate the elements using spaces or commas. To create a column vector use semicolons. Examples: Create a row vector: [1,2,3,4,5] or [1,2 3 4, 5] Create a column vector: [1;2;3;4;5] View the created array in the Array Editor window. A common function to create a linearly spaced vector of subsequent values is linspace. Function declaration: linspace(x1, x2, n) It returns a vector of n elements starting from x1 and not exceeding x2. The function is linear and linear means that data can be represented by a line and lines change by a fixed amount. So to reach x2 from x1 the line will change by a fixed amount. To understand this function you should know the following: 1. What is linear? 2. How to find the amount of change to reach x2 from x1? Example to understand what is linear: The sequence 1, 3, 5, 7, 9 is a linear sequence because change occurs by a fixed amount as each time 2 is added. The proof that this sequence is linear is that we can graph it as a line. But this sequence 1, 3, 5, 10, 12, 15 is non-linear because change occurs by a non-fixed amount. Sometimes change occurs by 2 and another by 5 and another by 3. The proof that this sequence is non-linear is that we can`t graph it as a line but as a polyline.](https://image.slidesharecdn.com/introductiontomatriceslabolatorymatlabaspartofdigitalsignalprocessingcourse-170519211238/75/Introduction-to-MATrices-LABoratory-MATLAB-as-Part-of-Digital-Signal-Processing-Course-28-2048.jpg)
![Example to understand how to find the amount of change to reach x2 from x1: If you need to return 5 numbers in the range from 0 to 20 it is required to divide the range between 0 and 20 into 5 parts. Remember that the function is linear and linear means that change happens by a fixed amount. So the amount of change from the first number to the second one will be equal to the amount between second and third numbers and so on. The rule to find spacing between elements or the amount of change is: (x2-x1)/(n-1) It is (n-1) not n because we need number of parts returned and not number of numbers. 1---2---3---4---5 Here number of parts is 4 but number of numbers if 5. More explanation: If you need to return 5 numbers in the range 0:20 then you should think that to return the 5 numbers you need to divide the range into a number of parts. The number of parts to return is always less than the number of numbers by 1. So to return 5 numbers you divide the range into 4 parts. Plotting sine wave: arr = linspace(0, 20, 200); result = sin(arr); plot(arr, result); Indexing a vector MATLAB indexing starts from 1 not 0. A vector is indexed using the parentheses (). Indexing can return: 1. Single value 2. Multiple values Single Value Indexing That is to specify the exact location of a single element to return. That is to specify the element location in the row or column vector. Example: v = [1 2 3 4]; v(2); Multiple Values Indexing Rather than specifying the index of a single element, a range of indices is to be specified.](https://image.slidesharecdn.com/introductiontomatriceslabolatorymatlabaspartofdigitalsignalprocessingcourse-170519211238/75/Introduction-to-MATrices-LABoratory-MATLAB-as-Part-of-Digital-Signal-Processing-Course-29-2048.jpg)
![To specify a range of indices, use the colon operator of this form start:change:last. Where start is the starting index, last is the last index and change is the change that happens to start to reach last. Assume that you need to return the vector elements from the first element to the third element. So the start index is 1, amount of change to make each time is 1 and finally thr last index to return is 3. So the format used is v(1:1:3). But v(1:3) also returns the same results as v(1:1:3). This indicates that change is by default equal to 1. Assume that you need to return elements starting from the second element to the fifth one: v(2:1:5) or v(2:5). What to do to return the even indexed elements in the vector? That is to start at index 2 and then return indices 4, 6, 8 and so on. The idea is to make the change equal to 2 each time. V(2:2:8). How to return the odd indexed elements? v(1:2:7) What about v(3:1)? This is invalid line and has logical error because it is impossible to reach the last index. The change that occur to the first index (3) will not make it reach the last index (1) because 3 is incremented by 1 each time and thus can`t reach the index 1. Creating a matrix A matrix is a collection of vectors concatenated to each other. To create a matrix in MATLAB, use semicolons to separate vectors in different rows. Example: mat = [1 2 3;4 5 6;7 8 9]; Indexing a matrix A vectors was just has a single dimension (row or column) and thus a single index is expected to return a value from a vector. But a matrix contains two dimensions (row and column) so it needs two indices to return a single value. One index for row and another for column. Single Value Indexing Example: mat(1,3) this returns the matrix element at row 1 and column 3.](https://image.slidesharecdn.com/introductiontomatriceslabolatorymatlabaspartofdigitalsignalprocessingcourse-170519211238/75/Introduction-to-MATrices-LABoratory-MATLAB-as-Part-of-Digital-Signal-Processing-Course-30-2048.jpg)
![x = [1 2 3 4]; y = x + 2; figure plot(x,y) Relationship between plot and figure It is not required to enter the figure command. By default when the plot command get executed it opens a new figure if no existing figure is actually opened. When just a single plot is to be created the figure command can be ignored. But ignoring the figure command when multiple plots are to be created may lead sometimes to problems. Multiple plots commands but ignoring the figure command For example: Suppose that there are two functions to draw. If the figure command was ignored then when entering the first plot command a new figure will be opened and the plot will appear on it. When the second plot command gets entered it will replace the plot on the active figure. x = [1 2 3 4]; y1 = x + 2; y2 = x + 10; plot(x,y1) plot(x,y2) The solution is to open a new figure for each new plot. x = [1 2 3 4]; y1 = x + 2; y2 = x + 10; figure plot(x,y1) figure plot(x,y2) For the first plot, it will search for an existing figure and it will find the figure that was just created using the figure command. For the second plot, it will search for an existing figure to use. It will find two figures that were created by the two figure commands. Which one it will be used? The answer is that the latest active figure is the one to be used.](https://image.slidesharecdn.com/introductiontomatriceslabolatorymatlabaspartofdigitalsignalprocessingcourse-170519211238/75/Introduction-to-MATrices-LABoratory-MATLAB-as-Part-of-Digital-Signal-Processing-Course-33-2048.jpg)
![Later you will know how to select a specific figure to plot on. Multiple plots on the same figure Opening a new figure for each new plot may create a large number of figures. One figure may hold multiple plots. This can occur in three ways: Using the plot command: single figure, multiple plot Using the hold on and hold off commands: single figure, multiple plot Using subplot: single figure, multiple plot Using the plot command: single figure, multiple plot Another version of the plot function may accepts multiple x and multiple y plot(x1, y1, x2, y2, x3, y3, …) For example: x = [1 2 3 4]; y1 = x + 2; y2 = x + 10; plot(x,y1, x,y2) The advantage of this option is that it differentiates among the different functions plotted by giving each one a different color. Using the hold on and hold off commands: single figure, multiple plot The second way is to use the hold on and hold off commands. These commands are used if you are creating a single plot but this plot is created using multiple plot commands. If there are multiple plots created on one figure the last plot will override all the previous plots. But when entering the hold on command MATLAB knows that the subsequent plots will be drawn on the same figure. So hold on tells MATLAB to continue drawing on the same figure. x = [1 2 3 4]; y1 = x + 2; y2 = x + 10; figure plot(x,y1) hold on plot(x,y2)](https://image.slidesharecdn.com/introductiontomatriceslabolatorymatlabaspartofdigitalsignalprocessingcourse-170519211238/75/Introduction-to-MATrices-LABoratory-MATLAB-as-Part-of-Digital-Signal-Processing-Course-34-2048.jpg)
![This option assumes that you create a single plot and continue creating the plot. So for the different plots created MATLAB does not differentiate among them and not give each plot a different color. All plots will appear with the same color as if they were of the same plot. But if you are to create 3 plots and want 2 of them to appear on the same figure and another one to appear on another figure then you can make the first plot, use the hold on command that tells MATLAB to continue drawing on the same figure and enter the second plot. Then to tell MATLAB not to use that figure to draw next plots on it use the hold off command. The hold off command tells MATLAB to open a new figure to draw. Explain why the plot(x,x) overrides the previous plot: x = [1 2 3 4]; y1 = x + 2; y2 = x + 10; figure plot(x,y1) hold on plot(x,y2) hold off plot(x,x) Using subplot: single figure, multiple plot It is possible to divide the figure into multiple cells and make plots in these cells. For example: x = [1 2 3 4]; y1 = x + 2; y2 = x + 10; figure subplot(1,2,1) plot(x, y1) subplot(1,2,2) plot(x, y2) Graph Axis Limits What limits are used by MATLAB for axis?](https://image.slidesharecdn.com/introductiontomatriceslabolatorymatlabaspartofdigitalsignalprocessingcourse-170519211238/75/Introduction-to-MATrices-LABoratory-MATLAB-as-Part-of-Digital-Signal-Processing-Course-35-2048.jpg)
![MATLAB automatically selects the axis limits from the data. Example: x = [1 4 8 10 13]; y = x + 3; plot(x,y) MATLAB knows that x-axis starts from 1 to 13 so it will set the limits of the x-axis to 1 and 13. It also knows that the minimum y-value will be 4 and the maximum is 16 so it will set the y-axis limits to 4 and 16. MATLAB uses the axis command to change the axis limits. It has the following form: axis([xmin, xmax, ymin, ymax]) To allow MATLAB to automatically chooses the minimum limits use –inf and for maximum limits to inf. xlim([xmin, xmax]) and ylim([ymin, ymax]) produces the same results as axis([xmin, xmax, ymin, ymax]) Other Useful Functions: disp fprintf input pause waitforbuttonpress exit quit clf](https://image.slidesharecdn.com/introductiontomatriceslabolatorymatlabaspartofdigitalsignalprocessingcourse-170519211238/75/Introduction-to-MATrices-LABoratory-MATLAB-as-Part-of-Digital-Signal-Processing-Course-36-2048.jpg)

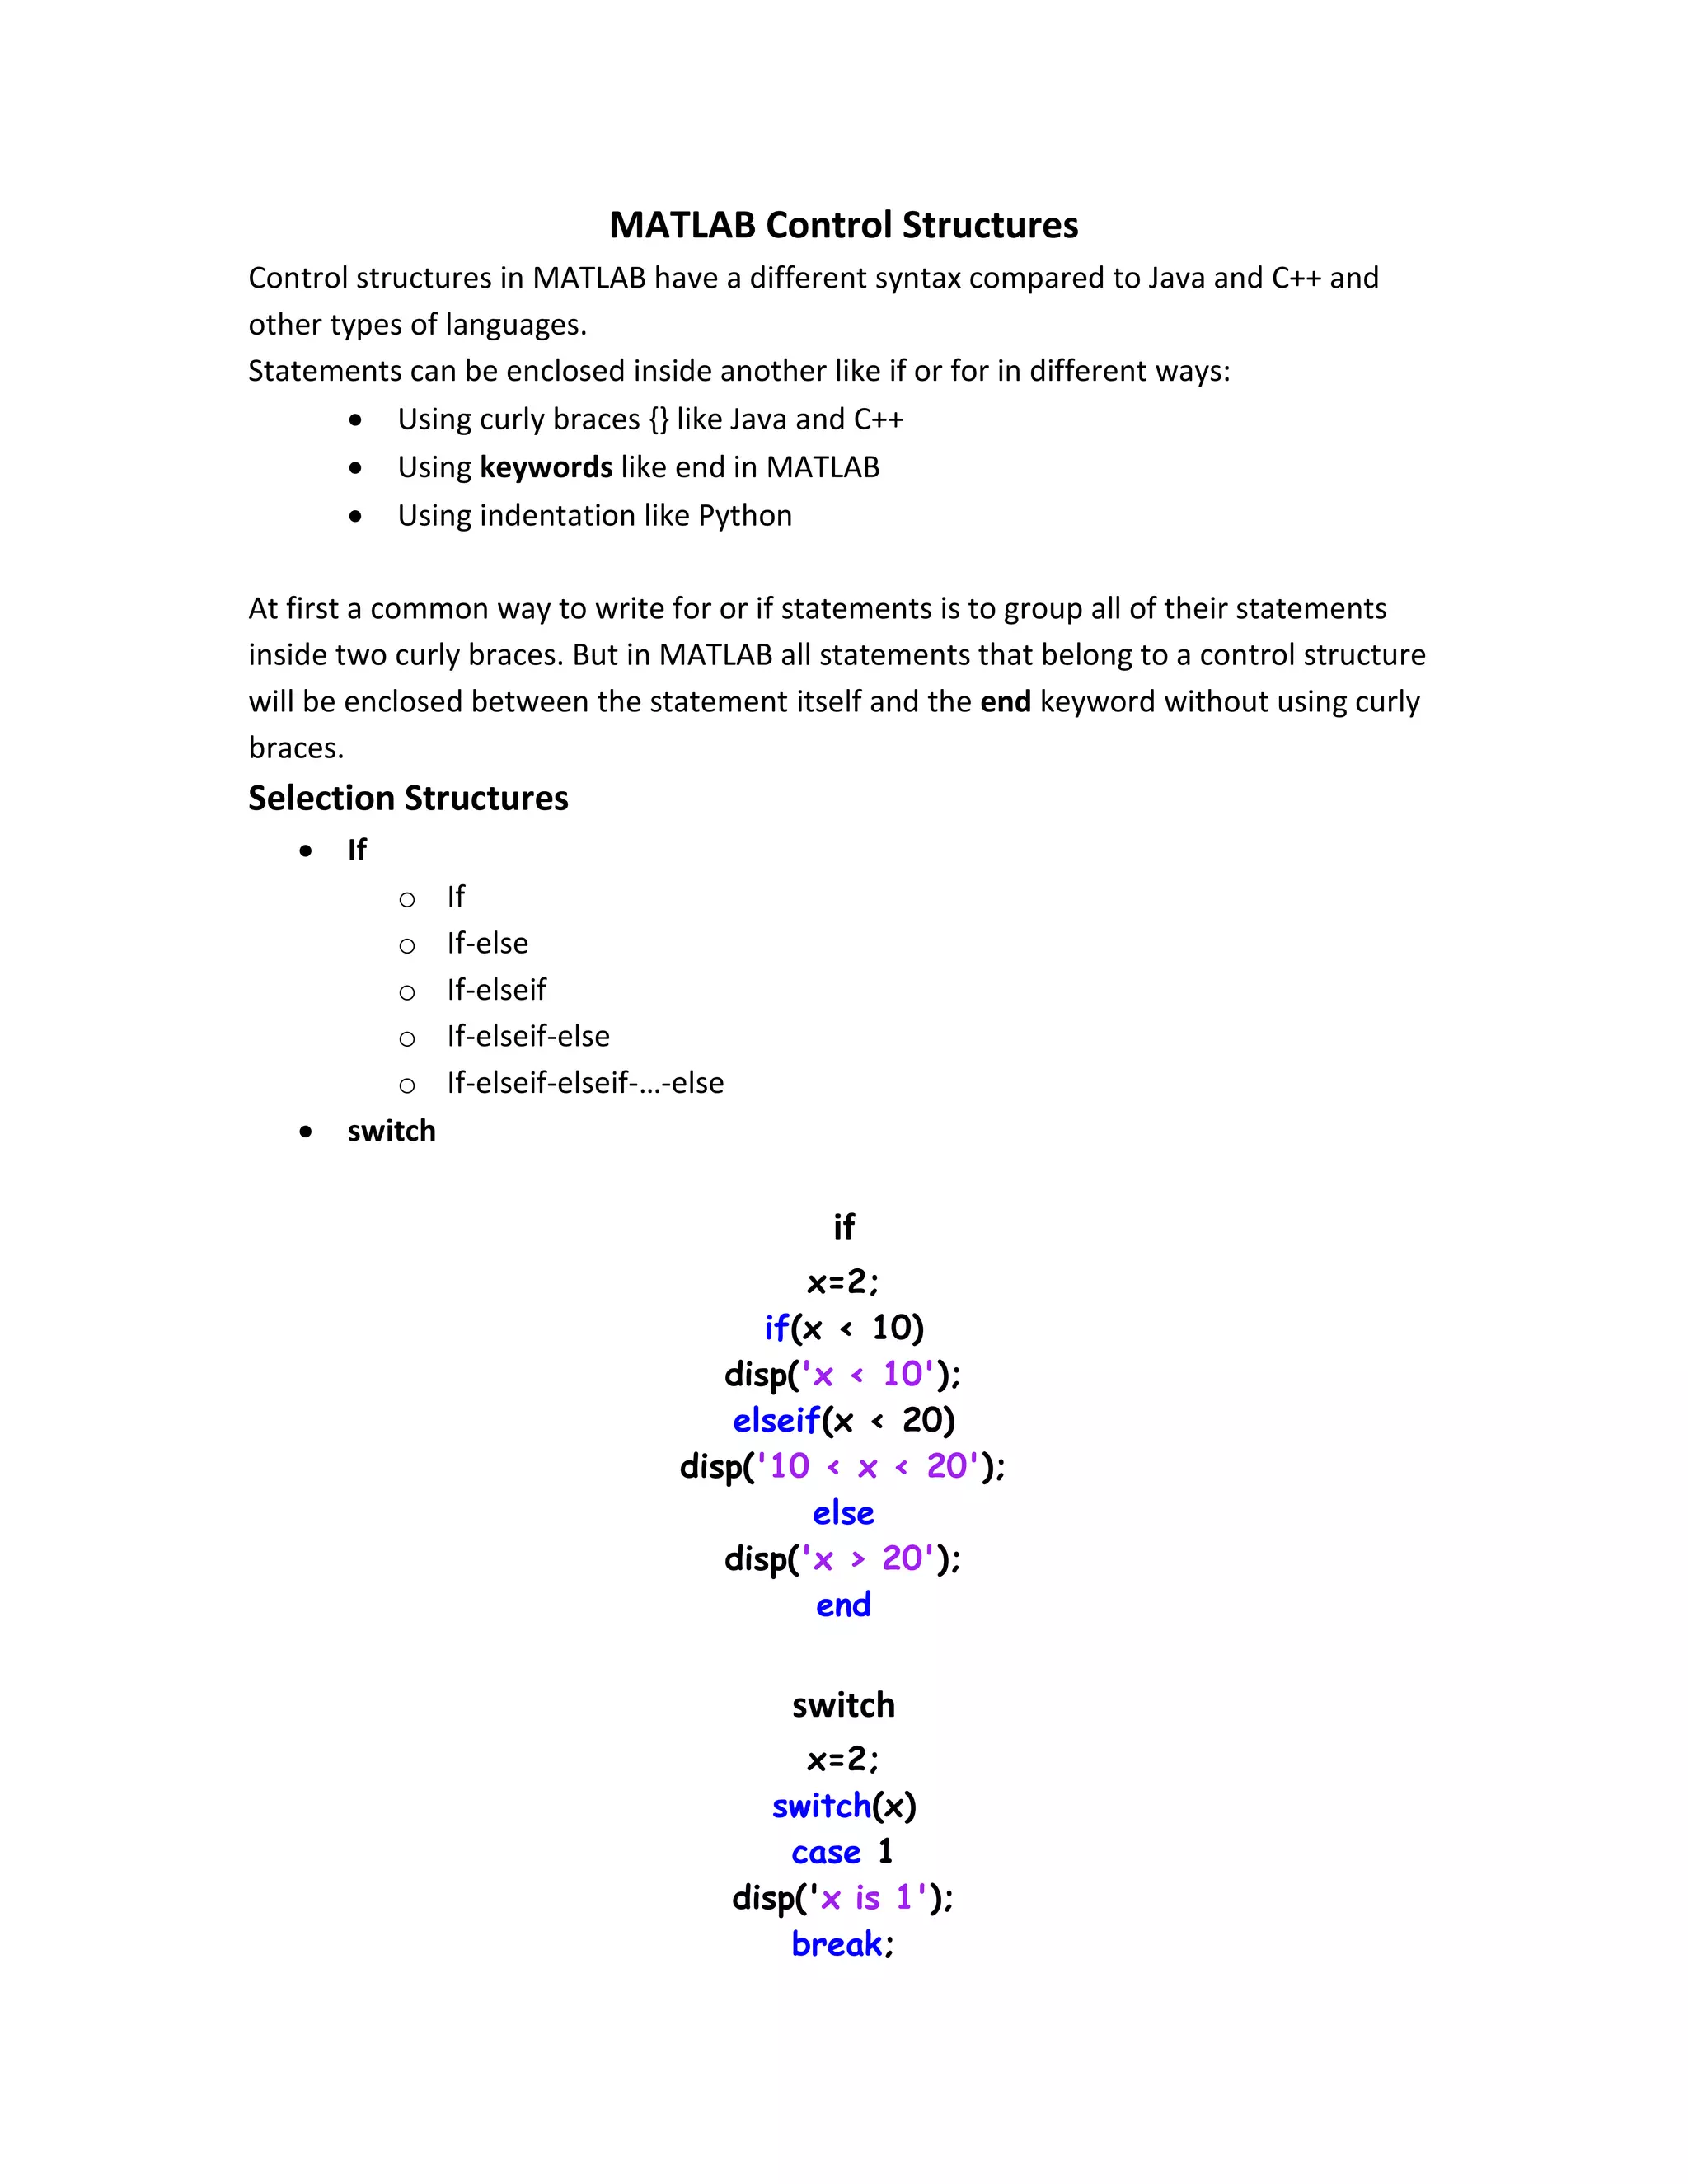
This document provides an introduction and overview of MATLAB as part of a digital signal processing course. It discusses MATLAB installation, packages, versions, and what MATLAB is. It also covers the MATLAB desktop interface including the command window, command history, workspace, and current folder windows. Finally, it outlines the MATLAB syllabus which will cover topics like MATLAB variables, data types, matrices, control structures, figures/plots, and scripting.