Download as PDF, PPTX

![Telegraf ● Understand Telegraf output: $ telegraf --config telegraf.conf --input-filter cpu --test [measurement],[tag1,tag2] [field1,field2,field3] [timestamp] system,host=tux,env=prod load1=1.25,load5=1.27,load15=1.29 1509997632000000000](https://image.slidesharecdn.com/introduction-to-influxdb-and-tick-stack-171108225610/75/Introduction-to-InfluxDB-and-TICK-Stack-11-2048.jpg)

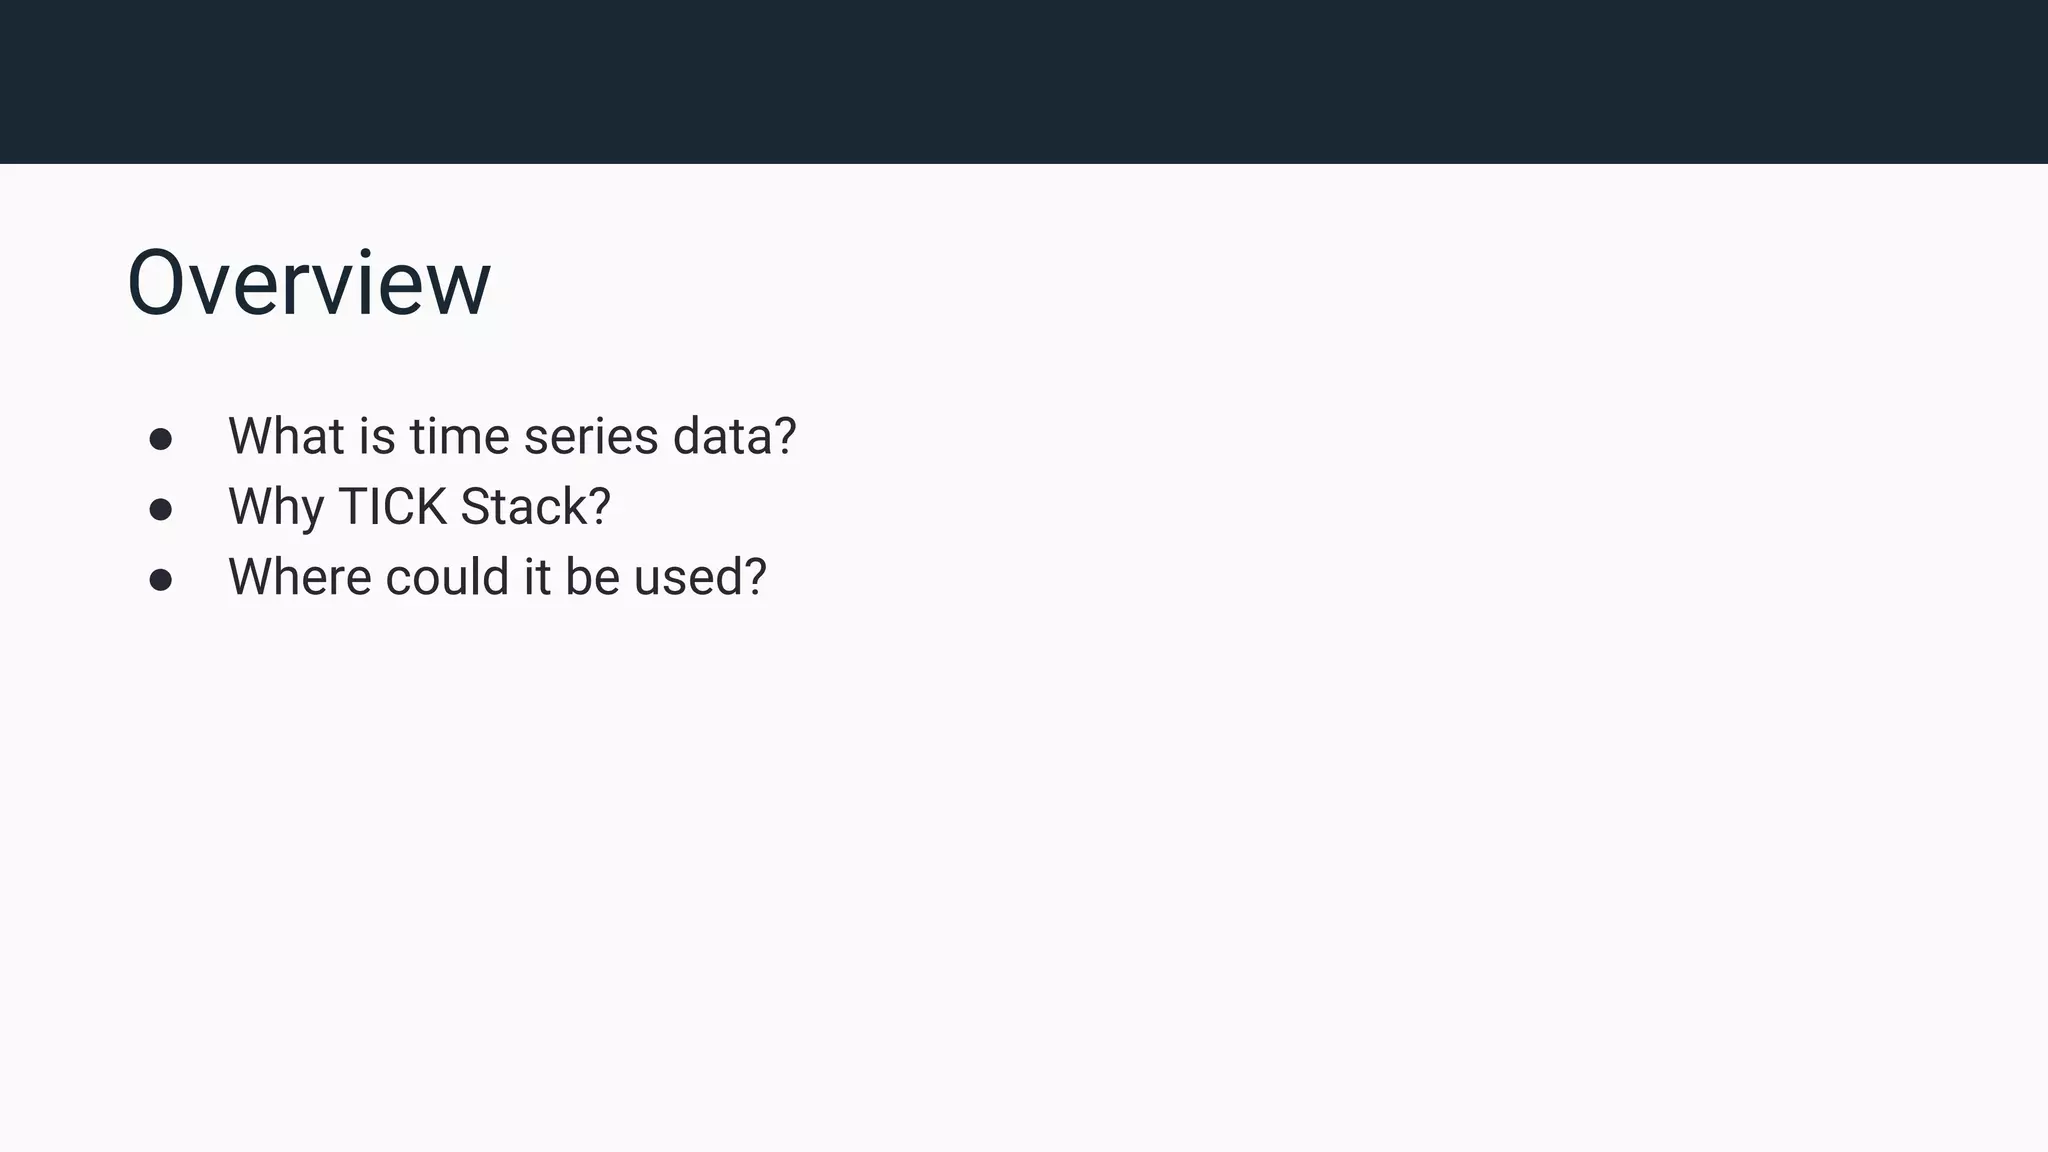
The document provides an introduction to InfluxDB and the TICK stack (Telegraf, InfluxDB, Chronograf, Kapacitor), which is designed for managing and analyzing time series data. It outlines the characteristics of time series data and the functions of each component in the stack, emphasizing their capabilities in data collection, storage, visualization, and processing. Additionally, it highlights potential use cases such as infrastructure monitoring and anomaly detection.
Introduction to InfluxDB and TICK Stack; speaker Ahmed AbouZaid; SaaS CDP for managing customer data.
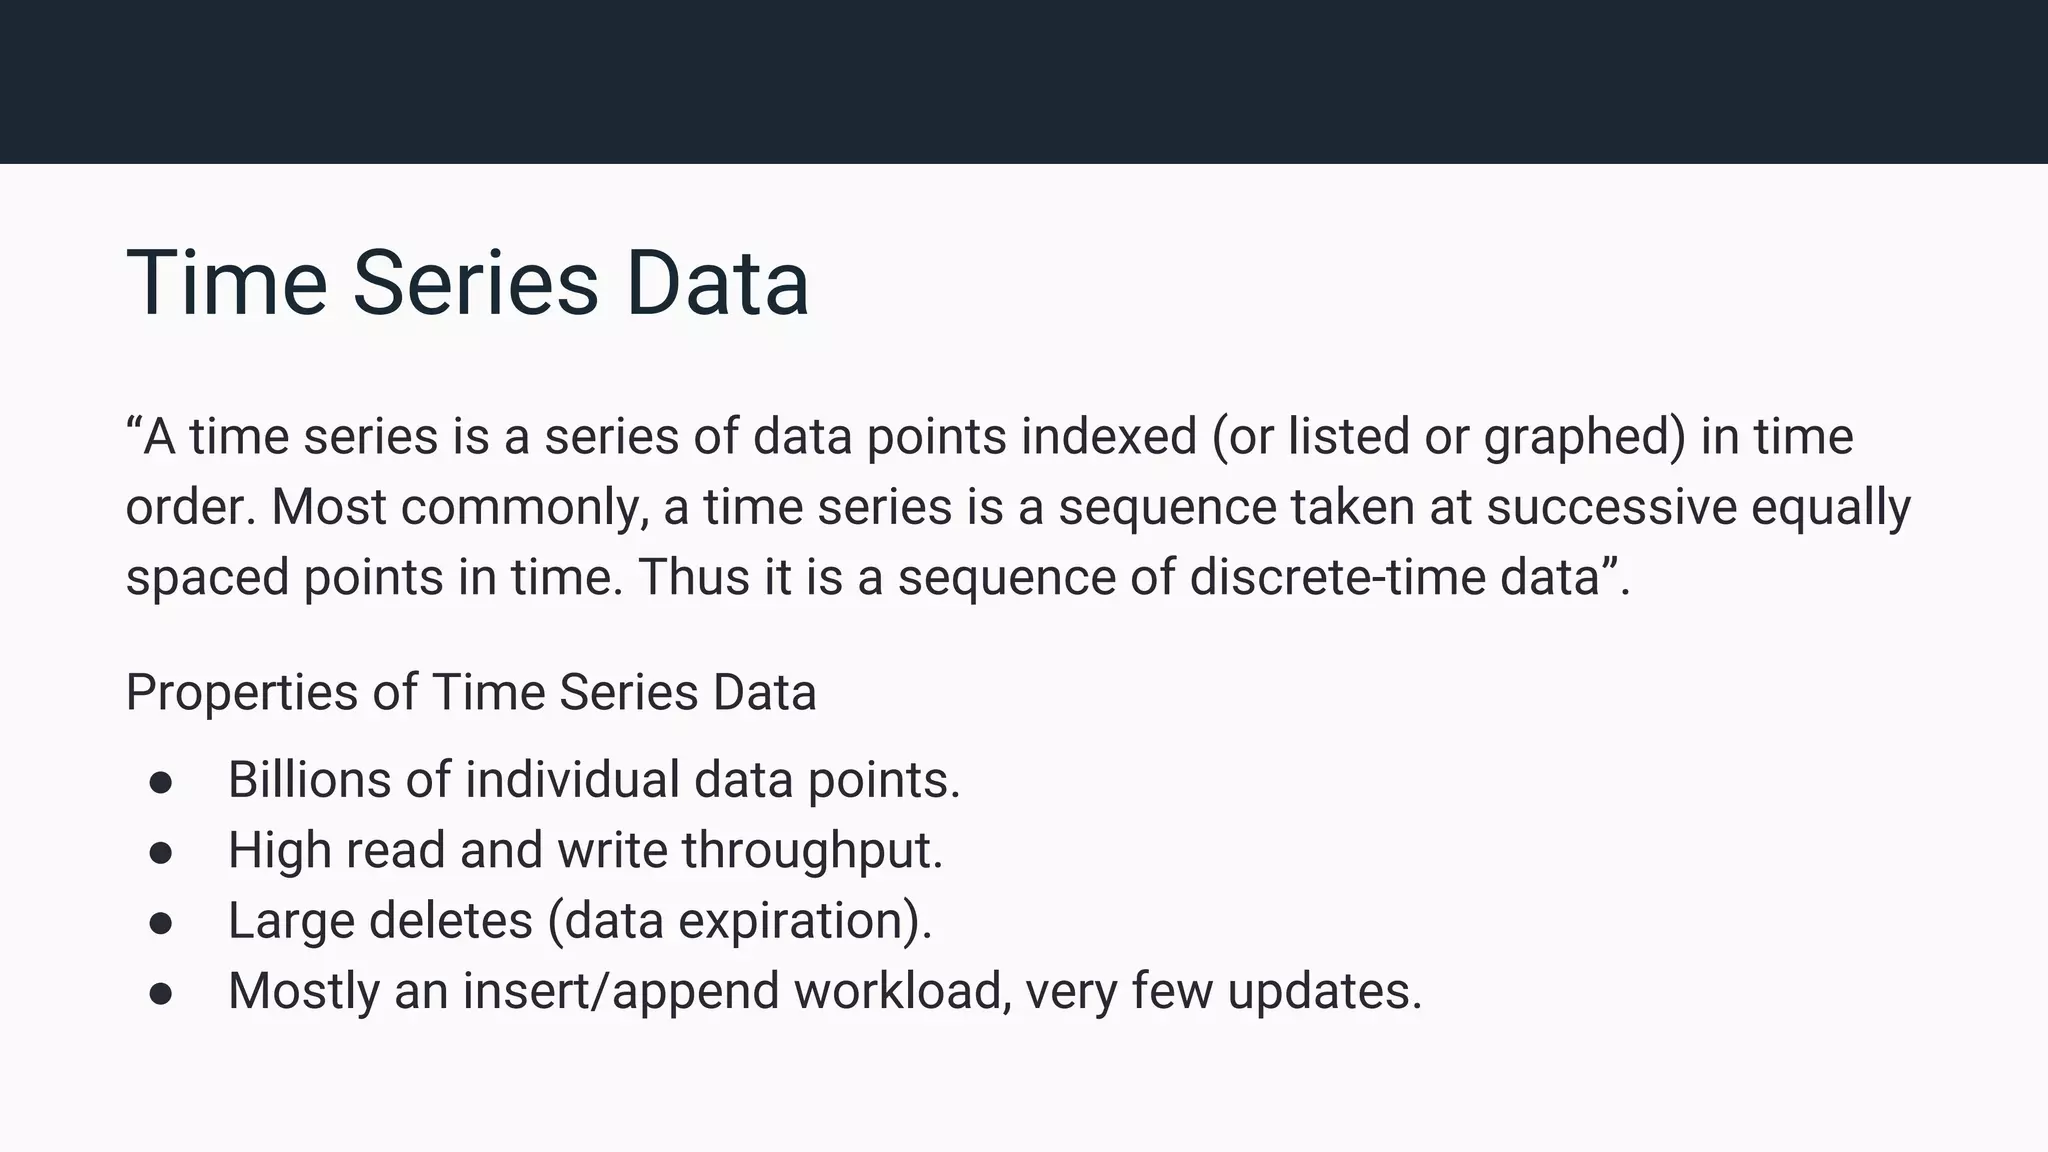
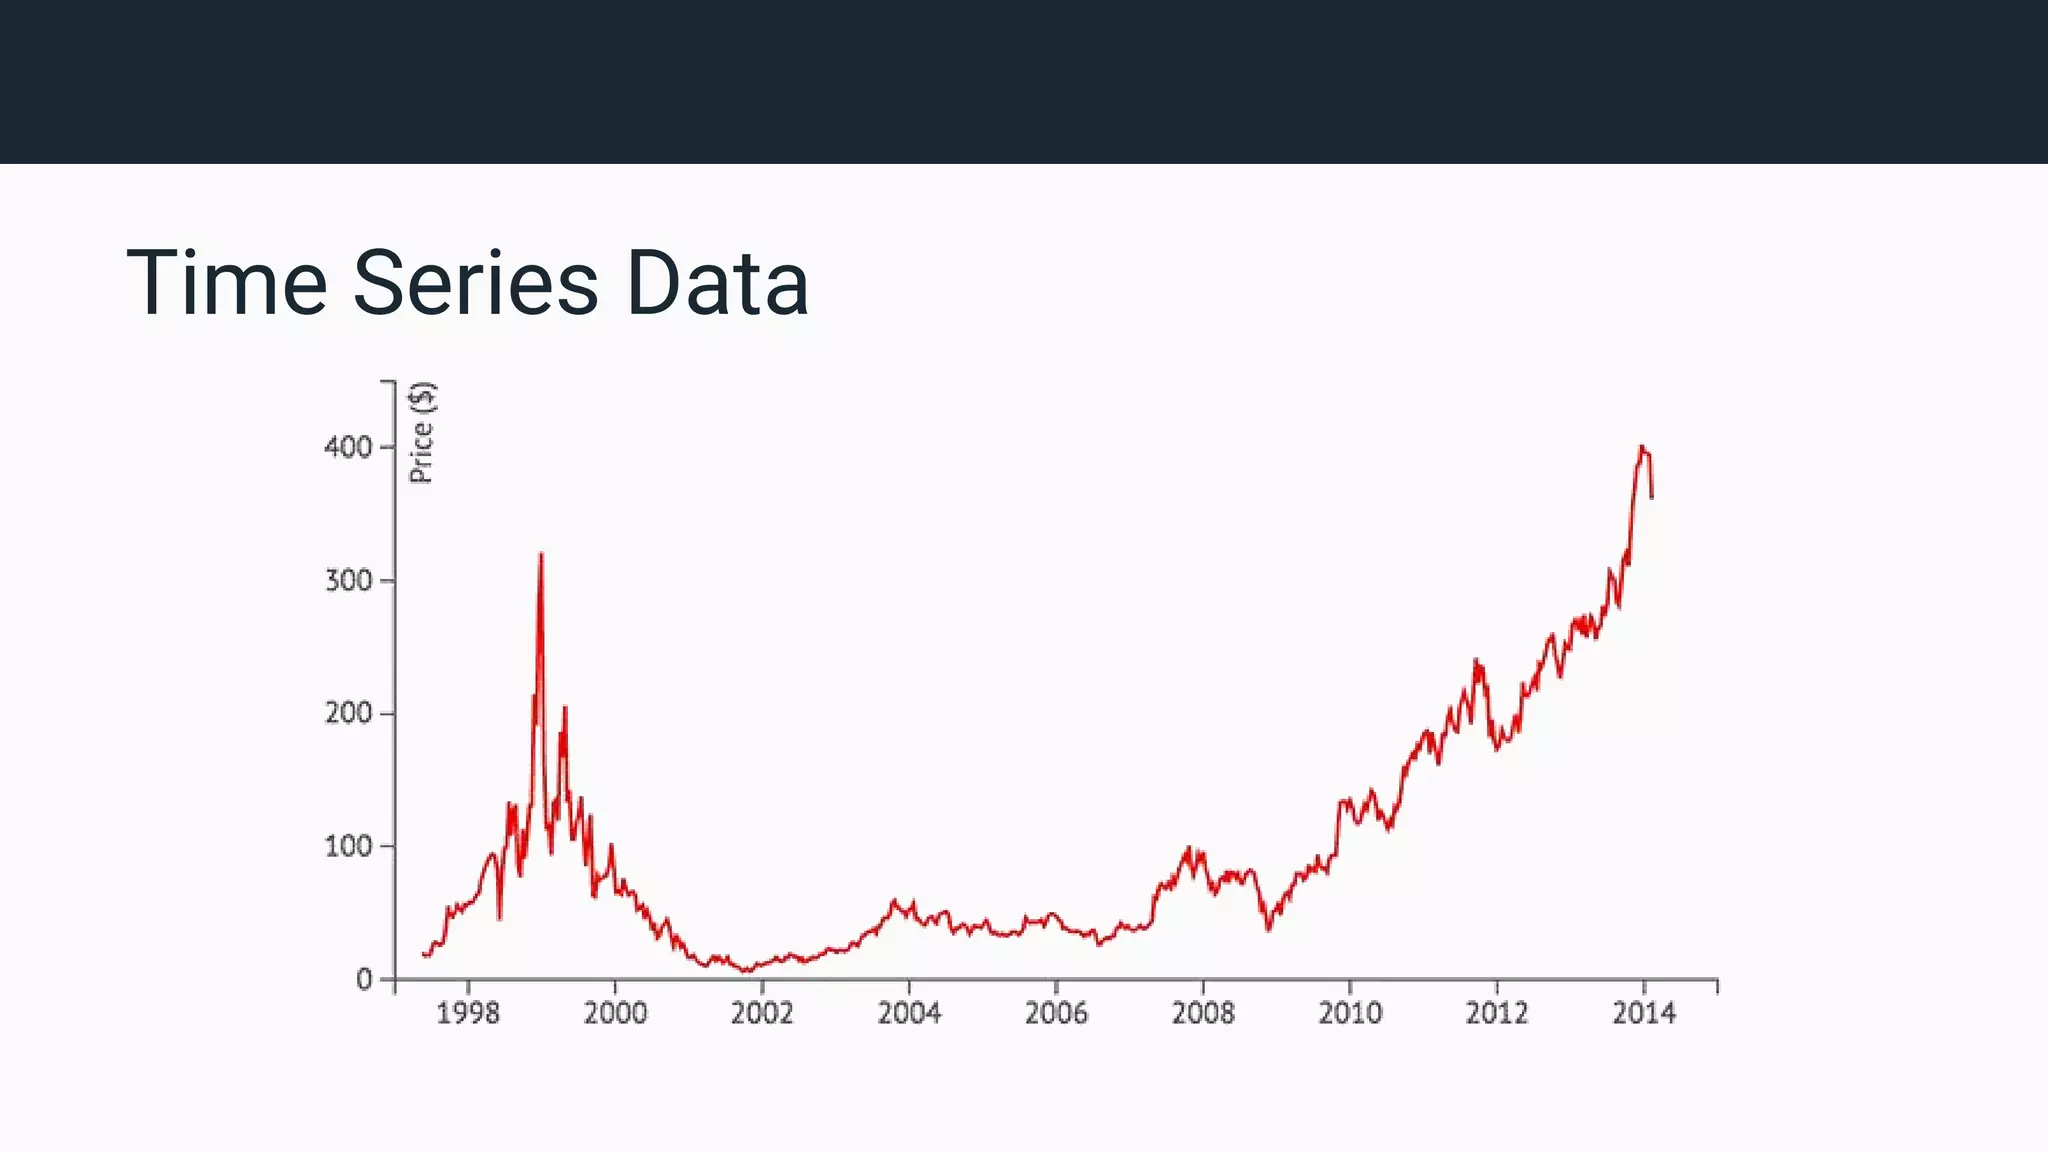
Explains time series data, its properties including high read/write throughput, data points, and workload types.
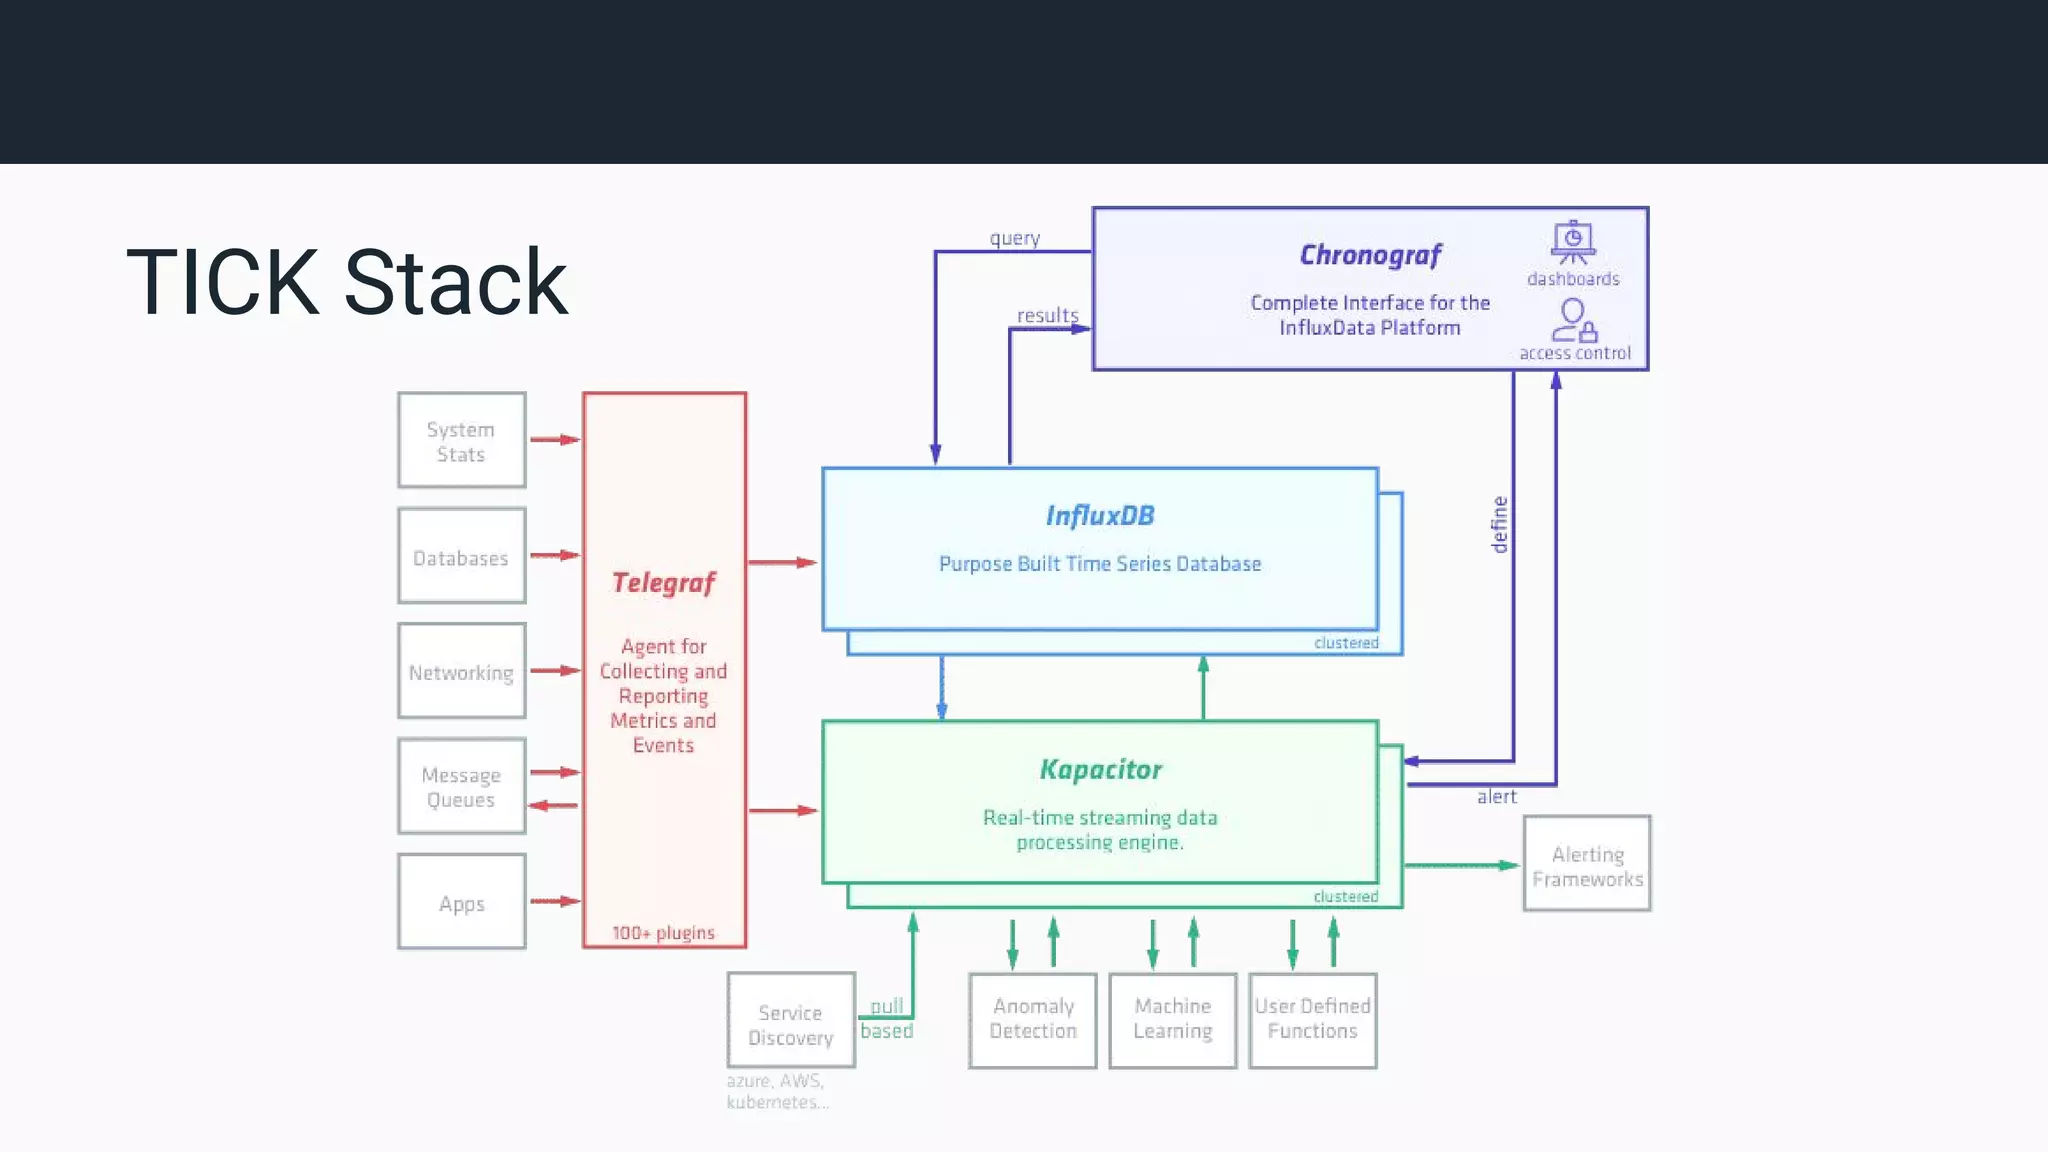
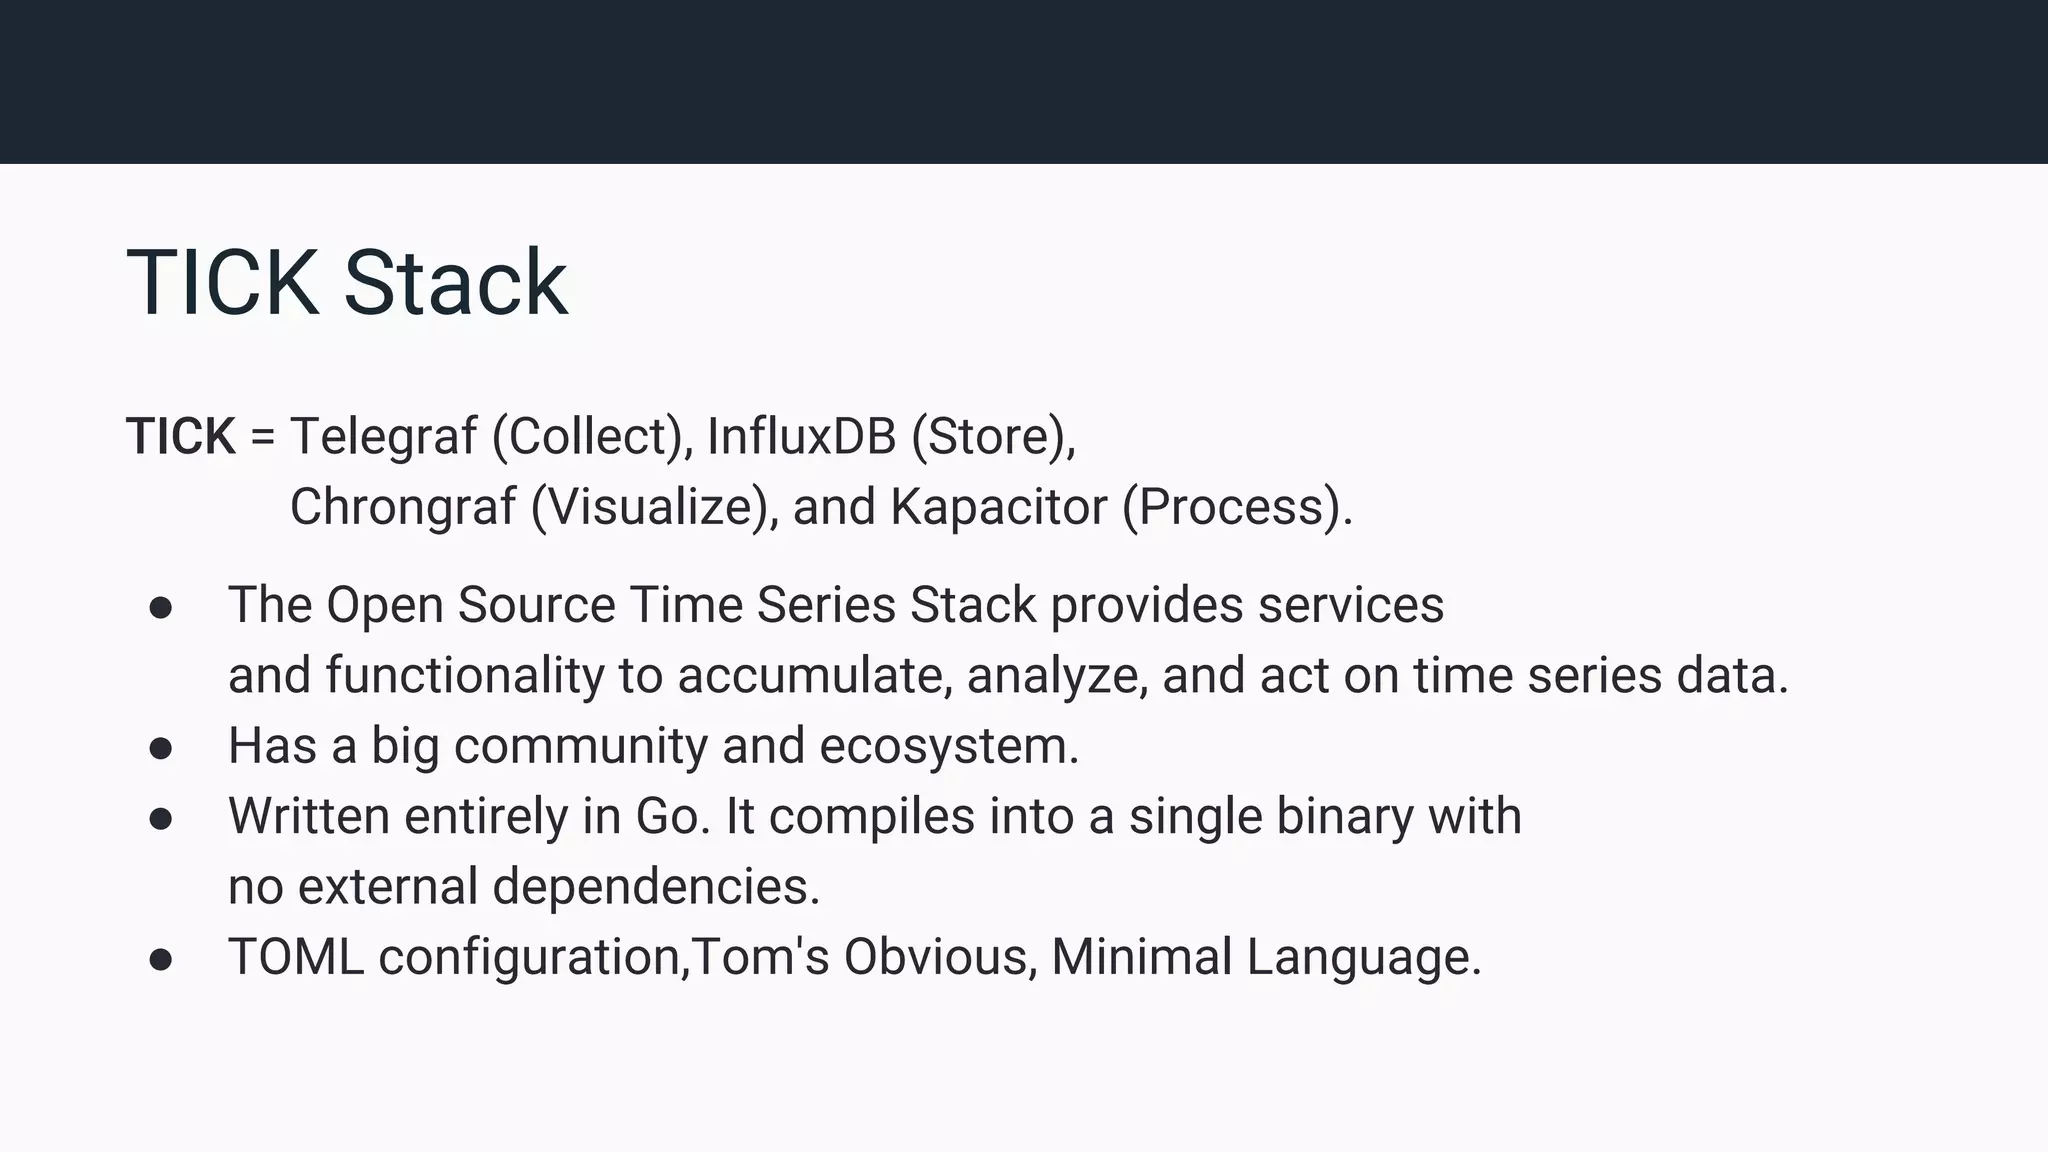
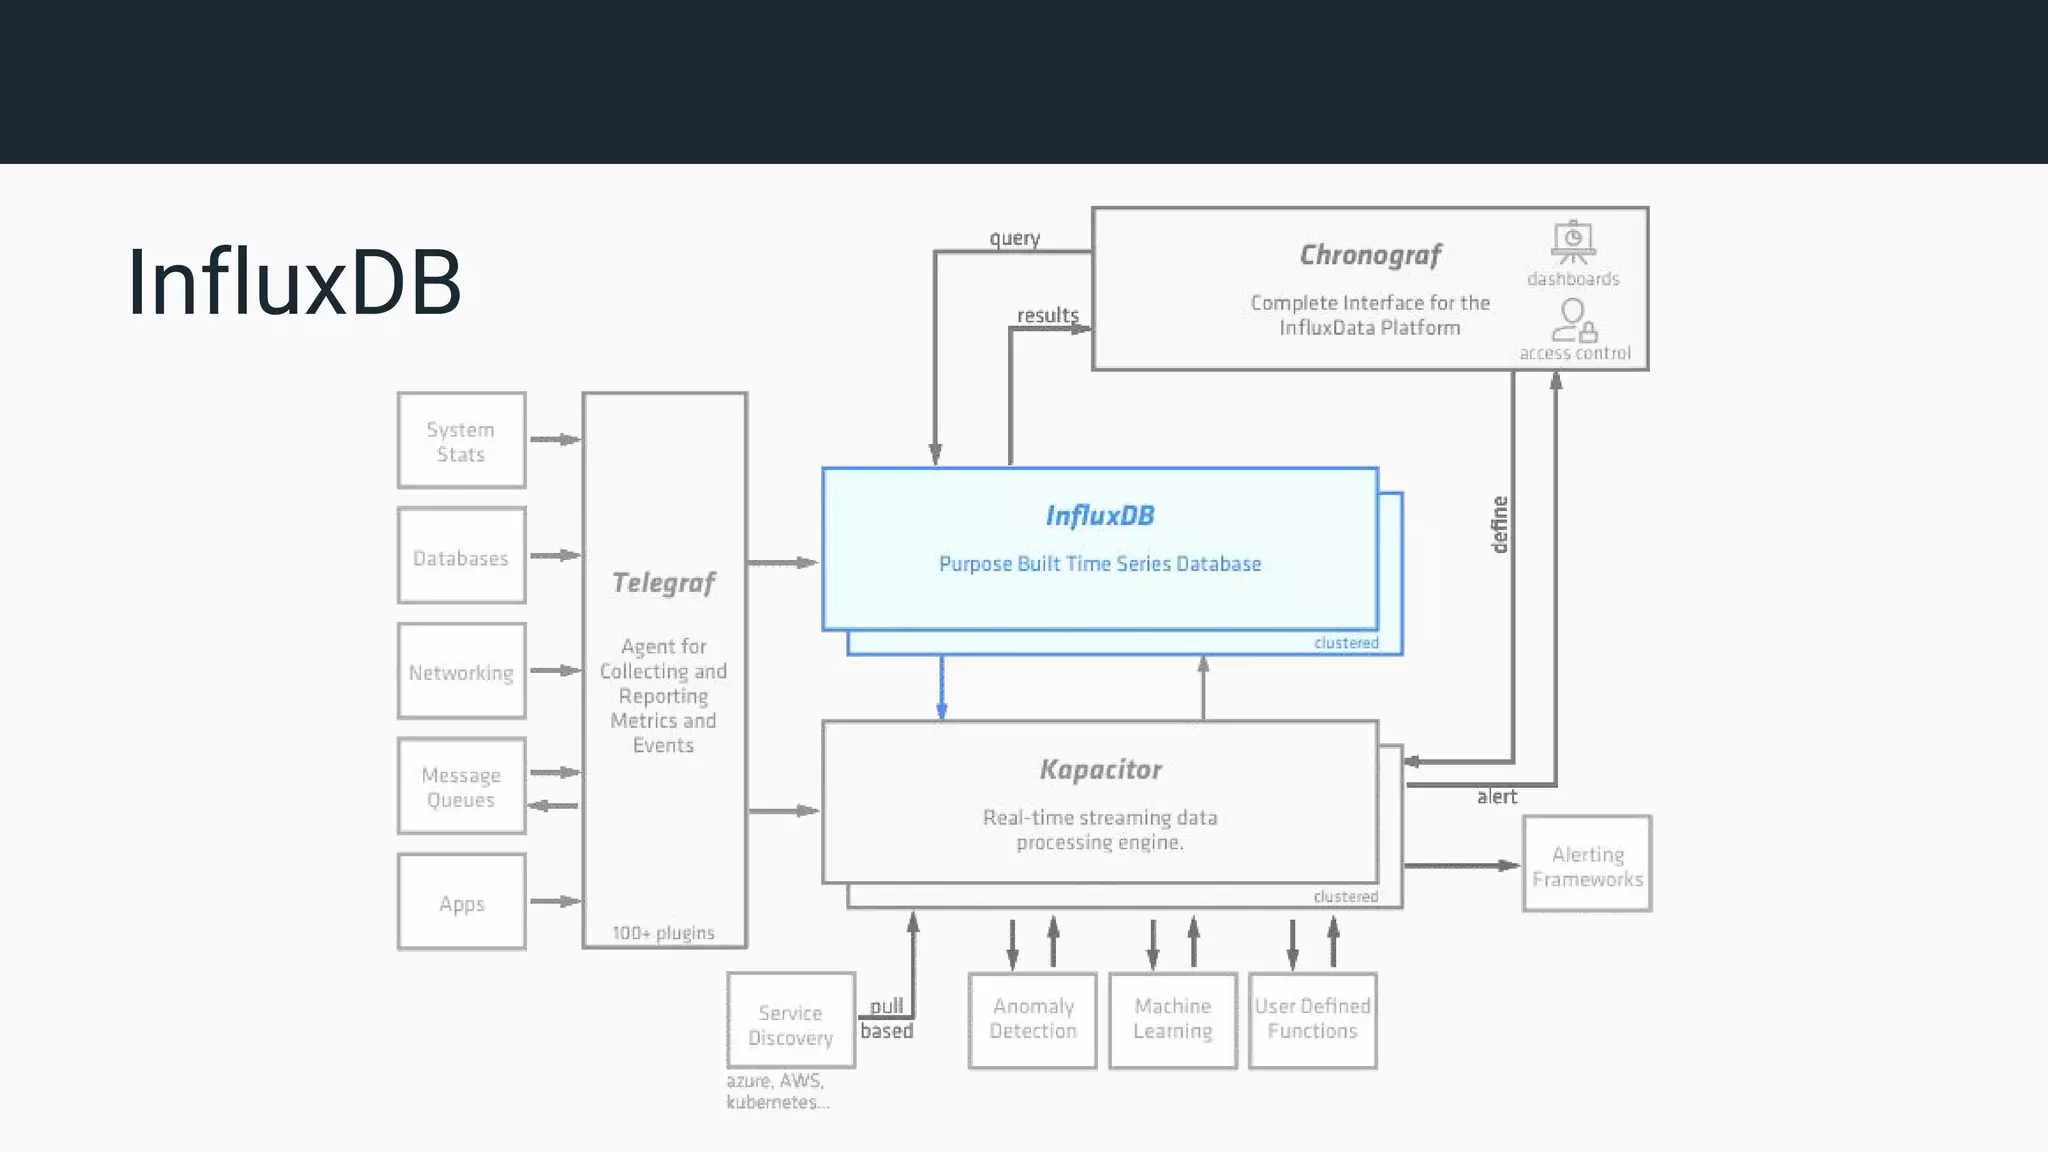
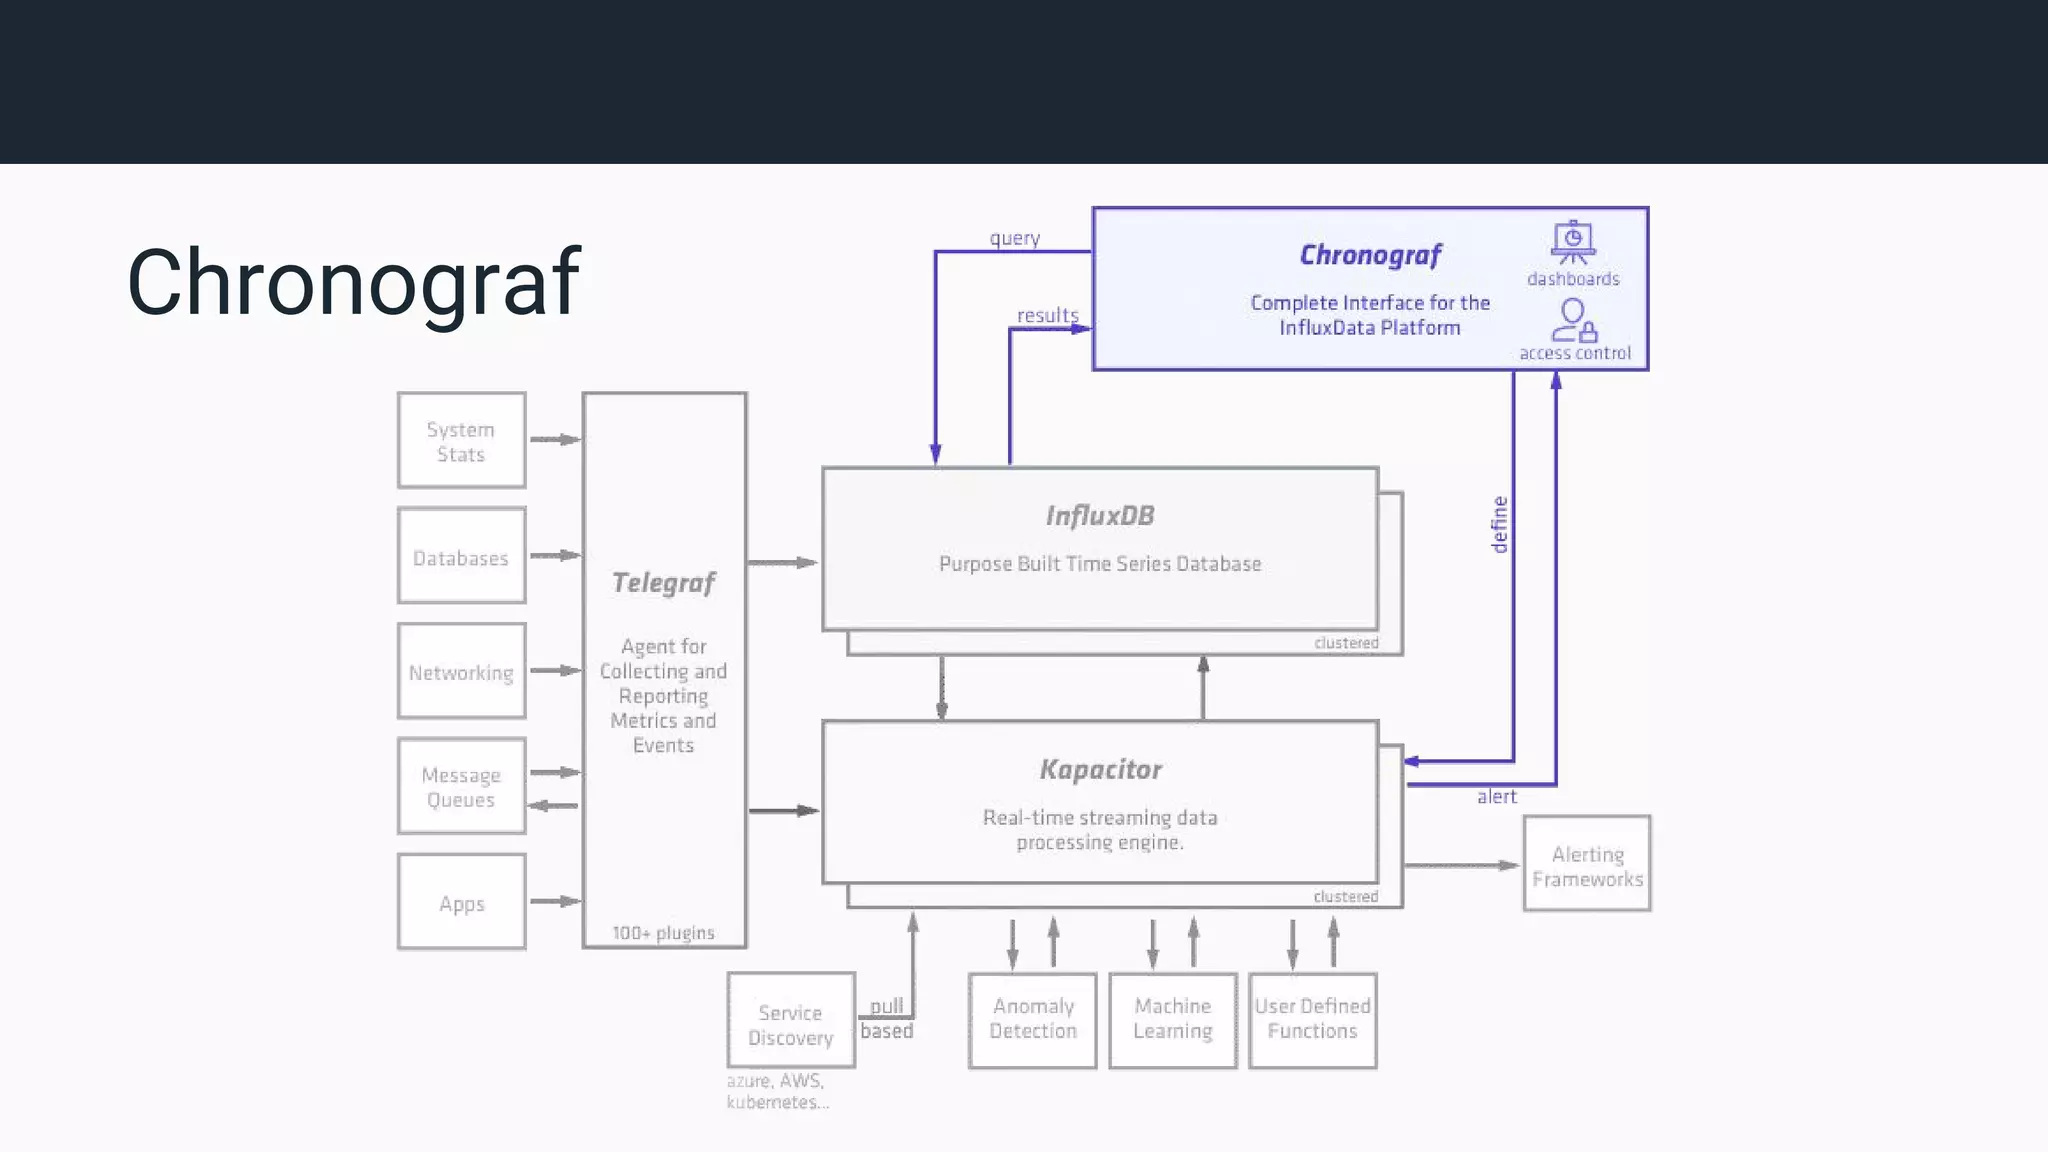
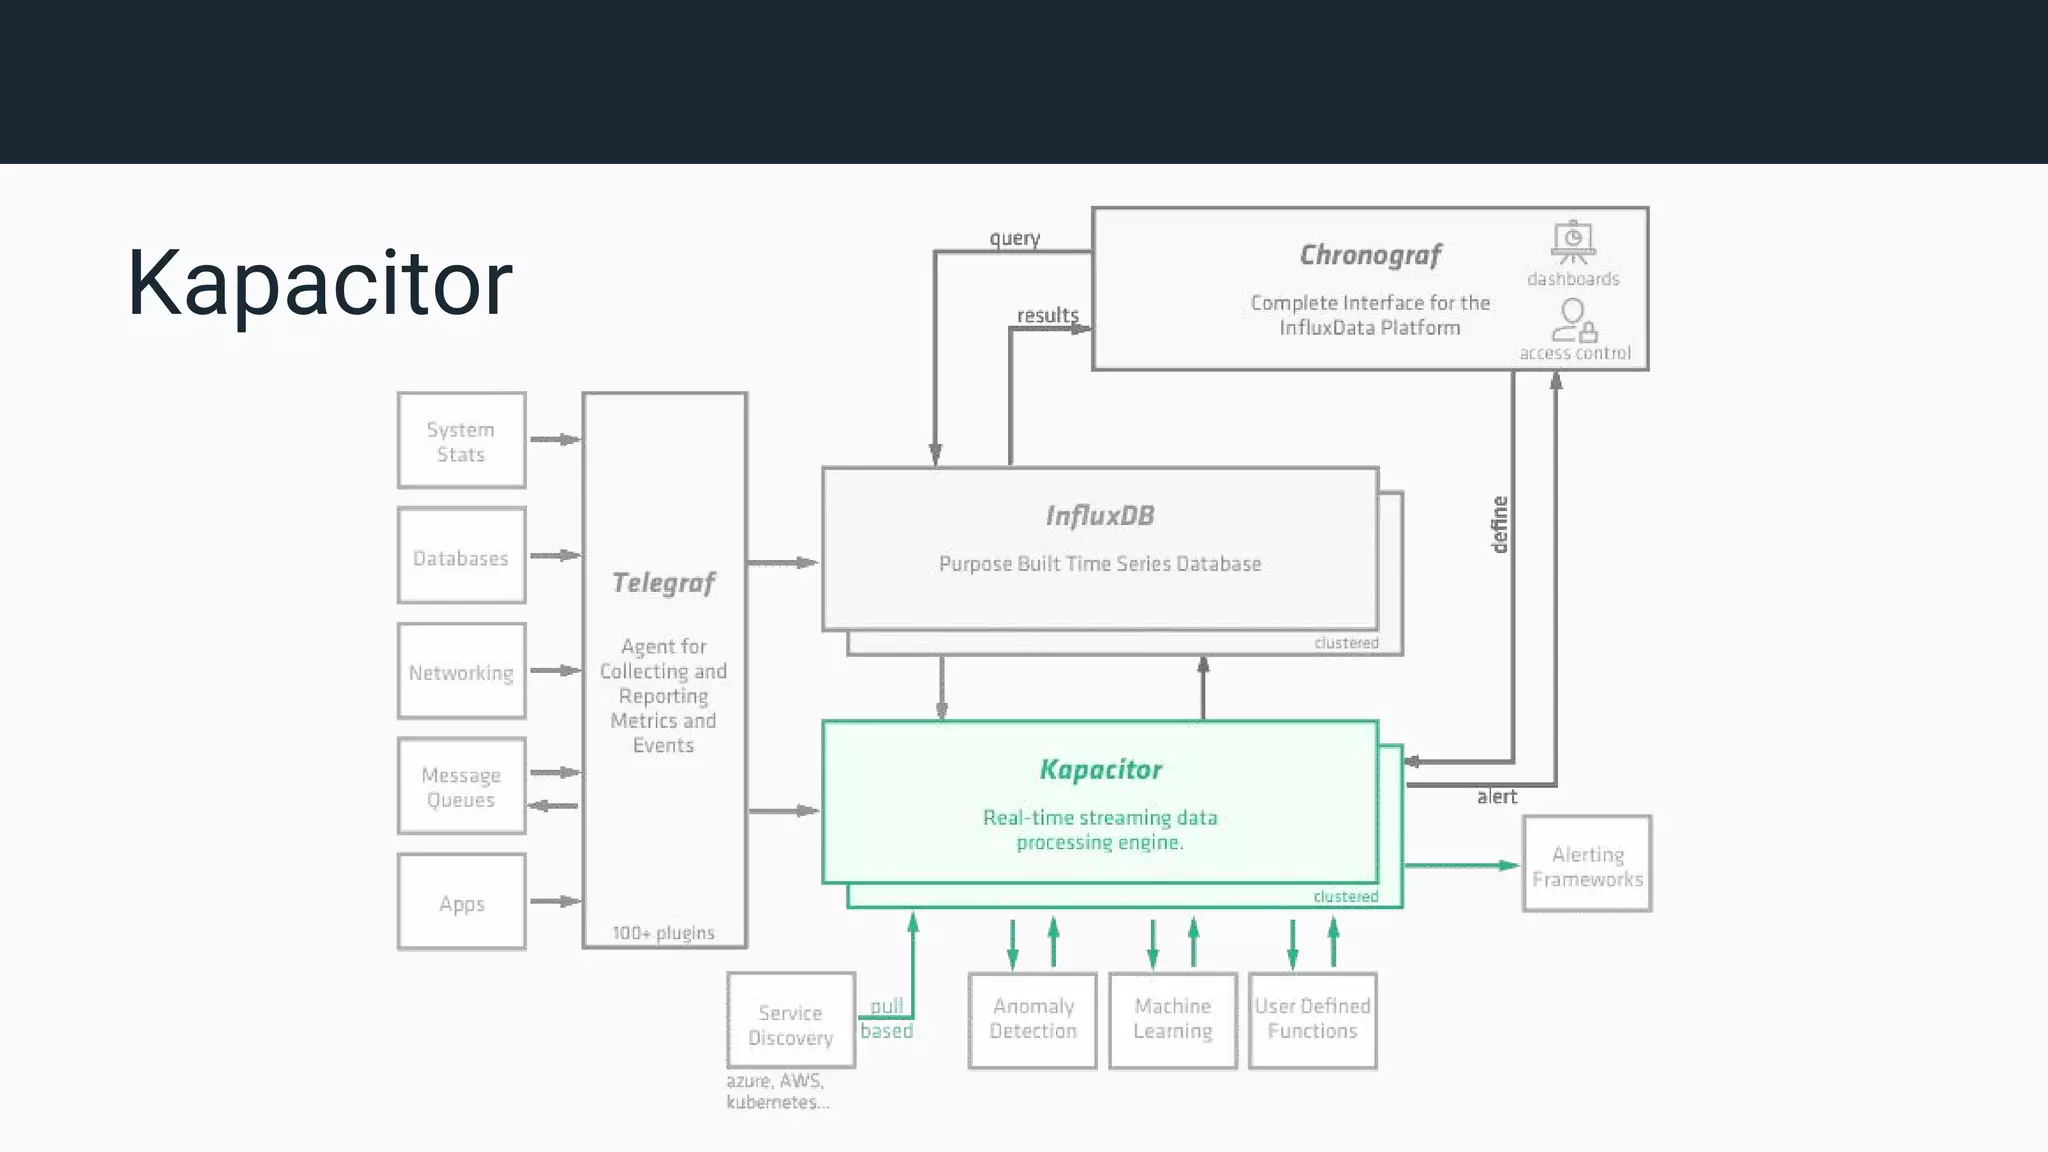
Introduction to TICK Stack - Telegraf, InfluxDB, Chronograf, Kapacitor; open-source stack for time series data.
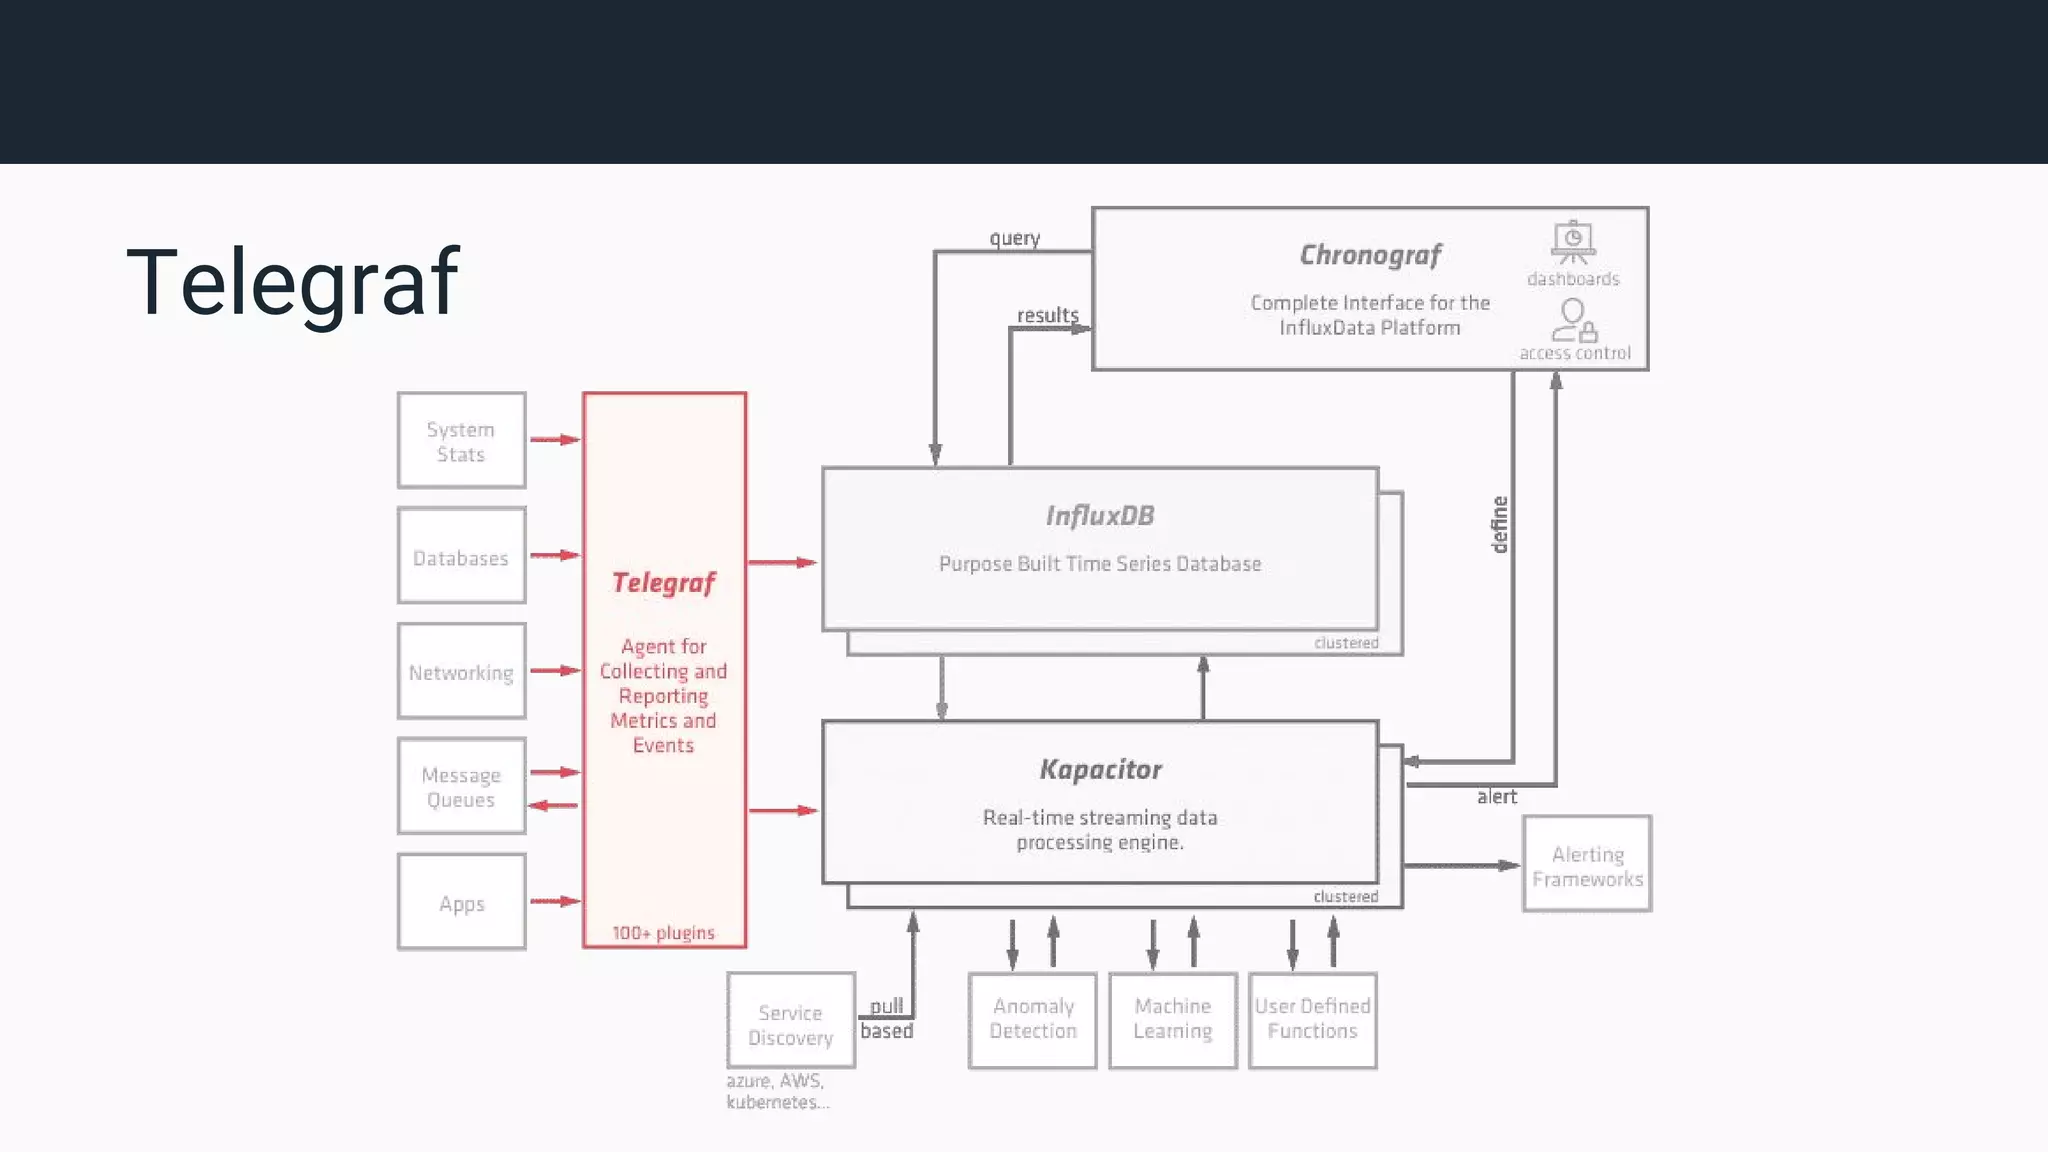
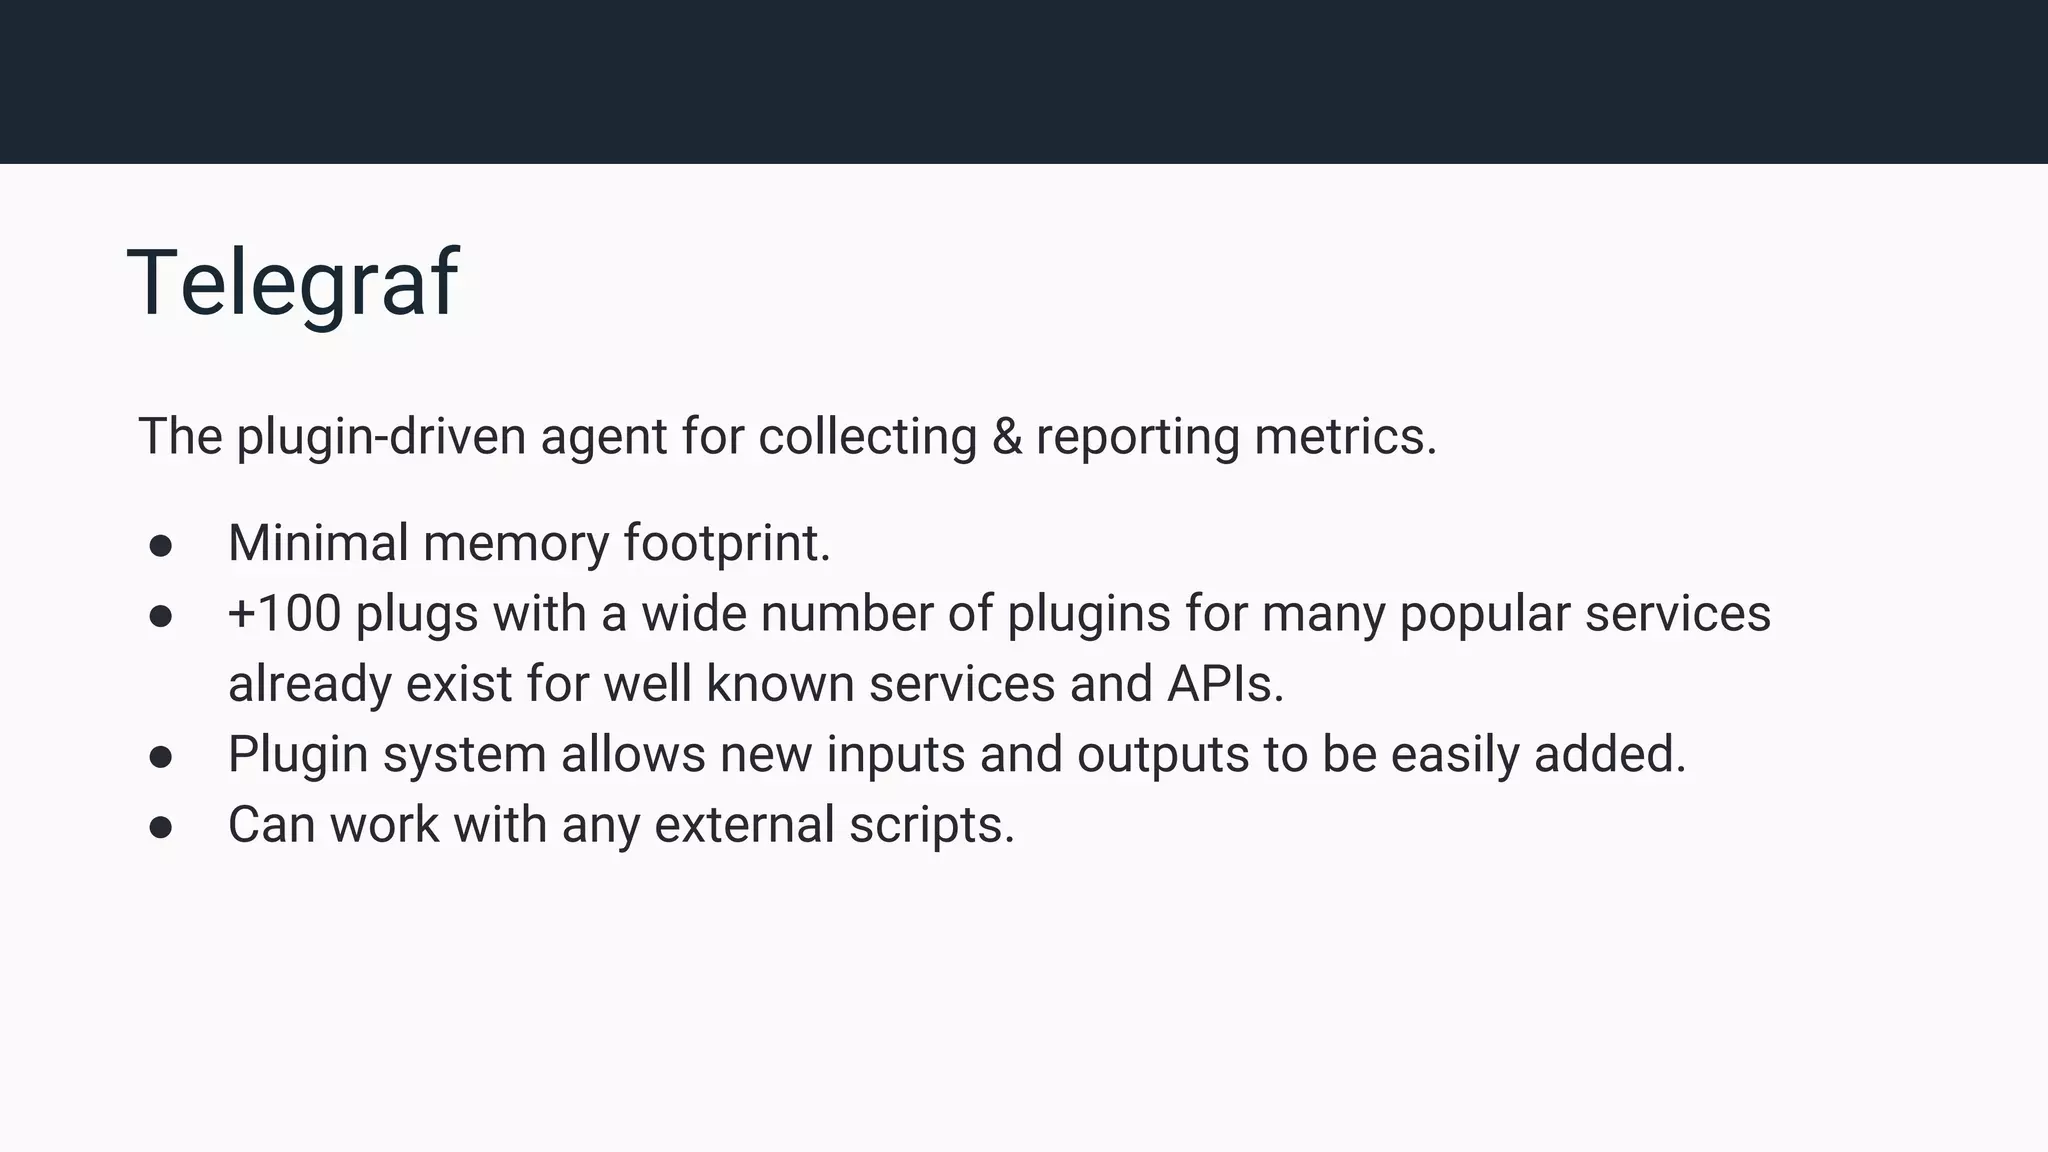
Telegraf as a metrics collection agent, its lightweight design, and sample output format for CPU metrics.
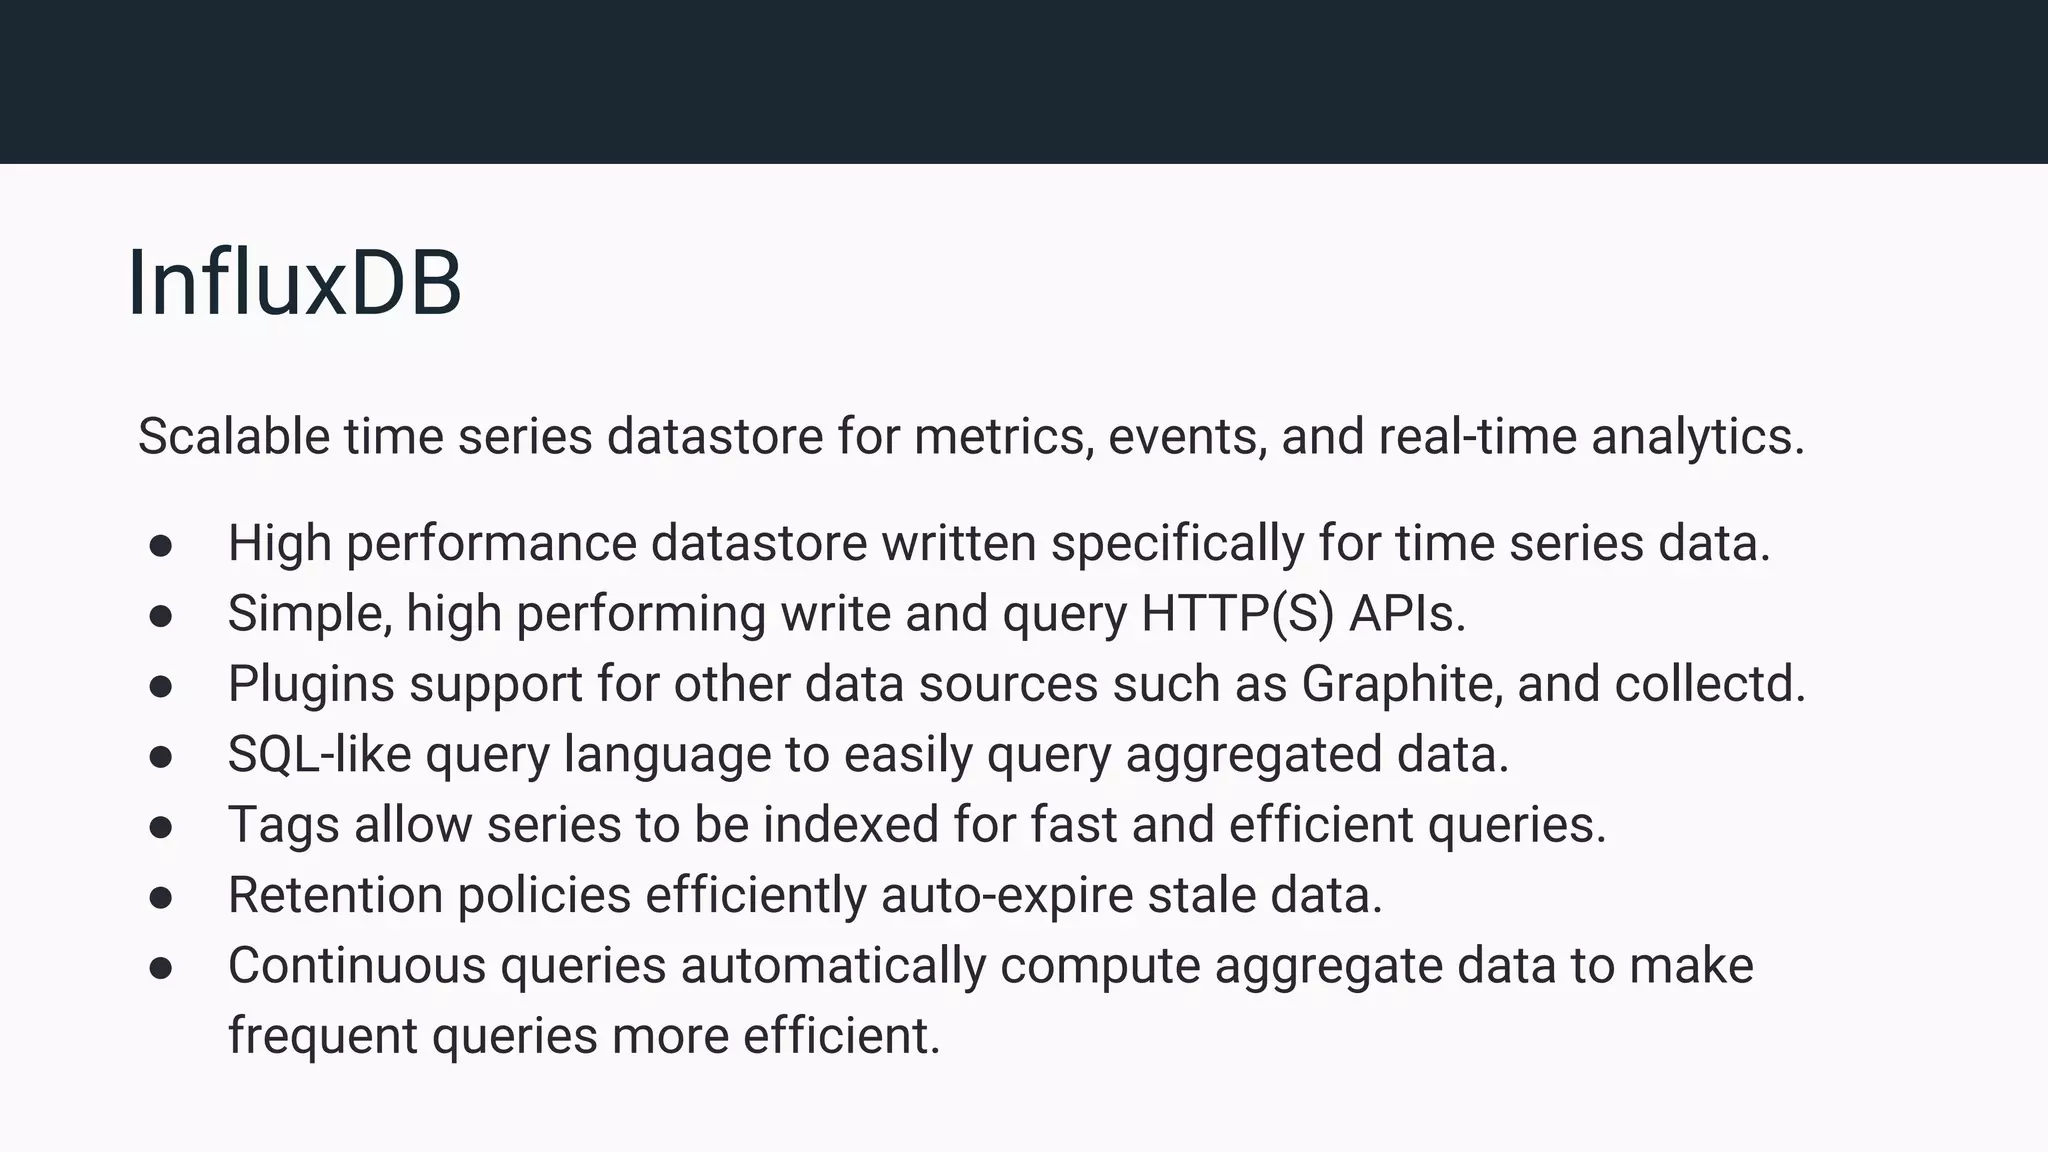
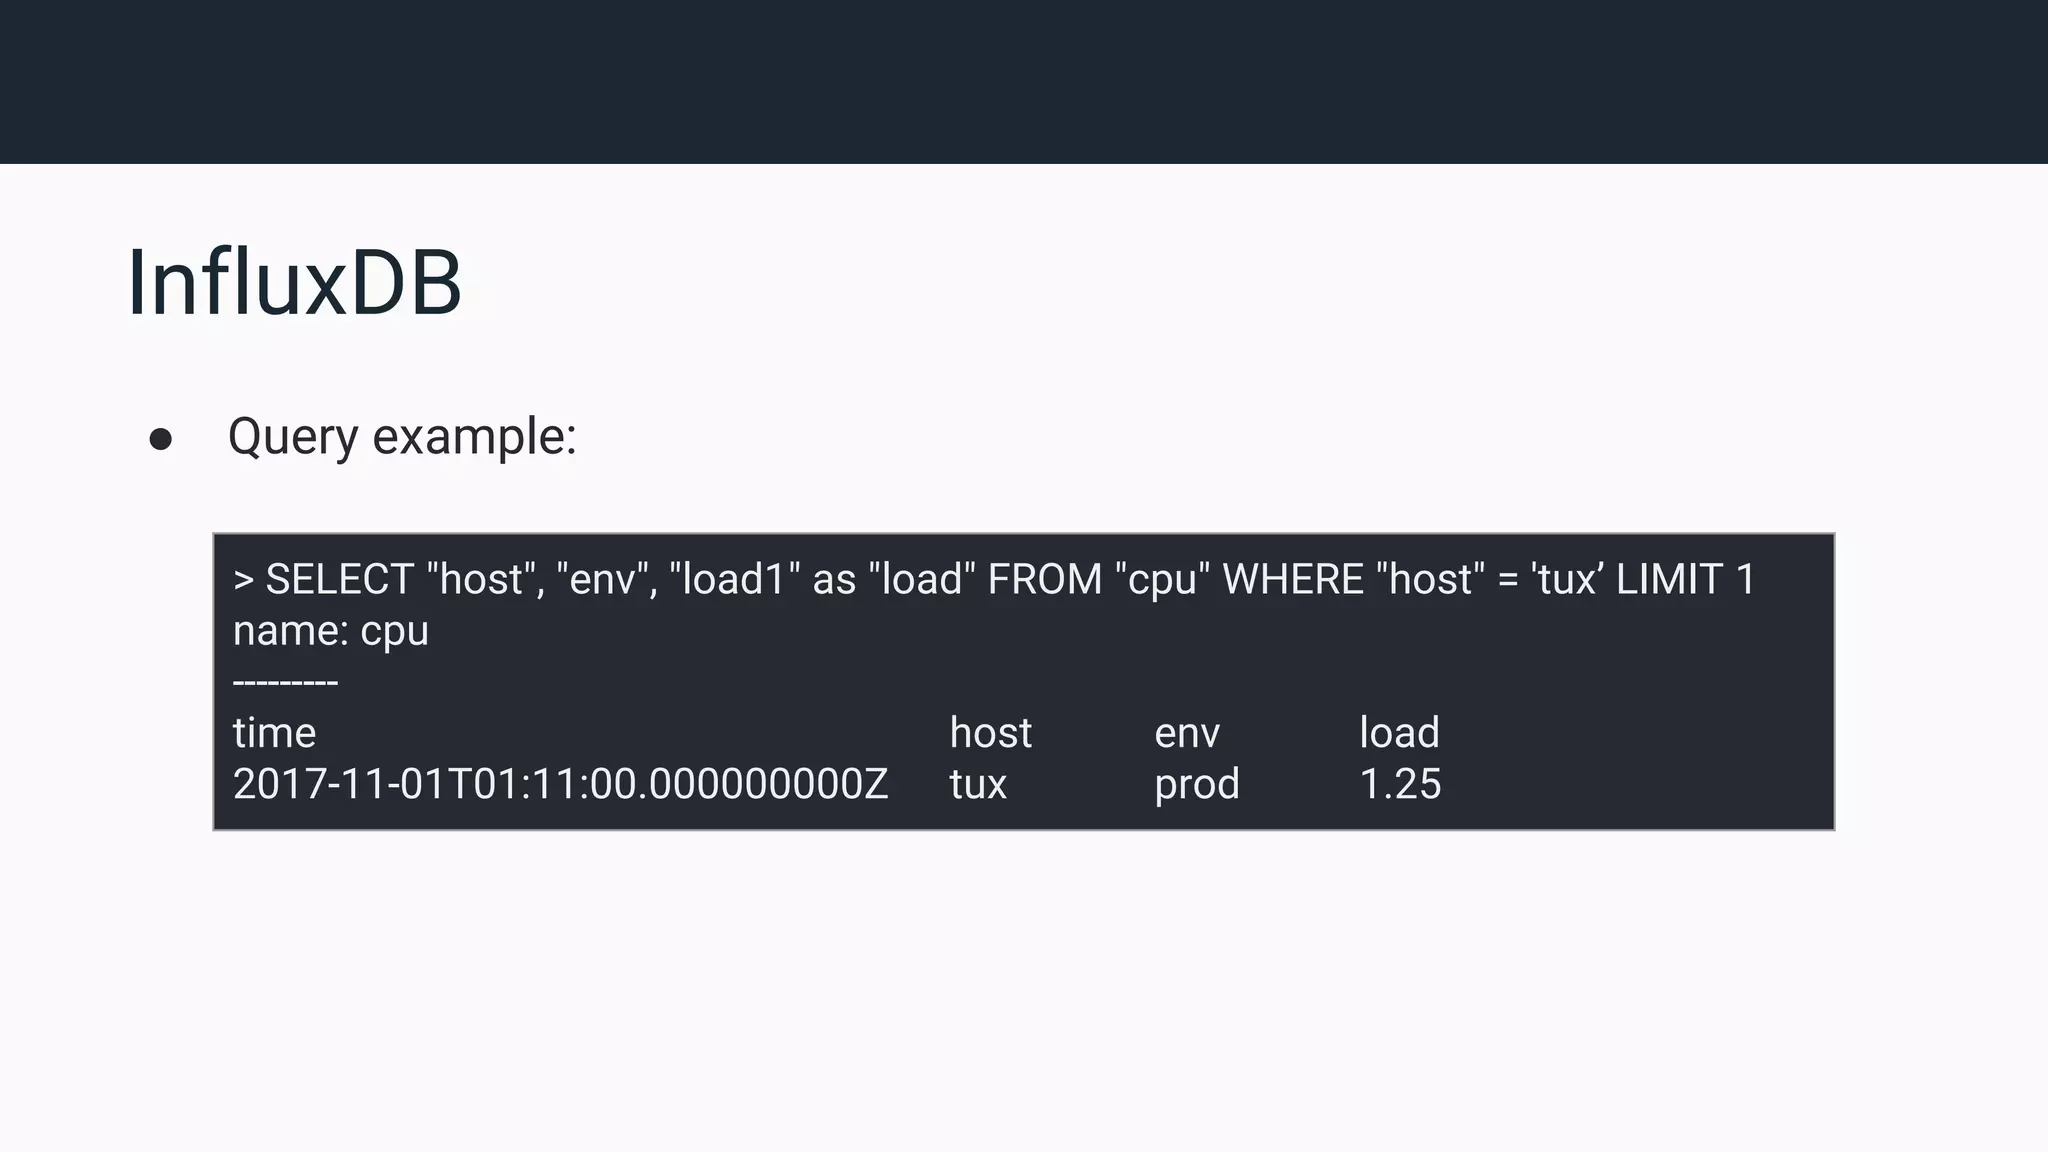
InfluxDB as a scalable datastore for time series; features include high performance, SQL-like queries, and retention policies.
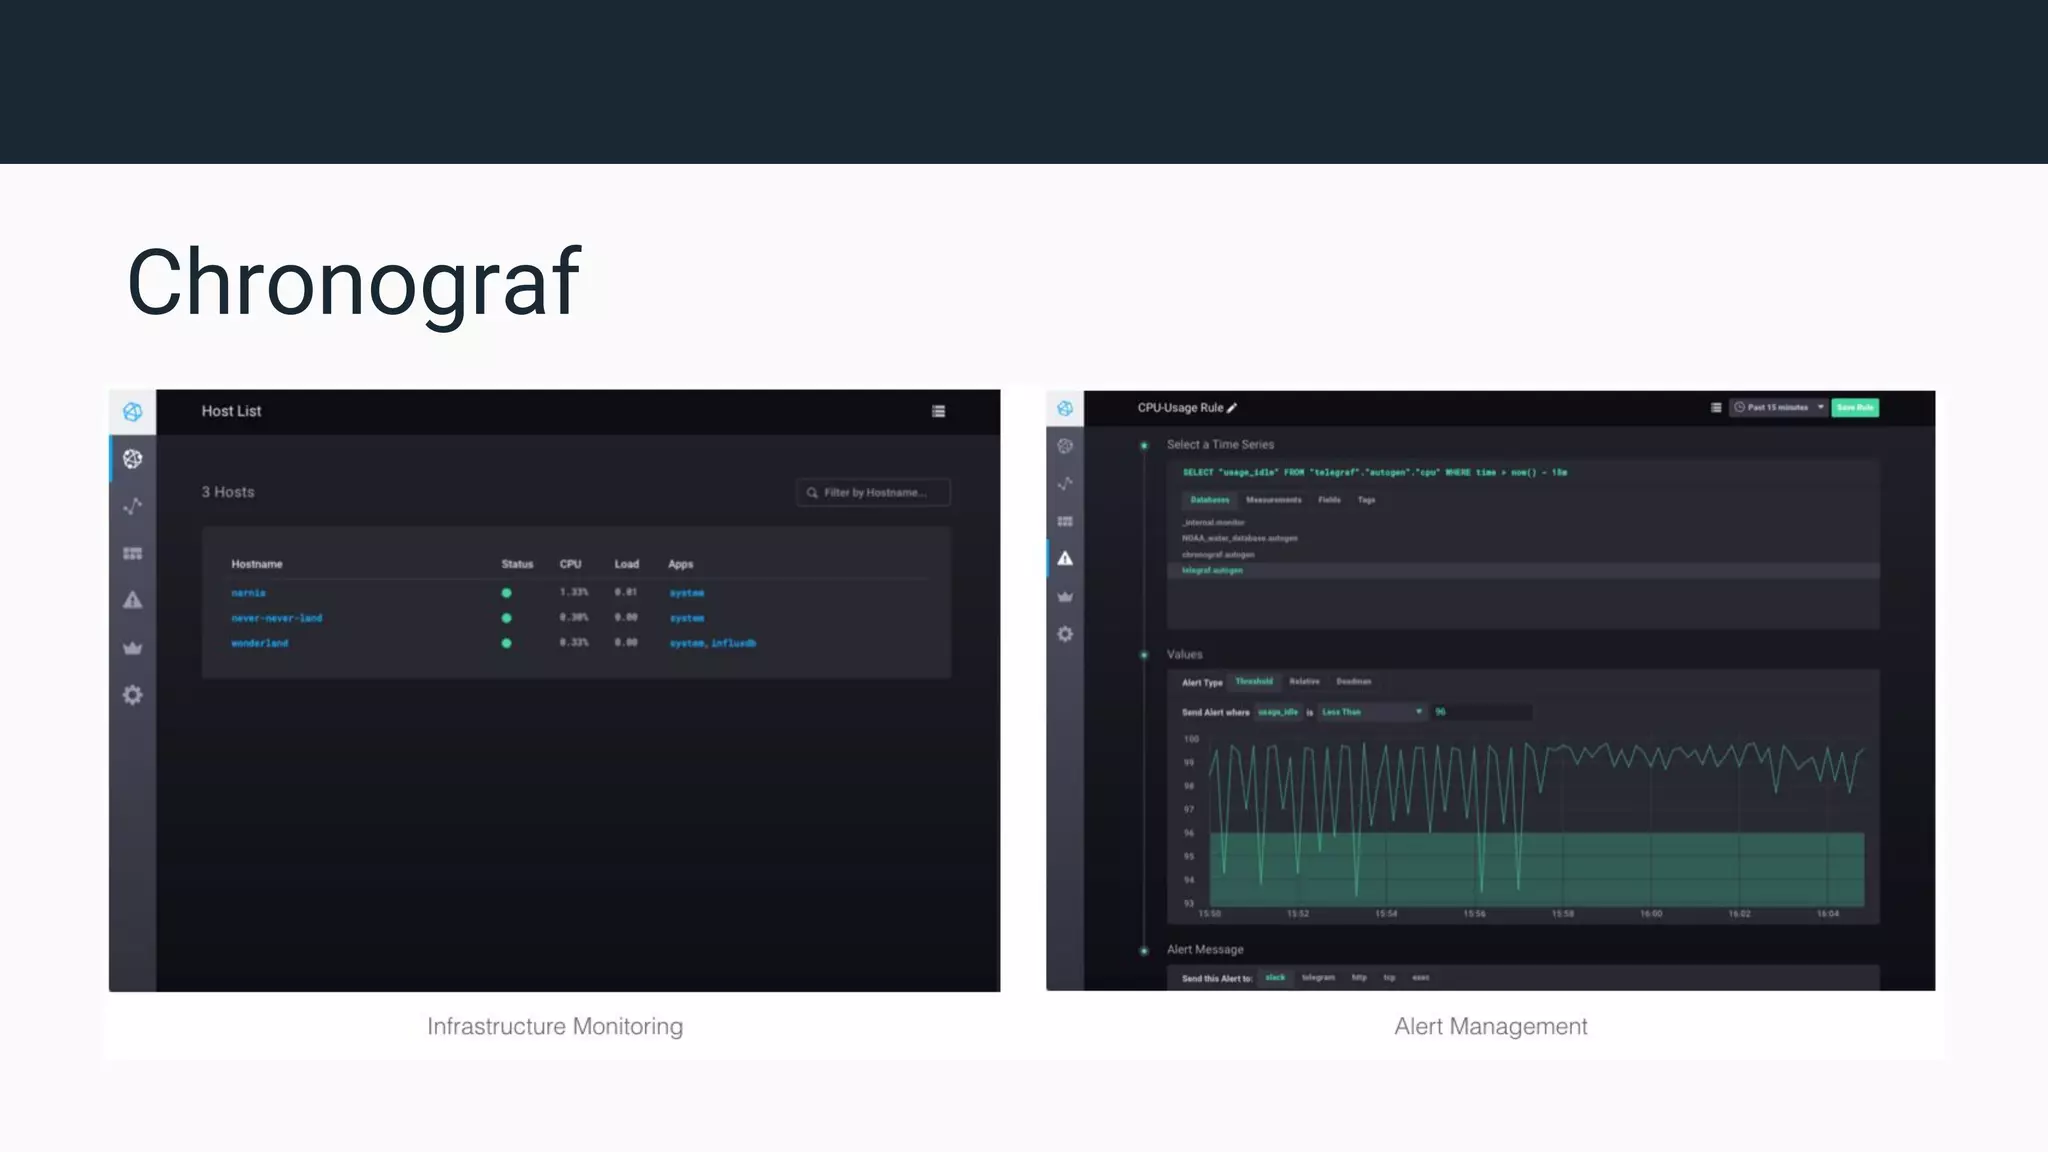
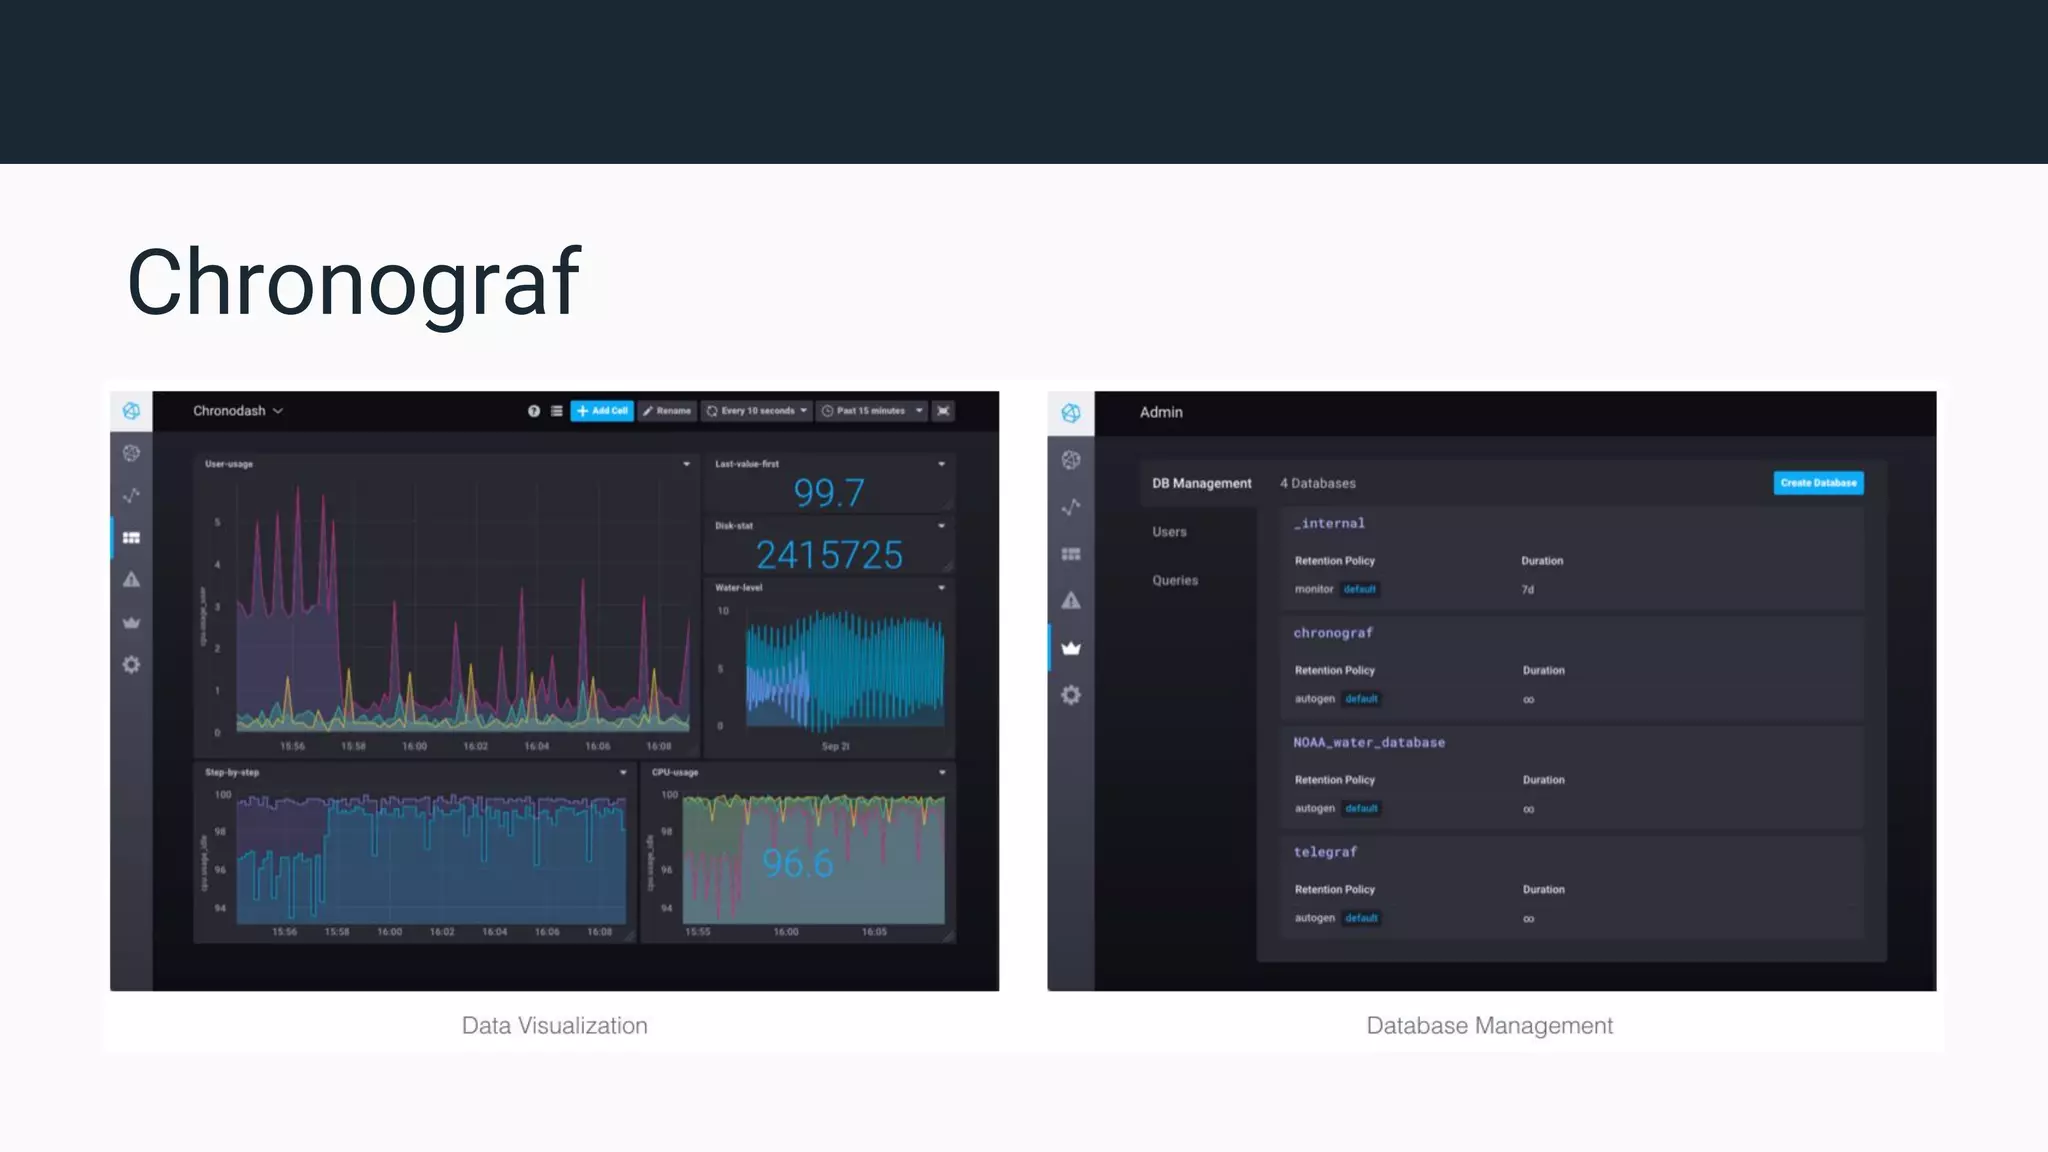
Chronograf as the TICK stack web interface for monitoring, visualization, data management, and alerts.
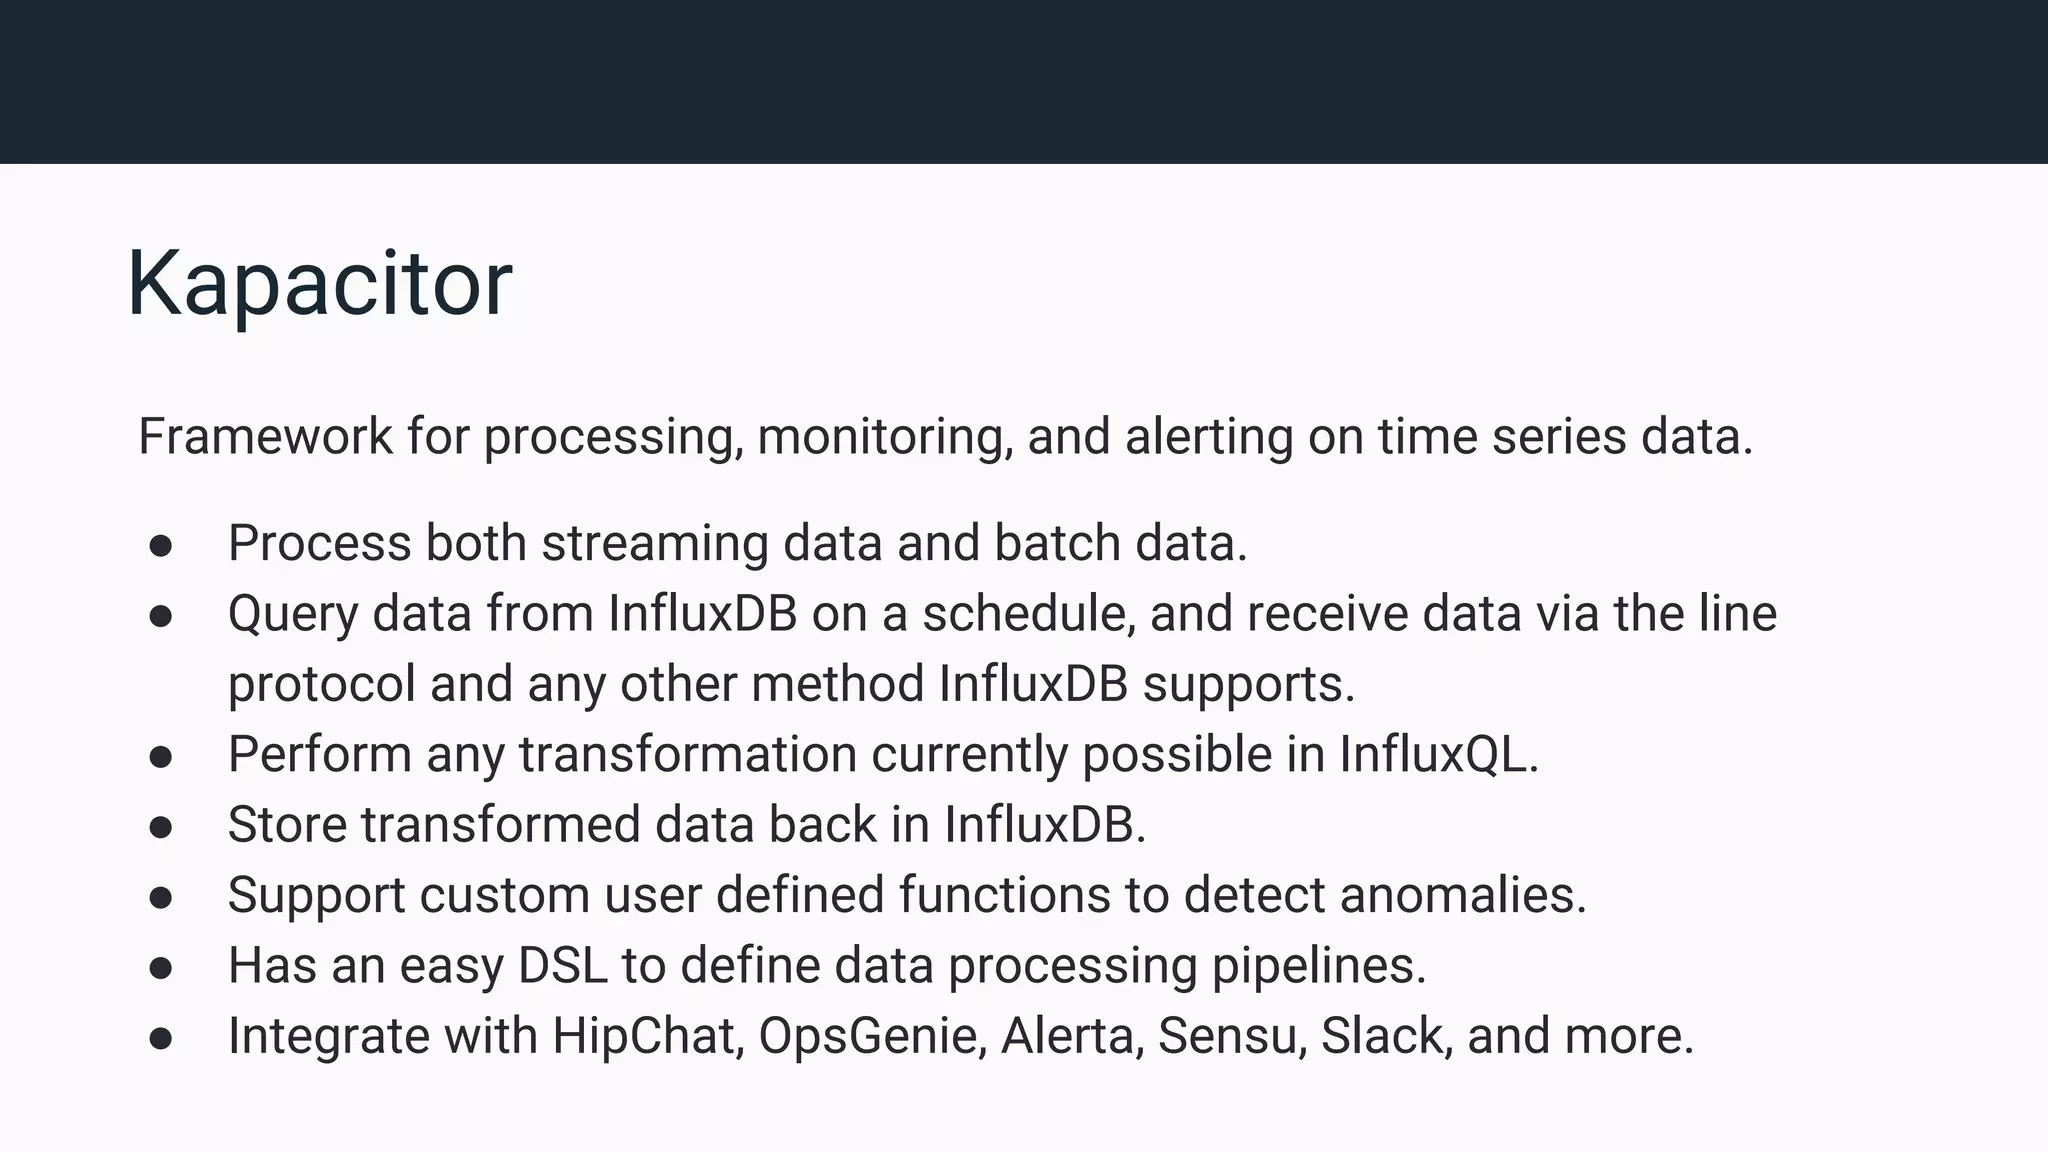
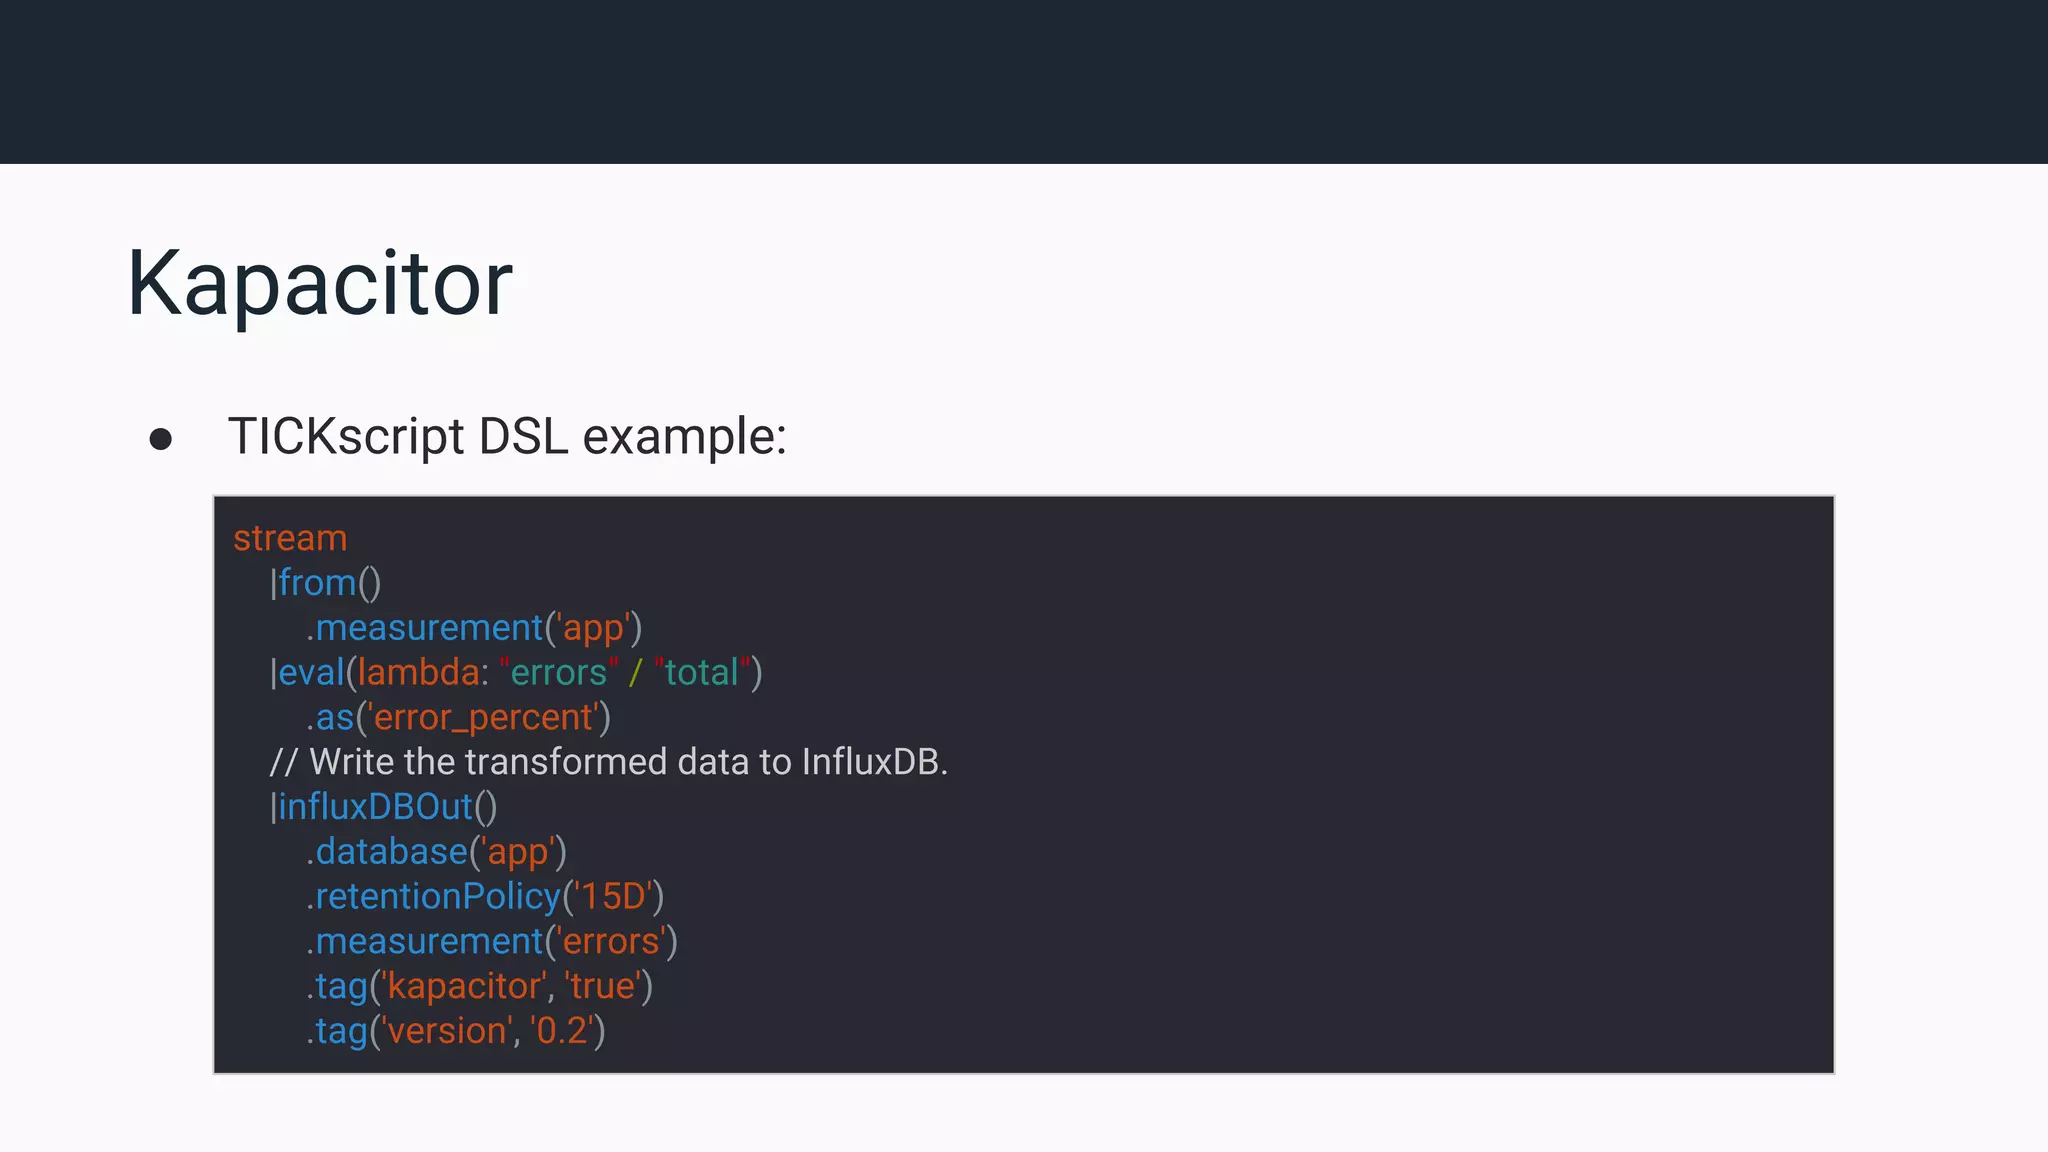
Kapacitor framework for processing time series data, supporting batch/streaming data, and anomaly detection with example TICKscript.
Practical use cases for TICK Stack include infrastructure monitoring, IoT sensor data, and anomaly detection.
References to resources for further reading on InfluxDB and time series database concepts.
Conclusion and invitation for questions from the audience.