Please turn off your webcam. If you are joining from Mobile device make sure you click on Join via Device Audio We are waiting for other participants to join. Thank you for your patience!
Mihir Thakkar Founder and Instructor hello@codeheroku.com
SESSION OBJECTIVES ● Data Visualization Steps ● Manipulating Data with Lodash ● Building Interactive Visualizations
Data Visualization Tools
Excel Traditional Business Intelligence (BI) Tools ● Good for quick insights and creation ● Can handle only low volume of data PowerPoint
Infographics ● Convey a story or educate your audience ● Talk to non-technical or general public ● Difficult to show large data sets ● Generally static
Custom JavaScript / Native Visualizations ● Large volumes of data ● Mobile devices / Apps ● Custom chart types ● Takes time / money and developers
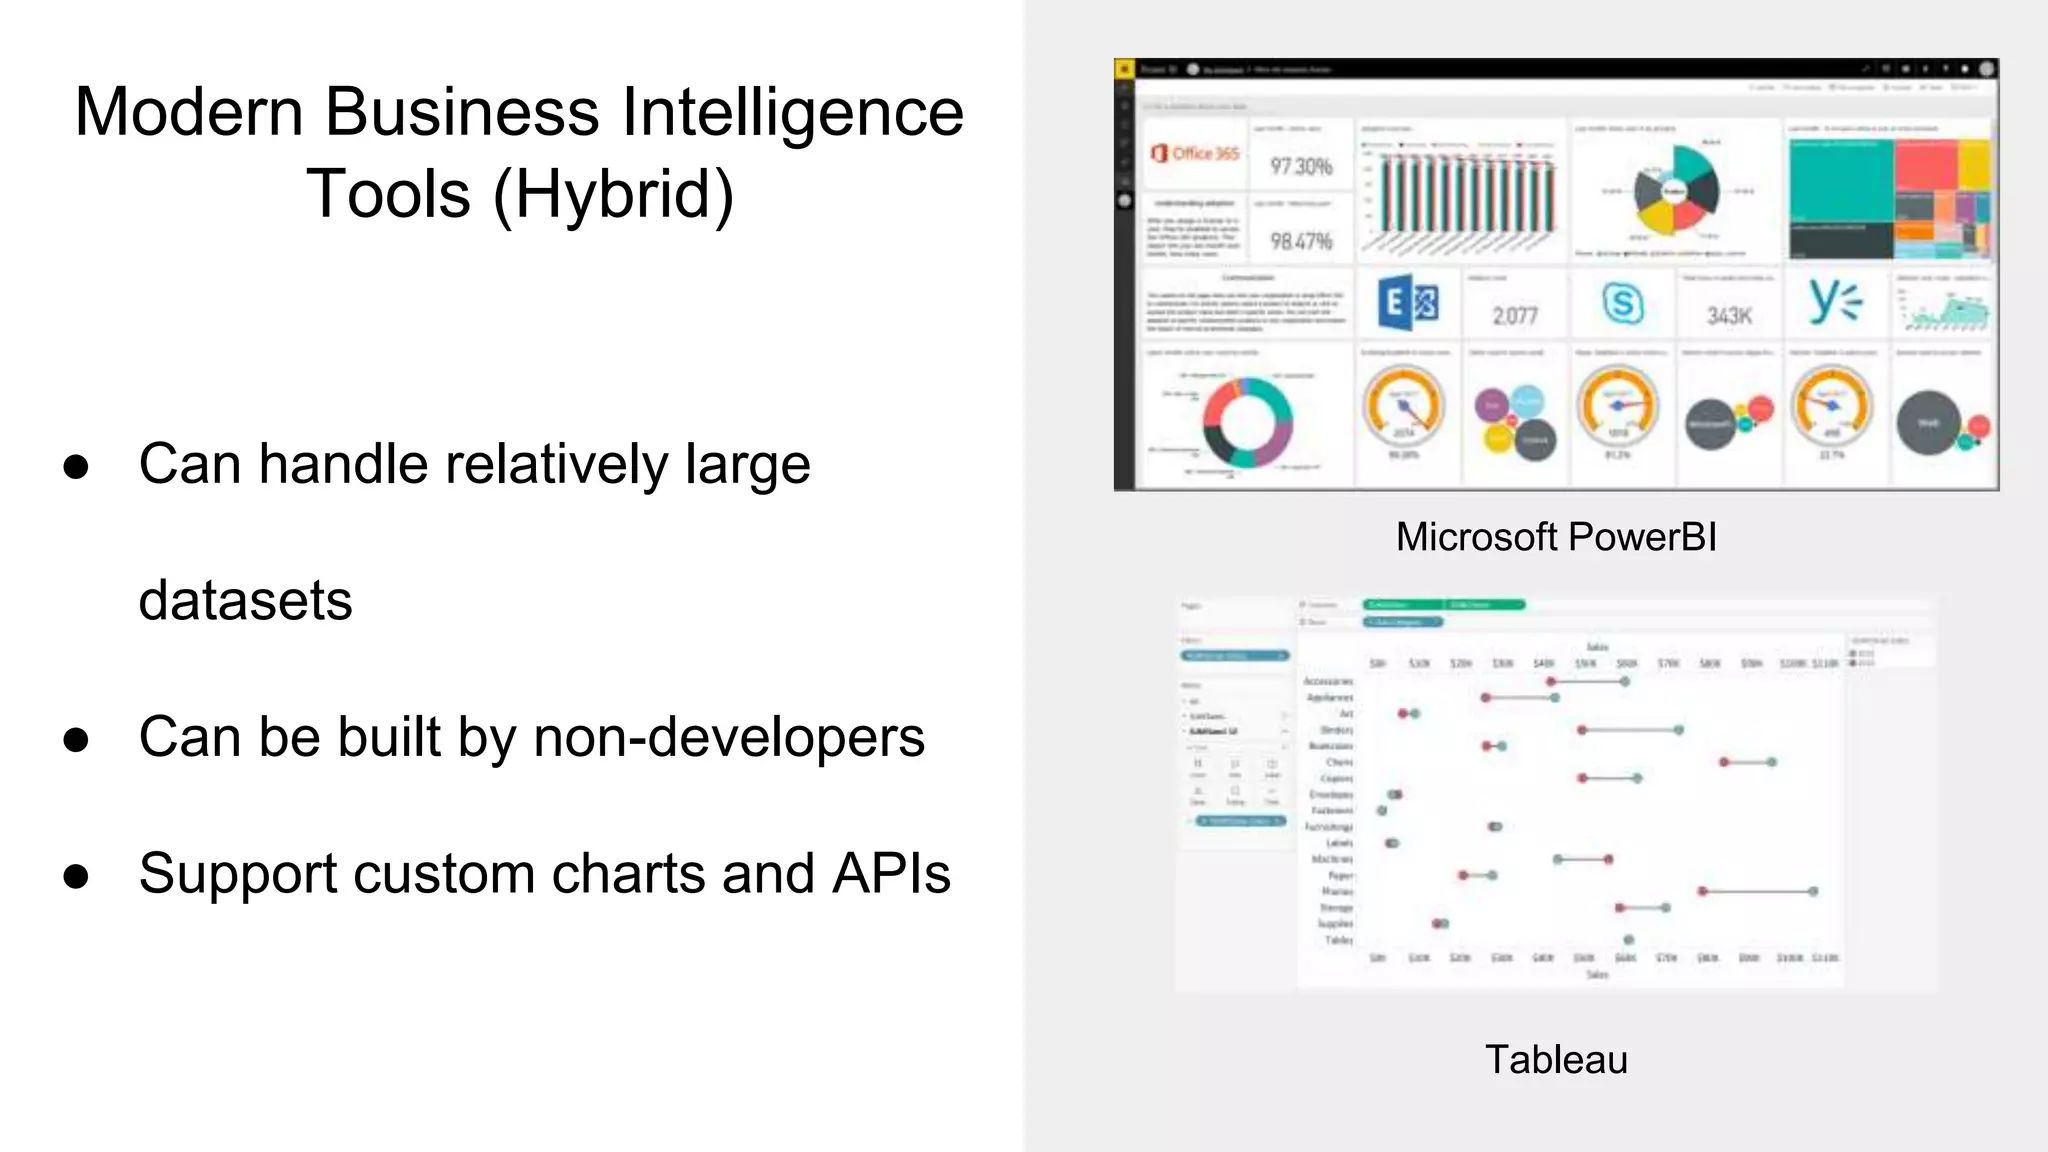
Modern Business Intelligence Tools (Hybrid) Microsoft PowerBI ● Can handle relatively large datasets ● Can be built by non-developers ● Support custom charts and APIs Tableau
Steps in Building Custom Data Visualizations Visualize Data Data Extract And Cleaning Data Fetch / Import Data Inspection and White Boarding
Quiz 1 Which of the following statement is True? 1. Filtering the data is the first step in any data visualization project 2. Libraries such as Lodash and Underscore work only on Chrome 3. HighCharts can be used to create interactive custom data visualizations
//Plain JS function getRandomNumber(min, max){ return Math.floor(Math.random() * (max - min + 1)) + min; } getRandomNumber(15, 20); //With Lodash _.random(15, 20);
Building HighCharts http://www.codeheroku.com/static/workshop/code/chart.zip http://www.codeheroku.com/codeheroku/default/call/json/datasets?name=digital- transactions-india.json
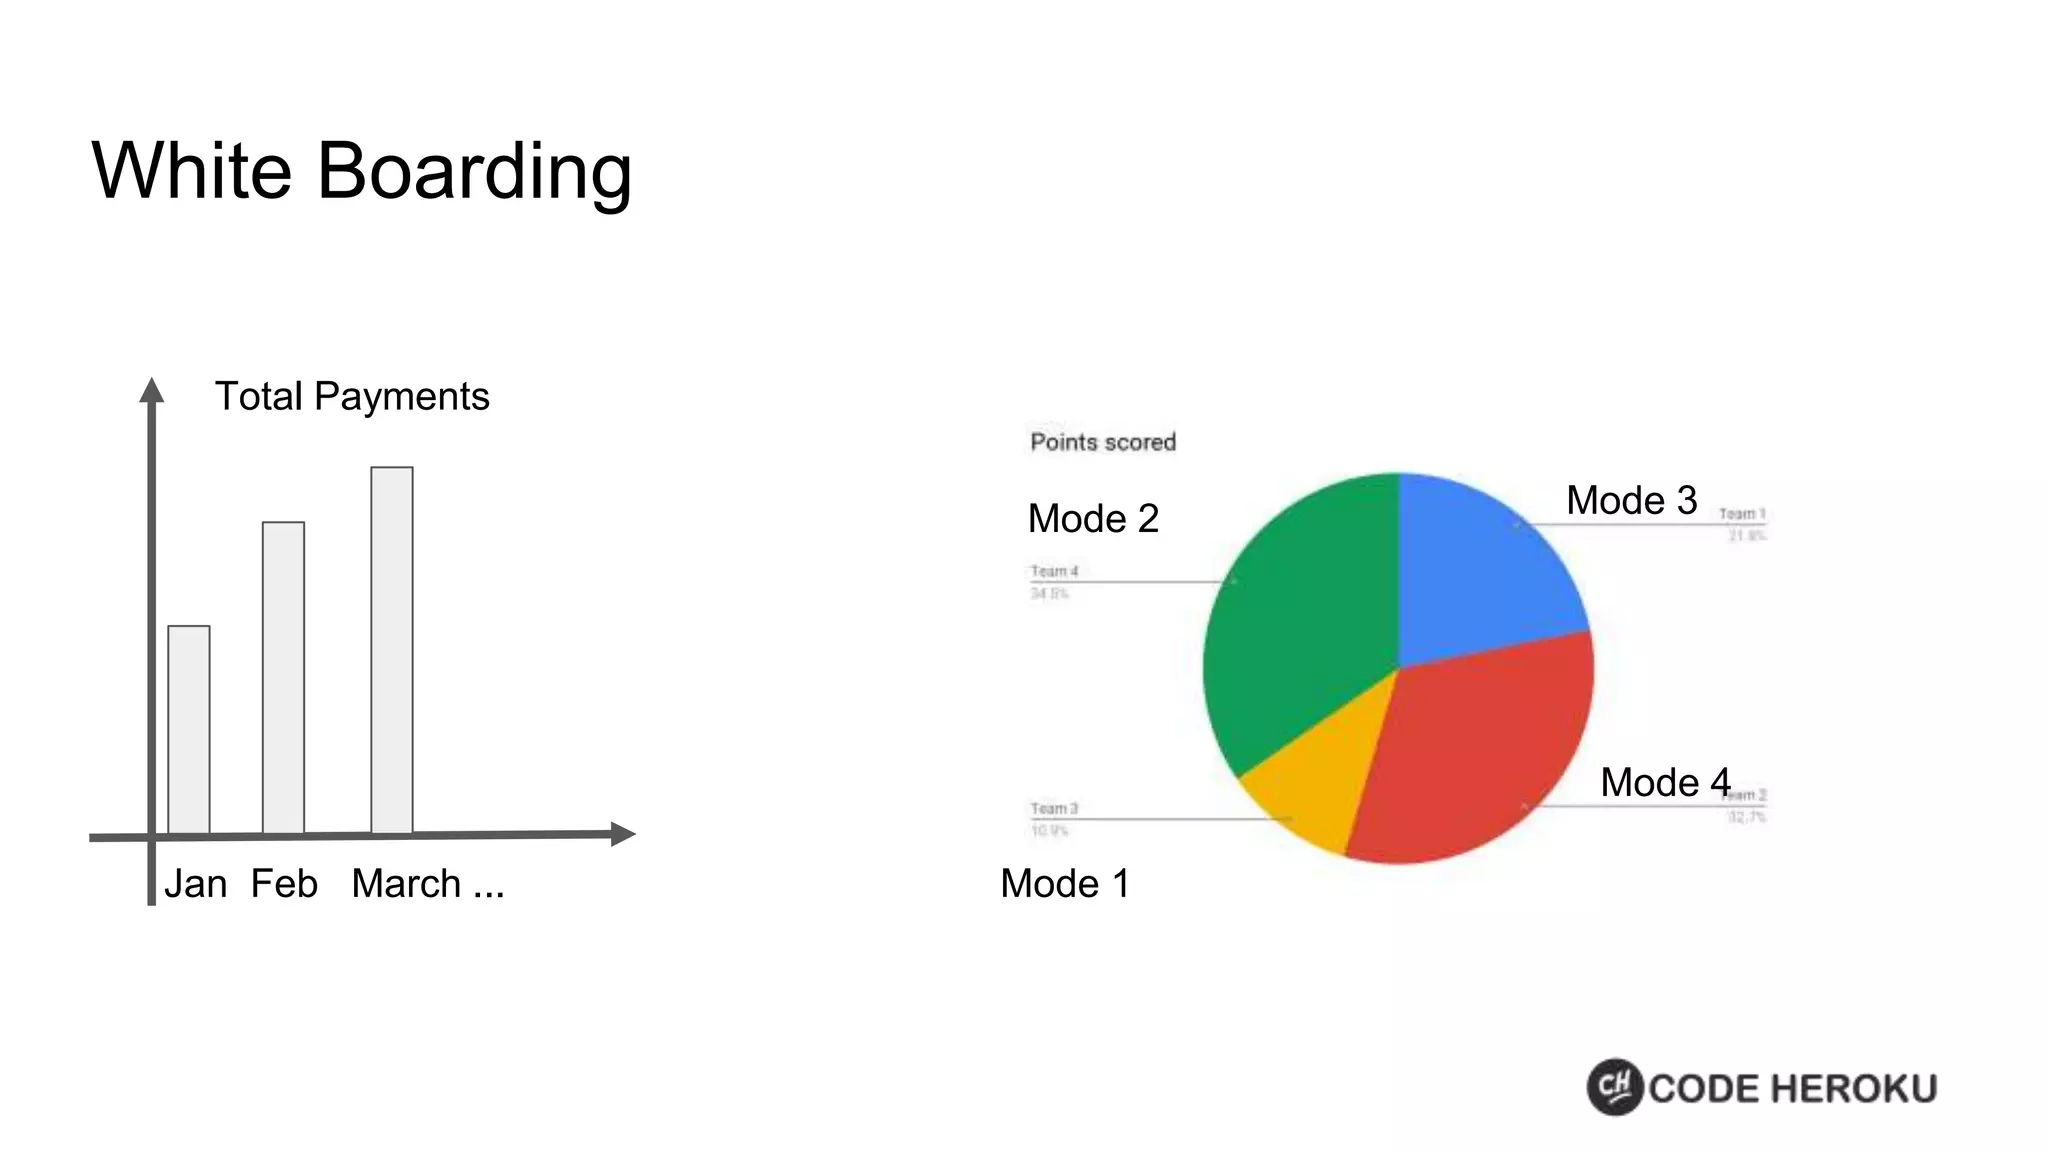
White Boarding Jan Feb March ... Mode 1 Mode 2 Mode 3 Mode 4 Total Payments
HW Assignment http://www.codeheroku.com/codeheroku/default/call/json/datasets?name=property_ crime_india.json
Thank you! https://www.facebook.com/codeheroku/reviews/ Your feedback means a lot
Introduction to Data Visualization Part 2 - Code Heroku

Introduction to Data Visualization Part 2 - Code Heroku