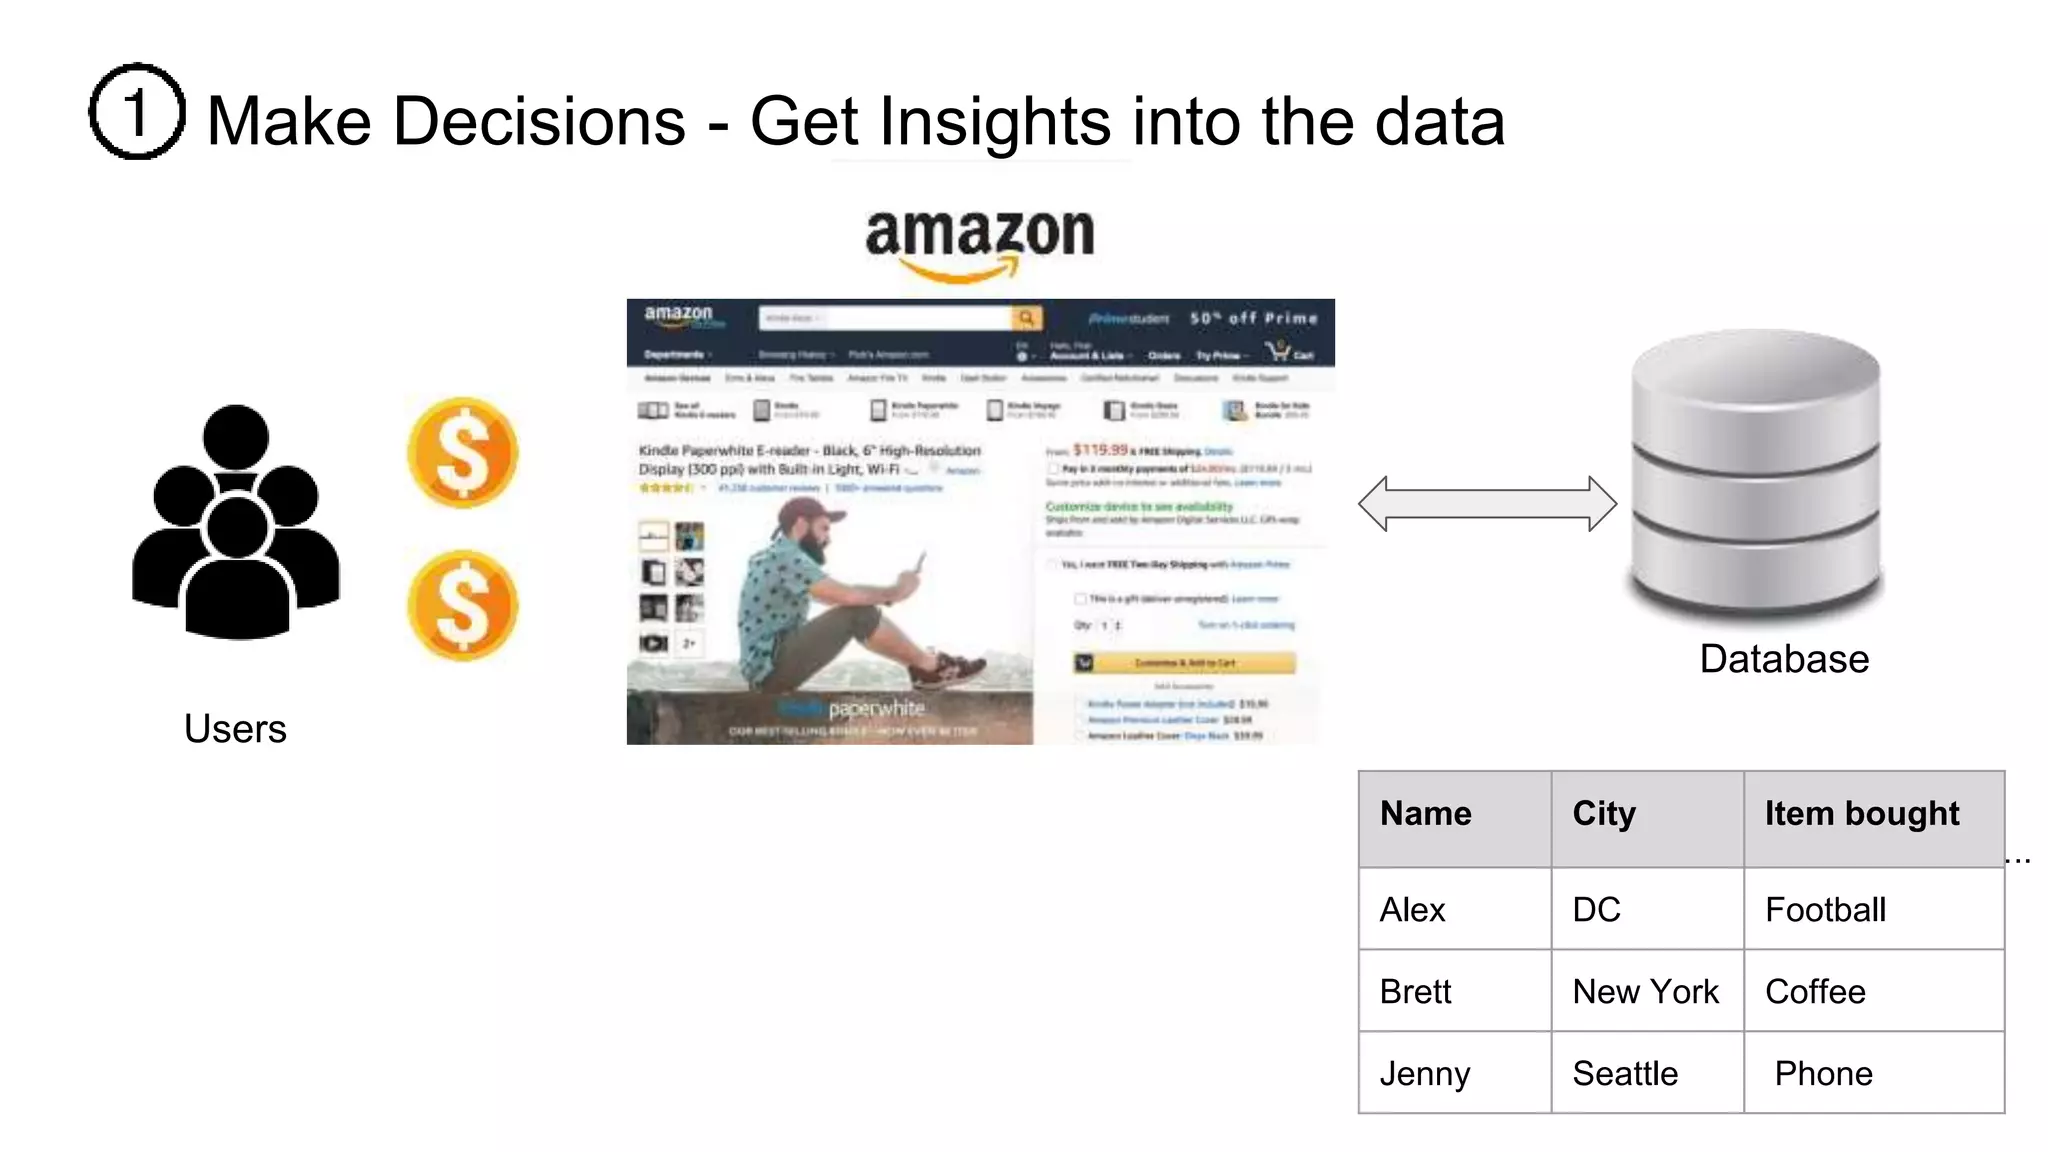
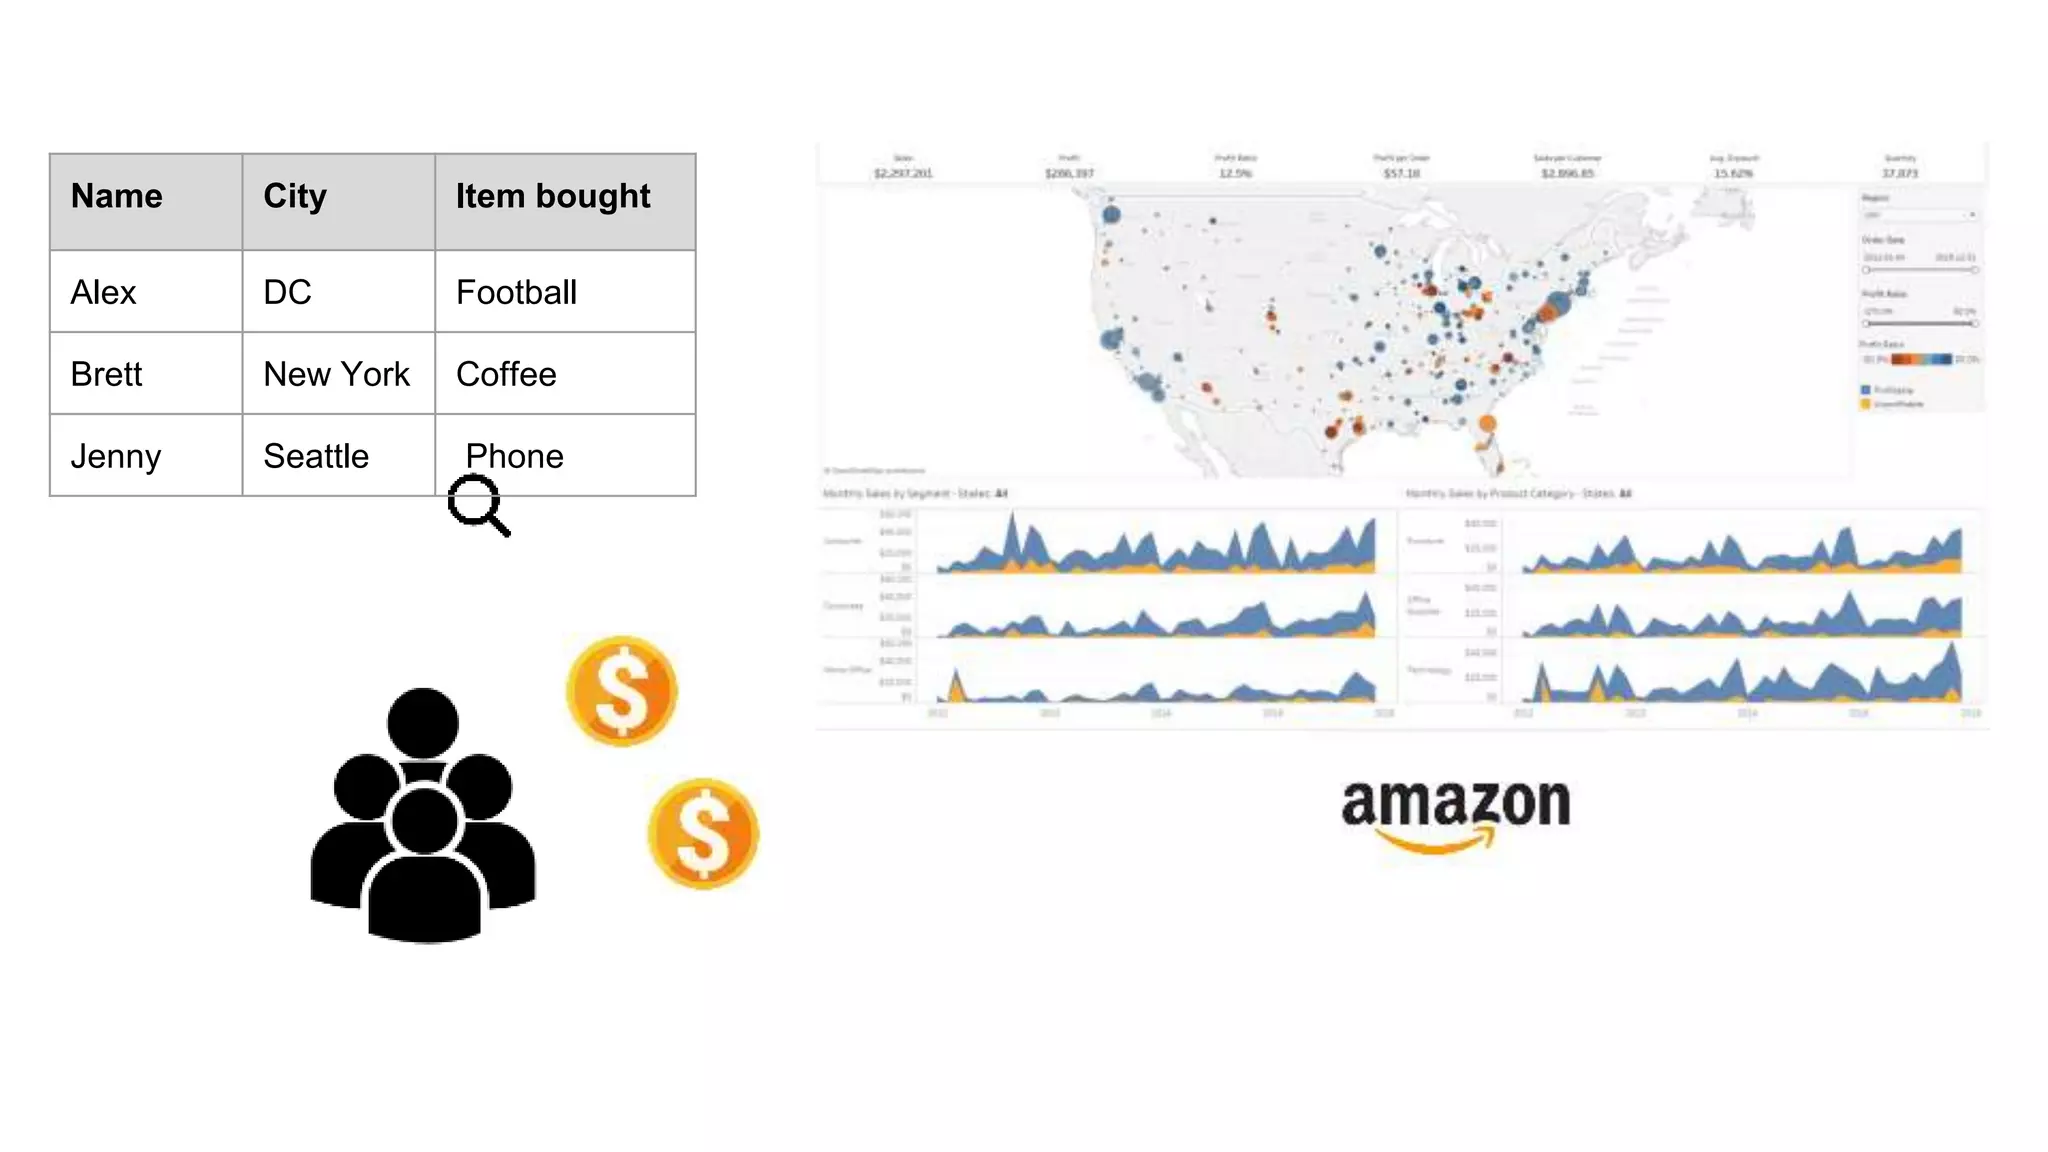
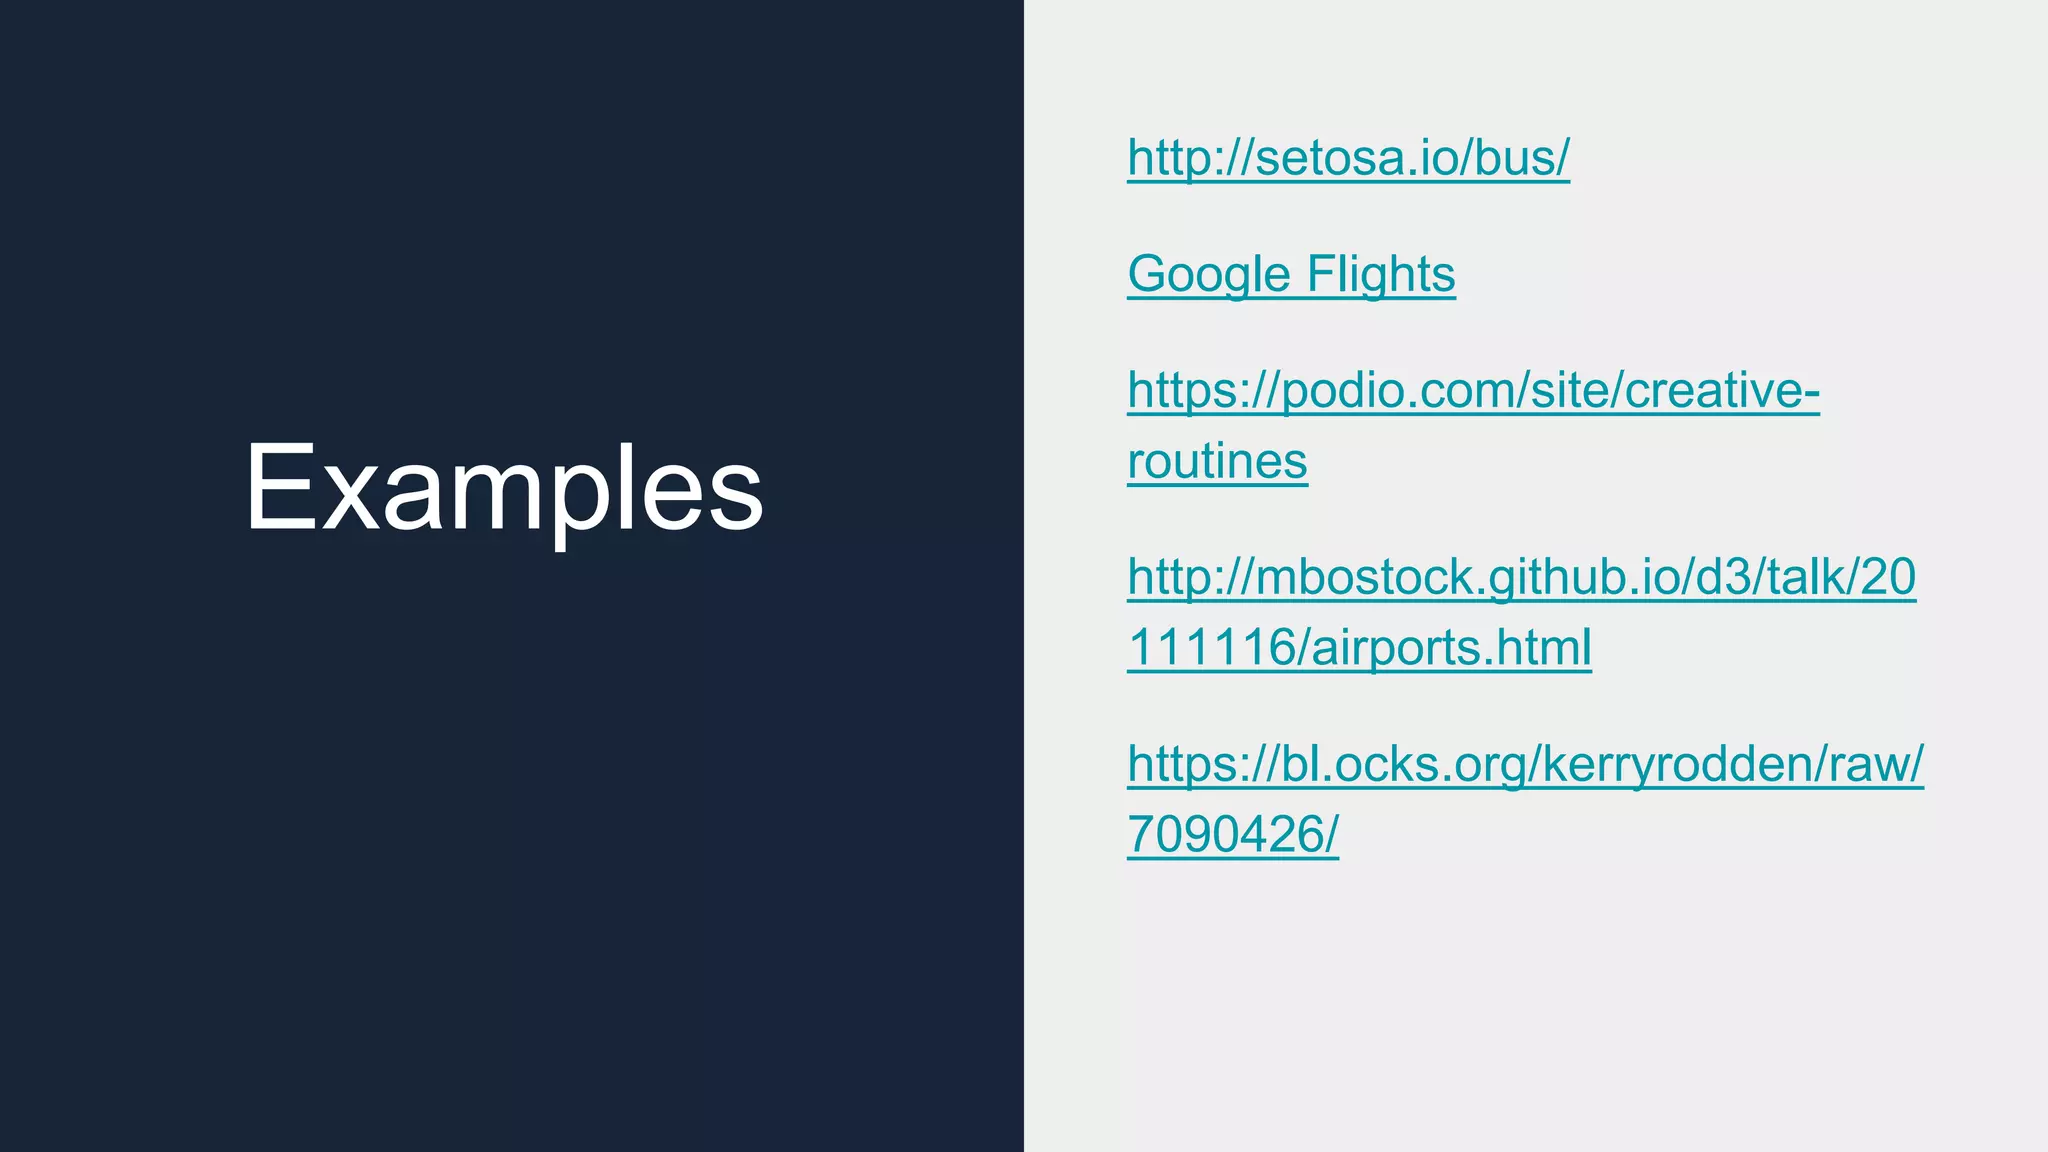
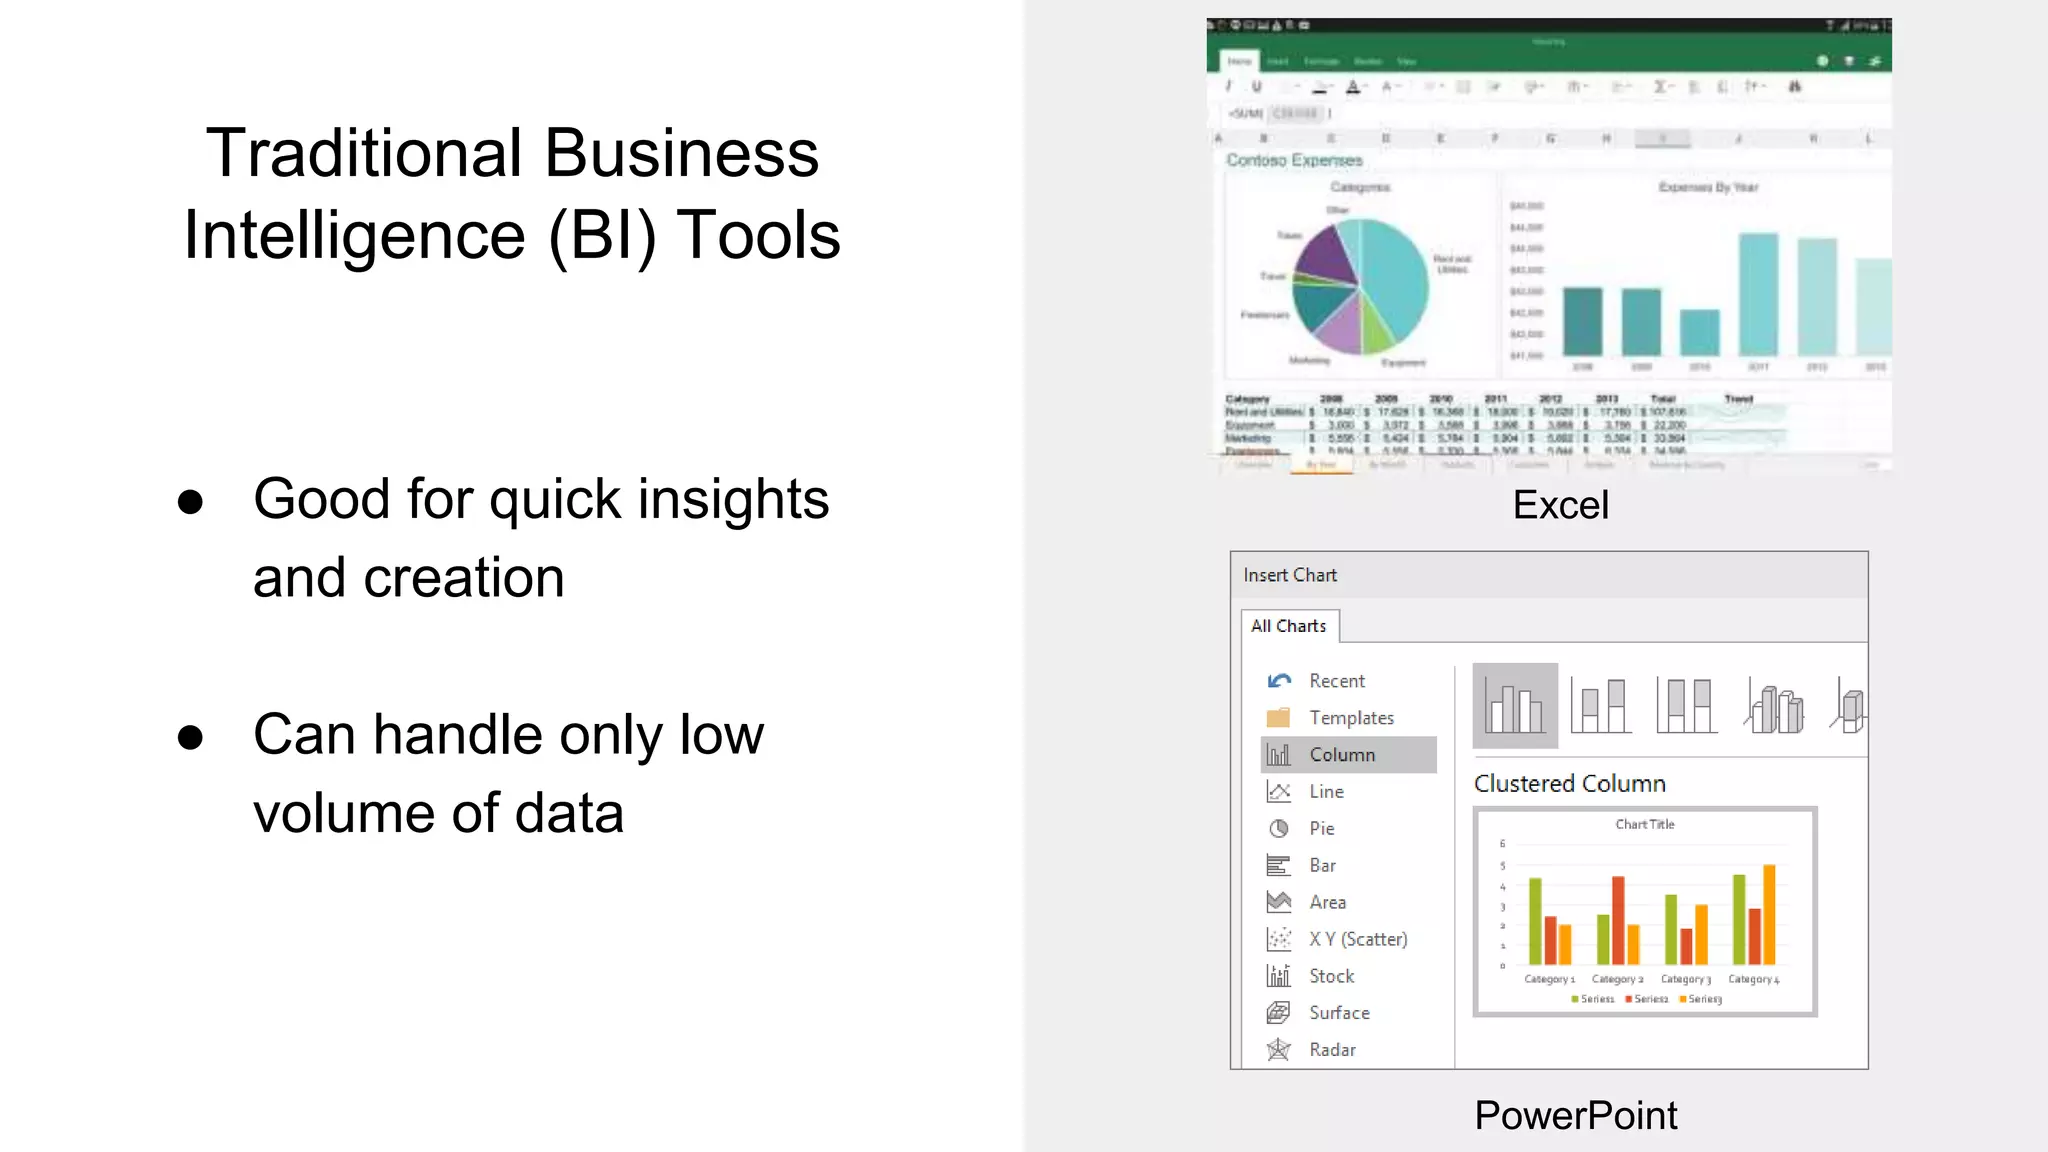
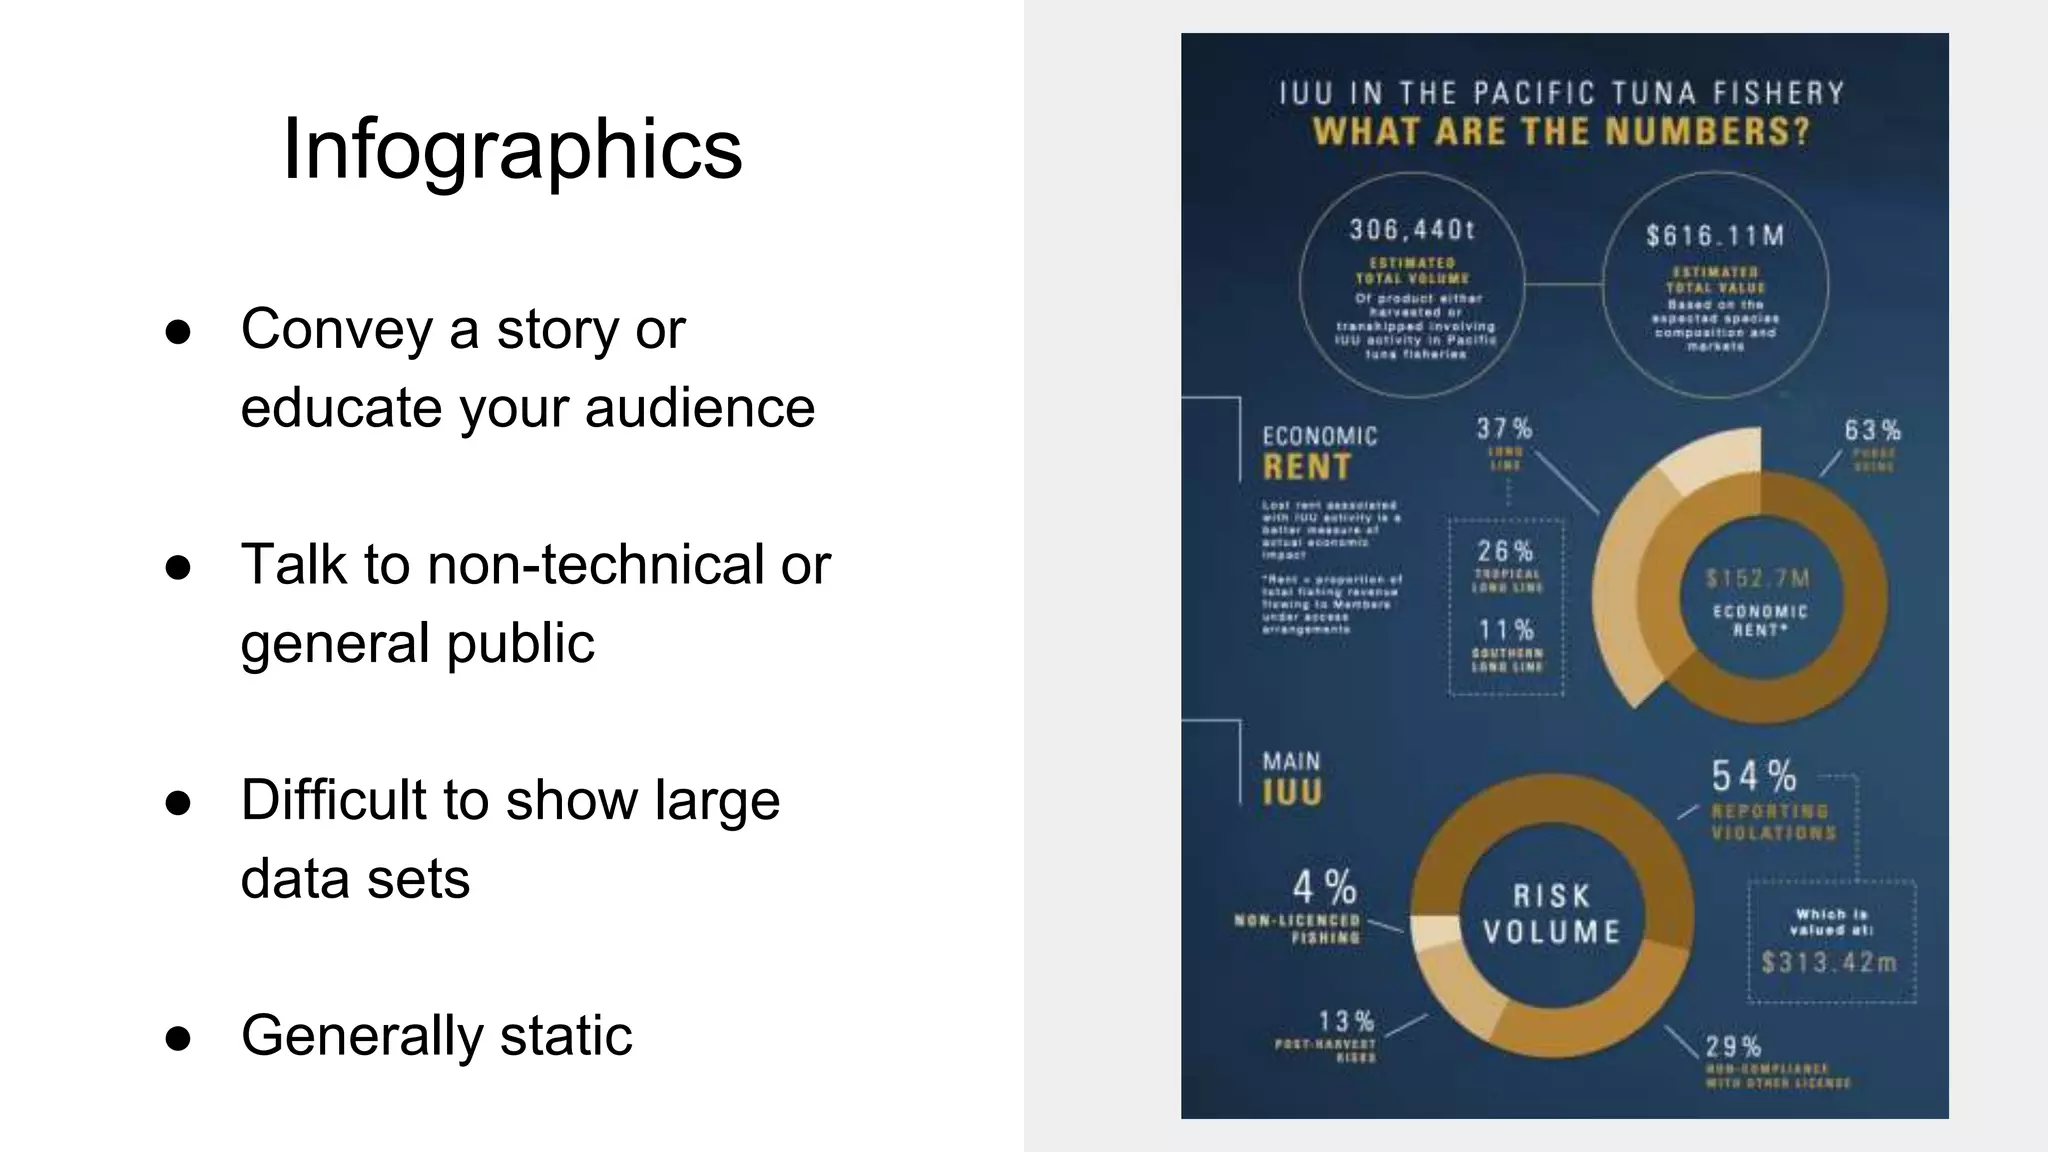
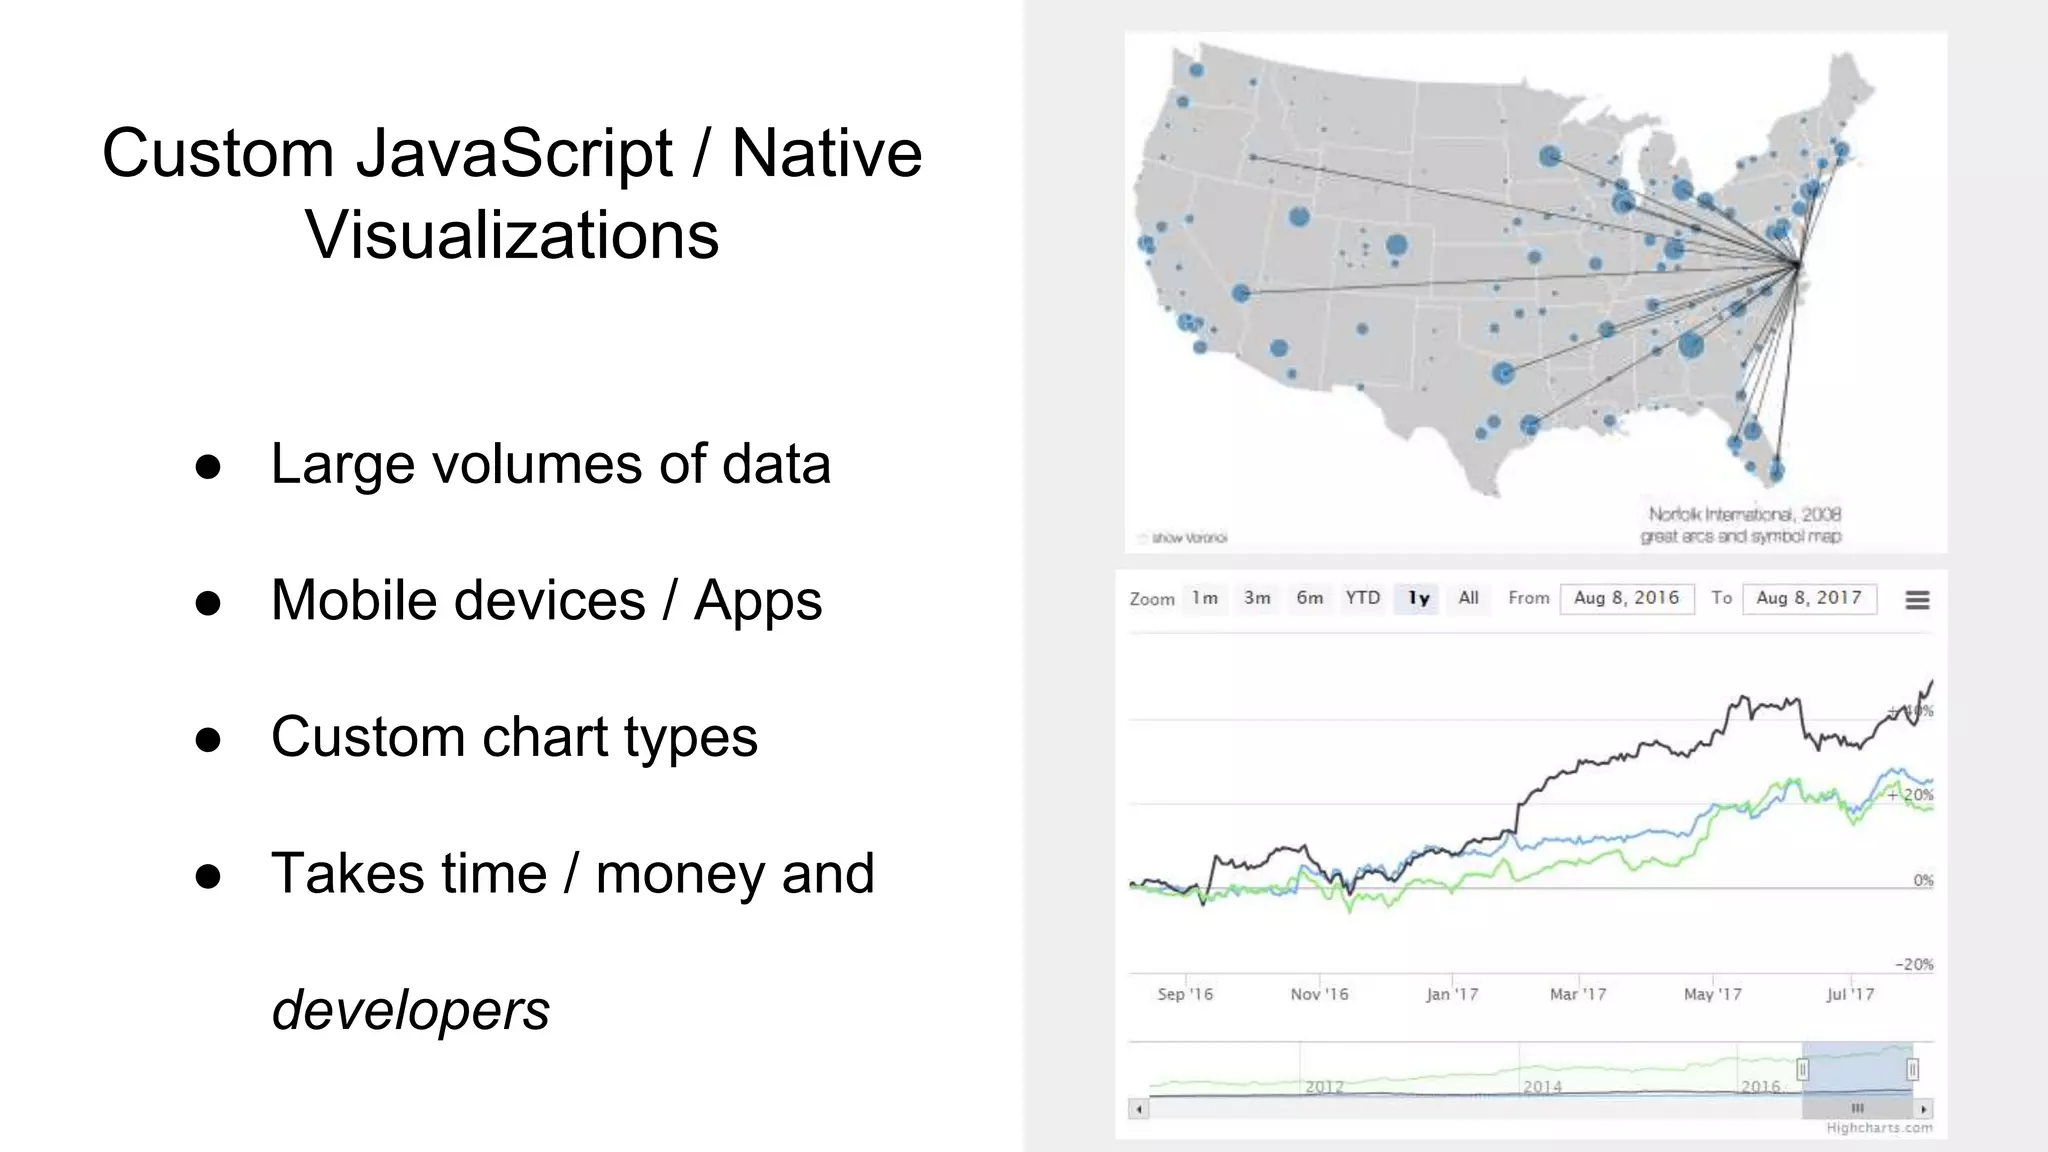
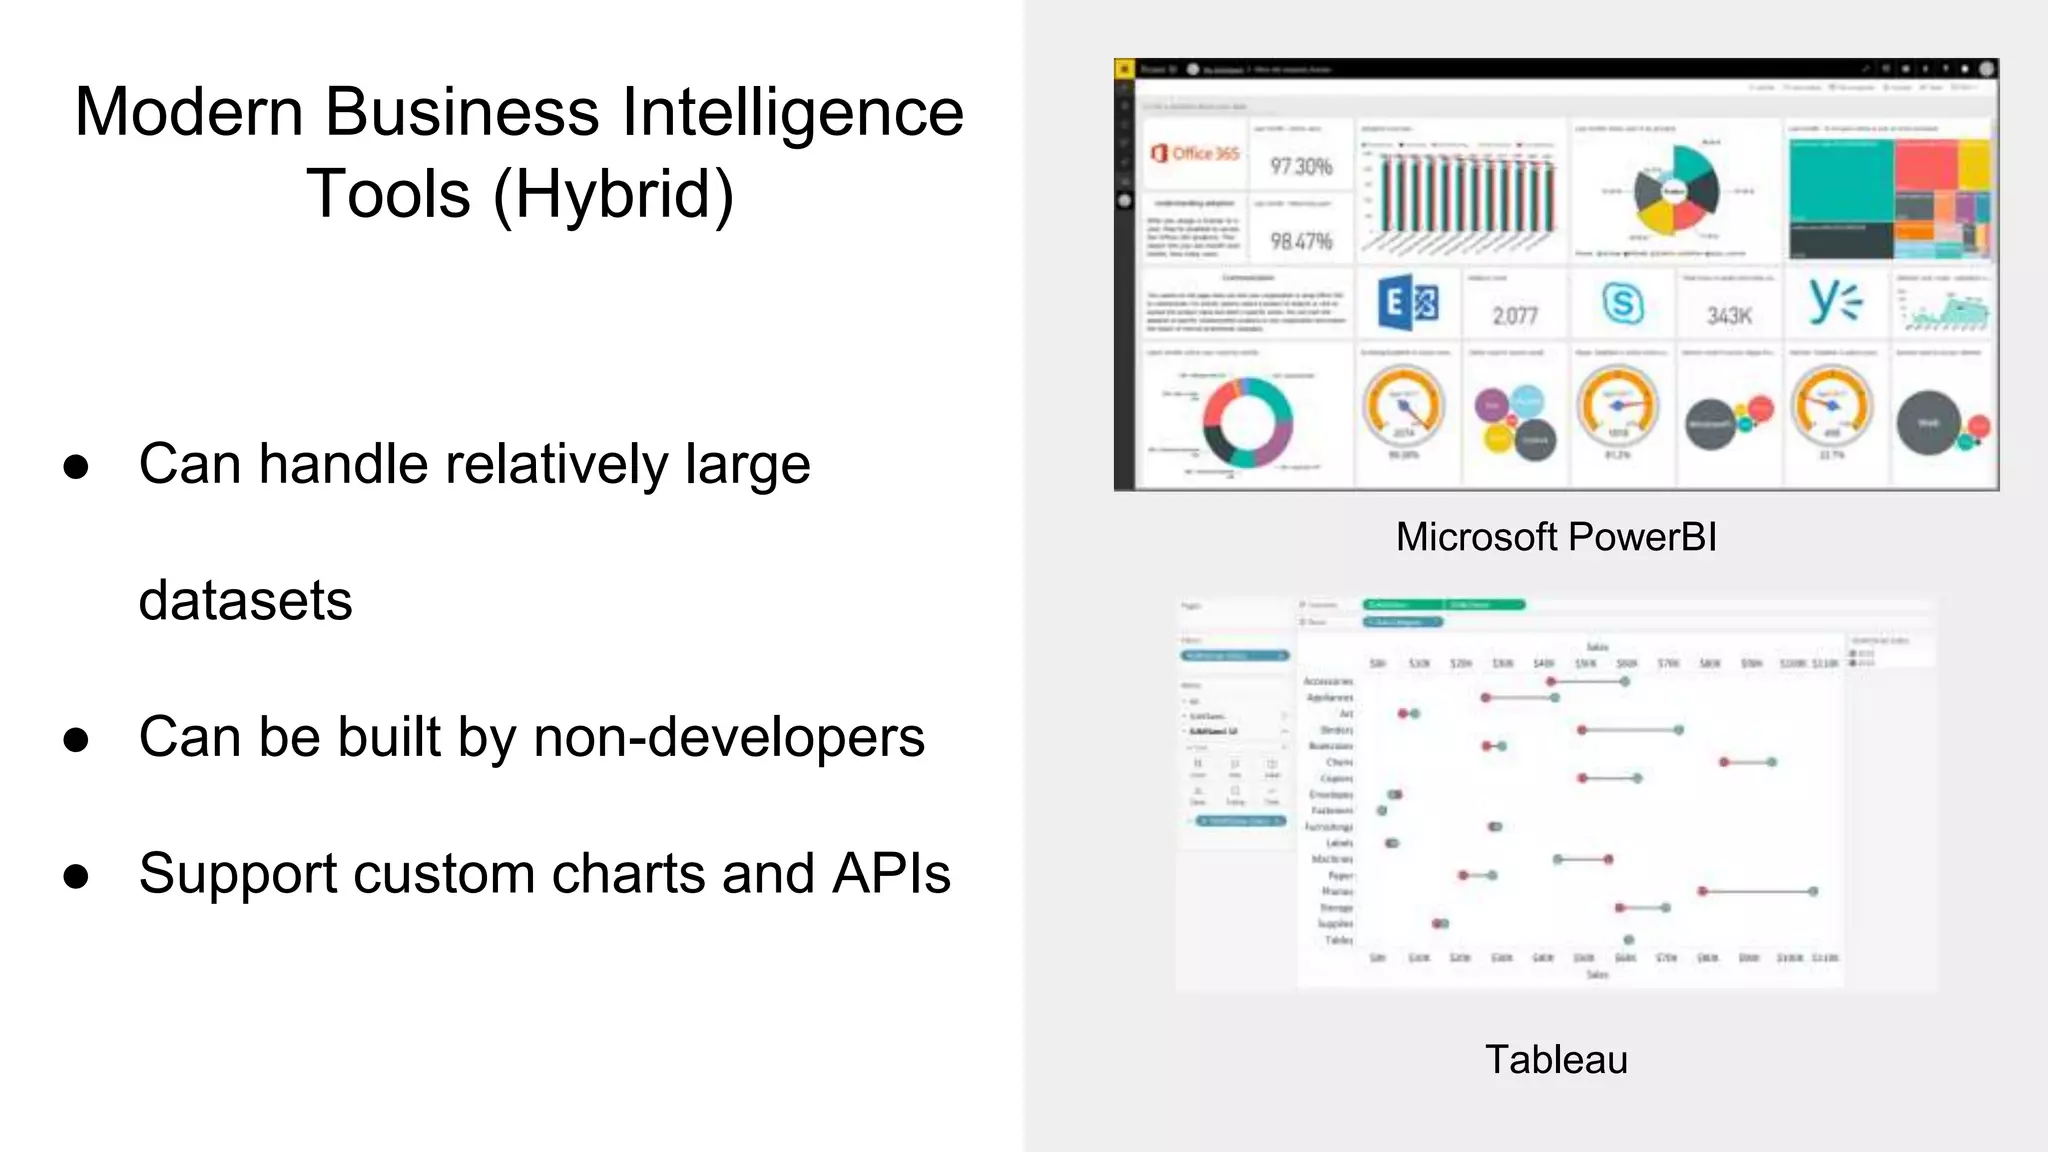
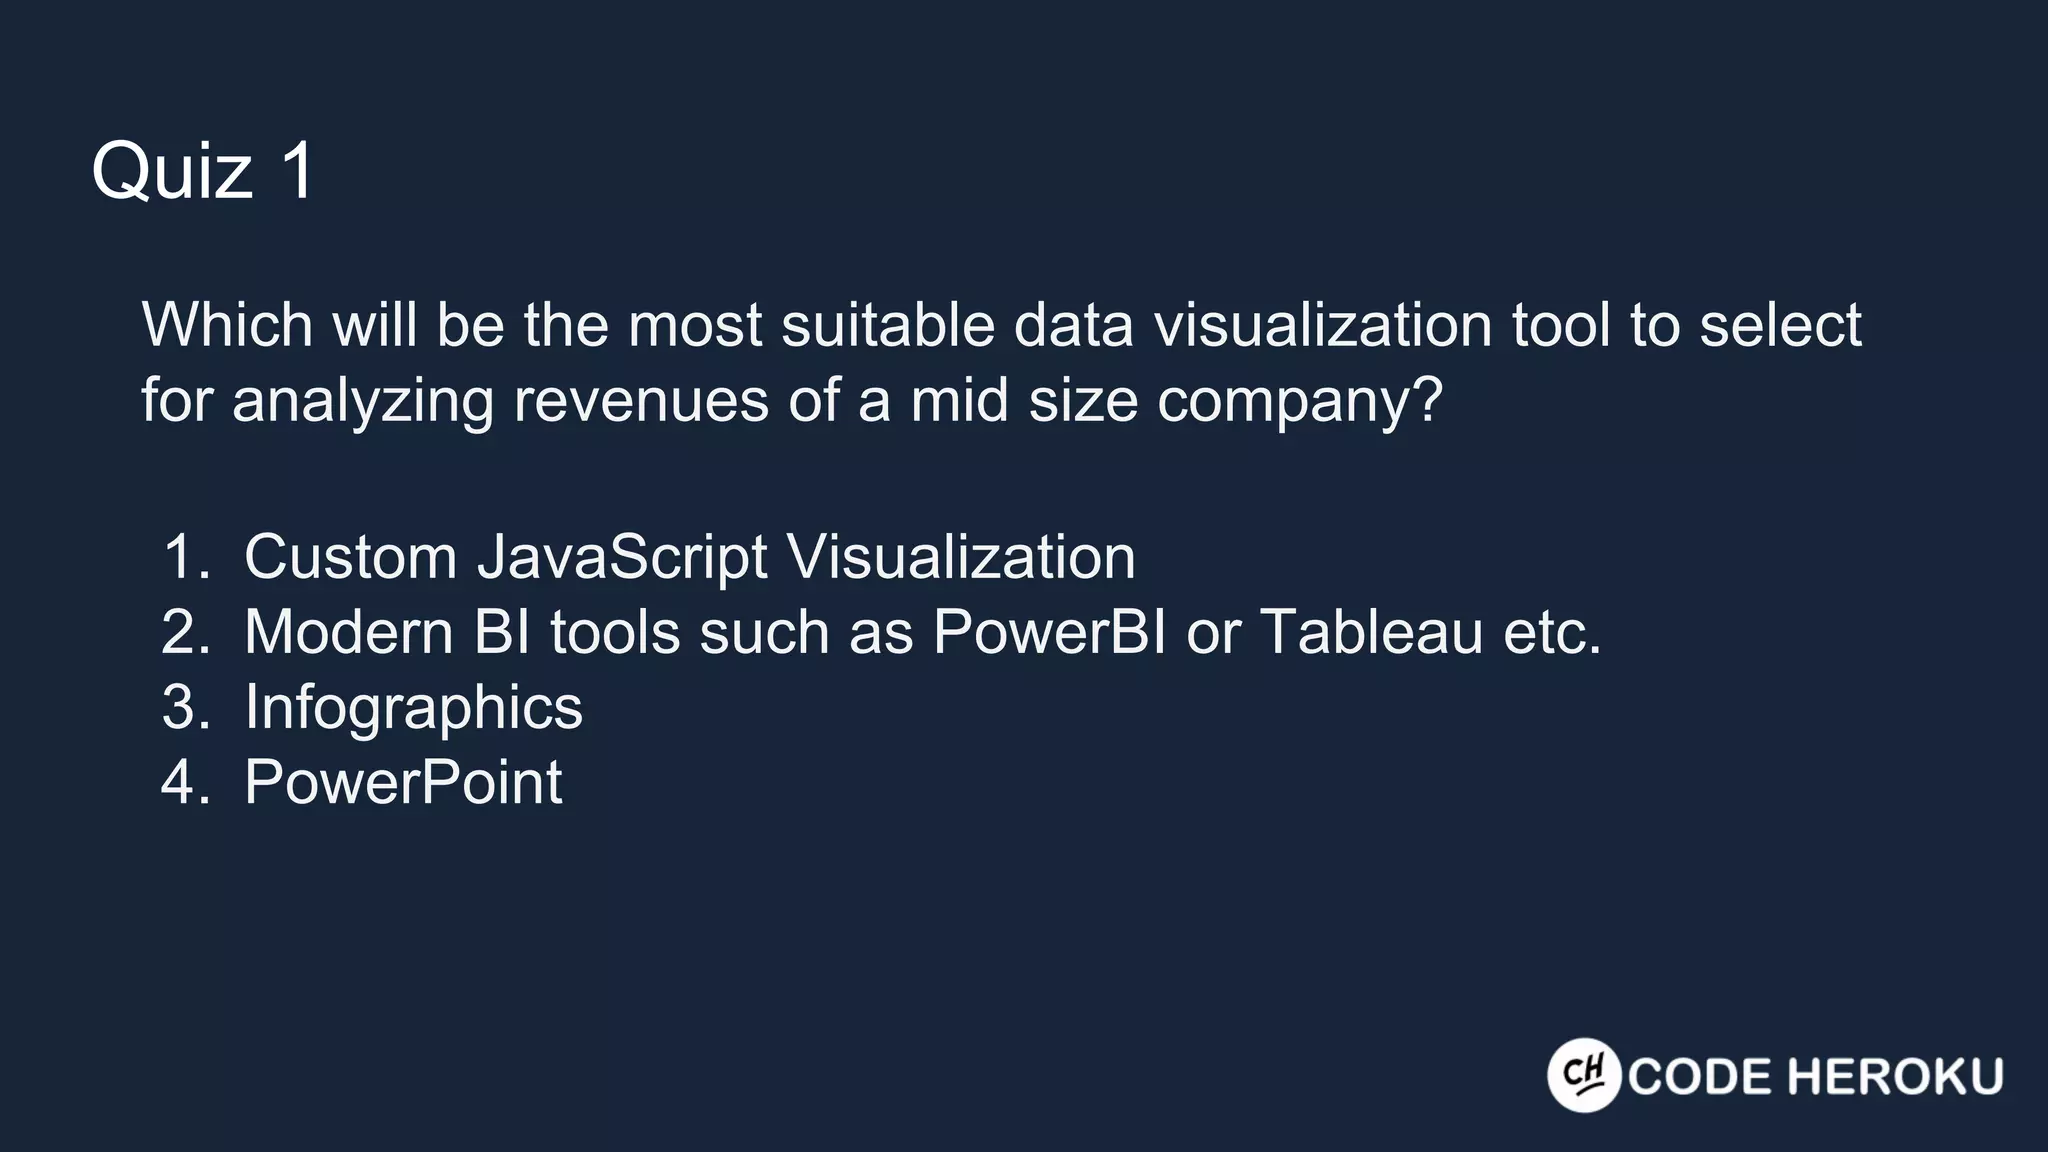
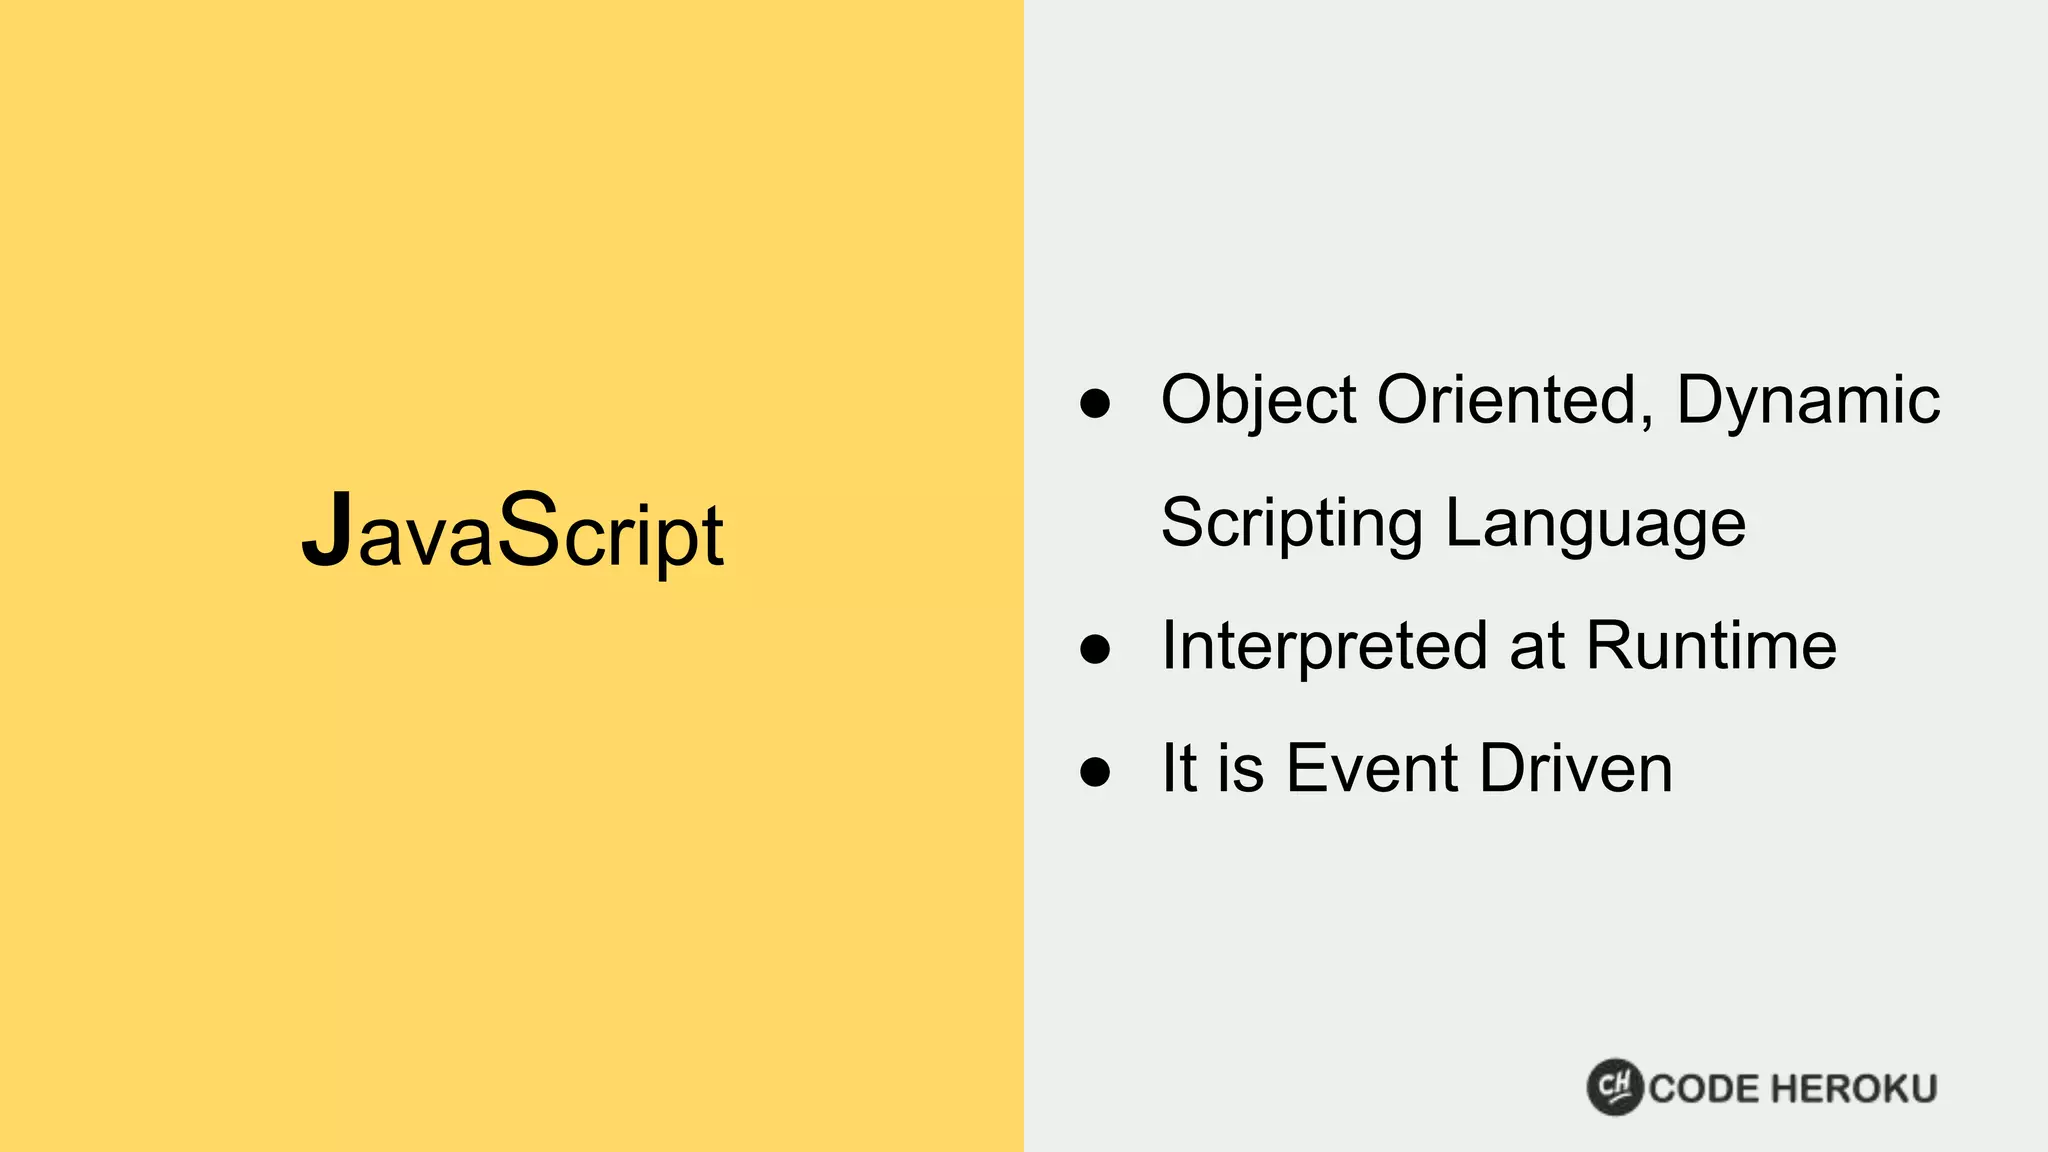
This document provides an overview of a session on data visualization using JavaScript and HighCharts. The objectives are to understand how data visualization helps make decisions and gain insights, learn basic JavaScript, and use HighCharts to build custom visualizations. Examples of visualization tools and when to use them are discussed, including Excel, PowerPoint, infographics, and custom JavaScript tools. A quiz asks which tool would be best for analyzing company revenue data. The document then provides overviews of JavaScript, jQuery, and how to build visualizations with HighCharts. It concludes by thanking participants and providing a link for feedback.